
95% of researchers rate our articles as excellent or good
Learn more about the work of our research integrity team to safeguard the quality of each article we publish.
Find out more
BRIEF RESEARCH REPORT article
Front. Oral. Health , 18 July 2022
Sec. Oral Cancers
Volume 3 - 2022 | https://doi.org/10.3389/froh.2022.912803
 Salem Boussida1,2
 Yvener François3
 Adrien Heintz1,2
 Zuzana Saidak2,4
 Stéphanie Dakpé2,5Alexandre Coutte2,6Bruno Chauffert7Bernard Devauchelle2,5
 Antoine Galmiche2,4Sylvie Testelin2,5Patrick Goudot3Jean-Marc Constans1,2*
Purpose: To noninvasively assess spectroscopic and metabolic profiles of healthy tongue tissue and in an exploratory objective in nontreated and treated patients with tongue squamous cell carcinoma (SCC).
Methods: Fourteen healthy subjects (HSs), one patient with nontreated tongue SCC (NT-SCC), and two patients with treated tongue SCC (T-SCC) underwent MRI and single-voxel proton magnetic resonance spectroscopy (1H-MRS) evaluations (3 and 1.5T). Multi-echo-times 1H-MRS was performed at the medial superior part (MSP) and the anterior inferior part (AIP) of the tongue in HS, while 1H-MRS voxel was placed at the most aggressive part of the tumor for patients with tongue SCC. 1H-MRS data analysis yielded spectroscopic metabolite ratios quantified to total creatine.
Results: In HS, compared to MSP and AIP, 1H-MRS spectra revealed higher levels of creatine, a more prominent and well-identified trimethylamine-choline (TMA-Cho) peak. However, larger prominent lipid peaks were better differentiated in the tongue MSP. Compared to HS, patients with NT-SCC exhibited very high levels of lipids and relatively higher values of TMA-Cho peak. Interestingly, patients with T-SCC showed almost nonproliferation activity. However, high lipids levels were measured, although they were relatively lower than lipids levels measured in patients with NT-SCC.
Conclusion: The present study demonstrated the potential use of in-vivo 1H-MRS to noninvasively assess spectroscopic and metabolic profiles of the healthy tongue tissue in a spatial location-dependent manner. Preliminary results revealed differences between HS and patients with tongue NT-SCC as well as tongue T-SCC, which should be confirmed with more patients. 1H-MRS could be included, in the future, in the arsenal of tools for treatment response evaluation and noninvasive monitoring of patients with tongue SCC.
Magnetic resonance spectroscopy (MRS) is a noninvasive quantitative tool that is based on a spectroscopic analysis of tissue metabolism. MRS can provide molecular analysis of biochemical composition and evaluate the presence of specific metabolites in the tissue being investigated. Proton MRS (1H-MRS), the most used MRS method in clinical practice, has mostly been applied to study brain pathologies, particularly brain tumors for diagnosis, differentiation between nonmalignant and malignant tissues, prognosis, and evaluation of treatment responses [1].
Thanks to technological advances in both the software and hardware, clinical applications of 1H-MRS have been applied to other organs, than the brain, including for diagnosis of cancer in the breast [2], prostate [3], liver [4], and, more recently, musculoskeletal system [5]. The value of 1H-MRS in skeletal muscle was clearly established [6], providing information on the metabolic properties (energy, lipids) of muscles. These parameters have the potential to be used as biomarkers to detect pathological processes and to monitor, for example, patients with head and neck (HN) cancer undergoing therapy.
Head and neck squamous cell carcinoma (SCC) is the sixth most common cancer type in the world with 890,000 new cases and 450,000 deaths in 2018. The incidence of SCC is expected to increase by 30% (being 1.08 million new cases per year) by 2030 [Global Cancer Observatory (GLOBOCAN)] and is especially frequent in the northeast France [7, 8]. SCC can occur in various sublocations of the upper aerodigestive tract, including the pharynx, larynx, sinuses, nasal cavity, and the oral cavity with the most common subsite being the oral tongue, which is also one of the worst subsites in terms of prognosis [9]. SCC could be a very aggressive cancer and has a bad prognosis if not detected early and, thus, is associated with high mortality. The development of simple and reliable biomarkers for the early detection of SCC is one of the solutions to better diagnose, treat these tumors, evaluate and monitor treatment combinations, and, hence, reduce mortality.
In this context, 1H-MRS, being a noninvasive, rapid, informative, and quantitative technique, with a demonstrated higher sensitivity compared to MRI [1], has great potential to help with early cancer detection, diagnosis, and treatment response evaluation.
Only a few previous 1H-MRS studies (both in-vivo [10, 11] and ex-vivo [12]) have been performed with a limited number of subjects. Moreover, to the best of our knowledge, no previous study has focused on the metabolic profiles of the tongue region in healthy subjects. This could be related to some difficulties specific to the HN region, as well as to the lack (in the past) of adequate methods of spectroscopic data acquisition. Indeed, performing in-vivo MRS studies on HN sites is challenging. Magnetic susceptibility artifacts arising from tissue–bone–air interfaces, as well as motion artifacts related to respiration and swallowing are the main limitations of performing in-vivo MRS studies on the HN region. However, the tongue region, one of the most common sublocations of SCC (95% of tongue tumors), is mainly constituted of muscles and is a relatively homogeneous structure in healthy subjects and could be suitable for in-vivo spectroscopic measurements.
Thus, the main objective of this study was to noninvasively assess spectroscopic and metabolic profiles of the healthy tongue tissue in two different spatial locations (the medial superior and the anterior inferior parts of the tongue) in healthy subjects. As a second exploratory objective, we challenged the potential use of 1H-MRS in differentiating normal tongue tissue from SCC before and after treatment.
Fourteen healthy subjects (HSs) were recruited from the Institut “Faire Faces” (Amiens, France). Three patients with SCC were recruited from the Oral and Maxillofacial Surgery department (Amiens University Hospital). One patient with nontreated tongue SCC (NT-SCC) (TNM stage: pT4aN0MxR0); one patient with treated tongue SCC [T-SCC; TNM stage: P16-, T4 N2b Mx, chemotherapy: carboplatin and 5-fluorouracil (5FU) delivered on 3 days, radiotherapy: a curative dose of 69.96 Gy delivered on 33 fractions for the tumor, and a prophylactic dose of 54.12 Gy delivered on 33 fractions]; and patient with T-SCC [TNM stage: T3 N0 M0, chemotherapy: cisplatin (CDDP) 100 mg/m2 delivered on 3 days, and radiotherapy: a dose of 70 Gy delivered on 35 fractions for the tumor]. The staging was based on the 8th edition of the TNM staging system of the Union for International Cancer Control (UICC). Ethical approval for this study was obtained from Clermont-Ferrand Ethical Committee (2018-A02389-46) and written informed consent was obtained from all the subjects before the study.
Patients with HS and SCC underwent MRI and proton magnetic resonance spectroscopy (1H-MRS) using, respectively, Achieva dStream 3T (Philips Healthcare, Best, Netherlands) and GE Optima MR450w 1.5T (GE Healthcare, USA) MRI scanners, using, respectively, a 32- and 24-channel head and neck coil.
Patients with HS and SCC underwent the same MRI acquisitions [three-dimensional (3D) T1-weighted spin-echo without contrast enhancement, gradient-echo T2*, T2-weighted imaging with fat saturation, and diffusion-weighted imaging (DWI)] except that patients with SCC had, in addition, a 3D T1-weighted spin-echo with contrast enhancement. 1H-MRS acquisitions consisted of a single-voxel Point RESolved Spectroscopy (PRESS) sequence with two echo times (TE = 35 and 144 ms) performed using a volume voxel of 2 cm3 × 2 cm3 × 2 cm3. 1H-MRS voxel was placed at two different locations: the medial superior part (MSP) and the anterior inferior part (AIP) of the tongue for healthy subjects (Figure 1), while it was placed at the most aggressive part of the tumor (based on the appearance of the lesions in pre- and postcontrast-enhanced 3D T1 MRI and T2-weighted imaging with fat saturation).
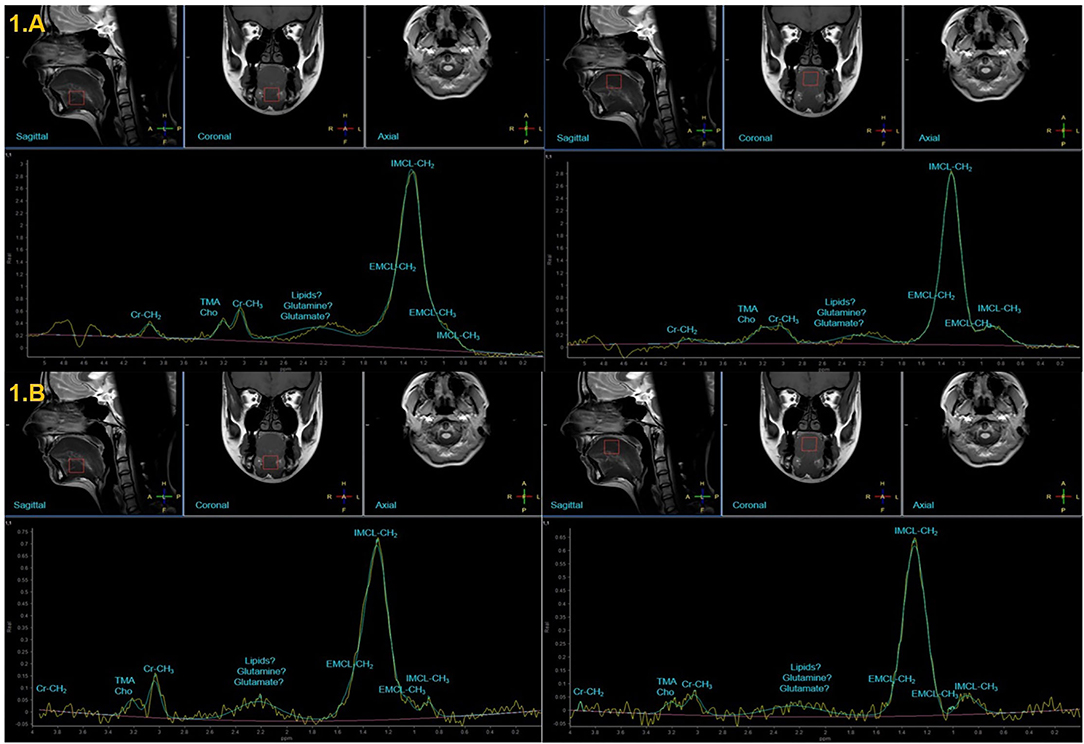
Figure 1. Representative MR images illustrating 1H-MRS voxel placement at the medial superior and the anterior inferior parts of the tongue in healthy subjects and their corresponding representative MR spectra measured at TE of 35 ms (A) and TE of 144 ms (B).
Proton magnetic resonance spectroscopy data from HS were analyzed using the MR SpectroView Analysis package from Philips Achieva dStream 3.0T TX. 1H-MRS data from patients with T-SCC and NT-SCC were analyzed on the SUN imaging workstation (Advantage Windows) using SAGE (Spectroscopic Analysis, GE). Before analysis, the quality of 1H-MRS spectra was assessed (signal-to-noise ratio, spectral resolution, and estimation of full width at half maximum on water peak). 1H-MRS spectra obtained from the AIP of the tongue were all (14) of good quality. However, only six of 14 1H-MRS spectra that were obtained from the MSP of the tongue fitted quality criteria and were included in the analysis step.
Data analysis was performed in the time domain directly on free induction decays (FIDs). Because the tongue is mainly composed of interlacing skeletal muscle and pockets of adipose tissue, the spectroscopic profile of the healthy tongue was expected to be close to the well-studied skeletal muscle spectroscopic profile [6, 13]. Hence, for metabolite quantification, we selected the most relevant resonances measurable in skeletal muscle. These resonances were specified and described by Gaussian line shapes in the frequency domain and represented as follows: intramyocellular lipid-methyl (IMCL-CH3) resonance at 0.9 ppm, extramyocellular lipid-CH3 (EMCL-CH3) resonance at 1.1 ppm, intramyocellular lipid-methylene (IMCL-CH2) resonance at 1.3 ppm, extramyocellular lipid-CH2 (EMCL-CH2) resonance at 1.45–1.5 ppm, creatine-CH3 (Cr-CH3) resonance at 3.03 ppm, Cr-CH2 resonance at 3.92 ppm, trimethylamine (TMA) and choline (Cho) resonances at 3.20–3.22 ppm, and the water resonance being centered at 4.72 ppm.
Spectroscopic metabolites were then quantified as ratios to total creatine (tCr) with tCr representing the sum of Cr-CH2 and Cr-CH3. Mean values (±SD) of metabolite ratios were calculated for HS (the MSP and the AIP parts of the tongue) and patients with NT-SCC and T-SCC.
The present study demonstrated the potential use of the 1H-MRS technique to noninvasively quantify the spectroscopic and metabolic profiles of the tongue tissue in HS. Preliminary findings from patients with NT-SCC and T-SCC are also presented.
Representative MR images illustrating 1H-MRS voxel placement at the MSP and the AIP of the tongue in HS are shown on the top of Figures 1, 2. Two corresponding representatives MR spectra obtained from the MSP and the AIP of the tongue in HS are shown at the bottom of Figures 1, 2.
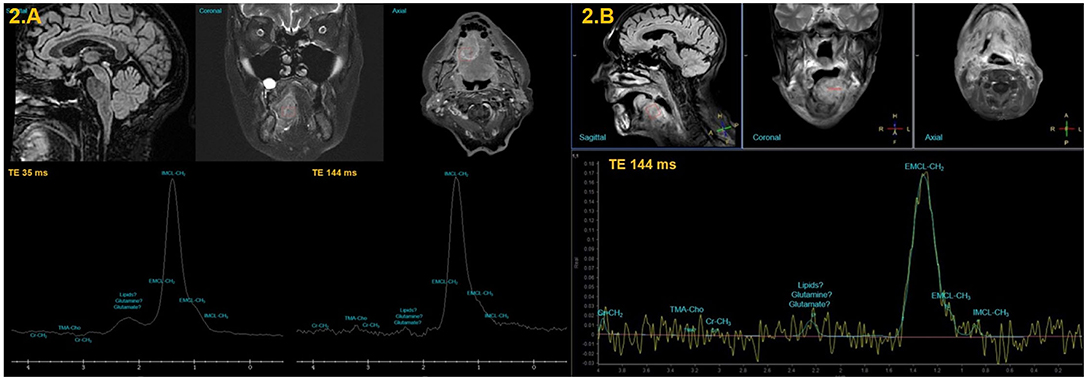
Figure 2. MR images illustrating 1H-MRS voxel placement in the nontreated tongue SCC (A) and treated tongue SCC (B) and their representative 1H-MRS spectra.
The spectrum obtained from the MSP of the tongue in HS (Figure 1A) showed a very prominent and large peak (from 1.1 to 1.5 ppm) centered at 1.3 ppm arising from protons in the methylene (CH2) groups of lipids that are attributed to IMCL-CH2. A less prominent peak, resulting from protons in the methyl (CH3) groups of lipids corresponding to IMCL-CH3, is observed at 0.9 ppm. A weak and relatively large nonassigned peak centered at 2.3 ppm is observed. Cr-CH3 peak is observed at 3.03 ppm. TMA-Cho peak is measured at 3.21 ppm and Cr-CH2 peak is measured at 3.92 ppm.
The spectrum obtained from the AIP of the tongue in HS (Figure 1A) also showed a very prominent and large peak (from 1.1 to 1.5 ppm) centered at 1.3 ppm arising from IMCL-CH2 that should attributed to IMCL-CH3 and centered at 0.9 ppm. A weak but larger (compared to the MSP of the tongue) nonassigned peak centered at 2.3 ppm is observed. A higher Cr-CH3 peak is also observed at 3.03 ppm. A more prominent and well-separated TMA-Cho peak is observed at 3.21 ppm and, finally, a higher Cr-CH2 peak is observed at 3.92 ppm.
In patient with NT-SCC, the spectrum obtained from voxel placed at the most aggressive part of the SCC of the tongue (Figure 2A) showed a very prominent peak with a larger extent (compared to HS; from 1 to 1.8 ppm) centered at 1.3 ppm arising from IMCL-CH2 with a shoulder attributed to IMCL-CH3 and centered at 0.95 ppm. A weak and relatively large nonassigned peak centered at 2.3 ppm is observed. A reduced Cr-CH3 peak is observed at 3.03 ppm. However, a higher TMA-Cho peak is measured at 3.21 ppm that is more visible at TE of 144 ms (Figure 2A) and a weaker Cr-CH2 peak is measured at 3.92 ppm.
In patients with T-SCC, spectra obtained from the MSP of the tongue (Figure 2B) showed a very prominent with smaller extent compared to patient with NT-SCC (from 1.1 to 1.5 ppm) centered at 1.3 ppm arising from IMCL-CH2. Spectra also contained a separate and less prominent peak, resulting from IMCL-CH3, observed at 0.9 ppm. A weak and relatively large nonassigned peak centered at 2.3 ppm is observed. A weaker Cr-CH3 peak is observed at 3.03 ppm. Furthermore, a very low-intensity TMA-Cho peak is measured at 3.21 ppm and Cr-CH2 peak is measured at 3.92 ppm.
The main objective of this study was to noninvasively assess spectroscopic and metabolic profiles of the tongue tissue in two different spatial locations (the MSP and the AIP of the tongue) in healthy subjects (HSs). As a second exploratory objective, we challenged the potential use of 1H-MRS in differentiating normal tongue tissue from tongue SCC before and after treatment.
The present study demonstrated the ability of the 1H-MRS technique to noninvasively quantify the spectroscopic and metabolic profiles of the tongue tissue in HS and highlighted differences in spectroscopic profiles between HS and patients with nontreated tongue SCC as well as treated tongue SCC (Figure 3).
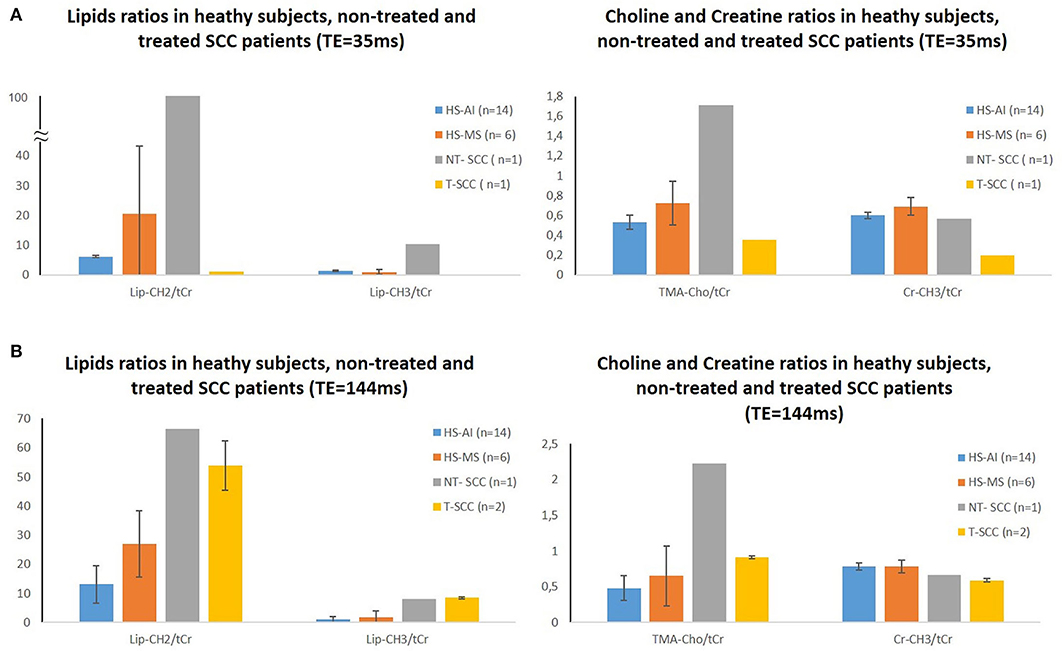
Figure 3. Lipids, choline, and creatine metabolites ratios differences between healthy subjects and patients with nontreated and treated SCC measured at TE = 35 ms (A) and TE = 144 ms (B). Note that Lip-CH2 represents IMCL-CH2 and IMCL-CH2 and Lip-CH3 represents IMCL-CH3 and IMCL-CH3. HS-AI, healthy subjects-anterior inferior part of the tongue; HS-MS, healthy subjects-medial superior part of the tongue; NT-SCC, patient with nontreated SCC; T-SCC, patient with treated SCC.
Because the type and compositions of the muscles of the MSP and AIP (genioglossus muscles) parts of the tongue are different and because SCC lesions most often arise at the borders of the tongue before affecting the body [14], one can expect metabolic differences between the MSP and the AIP parts of the tongue. For this reason, the first objective of this study was to assess in-vivo single-voxel 1H-MRS measurements, in HS, at two different locations, i.e., the MSP and the AIP of the tongue. As described in the Results section, differences were observed in HS between the spectroscopic profiles of these two locations.
One important difference concerned lipid levels (Figure 3). In previous in-vivo 1H-MRS studies of skeletal muscle [15], lipid peaks were well identified and separated with more subpeaks arising separately from EMCL and IMCL protons. In our study, it was not possible to separate IMCL and EMCL from both CH2 and CH3 in a reproducible way. This could be explained by different reasons, mainly tongue motion (especially at the MSP), magnetic susceptibility effects, and residual dipolar coupling that can affect metabolites peaks separation [13]. Moreover, differences in terms of muscle composition between the tongue and skeletal muscles, as well as muscle fiber orientations can also affect spectral resolution. This is consistent with previous studies [16] reporting that peaks of EMCL and IMCL in calf muscles are separated when fibers are orthogonally oriented to the main magnetic field (B0), while nonseparated peaks are observed when muscles are oriented parallel to B0.
Further differences between the MSP and the AIP of the tongue were also observed in levels of Cr peaks (Figure 3), an important metabolite that is often used as a reference to estimate relative spectroscopic concentrations of all other metabolites. The AIP of the tongue showed higher levels in both the Cr-CH3 (at 3.03 ppm) and Cr-CH2 (at 3.92 ppm) compared to the MSP of the tongue. Cr reflects the energy metabolism and the cellularity index of the tissue; this difference may be attributed to the higher level of muscle composition in the AIP (the genioglossus muscles) compared to the MSP (with less muscle volume) of the tongue and their different functions: the anterior inferior muscles are more implicated in motor function, while the superior muscles are rather implicated in sensitive, gustative, and food transport (providing a smooth surface for food to slide into the hypopharynx) functions in the MSP of the tongue.
Finally, we noticed a better separation between the TMA-Cho peak and the Cr-CH3 peak in the AIP compared to the MSP of the tongue. This point is very important since it offers the ability to better measure and follow-up the TMA-Cho peak (particularly the Cho/Cr ratio, a cell proliferation marker) in tumor conditions.
In summary, the spectroscopic and metabolic profiles of the AIP of the tongue seem to be closer to skeletal muscle profiles compared to the MSP of the tongue. This is likely in agreement with the higher level of muscle composition in the AIP of the tongue and its main function, i.e., motor function. The presented differences, observed in HS, are important and should be taken into account in the spectroscopic evaluation and follow-up of SCC lesions.
The second exploratory objective of this study was to challenge the potential of in-vivo 1H-MRS in differentiating healthy tongue tissue from SCC before and after treatment. The preliminary presented results suggest important differences in the spectroscopic profiles between HS and patients with NT-SCC and T-SCC. In NT-SCC (Figure 2A), the TMA-Cho/tCr ratio showed a higher value compared to HS. Although protons related to the Cho peak overlap with protons related to the TMA peak, the increase in the complex TMA-Cho is probably associated with an increase in Cho-containing metabolites peak [mainly phosphatidylcholine (PC) and glycerophosphocholine (GPC)] rather than TMA peak. Indeed, Cho (and its derivatives) is an important constituent in phospholipid metabolism of the cell membranes and is identified as a cell tumor proliferation marker. In clinical practice, Cho/Cr is the most studied ratio for the prognosis of brain tumors [17]. Elevated Cho/Cr is also in agreement with a previous in-vitro 1H-MRS study [18], which showed that Cho/Cr ratio level was significantly higher in the SCC tongue than in normal tissue or posttherapeutic tissue. Moreover, in our study, patient with NT-SCC showed a Cho/Cr ratio of 2. This ratio is relatively low compared to Cho/Cr ratio levels that we can usually measure in brain tumors, such as in glioblastomas (Cho/Cr = from 3 to 6), in meningiomas (Cho/Cr = from 3 to 10, with a concomitant decrease in Cr levels), and medulloblastomas (Cho/Cr = from 3 to 16) [1]. We hypothesize that such a difference could be related to the epidermoid type of SCC tumor itself, which may have lower mitotic activity and cell membrane turnover compared to tumors located in the conjunctive and supporting tissues such as in the glial (glioblastomas), meningeal (meningiomas), and medulloblastomas cells. Interestingly, patients with T-SCC showed almost no proliferation activity (with Cho/Cr ratio <1.5) after radiotherapy or radiochemotherapy treatments. This could be explained by either the efficiency of the treatment and/or the relatively low level of proliferation before treatment (Cho/Cr = 2) or by the intersubject treatment (chemotherapy) variability.
Another interesting finding concerned the variation of lipid levels. Broadening of IMCL-CH2 (centered at 1.3 ppm) and IMCL-CH3 (centered at 0.95 ppm) peaks combined with their increased FWHM values tend to indicate an increased amount of phospholipids. In patient with NT-SCC, this could be related to increased necrotic lipids as a result of an inadequate balance between vascularization and cell proliferation and may be responsible for metabolic stresses such as hypoxia and energy deprivation as in solid tumors [1]. However, 1H-MRS measurements in patient with NT-SCC showed a relatively low level of proliferation (Cho/Cr ratio of 2) and could not be the only explanation for such high lipid levels. Thus, more patients with SCC and further complementary measurements are needed to investigate the tumor vascularization environment using quantitative methods, such as dynamic contrast-enhanced MRI (DCE-MRI) to take benefit from its derived pharmacokinetic parameters [19].
In contrast, 1H-MRS measurements in patients with T-SCC showed a lower level of necrotic lipids compared to patients with NT-SCC (Figure 2B). This result was unexpected and is not in agreement with what we can usually measure in brain tumors, especially in glioblastomas where very high levels of necrotic lipids are usually detected [1]. We are unable to explain such results, since many variable factors could interfere (intersubject treatment variability). This emphasizes the interest of further metabolic studies with different time point measurements, particularly before and after each treatment step, in order to separate treatment effects from all other sources of variability. Further, a decrease in the level of the creatine peak was observed in patients with T-SCC compared to HS. One explanation would be an increased metabolic rate, thus increased energy and energetic reserves consumption of creatine and phosphocreatine. This phenomenon is known to be particularly observed under treatments or in tumors that are with high proliferation rate [1].
Another finding in the present study was the probable presence of NMR visible polyamines and/or amino acid resonances [between Cr-CH3 (3.03) and TMA-Cho (3.21 ppm)] peaks in NT-SCC. The amino acid-derived polyamines have long been associated with cell growth and cancer and specific oncogenes and tumor suppressor genes regulate polyamine metabolism. Upregulation of polyamine has been found to increase cell proliferation, decrease apoptosis, and promote tumor invasion and metastasis [20]. Such resonances, indicating changes in polyamines that are usually observed in prostate cancer [21], need to be better studied and may be used to help to monitor treatment responses in patients with SCC.
Finally, we noticed in all the 1H-MRS spectra (HS, NT-SCC, and T-SCC subjects), the presence of nonassigned resonances between 2 and 2.4 ppm that could be attributed to either lipid or glutamine-glutamate resonances [22] increase. Further studies using 2-dimensional total correlated proton nuclear magnetic resonance spectroscopy (TOCSY) could be of great interest. TOCSY is a technique that was demonstrated to be able to identify and quantify a wide range of metabolites such as amino acids, peptides, triglycerides, and phospholipids precursors [23]. Moreover, high-resolution magic angle spinning (HRMAS) NMR spectroscopy techniques [24] on tongue SCC tumor biopsies may also bring more insights into these resonance changes, especially for glutamine metabolite, that are usually related to malignancy or tumor evolution.
The present study has some limitations: (1) Because of the differences in both the muscle content and muscle fibers orientation and motion artifacts (respiration and swallowing), in-vivo 1H-MRS spectra obtained from the tongue MSP were not of sufficiently high quality and only six (out of 14) HS were retained and used for metabolites ratios quantifications in the tongue MSP, while all the fourteen 1H-MRS spectra obtained from the tongue AIP were included; (2) SCC tumors (especially T-SCC) showed higher tissue heterogeneity, compared to healthy tongue tissue, reducing, consequently, the quality of 1H-MRS spectra; and (3) Although the present study was mainly focused on studying healthy tongue tissue, the small number of patients with SCC was a major limitation. We only recruited three patients with tongue SCC to preliminary investigate the potential use of 1H-MRS in differentiating normal tongue tissue from SCC before and after treatment. The small SCC patients' sample did not allow any generalization, but we hope that our preliminary results could serve as a starting point for future studies with larger samples and screening patients with SCC before and after each treatment step to validate the present results. Combining 1H-MRS data with other relevant imaging tracers demonstrated in studies dealing with brain tumors, such as 11C-methionine [25] and 3′-deoxy-3′-(18)F-fluorothymidine ((18)F-FLT) [26] (cell proliferation metabolism), and [F-18] Fluoromisonidazole (tumor hypoxia) [27] using PET imaging, will be of a high added value.
Despite these limitations, the present study opens up new perspectives in the study of SCC lesions. 1H-MRS studies could be compared and/or coupled to quantitative imaging techniques, such as [F18]-fluoro-2-deoxy-D-glucose-PET (18F-FDG-PET). Together, 1H-MRS and 18F-FDG-PET have a very high sensitivity compared to MRI and X-ray CT [28] and may be very helpful in determining the extension, depth of invasion of the tumor, and prognosis evaluation in patients with oral SCC [29].
Furthermore, in line with the objective of the present study, in-vivo 1H-MRS metabolic signatures could be coupled to in-vitro 1H-MRS analysis studies of accessible biofluids such as serum and saliva. Previous metabolomics studies revealed the existence of metabolic signatures in such biofluids with several tumor-specific metabolites that could discriminate oral cancer from healthy controls or even precancerous lesions [30]. In this objective, serum, an easily accessible biofluid from a blood sample, could be concomitantly analyzed (without preparation [30]) with 1H-MRS acquisitions. Previous blood samples from oral cancer patients were analyzed and exhibited altered metabolic profiles occurring at an early stage of cancer [31], characterized mainly by an altered energy metabolism with the presence of ketone bodies, the suppression of tricarboxylic acid cycle, and abnormal amino acid catabolism. Another previous study [32] on esophageal SCC revealed that plasma phospholipid metabolism plays a critical role in oncogenesis; this result is in agreement with our in-vivo results as depicted by a significant increase of lipids in patients with tongue SCC.
Moreover, in a previous NMR spectroscopy study [33], specific variations in the salivary metabolomic profile were identified and revealed that fucose, glycine, methanol, and proline were highly discriminant between patients with HN cancer and control subjects. Further, metabolomics studies revealed high sensitivity to saliva metabolic changes [34] and to DNA methylation alterations (that are detectable in saliva) of patients with oral squamous cell carcinoma (OSCC) [35–37], suggesting that salivary biomarkers are valuable for OSCC early diagnosis and OSCC stratification. Altogether, these elements emphasize the importance of conducting further metabolomics studies with concomitant in-vivo and ex-vivo biofluids (serum and/or saliva) 1H-MRS analyses.
The present study demonstrated the potential use of the in-vivo 1H-MRS technique to noninvasively assess the spectroscopic and metabolic profiles of the tongue tissue, in a spatial location-dependent manner, in healthy subjects. Relevant differences, observed in healthy subjects, were presented and should be taken into account in the spectroscopic and metabolic evaluations of SCC lesions. Preliminary results revealed differences between healthy subjects and nontreated as well as treated patients with tongue SCC, which should be confirmed with a higher number of patients. These preliminary findings highlight the potential of 1H-MRS to be, in the future, included in the existing arsenal of tools of diagnosis, treatment response evaluation, estimation of the potential of tumor recurrence and patient survival, and, thus, could improve the surgical management of patients with tongue SCC.
The raw data supporting the conclusions of this article will be made available by the authors, without undue reservation.
Ethical approval for this study was obtained from Clermont-Ferrand Ethical Committee. The patients/participants provided their written informed consent to participate in this study.
Conceived and designed the study: SB, J-MC, PG, BD, AC, BC, AG, ST, SD, and ZS. Performed the acquisitions: J-MC. Analyzed the data: SB, J-MC, and AH. Recruitment and management of patients: J-MC, PG, BD, AC, BC, ST, SD, and YF. Wrote the paper: SB and J-MC. All authors contributed to the article and approved the submitted version.
The present work was financially supported by the Gueules Cassées Foundation (https://www.gueules-cassees.asso.fr) and the Stomatology and Maxillo-Facial Surgery Service of the Pitié-Salpêtrière hospital.
The authors declare that the research was conducted in the absence of any commercial or financial relationships that could be construed as a potential conflict of interest.
All claims expressed in this article are solely those of the authors and do not necessarily represent those of their affiliated organizations, or those of the publisher, the editors and the reviewers. Any product that may be evaluated in this article, or claim that may be made by its manufacturer, is not guaranteed or endorsed by the publisher.
We thank the Gueules Cassées Foundation (https://www.gueules-cassees.asso.fr) for their financial support to the present study. We thank the EquipEx FIGURES (Facing Faces Institute Guilding Research; https://www.u-picardie.fr/equipex-figures-481382.kjsp) and the Institute Faire Faces (Amiens, France) for assistance in participants' recruitment and for offering us the opportunity to use a research-dedicated MRI scanner.
1. Heintz A, Constans J-M. “Role of magnetic resonance spectroscopy in clinical management of brain tumors,” in Atlas of Clinical Cases on Brain Tumor Imaging, eds Özsunar, Y. Şenol, U. (Cham: Springer). (2020). doi: 10.1007/978-3-030-23273-3_5
2. Fardanesh R, Marino MA, Avendano D, Leithner D, Pinker K, Thakur S, et al. Proton MR spectroscopy in the breast: technical innovations and clinical applications. J Magn Reson Imaging. (2019) 50:1033–46. doi: 10.1002/jmri.26700
3. Bellomo G, Marcocci F, Bianchini D, Mezzenga E, D'Errico V, Menghi E, et al. MR Spectroscopy in prostate cancer: new algorithms to optimize metabolite quantification. PLoS ONE. (2016) 11:e0165730. doi: 10.1371/journal.pone.0165730
4. Qayyum A. MR spectroscopy of the liver: principles and clinical applications. RadioGraphics. (2009) 29:1653–64. doi: 10.1148/rg.296095520
5. Deshmukh S, Subhawong T, Carrino JA, Fayad L. Role of MR spectroscopy in musculoskeletal imaging. Indian J Radiol Imaging. (2014) 24:210–6. doi: 10.4103/0971-3026.137024
6. Boesch C, Kreis R. “Muscle studies by 1H MRS,” in eMagRes eds R. K. Harris and R. L. Wasylishen (2007), p. 1097–108. doi: 10.1002/9780470034590.emrstm1431
7. Ferlay J, Colombet M, Soerjomataram I, Mathers C, Parkin DM, Piñeros M, et al. Estimating the global cancer incidence and mortality in 2018: GLOBOCAN sources and methods. Int J Cancer. (2019) 144:1941–53. doi: 10.1002/ijc.31937
8. Bray F, Ferlay J, Soerjomataram I, Siegel RL, Torre LA, Jemal A, et al. Global cancer statistics 2018: GLOBOCAN estimates of incidence and mortality worldwide for 36 cancers in 185 countries. CA Cancer J Clin. (2018) 68:394–424. doi: 10.3322/caac.21492
9. Ng JH, Iyer NG, Tan MH, Edgren G. Changing epidemiology of oral squamous cell carcinoma of the tongue: a global study. Head Neck. (2017) 39:297–304. doi: 10.1002/hed.24589
10. Mukherji SK, Schiro S, Castillo M, Kwock L, Muller KE, Blackstock W, et al. Proton MR spectroscopy of squamous cell carcinoma of the extracranial head and neck: in vitro and in vivo studies. AJNR Am J Neuroradiol. (1997) 18:1057–72.
11. Fahmy DM, El-Hawarey G, El-Serougy L, El-Ashry MS. Hydrogen MR spectroscopy of neck masses. Egypt J Radiol Nucl Med. (2012) 43:421–27. doi: 10.1016/j.ejrnm.2012.04.006
12. El-Sayed S, Bezabeh T, Odlum O, Patel R, Ahing S, MacDonald K, et al. An ex vivo study exploring the diagnostic potential of 1H magnetic resonance spectroscopy in squamous cell carcinoma of the head and neck region. Head Neck. (2002) 24:766–72. doi: 10.1002/hed.10125
13. Boesch C, Kreis R. Dipolar coupling and ordering effects observed in magnetic resonance spectra of skeletal muscle. NMR Biomed. (2001) 14:140–8. doi: 10.1002/nbm.684
14. Okubo M, Iwai T, Nakashima H, Koizumi T, Oguri S, Hirota M, et al. Squamous cell carcinoma of the tongue dorsum: incidence and treatment considerations. Indian J Otolaryngol Head Neck Surg. (2017) 69:6–10. doi: 10.1007/s12070-016-0979-z
15. Pola A, Sadananthan SA, Yaligar J, Nagarajan V, Han W, Kuchel PW, et al. Skeletal muscle lipid metabolism studied by advanced magnetic resonance spectroscopy. Prog Nucl Magn Reson Spectrosc. (2012) 65:66–76. doi: 10.1016/j.pnmrs.2012.02.002
16. Boesch C, Machann J, Vermathen P, Schick F. Role of proton MR for the study of muscle lipid metabolism. NMR Biomed. (2006) 19:968–88. doi: 10.1002/nbm.1096
17. Howe FA, Opstad KS. 1H MR spectroscopy of brain tumours and masses. NMR Biomed. (2003) 16:123–31. doi: 10.1002/nbm.822
18. Bezabeh T, Odlum O, Nason R, Kerr P, Sutherland D, Patel R, et al. Prediction of treatment response in head and neck cancer by magnetic resonance spectroscopy. AJNR Am J Neuroradiol. (2005) 26:2108–13.
19. Guo N, Zeng W, Deng H, Hu H, Cheng Z, Yang Z, et al. Quantitative dynamic contrast-enhanced MR imaging can be used to predict the pathologic stages of oral tongue squamous cell carcinoma. BMC Med Imaging. (2020) 20:117. doi: 10.1186/s12880-020-00516-w
20. Gerner W, Meyskens FL. Polyamines and cancer: old molecules, new understanding. Nat Rev Cancer. (2004) 4:781–92. doi: 10.1038/nrc1454
21. Schipper RG, Romijn JC, Cuijpers VM, Verhofstad AA. Polyamines and prostatic cancer. Biochem Soc Trans. (2003) 31:375–80. doi: 10.1042/bst0310375
22. Ye X, Yu JC, Feng F, He GZ, Fan YP, Hu L, et al. [Noninvasive quantification of glutamine and glutamate in skeletal muscles of perioperative rabbits with proton magnetic resonance spectroscopy]. Zhongguo Yi Xue Ke Xue Yuan Xue Bao. (2008) 30:201–7.
23. Sivaraja M, Turner C, Souza K, Singer S. Ex vivo two-dimensional proton nuclear magnetic resonance spectroscopy of smooth muscle tumors: advantages of total correlated spectroscopy over homonuclear J-correlated spectroscopy. Cancer Res. (1994) 54:6037–40.
24. Srivastava S, Roy R, Gupta V, Tiwari AK, Srivastava AN, Sonkar AA, et al. Proton HR-MAS MR spectroscopy of oral squamous cell carcinoma tissues: an ex vivo study to identify malignancy induced metabolic fingerprints. Metabolomics. (2010) 7:278–88. doi: 10.1007/s11306-010-0253-4
25. Chesnay E, Babin J, Constans M, Agostini D, Bequignon A, Regeasse A, et al. Early response to chemotherapy in hypopharyngeal cancer: assessment with 11C-methionine PET, correlation with morphologic response, and clinical outcome. J Nucl Med. (2003) 44:526–32.
26. Berro DH, Collet S, Constans JM, Barré L, Derlon JM, Emery E, et al. Comparison between MRI-derived ADC maps and (18)FLT-PET in pre-operative glioblastoma. J Neuroradiol. (2019) 46:359–66. doi: 10.1016/j.neurad.2019.05.011
27. Collet S, Guillamo JS, Berro DH, Chakhoyan A, Constans JM, Lechapt-Zalcman E, et al. Simultaneous mapping of vasculature, hypoxia, and proliferation using dynamic susceptibility contrast MRI, (18)F-FMISO PET, and (18)F-FLT PET in relation to contrast enhancement in newly diagnosed glioblastoma. J Nucl Med. (2021) 62:1349–56. doi: 10.2967/jnumed.120.249524
28. Pentenero M, Cistaro A, Brusa M, Ferraris MM, Pezzuto C, Carnino R, et al. Accuracy of 18F-FDG-PET/CT for staging of oral squamous cell carcinoma. Head Neck. (2008) 30:1488–96. doi: 10.1002/hed.20906
29. Lin N-C, Su IH, Hsu J-T, Tsai K-Y, Chen MYC. FDG-PET predicts bone invasion and prognosis in patients with oral squamous cell carcinoma. Sci Rep. (2021) 11:15153. doi: 10.1038/s41598-021-94567-w
30. Gupta S, Gupta A, Mahdi A. H NMR-derived serum metabolomics of leukoplakia and squamous cell carcinoma. Clin Chim Acta. (2015) 441:47–55. doi: 10.1016/j.cca.2014.12.003
31. Tiziani S, Lopes V, Günther UL. Early stage diagnosis of oral cancer using 1H NMR-based metabolomics. Neoplasia. (2009) 11:269–269. doi: 10.1593/neo.81396
32. Liu R, Peng Y, Li X, Wang Y, Pan E, Guo W, et al. Identification of plasma metabolomic profiling for diagnosis of esophageal squamous-cell carcinoma using an UPLC/TOF/MS platform. Int J Mol Sci. (2013) 14:8899–911. doi: 10.3390/ijms14058899
33. Mikkonen JJW, Singh SP, Akhi R, Salo T, Lappalainen R, González-Arriagada WA, et al. Potential role of nuclear magnetic resonance spectroscopy to identify salivary metabolite alterations in patients with head and neck cancer. Oncol Lett. (2018) 16:6795–800. doi: 10.3892/ol.2018.9419
34. Wang Q, Gao P, Wang X, Duan Y. Investigation and identification of potential biomarkers in human saliva for the early diagnosis of oral squamous cell carcinoma Clin ca Chim Acta. (2014) 427:79–85. doi: 10.1016/j.cca.2013.10.004
35. Sorroche BP, Talukdar FR. DNA methylation markers from negative surgical margins can predict recurrence of oral squamous cell carcinoma. Cancers. (2021) 13. doi: 10.3390/cancers13122915
36. Saidak Z, Lailler C, Testelin S, Chauffert B, Clatot F, Galmiche A, et al. Contribution of genomics to the surgical management and study of oral cancer. Ann Surg Oncol. (2021) 28:5842–54. doi: 10.1245/s10434-021-09904-0
Keywords: tongue tissue, squamous cell carcinoma, proton magnetic resonance spectroscopy, 1H-MRS, spectroscopic and metabolic profile, noninvasive biomarkers
Citation: Boussida S, François Y, Heintz A, Saidak Z, Dakpé S, Coutte A, Chauffert B, Devauchelle B, Galmiche A, Testelin S, Goudot P and Constans J-M (2022) Evaluation of Proton MR Spectroscopy for the Study of the Tongue Tissue in Healthy Subjects and Patients With Tongue Squamous Cell Carcinoma: Preliminary Findings. Front. Oral. Health 3:912803. doi: 10.3389/froh.2022.912803
Received: 04 April 2022; Accepted: 20 June 2022;
Published: 18 July 2022.
Edited by:
Henry Ademola Adeola, University of Cape Town, South AfricaReviewed by:
Marina G. Diniz, Federal University of Minas Gerais, BrazilCopyright © 2022 Boussida, François, Heintz, Saidak, Dakpé, Coutte, Chauffert, Devauchelle, Galmiche, Testelin, Goudot and Constans. This is an open-access article distributed under the terms of the Creative Commons Attribution License (CC BY). The use, distribution or reproduction in other forums is permitted, provided the original author(s) and the copyright owner(s) are credited and that the original publication in this journal is cited, in accordance with accepted academic practice. No use, distribution or reproduction is permitted which does not comply with these terms.
*Correspondence: Jean-Marc Constans, Y29uc3RhbnMuamVhbi1tYXJjQGNodS1hbWllbnMuZnI=
Disclaimer: All claims expressed in this article are solely those of the authors and do not necessarily represent those of their affiliated organizations, or those of the publisher, the editors and the reviewers. Any product that may be evaluated in this article or claim that may be made by its manufacturer is not guaranteed or endorsed by the publisher.
Research integrity at Frontiers
Learn more about the work of our research integrity team to safeguard the quality of each article we publish.