 Samuel Rosset *
 Iain A. Anderson
 - Biomimetics Laboratory, Auckland Bioengineering Institute, University of Auckland, Auckland, New Zealand
Dielectric elastomer generators are soft structures capable of converting mechanical energy into electrical energy. Here, we develop a theoretical model of the triangular harvesting cycle that enables the harvesting of most of the available electrical energy while not requiring active monitoring of the charge-voltage state on the DEG. This cycle is therefore interesting for small-scale generators for which a monitoring circuit would be energetically too costly. Our model enables the identification of the optimal value of the circuit’s parameters such as storage capacitor and priming voltage values and show that for capacitance swings up to 6, 94% of the available electrical energy can be harvested. The model is experimentally validated with a conical generator, and the effect of non-constant deformation amplitudes is examined. Energy densities up to 46 mJcm−3 were obtained for an electric field of 50 V µm−1.
Introduction
Dielectric elastomer transducers (DETs) consist of an elastomeric dielectric film sandwiched between a pair of compliant electrodes, thus forming a rubbery deformable capacitor. They can be used as actuators for soft machines, as sensors, or as generators (Pelrine et al., 2000; Anderson et al., 2012; Rosset and Shea, 2016; Moretti et al., 2020b). In generator mode, they transform mechanical energy into electrical energy. Their stretchability makes them particularly well-suited to harvest energy from large-amplitude, low frequency sources of mechanical energy. Dielectric elastomer generators (DEGs) have been proposed to harvest energy from ocean waves (Kornbluh et al., 2011; Jean et al., 2012; Moretti et al., 2020a), from human body motion (Kornbluh et al., 2011; Savage, 2012; Vu-Cong et al., 2013), or from the swaying motion of tree branches (Anderson et al., 2011). The low density and compliance of DEGs enable to make devices that can harvest energy unobtrusively and silently from the motion of limbs, such as the knee (Jean-Mistral et al., 2008), and the collected energy can be used to power sensors for physiological monitoring or for the gps tracking of large predators. Harvesting energy from tree branch motion could enable the deployment of wireless sensor networks for forest health or fire monitoring.
One key question remains to evaluate the feasibility of these applications: how much energy can realistically be harvested by DEGs, especially for miniaturised devices comprised of only a few grams of active material? Koh et al. have investigated the theoretical limits of DEGs, by considering their different failure modes (mechanical rupture of the elastomer, electrical breakdown of the elastomer, electromechanical instability and loss of tension). They showed that an energy density of more than 1 J g−1 could be harvested per cycle (1.7 J g−1 when the acrylic elastomer VHB from 3M is used as dielectric, and 1.3 J g−1 for natural rubber) (Koh et al., 2011). Assuming a low harvesting frequency of 1 Hz (e.g. walking frequency), the theoretical harvestable power density is in the order of 1 Wg−1. Experimentally, Shian et al. have obtained an energy density of 0.76 J g−1 (Shian et al., 2014), which is not too far from the absolute maximum predicted by Koh’s model. However, these values are obtained by pushing DEGs to their limits in a laboratory setting. In order to provide a useful lifetime, any practical application would have to stay well away from the failure modes that otherwise limit the feasible space of DEGs. They are thus expected to harvest only a fraction of the energy density values mentioned previously.
Designing DEGs for long-term operation has implications on both mechanical and electrical parameters. The cyclic mechanical deformation needs to be chosen far from the rupture limit of the elastomer for two reasons: 1) to avoid fatigue of the dielectric membrane (Bruch et al., 2020), and 2) to avoid degradation of the compliant electrodes (Rosset et al., 2017; de Saint-Aubin et al., 2018). In addition, the electric field in the structure must be limited to a value well below the dielectric breakdown limit of the material to ensure long-term operation, as parameters such as humidity can influence the breakdown field (Fasolt et al., 2019; Albuquerque and Shea, 2020). As described in more detail in “The energy harvesting cycle” section, combining these two effects leads to a harvestable energy density of the order of 0.1 J g−1 for a DEG using silicone elastomer as dielectric, i.e. about ten times lower than the maximum energy density that would be available by pushing the DEG to its limit. Furthermore, while large kW-range DEGs can invest some of their energy output to monitor their deformation and ensure that the electronic harvesting circuit is operating at its optimal point, miniaturised DEGs usually rely on simple electronic harvesting circuits operating without feedback. These circuits are tuned for a precise amplitude of deformation. However, except in a lab testing environment, a natural source of mechanical energy for the deformation of a DEG such as walking is stochastic and will see its amplitude change over time. In this contribution, we investigate the ideal electronic circuit topology to harvest energy from a miniaturised DEG and optimise its parameters to maximise the energy harvested from a source of mechanical energy with varying amplitude and frequency.
The Energy Harvesting Cycle
The working principle of a DEG has been detailed in the literature [e.g. Moretti et al. (2020b)], and is illustrated in the charge-voltage (Q-V) plane in Figure 1. Briefly, an uncharged DEG with a capacitance C1 in its relaxed state is mechanically deformed until it reaches its maximal capacitance of
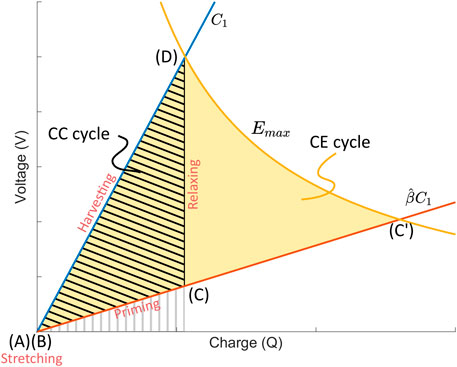
FIGURE 1. Constant charge (CC) and Constant field (CE) harvesting cycle in the Q-V plane of a DEG which is stretched from a capacitance C1 to
We define a maximum electric field Emax that must never be exceeded at any point of the cycle. It is chosen low enough to prevent dielectric breakdown of the elastomer membrane even for long-term operation and ensure that electromechanical instabilities do not occur during the cycle. It is typically set between 70 and 80% of the breakdown field of the material, and therefore represents a nominated maximal field that we never want to exceed. The yellow line in Figure 1 describes the points at which the electric field in the DEG is equal to the critical nominated value Emax (c.f. Supplementary Material for a derivation of the equation of this line). Points on the left of the curve are at a lower electric field than Emax, and points on the right are at a higher electric field, and define a region of the Q-V plane that the harvesting cycle must not enter. It can be seen that the constant charge (CC) cycle shown in Figure 1 has been designed to reach Emax a point (D), and therefore represents the optimal CC cycle achievable for the chosen values of Emax and
Figure 1 also shows that if we prime the DEG to a higher voltage until the maximal field is reached (point C′), and then keep the field constant at a value Emax during the relaxation, the energy gain per cycle, given by the yellow area, would be considerably higher than the constant charge case. This is the constant electric field (CE) cycle, whose energy density per cycle is given by Moretti et al. (2020b):
A shoe-heel stacked DEG (Savage, 2012; McKay et al., 2015) would exhibit a capacitance swing of
In 2014, Shian et al. introduced a triangular cycle based on a simple electronic circuit (Figure 2A) that enables to cover a larger area of the feasible region (Shian et al., 2014). The idea consists in placing a storage capacitor of value Cs in parallel with the DEG and separated by a diode. One switch (S1) controls the charging, while a second switch (S2) enables to discharge the generator (here through the load RL, but in practice into a step-down circuit). A discharged DEG is stretched to
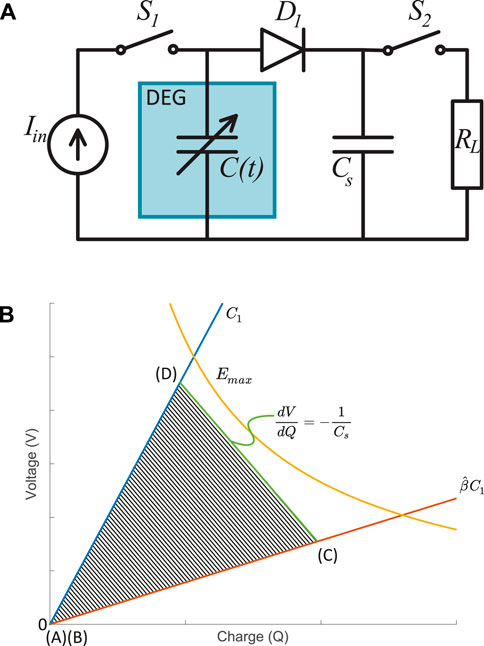
FIGURE 2. Triangular harvesting cycle. (A) The electronic circuit around the DEG consists of a power supply, 2 switches, a diode, and a storage capacitor Cs. The Resistance RL represents a load or a harvesting circuit to which the charges are transferred at the end of each cycle through the switch S2. (B) Triangular cycle in the Q-V plane. The slope of the segment (C)-(D) is controlled by the value of the storage capacitor.
In this contribution, we investigate the optimal charging voltage and storage capacitor required to maximise the generated energy per cycle of the triangular harvesting cycle. We analyse the impact of a non-constant deformation amplitude on the harvesting performance. Because the CE cycle represents the maximal amount of energy that can be harvested given our requirements (keeping the electric field below Emax and for the chosen value of capacitance swing), we will use it as a reference metric against which to normalise the output of other cycles.
The Triangular Cycle
The Optimal Case
We consider a DEG which is periodically stretched with a capacitance swing
We define the optimal triangle (OT) cycle as follows (Figure 3): we impose the slope of the relaxation process as that of the line that connect the intersection of the maximal field line with the isocapacitance line C1 (point 1) to the intersection of the maximal field line with the isocapacitance line
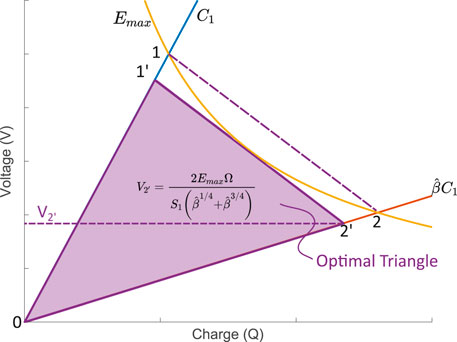
FIGURE 3. The optimal (OT) cycle is defined using a line linking the intersection of the maximal field line with the C1 isocapacitance line (point 1), and with the
To ensure that the electric field within the DEG remains below the maximal value Emax during the complete harvesting cycle, segment 1−2 is translated until it becomes tangent with the maximal field line, thus forming segment 1′−2’. The charge and voltage state of the DEG at points 1′ and 2′ are derived in the Supplementary Material and summarised in Table 1. The value of V2’ defines the priming voltage required to optimise the cycle. Therefore the two key parameters to optimise the triangle cycle is the choice of the storage capacitor, given by Eq. (2), as well as the voltage at which the switch S1 must be opened to stop the charging process, given by:
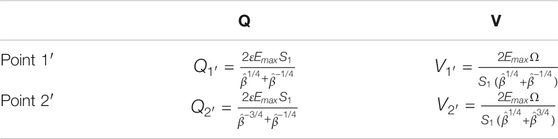
TABLE 1. Expression of the charge and voltage of the DEG capacitor at point 1′ and at point 2’.
The energy generated per cycle, equal to the area of the purple triangle on Figure 3, can be calculated as the energy extracted from the generator at the end of the cycle, minus the energy injected in the generator during priming. The energy required to prime the generator (and the storage capacitor that is connected in parallel) is equal to:
where we have replaced the value of the storage capacitor by it is optimal value (Eq. (2)). After relaxation, when switch S2 is closed, the energy stored in the DEG and the storage capacitor is harvested, and the amount of collected energy is:
The values of the voltage at points 1′ and 2′ are given in Table 1. The net energy gain per cycle is obtained by subtracting Eq. 4 from Eq. 5. Dividing by the volume of the elastomer Ω leads to the net energy density produced per cycle for an optimal triangle (OT) cycle.
This value can be normalised by the the dielectric permittivity of the elastomer and the square of the maximum field imposed to the system to have a metric that only depends on the capacitance swing.
The normalised energy density as a function of the peak capacitance swing is shown in Figure 4 and compared to the constant field (CE) cycle given by Eq. (1). For the range of capacitance swing depicted in the figure, the optimal triangle cycle leads to very close performance to that of the constant field cycle. Harvested energy densities are more than 93.8% of that of the CE cycle. The absolute value of harvested energy density depends on the material permittivity and the square of the maximal field Emax. Values of
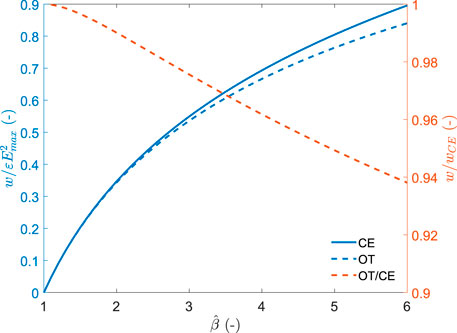
FIGURE 4. normalised energy density harvested per cycle for the optimal triangle (OT) and constant electric field (CE) cycles as a function of the capacitance swing (blue). Relative performance of the OT cycle with respect to the CE cycle (red).
Non-optimal Storage Capacitor
Even when the amplitude of the DEG deformation is well known, generating an OT cycle is made difficult by the need for a precise value of capacitor Cs. The voltage on a DEG can easily reach up to 5 kV or more, and the storage capacitor must be able to sustain the same voltage. High-voltage capacitors only exist in limited capacitance values and are expensive. Finding the exact value to match the capacitance swing according to Eq. (2) can be difficult. Therefore, we compute the normalised harvested energy density for different values of the storage capacitance to evaluate the impact of using a non-ideal value of the storage capacitor. We assume that the peak capacitance swing
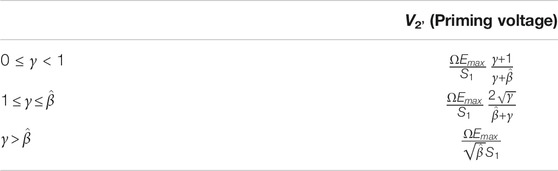
TABLE 2. Optimal priming voltage as a function of the capacitance swing
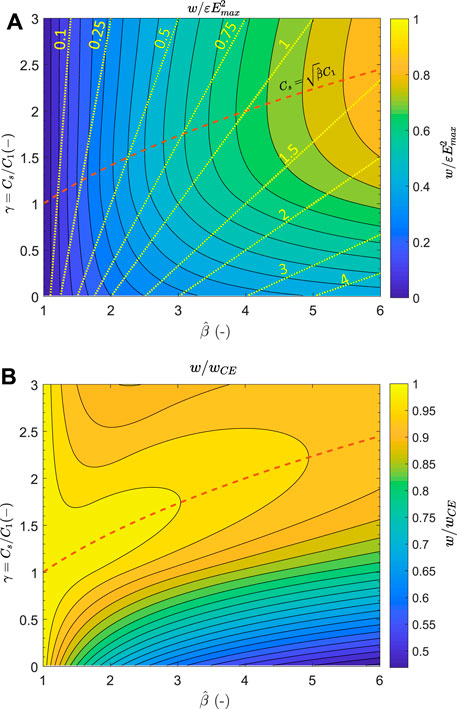
FIGURE 5. Normalised harvested energy density (A) and harvested energy density relative to the constant electrical field cycle (B) as a function of the capacitance swing and value of the storage capacitor. The red dashed line represents the optimal value of Cs, and the yellow lines represent the ratio of the harvested energy with respect to the priming energy.
Figure 5A shows the normalised harvested energy density, and Figure 5B shows the harvested energy density relative to that of a constant electric field (CE) cycle. For a fixed value of
The amount of harvested energy is shown not to be very sensitive to the value of the storage capacitor because the deviation of the capacitance value compared to the optimum can be partially compensated by adapting the charging voltage. This means that a harvesting circuit with a storage capacitor not exactly tailored to the capacitance swing of the generator is still capable of harvesting a large part of the available energy. However, the priming voltage V2’ must be adjusted accordingly using the equations of Table 2. These equations depend on both γ and
Varying Deformation Amplitude
For most environmental energy sources deforming a DEG, the capacitance swing
The two fundamental resulting questions are: Given a distribution of capacitance swing, for which particular value of
Set-And-Forget Harvesting Strategy
Fixing the parameters of the harvesting circuit (namely the value of the storage capacitor Cs, and the priming voltage V2’) does not require measuring the effective deformation with external sensors or a self-sensing scheme (Rizzello et al., 2018). It can be argued that the harvesting circuit described in Figure 2 requires active measurement of the deformation for proper operation of the switches S1 and S2. However, if the priming source is limited to an output voltage V2’, switch S1 can be replaced by a passive diode. Switch S2, which controls the transfer of the charges to the step-down converter, can be replaced by a break over switch (Lo, 2015), thus making it possible to implement this simple harvesting circuit without the need for active measurement of the deformation of the generator. This is particularly interesting for small-scale harvesting systems designed to harvest milliwatts of power.
With this approach, we set a deformation set point
Figure 6A illustrates the normalised energy density generated per cycle for the set-and-forget approach. The red and yellow curves show the output energy density as a function of the capacitance swing of the device for two arbitrary values of the functioning set point at which the harvesting circuit (value of storage capacitor Cs and priming voltage V2’) is tuned. The red curve is for a circuit optimised at
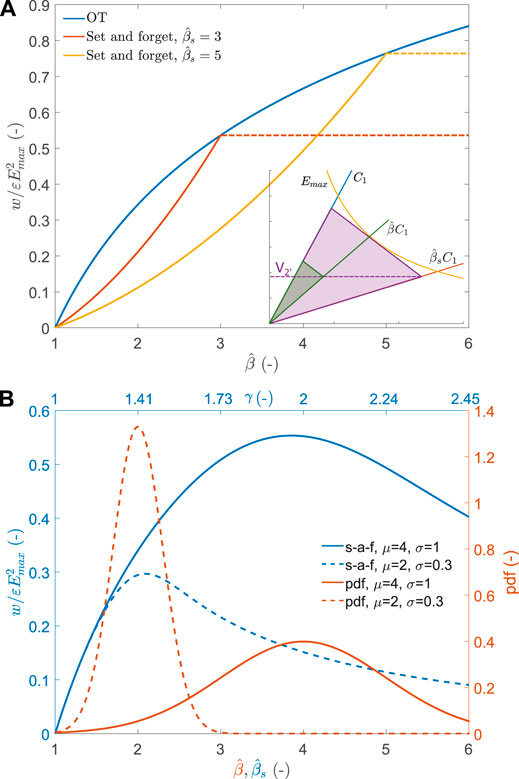
FIGURE 6. (A) normalised energy density harvested as a function of capacitance swing
We now consider a source of mechanical energy with non-constant amplitude acting on the generator. As an illustration, we use a normal distribution of input capacitance swing
Adaptive Harvesting Cycle
Although the previous section has shown that the set-and-forget approach can harvest amounts of energy close to that of the CE cycle, this is only possible for a well-tuned circuit, and therefore requires good knowledge of the statistical distribution of the deformation applied to the harvester. An alternative approach consists in adapting the harvesting circuit to the deformation amplitude. This requires continuous measurement of the deformation of the generator, either using external sensors or a self-sensing scheme (Rizzello et al., 2018). As part of the generated energy needs to be used to monitor the deformation, this approach is more adapted to high-power generators, such as wave energy converters (Moretti et al., 2020a). Out of the two parameters of the harvesting circuit, the value of the storage capacitor Cs is fixed and cannot adapt to the varying deformation amplitude. However, the priming voltage V2’ can be adjusted on the fly to optimise the circuit, i.e. by making sure that the electric field in the generator reaches Emax at one point of the cycle. This is done by implementing the strategy described in the “Non-optimal storage capacitor” section. Unlike the set-and-forget approach, there is no need to limit the deformation of the generator mechanically, as a large deformation will be compensated by a lower priming voltage so that Emax is not exceeded.
Figure 7A shows in blue the relative amount of energy density that can be harvested using the adaptive approach. Two arbitrary values of
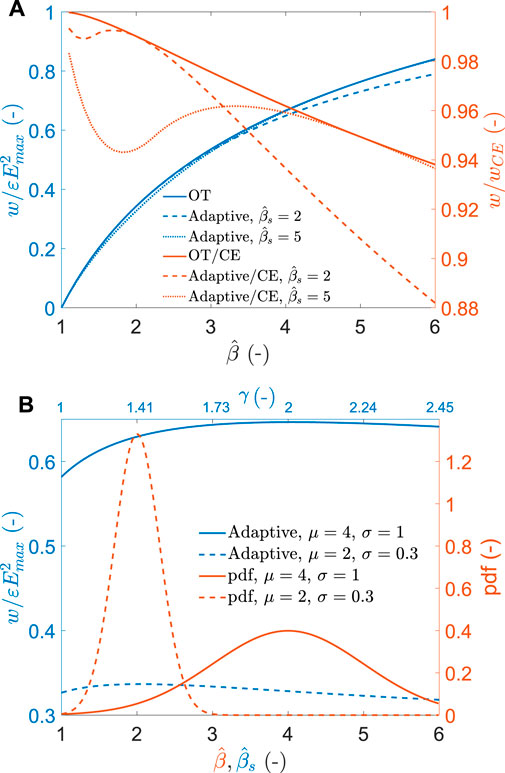
FIGURE 7. (A) normalised energy density harvested as a function of capacitance swing
Experimental Verification
To illustrate the usage of the model, we produced a circular DEG deforming out of plane like a cone (Figure 8). The outer diameter of the membrane was 80 mm with a circular central hub of 20 mm in diameter. The membrane material was a 50 µm sheet of Elastosil 2030 (Wacker Chemie AG) on which compliant electrodes were patterned by spray-coating through a shadow mask. The initial capacitance of the DEG was 2.25 nF, the surface of active material in the undeformed state S1 was 4.71 ⋅ 10–3 m2, and the volume of active material was 2.36 ⋅ 10–7 m3. These values lead to a relative permittivity of the silicone membrane of ɛr = 2.7 (the manufacturer’s value provided in the datasheet is 2.8). A servo-tube was connected to the central hub of the DEG and could pull the central hub out of plane. Displacements up to 70 mm were performed leading to achievable values of capacitance swing in the range
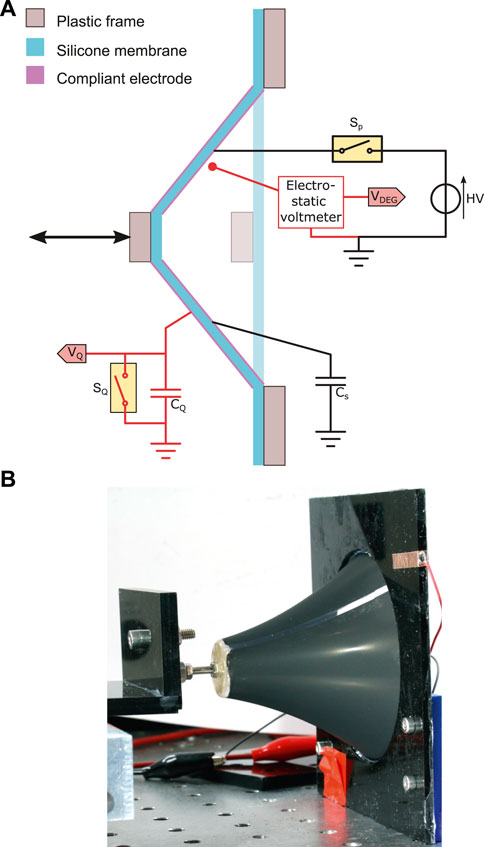
FIGURE 8. (A) schematic representation of the conical DEG under test. The parts in red are components used to characterised the behaviour of the DEG, but which are not required for normal operation. (B) picture of the device under test with an out-of-plane displacement of the central hub of 60 mm.
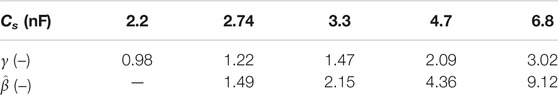
TABLE 3. Values of storage capacitors available for the experiments, and corresponding values of parameter γ, and
It is necessary to measure the voltage (V) and charge (Q) on the DEG during a cycle to characterise the harvesting cycle, which requires the use of additional electronic components (in red in Figure 8). We used a non-contact electrostatic voltmeter (Trek P0865) to measure the voltage, which provided voltage reading without charge leakage. To measure the charge on the DEG, we connected the DEG in series with a large capacitor CQ of 16.8 µF (i.e. 7500 times larger than the capacitance of the DEG). The voltage VQ on this sensing capacitor is proportional to the charge on the DEG QDEG according to the equation QDEG = CQ VQ. The voltage VQ was buffered through an operational amplifier with a high input impedance to reduce charge leakage. Still, as leakage cannot be prevented entirely, a relay SQ was connected in parallel with CQ and enabled to discharge the integrator before each cycle. An Analog Discovery 2 was used to read the electrostatic voltmeter output and the voltage VQ, and to control the two relays. A LabVIEW programme controlled the whole setup, including relay state, priming voltage value, servo-tube position, and data acquisition. For all test cycles, the speed of the servo tube was adapted so that the stretching phase (and the relaxing phase) took 1 s. A LCR meter was used to measure the capacitance of the DEG as a function of the servo-tube displacement to establish a relation between the capacitance swing and physical displacement of the DEG. Five cycles were measured for displacements up to 70 mm and a theoretical model fitted on the experiment (see Supplementary Material). This model was later used in the experiments to prescribe the servo-tube displacement required to achieve a target capacitance swing
To calculate the measured energy density wmeas collected during each cycle, we used the charge and voltage measured at the end of priming (
The first term is the energy density transferred to the storage capacitor during the relaxation phase. The second term is the energy density extracted from the DEG during the discharge phase. The third term is the priming energy density of the DEG capacitance. The priming energy of the storage capacitor does not appear, as it is also collected during the discharge phase and only acts as an offset.
Results
Harvesting cycles were measured for a range of capacitance swings
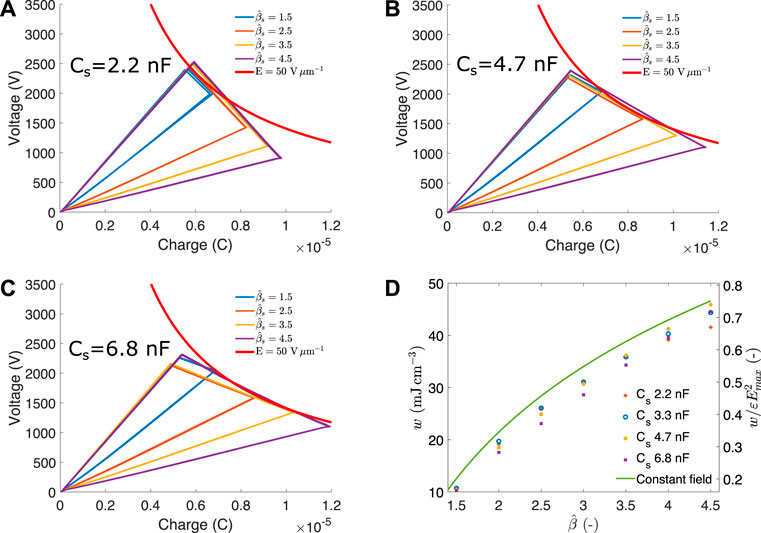
FIGURE 9. Harvesting cycles for capacitance swings between 1.5 and 4.5 and different values of storage capacitor: (A) 2.2 nF, (B) 4.7 nF, (C) 6.8 nF. (D) average energy density and normalised energy density as a function of capacitance swing and for different values of storage capacitor. The maximal theoretical harvestable energy density as provided by the constant field cycle is also indicated for reference.
The smallest value of Cs = 2.2 nF (Figure 9A) leads to a value of γ < 1 (c.f. Table 3). Consequently, the triangular cycles for this value of Cs are not tangent to the maximal field line but meet it at the end of the relaxation phase (c.f. Supplementary Figure S1, case Cs1). A value of Cs = 4.7 nF (Figure 9B) is optimal for a capacitance swing of 4.36, close to the cycle with
Figure 9D shows the energy density (left axis) and normalised energy density (right axis) generated for the seven capacitance swing values tested and the four storage capacitor values. Each data point is the average of the five harvesting cycles performed for each combination. The green line represents the maximum harvestable energy density of a constant field cycle. If the priming voltage is judiciously chosen with respect to the values of Cs and
To evaluate the energy harvesting performance of the DEG for varying deformation amplitudes, we measured the harvested energy density for series of 200 cycles with a capacitance swing following a normal distribution. As the DEG had been successfully tested for values of
We started by considering the set-and-forget approach with functioning set-points in the range
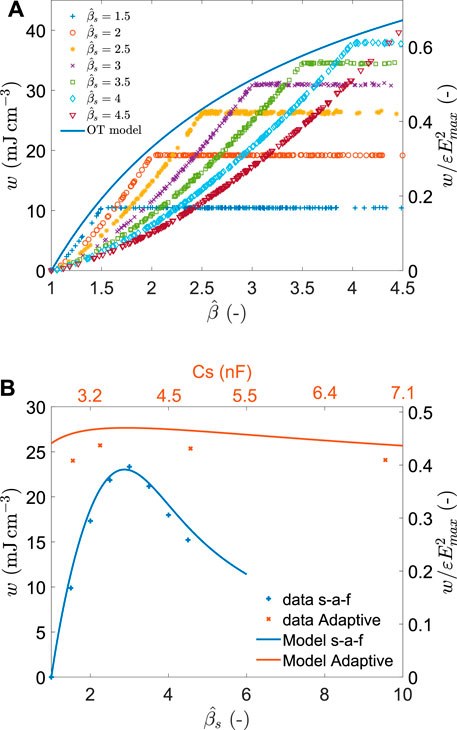
FIGURE 10. (A) Energy density (left axis) and normalised energy density (right axis) obtained using the set-and-forget scheme for different values of
We also compared the average harvested energy when an adaptive cycle approach is used instead of the set-and-forget. This was done by selecting a functioning point
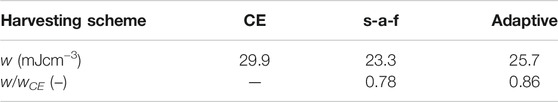
TABLE 4. Energy density harvested at a field of 50 V µm−1 for an input distribution of capacitance swing values following a normal distribution with μ = 2.75, and σ = 0.8. The constant field (CE) value is a theoretical value, and the set-and-forget (s-a-f) and adaptive values are the experimental values obtained as the average of 200 cycles. The second line shows the relative energy density wrt the CE benchmark.
Discussion
The DEG is a generator technology that scales well and can therefore be integrated at different size scales. For example, concepts of large-scale (
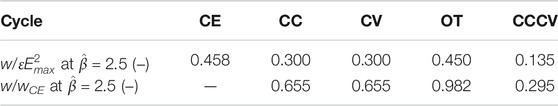
TABLE 5. Representative values of normalised energy density and relative energy density (wrt constant field), for different harvesting cycles. The constant field (CE) cycle is given as reference value. The values are calculated using the formulas from Moretti et al. (2020a).
Passive harvesting cycles are optimised for a precise deformation (i.e. capacitance swing) of the DEG. However, real-life applications of DEGs usually involve deformation amplitudes that can change with time. We have considered the case of a normal input distribution of capacitance swing values and experimentally validated the model with tests performed at an electric field Emax = 50 V m−1 and for distribution parameters of μ = 2.75, and σ = 0.8. In these conditions, the completely passive set-and-forget approach enables to harvest 78% of what would be collected with the CE cycle (c.f. Table 4). This requires knowing the parameters of the distribution so that the cycle can be tuned accordingly. This is a realistic assumption; for example, wave amplitudes throughout the year can be measured at the location where a wave energy converter will be installed and the amplitude distribution established. In the same conditions, the adaptive cycle enables to harvest slightly more energy (86% of the CE cycle). However, it requires active monitoring of the deformation to adapt the priming voltage, which defeats the idea of a completely passive harvesting cycle. Still, compared to the CE cycle that requires monitoring the capacitance of the DEG during the whole relaxation phase and controlling the voltage to ensure that the electric field remains constant, the adaptive cycle only requires a single measurement of the peak deformation, which can potentially be done at a much lower energy cost.
Other types of distributions will affect the results, but the set of equations developed here can easily be applied to predict the performance of a DEG for any kind of input distribution. It is, for example, expected that a uniform distribution would be detrimental to the set-and-forget approach, as a larger fraction of the cycles would be located further apart from the capacitance swing for which the circuit is tuned. Still, the performance of the set-and-forget approach can be compared to what would be collected by the adaptive approach, taking into account the energy required for the deformation monitoring system to decide which configuration is better suited.
The cycles performed at
One of the main drawbacks of the approach presented here is that it requires a substantial priming energy for each cycle. As shown on Figure 5A, the net energy gain per cycle can be smaller than the priming energy, especially for large values of Cs and low values of
Conclusion
We have established a model that maximises the energy harvested by a simple circuit consisting of a DEG and a storage capacitor. The model gives the values of the required storage capacitor and the priming voltage, which maximises the collected energy while keeping the electric field in the device lower than a set value. For a range of capacitance swing values
The model has been validated by experiments on a conical DEG and can be used to optimise the energy collected by a DEG in the case of non-constant deformation amplitudes. At a conservative electric field value of 50V µm−1, an energy density up to 46 mJcm−3 was generated. This represents 98% of the energy that would be collected using a constant field cycle, which would require complex and potentially energy-expensive control of the DEG voltage during relaxation. The economy of the OT scheme makes it near ideal for small, portable, wearable and natural stochastic energy harvesting operations.
Data Availability Statement
The raw data supporting the conclusion of this article will be made available by the authors, without undue reservation.
Author Contributions
SR and IA contributed to the conception and the design of the study. SR developed the mathematical model, the electronic circuits and LabVIEW code, and performed the experiments. SR analysed the data and wrote a first draft of the manuscript. All authors contributed to manuscript revision, read, and approved the submitted version.
Funding
This project was partially funded by the University of Auckland and the Auckland Bioengineering institute as part of the seed project New materials and electronics for wearable energy harvesting (A9IX).
Conflict of Interest
The authors declare that the research was conducted in the absence of any commercial or financial relationships that could be construed as a potential conflict of interest.
Publisher’s Note
All claims expressed in this article are solely those of the authors and do not necessarily represent those of their affiliated organizations, or those of the publisher, the editors and the reviewers. Any product that may be evaluated in this article, or claim that may be made by its manufacturer, is not guaranteed or endorsed by the publisher.
Acknowledgments
The authors wish to thank Andreas Köllnberger and Wacker Chemie A. G. for providing the silicone Elastosil film.
Supplementary Material
The Supplementary Material for this article can be found online at: https://www.frontiersin.org/articles/10.3389/frobt.2022.825148/full#supplementary-material
References
Albuquerque, F. B., and Shea, H. (2020). Influence of Humidity, Temperature and Prestretch on the Dielectric Breakdown Strength of Silicone Elastomer Membranes for DEAs. Smart Mater. Struct. 29, 105024. doi:10.1088/1361-665X/aba5e3
Anderson, I. A., Gisby, T. A., McKay, T. G., O’Brien, B. M., and Calius, E. P. (2012). Multi-functional Dielectric Elastomer Artificial Muscles for Soft and Smart Machines. J. Appl. Phys. 112, 041101. doi:10.1063/1.4740023
Anderson, I. A., Ieropoulos, I. A., McKay, T., O'Brien, B., and Melhuish, C. (2011). Power for Robotic Artificial Muscles. Ieee/asme Trans. Mechatron. 16, 107–111. doi:10.1109/tmech.2010.2090894
Bruch, D., Nalbach, S., Rizzello, G., Motzki, P., and Seelecke, S. (2020). “Multifunctional Fatigue Testing Setup for In-Plane Operating DEAs,”. Nondestructive Characterization and Monitoring of Advanced Materials, Aerospace, Civil Infrastructure, and Transportation IX. Editors P. J. Shull, T.-Y. Yu, A. L. Gyekenyesi, and H. F. Wu (Bellingham, WA: SPIE), 11380, 113800S. doi:10.1117/12.2558609
de Saint-Aubin, C. A., Rosset, S., Schlatter, S., and Shea, H. (2018). High-cycle Electromechanical Aging of Dielectric Elastomer Actuators with Carbon-Based Electrodes. Smart Mater. Struct. 27, 074002. doi:10.1088/1361-665x/aa9f45
Eitzen, L., Graf, C., and Maas, J. (2011). Cascaded Bidirectional Flyback Converter Driving DEAP Transducers. IECON 2011 - 37th Annual Conference of the IEEE Industrial Electronics Society. IEEE, 1226–1231. doi:10.1109/iecon.2011.6119484
Fasolt, B., Welsch, F., Jank, M., and Seelecke, S. (2019). Effect of Actuation Parameters and Environment on the Breakdown Voltage of Silicone Dielectric Elastomer Films. Smart Mater. Struct. 28, 094002. doi:10.1088/1361-665x/ab2f34
Graf, C., Eitzen, L., and Maas, J. (2011). Multilevel High Voltage Converter Driving Dielectric Elastomer Generators. In Proceedings of the 2011 14th European Conference on Power Electronics and Applications. 1–10.
Graf, C., Maas, J., and Schapeler, D. (2010). Energy Harvesting Cycles Based on Electro Active Polymers. In Proceedings of SPIE - The International Society for Optical Engineering (SPIE), 7642, 764217. doi:10.1117/12.853597
Huang, J., Shian, S., Suo, Z., and Clarke, D. R. (2013). Maximizing the Energy Density of Dielectric Elastomer Generators Using Equi-Biaxial Loading. Adv. Funct. Mater. 23, 5056–5061. doi:10.1002/adfm.201300402
Jean, P., Wattez, A., Ardoise, G., Melis, C., Van Kessel, R., and Fourmon, A. (2012). Standing Wave Tube Electro Active Polymer Wave Energy Converter. Proc. SPIE - Int. Soc. Opt. Eng. 8340, 83400C. doi:10.1117/12.934222
Jean-Mistral, C., Basrour, S., and Chaillout, J.-J. (2008). “Dielectric Polymer: Scavenging Energy from Human Motion,”. Electroactive Polymer Actuators and Devices (EAPAD) 2008. Editor Y. Bar-Cohen (Bellingham, WA: SPIE), 6927, 692716. doi:10.1117/12.776879
Kaltseis, R., Keplinger, C., Koh, S. J. A., Baumgartner, R., Goh, Y. F., Ng, W. H., et al. (2014). Natural Rubber for Sustainable High-Power Electrical Energy Generation. RSC Adv. 4, 27905–27913. doi:10.1039/c4ra03090g
Koh, S., Keplinger, C., Li, T., Bauer, S., and Suo, Z. (2011). Dielectric Elastomer Generators: How Much Energy Can Be Converted? Mechatronics, IEEE/ASME Trans. 16, 33–41. doi:10.1109/TMECH.2010.2089635
Kornbluh, R. D., Pelrine, R., Prahlad, H., Wong-Foy, A., McCoy, B., Kim, S., et al. (2011). From Boots to Buoys: Promises and Challenges of Dielectric Elastomer Energy Harvesting. Proc. SPIE - Int. Soc. Opt. Eng. 7976, 797605. doi:10.1117/12.882367
Lagomarsini, C., Jean-Mistral, C., Monfray, S., and Sylvestre, A. (2019). Optimization of an Electret-Based Soft Hybrid Generator for Human Body Applications. Smart Mater. Structures 28, 104003. doi:10.1088/1361-665x/ab3906
Lo, H. C. (2015). Converters for Milliwatt Dielectric Elastomer Generators. Ph.D. thesis. Auckland, New Zealand: The University of Auckland.
McKay, T. G., Rosset, S., Anderson, I. A., and Shea, H. (2015). Dielectric Elastomer Generators that Stack up. Smart Mater. Structures 24, 015014. doi:10.1088/0964-1726/24/1/015014
McKay, T., O’Brien, B., Calius, E., and Anderson, I. (2010a). An Integrated, Self-Priming Dielectric Elastomer Generator. Appl. Phys. Lett. 97, 062911. doi:10.1063/1.3478468
McKay, T., O’Brien, B., Calius, E., and Anderson, I. (2010b). Self-priming Dielectric Elastomer Generators. Smart Mater. Structures 19, 055025. doi:10.1088/0964-1726/19/5/055025
Moretti, G., Herran, M. S., Forehand, D., Alves, M., Jeffrey, H., Vertechy, R., et al. (2020a). Advances in the Development of Dielectric Elastomer Generators for Wave Energy Conversion. Renew. Sustainable Energ. Rev. 117, 109430. doi:10.1016/j.rser.2019.109430
Moretti, G., Papini, G. P. R., Righi, M., Forehand, D., Ingram, D., Vertechy, R., et al. (2018). Resonant Wave Energy Harvester Based on Dielectric Elastomer Generator. Smart Mater. Structures 27, 035015. doi:10.1088/1361-665x/aaab1e
Moretti, G., Righi, M., Vertechy, R., and Fontana, M. (2017). Fabrication and Test of an Inflated Circular Diaphragm Dielectric Elastomer Generator Based on PDMS Rubber Composite. Polymers 9, 283. doi:10.3390/polym9070283
Moretti, G., Rosset, S., Vertechy, R., Anderson, I., and Fontana, M. (2020b). A Review of Dielectric Elastomer Generator Systems. Adv. Intell. Syst. 2, 2000125. doi:10.1002/aisy.202000125
Pelrine, R., Kornbluh, R., Pei, Q., and Joseph, J. (2000). High-speed Electrically Actuated Elastomers with Strain Greater Than 100%. Science 287, 836–839. doi:10.1126/science.287.5454.836
Rizzello, G., Seelecke, S., Homer, M., Rossiter, J., and de Oliveira Zanini, P. R. (2018). “Self-sensing for Robust Automatic Charge Management of Dielectric Elastomer Generators,”. Proceedings of SPIE - the International Society for Optical Engineering. Editor Y. Bar-Cohen (Bellingham, WA: SPIE), 10594, 105941J. doi:10.1117/12.2295355
Rosset, S., de Saint-Aubin, C., Poulin, A., and Shea, H. R. (2017). Assessing the Degradation of Compliant Electrodes for Soft Actuators. Rev. Scientific Instr. 88, 105002. doi:10.1063/1.4989464
Rosset, S., and Shea, H. R. (2016). Small, Fast, and Tough: Shrinking Down Integrated Elastomer Transducers. Appl. Phys. Rev. 3, 031105. doi:10.1063/1.4963164
Schlatter, S., Illenberger, P., and Rosset, S. (2018). Peta-pico-voltron: An Open-Source High Voltage Power Supply. HardwareX 4, e00039. doi:10.1016/j.ohx.2018.e00039
Shian, S., Huang, J., Zhu, S., and Clarke, D. R. (2014). Optimizing the Electrical Energy Conversion Cycle of Dielectric Elastomer Generators. Adv. Mater. 26, 6617–6621. doi:10.1002/adma.201402291
Todorcevic, T., Bauer, P., Ferreira, J. A., and van Kessel, R. (2013). Bidirectional Modular Multilevel DC-DC Converter Control and Efficiency Improvements through Separate Module Control Method. In 2013 IEEE Energy Conversion Congress and Exposition. IEEE, 2038–2043. doi:10.1109/ecce.2013.6646957
Keywords: energy harvesting, soft generator, optimisation, analytical model, energy density, soft transducers, dielectric elastomers
Citation: Rosset S and Anderson IA (2022) Squeezing More Juice out of Dielectric Elastomer Generators. Front. Robot. AI 9:825148. doi: 10.3389/frobt.2022.825148
Received: 20 December 2021; Accepted: 10 January 2022;
Published: 11 February 2022.
Edited by:
Federico Carpi, University of Florence, ItalyReviewed by:
Rocco Vertechy, University of Bologna, ItalyChangyong Chase Cao, Case Western Reserve University, United States
Copyright © 2022 Rosset and Anderson . This is an open-access article distributed under the terms of the Creative Commons Attribution License (CC BY). The use, distribution or reproduction in other forums is permitted, provided the original author(s) and the copyright owner(s) are credited and that the original publication in this journal is cited, in accordance with accepted academic practice. No use, distribution or reproduction is permitted which does not comply with these terms.
*Correspondence: Samuel Rosset , cy5yb3NzZXRAYXVja2xhbmQuYWMubno=