- Institute of Assembly Technology, Leibniz Universität Hannover, Hannover, Germany
To further advance closed-loop control for soft robotics, suitable sensor and modeling strategies have to be investigated. Although there are many flexible and soft sensors available, the integration into the actuator and the use in a control loop is still challenging. Therefore, a state-space model for closed-loop low-level control of a fiber-reinforced actuator using pressure and orientation measurement is investigated. To do so, the integration of an inertial measurement unit and geometric modeling of actuator is presented. The piecewise constant curvature approach is used to describe the actuator’s shape and deformation variables. For low-level control, the chamber’s lengths are reconstructed from bending angles with a geometrical model and the identified material characteristics. For parameter identification and model validation, data from a camera tracking system is analyzed. Then, a closed-loop control of pressure and chambers’ length of the actuator is investigated. It will be shown, that the reconstruction model is suitable for estimating the state variables of the actuator. In addition, the use of the inertial measurement unit will demonstrate a cost-effective and compact sensor for soft pneumatic actuators.
1 Introduction
Soft robots, with flexible shape and infinite configuration possibilities, offer completely new capabilities compared to conventional industrial robots [Trivedi et al. (2008) and Marchese et al. (2014)]. Due to their compliance, soft robots adapt to their environment. This makes them suitable for grippers handling objects with undefined shapes. Since there is no risk of damage in the event of a collision, they are also suitable for human-robot collaboration. A decisive factor determining the movement of soft pneumatic actuators is their design. New actuator designs and mechanisms have been developed for this field of research [Runge and Raatz (2017), Galloway et al. (2013) and Garcia et al. (2020)]. The soft and flexible structures with mostly nonlinear material properties and hyperelasticity present a challenge for modeling, sensing and control. Especially the use of suitable sensors for state detection of the actuator needs to be researched. Due to the low force and high deformability of the actuator, conventional strain gauges cannot be used for this purpose. One option is the use of contact-free camera tracking systems Runge and Raatz (2017). The disadvantage, however, besides the high costs, is the use in confined spaces (high space requirement of the cameras) to avoid covering in cluttered scenes. For use in confined spaces, sensors, which are integrated into the actuator, are more suitable [Szelitzky et al. (2014)].
Table 1 shows different methods for measuring the bending of soft actuators with integrated sensors. Roduit et al. (1998) and Gibbs and Asada (2005) use resistance measurements to determine a bending angle. Roduit et al. (1998) use the difference in position of two parallel cables and Gibbs and Asada (2005) use conductive fibers. Felt et al. (2016) present an inductive measuring method. Wire ties are cast around the fins of a soft pneumatic actuator and its inductance is measured. Here, an inductance change of up to 19% is observed for bends up to 190°. Besides mapping quantified elongation into a geometric shape, another method is the estimation by covering change in pose with an inertial measuring unit. In this case, the pose of an object is observed based on acceleration and rotation rates as well as magnetometer data. Best et al. (2015) and Seel et al. (2014) use this method to measure the bending between rigid links. Seel et al. (2014) achieve an accuracy of 3° at a frequency of
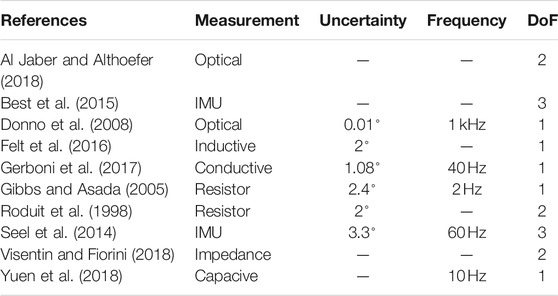
TABLE 1. Overview of different measurement methods for the determination of actuator deformation compiled from the current literature.
Gerboni et al. (2017) use a commercial flex bend sensor based on conductivity measurements for a soft pneumatic actuator with one degree of freedom (DoF). In the experiment with a closed-loop control, an accuracy of 1.08° is achieved at a clock rate of
In addition to the sensors, models or neural networks are also used to estimate the state parameters for closed-loop control [Runge and Raatz (2017), Tan et al. (2019) and Katzschmann et al. (2019)] from, for example, pressure measurements. Katzschmann et al. (2019) have published an approach for closed-loop control, where a reduced order finite element model is used for the feedback.
The research presented here aims to enable a low-level control for a three DoF fiber-reinforced actuator (FRA) using orientation measurement of the actuator’s tip. For this purpose, an inertial measurement unit (IMU) is studied. The low-level system description is done at chamber level, where the chamber’s pressure and length are considered. A reconstruction model is developed to observe the state variables, which are relevant for the control. In particular, the observed states include the lengths of the individual actuator chambers, which cannot be measured directly. To build the measurement model, an actuator segment is assumed to have a shape with a piece-wise constant curvature. The parameters are identified using particle swarm optimization and the validation of the measurement model is performed using a camera tracking system. The developed models are used for chamber length control and pressure control. Kinematic relationships between actuators chambers are not modeled. They are included in this concept as unknown disturbances. Compared to Katzschmann et al. (2019), we focus on the closed-loop control of individual segments at chamber level. For this purpose, we consider all components from the effector to the actuator chambers. The lumped second order dynamic model from Skorina et al. (2015) is on low level as well. In contrast to our work the effector system with a pneumatic valve is neglected for modeling.
For the test bench, a PC with Simulink Real-Time as operating system is used. It communicates with the Beckhoff IO-devices over EtherCAT bus. Three Enfield LS-V05 5/3 proportional directional valves are connected to regulate the airflow to the three FRA chambers. To reduce measurement noise, a peripheral EK1100 EtherCAT bus coupler with analog inputs connects five pressure sensors by First Sensors to measure pressure in all chambers, as well as supply and atmospheric pressure. To detect the orientation, the IMU is connected via a microcontroller with an EtherCAT shield. All components are commercially available.
2 MODELING OF THE SYSTEM
In the following, the system components are modeled for use in a closed-loop control (Figure 1). First, the behavior of the valves that regulates the airflow is described. The valve model is needed for the development of the sliding mode control (Section 5.1). Then the connection tubes between valves and actuator chambers are considered. Afterwards the actuator is modeled. For this purpose, the individual dynamic modeling of the chambers are combined to form a complete description of the entire actuator’s geometry. Finally, a state-space representation of the soft robot system is set up.
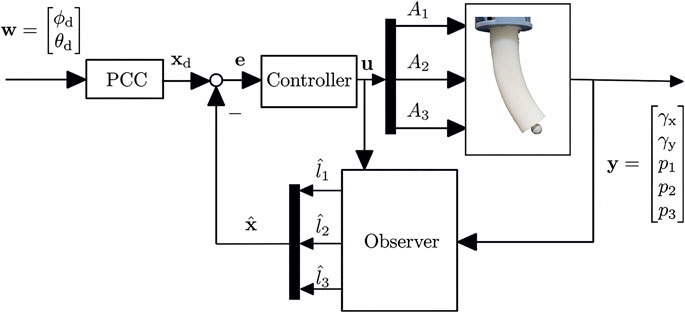
FIGURE 1. The closed-loop control uses the difference between observed chamber length and the ones from PCC configuration as feedback.
2.1 Model of Valve
The valve model is based on the work of Ben-Dov and Salcudean (1995) and Richer and Hurmuzlu (2000a), Richer and Hurmuzlu (2000b). For a detailed description of the valve modeling, we refer to our preliminary work in Ibrahim et al. (2019). The air mass flow
This mass flow depends on the upstream pressure
The flow function can be calculated with
The flow
with κ as the heat capacity ratio. Here,
The orifice A of the valve depends on the spool position
the area A can be calculated with
The dynamic of the spool displacement is described with the second order differential equation
with the spool current
2.2 Model of Connecting Tubes
The tubes, which connect the valves with the actuator chambers, affect the air mass flow. The friction in the tube leads to a loss of flow, which causes a time delay, which is based on the sonic speed
Here, ϕ is the attenuation coefficient and it is calculated with
The pressure
with the model of Sutherland and its constant
2.3 Model of Soft Pneumatic Actuator
In the following actuator modeling is presented using the example of a FRA made of Dragonskin 10 silicon [Polygerinos et al. (2015)]. Figure 2A shows the actuator segment. The Deformation of the actuator is due to expansion of the chambers, which are located along the actuator length. First the entire actuator is considered and a geometric model is created. Then the dynamics of an individual chambers of the actuator are considered and modeled.
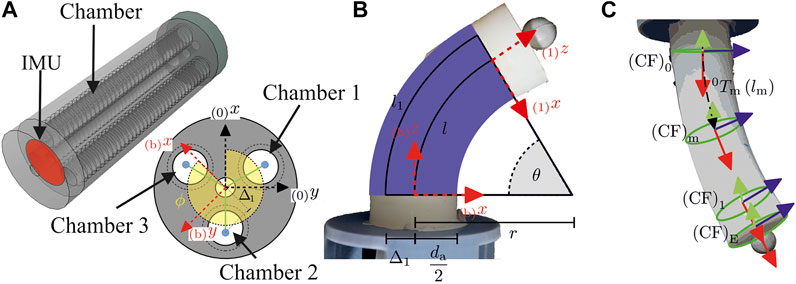
FIGURE 2. Geometry of soft pneumatic actuator with PCC parameters
2.3.1 Geometric Modeling
Based on work from Webster and Jones (2010) the actuator’s shape is approximated with a piece-wise constant curvature (PCC). The configuration is described with the arc length
from Webster and Jones (2010) is used. This describes the transformation between the segment’s base
The mapping between the PCC parameters and the chamber length is also given in Webster and Jones (2010). For each chamber i the arc length is
The chamber position is specified by the distance
2.3.2 Chamber Modeling
The basis for chamber dynamics is the low-level model from Ibrahim et al. (2019). This describes the pressure curve depending on incoming and outgoing mass flow
The chamber’s volume is affected by the difference between internal pressure and atmospheric pressure. Since the FRA only expands the chambers in one axial direction, the spherical approach from Ibrahim et al. (2019) is not suitable. For this reason, a cylinder model is constructed in the following. The volume of a cylinder is
and it is described by the circular base with the chamber radius
Analogous to the sphere model, the force due to the pressure difference
and the force of the material tension is
with
The coefficient M is the chamber’s mass and the coefficient D describes the chamber’s damping.
2.4 State Space Representation
Using the equations above, a state-space representation of the soft robot system is set up. For this purpose, a segment with three chambers is considered. In Figure 1 the control loop is shown. For each chamber a valve is used to regulate the in- and outgoing mass flow. This flow causes a pressure change in the actuators chambers and as a result the chambers in- or deflate. The pressure in each chamber is measured, as well as the actuator’s orientation at a certain point along the arc.
2.4.1 System Dynamics
The system dynamics
describes the change of the state variables
The states are described, based on Eq. 14, as
and based on Eq. 18 as
with
2.4.2 Measurement Model
The measurement model is used for mapping between the state space
From the states
If the quotient
is formed from Eq. 13 and the addition theorem
results. With
the angle
is determined. Transposing Eq. 13, the arc length is
Getting from PCC parameters to RPY angles, we first determine the rotation matrix at the measuring position. Based on the PCC parameters and the measurement position
and arc length
From the comparison of the rotation matrices Eqs. 12, 22 follows
If
applies. From these equations the measurement model can be set up with
The state space representation consists of
In summary, the measurement model is based on the correspondence of the rotation matrices, which was established on the one hand by the sensor values in RPY coordinates and on the other hand by the approximation of the actuator shape by the PCC parameters. The offset between the actuator’s tip and the measurement position is also included by shifting the position with the PCC parameters.
3 Reconstruction
In the control loop shown in Figure 1, the controlled variable is the length of the chambers. Since the lengths are not directly measurable, a reconstruction is necessary. In the following a model for reconstruction is described, which determines the state of the actuator from sensor measurements.
3.1 Reconstruction With a Static Inverse Measurement Model
The pressures
is formed with the measurement equations that have already been established as well as the system dynamics. In a first step the orientations measurement is used to calculate the PCC parameters
Unlike the two measurement variables
and therefore for the angle
If the rotation matrices Eqs. 12, 22 are compared with each other, the bending direction can be found in
This Results in the Following Angles
To get the bending angle θ we need
and so it is
at the measurement position
In contrast to
With Eqs. 16, 17, strain, based on pressure, is
Through the defined strain the chamber lengths
can be determined. With Eqs. 24, 26 the arc length
From the reconstructed arc length
can be derived with Eq. 28. In a last step the chamber lengths
Reconstruction of the state variables was also performed by comparing the rotation matrices. With the orientation measurement, the PCC parameters can be determined at the measurement position. Since the actuator length cannot be found using the orientation measurement, it was necessary to look at the actuator forces. For static case the state variables can be reconstructed now.
3.2 Measurement Devices for Shape Sensing
In this research, a camera tracking system and an IMU are used to capture actuator’s shape. The camera tracking system is used for identification and validation experiments and the IMU is used for orientation measurement of the actuator’s tip (Figure 2A).
3.2.1 Camera Tracking System
An OptiTrack Flex three camera system is installed to track the FRA’s segment tip. The system is infrared based, therefore reflecting markers are attached to the end of the FRA. With a resolution of 100 frames per second, 2D images of six cameras are reconstructed into a 3D representation, thus calculating the tip’s position. As a result, it is possible to record the position of the actuator with the cameras in a cycle of 100 Hz.
3.2.2 Inertial Measurement Unit
The IMU Waveshare12476 has an ICM20948 chip, which includes a compass, a gyroscope and an accelerometer. The rotations
4 Identification
In the previous sections model equations, which depend on various parameters, have been derived. Therefore the parameters have to be determined. Some parameters are based on literature, others can be found in CAD models or can be measured directly. However, a few parameters cannot be determined directly and thus they must be identified. In the following, parameters to be determined are highlighted and their identification procedures are described.
4.1 Parameter of Valve Model
The function of the valves is described with the mass flow Eq. 1. The following parameters have to be defined:
• The ideal gas constant R and the isentropic exponent κ,
• discharge coefficient
• as well as the mapping between the valve’s orifice
A detailed description of parameter choice and identification can be found in Krause et al. (2019).
4.2 Parameter of Actuator Model
Regarding the actuator, a distinction is made between chamber modeling and geometric modeling of the entire actuator. First, the chamber dynamics is considered. For Eqs. 14, 18, the parameters needed are
• the coefficients
• the stress-strain curve
• the chamber radius
• chamber’s mass M and damping D.
The identification process of these parameters is also mentioned in Krause et al. (2019). In addition to the procedure mentioned above, an identification of the actuator geometry is carried out. Also, a more precise volume description for identifying the stress strain curve is possible. The actuator’s geometric model is parameterized with
• the chamber positions, that consist of the angle
• the offset from the end of the PCC segment to the end effector
• as well as the length of the unstressed PCC segment
The chamber position is based on the design of the actuator’s mold. If the three chambers are arranged as in Figure 2, their position is specified with the angle
Assuming a symmetric design, the offsets are equal with
with
To estimate the marker position, the transformation matrix
For measurement, an IMU is used. As described in Section Reconstruction with a static inverse measurement model, an estimation of the actuator elongation is necessary. A special actuator design leads to constraints for the arc length
If only positive elongation of the chambers is possible, the arc length
This is equivalent to a displacement of a neutral axis in bending direction, where there is no strain. This behavior is typical for the fiber-reinforced actuator with at least one relaxed chamber. For identification with length approximation and camera tracking system the.
• displacement
• the displacement of the neutral axis
• and the marker offset
4.2.1 Orientation of the Inertial Measurement Unit
The orientation of the IMU is recorded at
is built with RPY angles
must be equal. For the identification routine, we first determine the yaw angle
With Eqs. 36, 38 the bending direction ϕ and the bending angle θ can be derived from the rotation matrix of the IMU. The arc length
With these PCC parameters the homogeneous transformation matrix
4.2.2 Optimization
With particle swarm optimization, the parameter values are optimized to fit the calculated positions
The identification measurement is recorded with pressure steps in each chamber separately and in pairs of two. This movement covers many operation points. After the oscillation has subsided, the measurement data of each stage i is recorded and averaged for noise reduction. This provides the identification data set. The identification of the IMU sensor results in a mean error
For length reconstruction, based on strain from Eq. 41, the relation
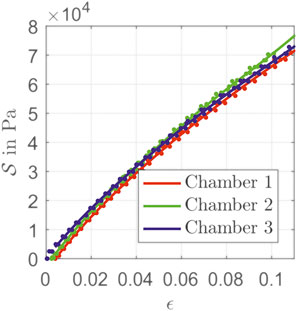
is identified. With different steady states, a look-up table for the stress is filled. The results for all three chambers are shown in Figure 4. The values of the individual chambers differ due to manufacturing tolerances. It should be noted here that the elongation of an individual chambers refers to the length
5 Closed-Loop Control Using the Reconstruction Model
In this section the previously described reconstruction model is used for low-level closed-loop control of pressure and chambers’ length of the FRA. For the pressure control, a sliding mode control (SMC) is used. In our previous research [Ibrahim et al. (2019)], it was shown, that a SMC was worse than a PI controller, due to the lack of information about the volume of the chamber of the actuator. With the information of the chamber length from the reconstruction model in this research and the known radius of the chambers, their volume can be calculated. This is used to design the SMC and the results are compared with a PI controller.
In addition, a closed-loop control for the chambers’ length using a PID controller is implemented and evaluated. Here, a path is also traced and the PCC and Cartesian coordinates are considered. In Figure 1, the layout of the control system is shown with w as reference input and y as feedback.
5.1 Closed-Loop Control of the Pressure With a Sliding Mode Control
The control law for sliding mode control is
with its parameters ξ, the maximum gain, and ζ, which depends on a feasible error
The tracking error is
Its first order
and its time derivative with Eq. 14 is
The condition for equivalent control
is converted to u. If
and
Inserting Eq. 1 in Eq. 60 gives the equivalent control
For calculating the attenuation coefficient from Eq. 10 with tube resistance Eq. 11, the previous mass flow and therefore the previous input
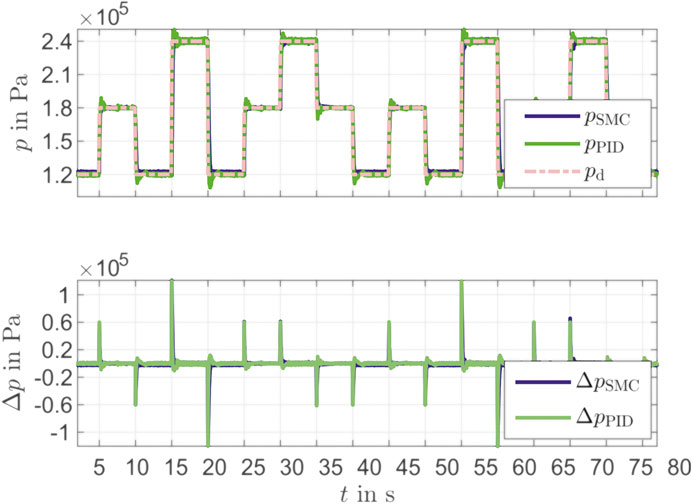
The sliding mode controller was compared with a PI controller (Figure 5). Here, two different operation (
5.2 Closed-Loop Control of the Chambers’ Lengths
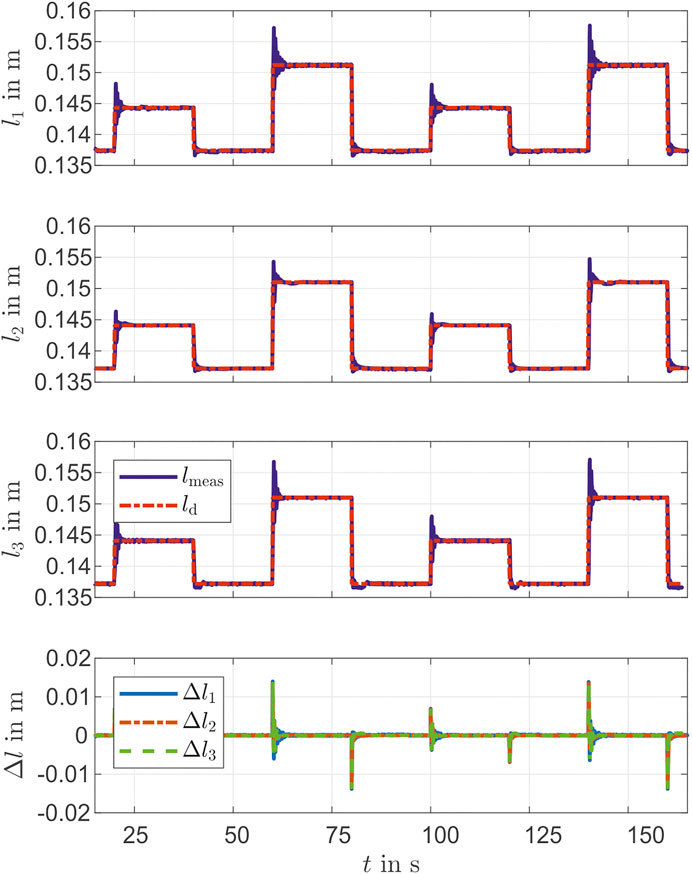
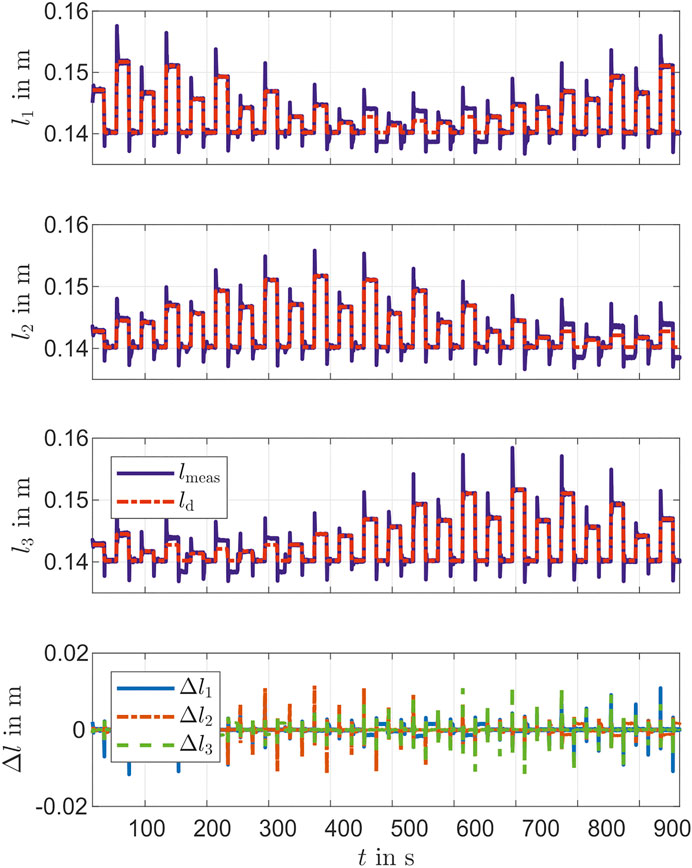
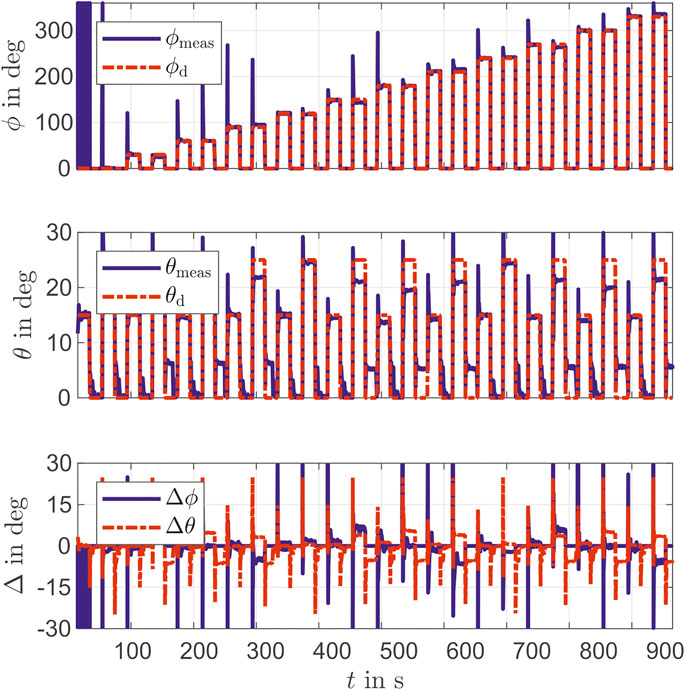
Beside the pressure control, a closed-loop control with the previously described state variables
For testing the controller performance, different PCC parameters are specified. With bending angles
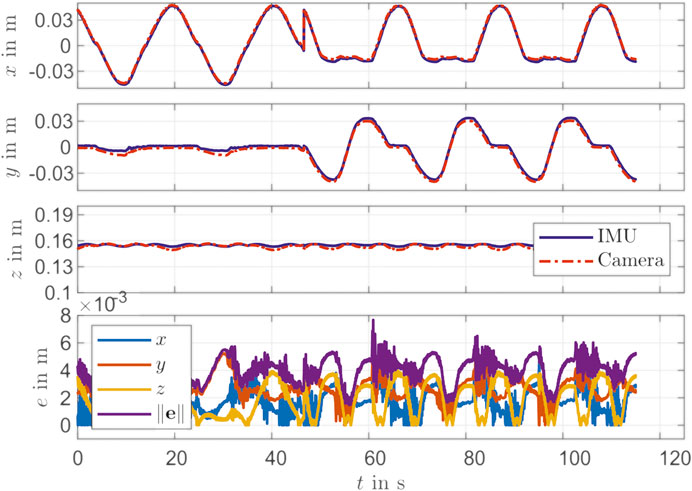
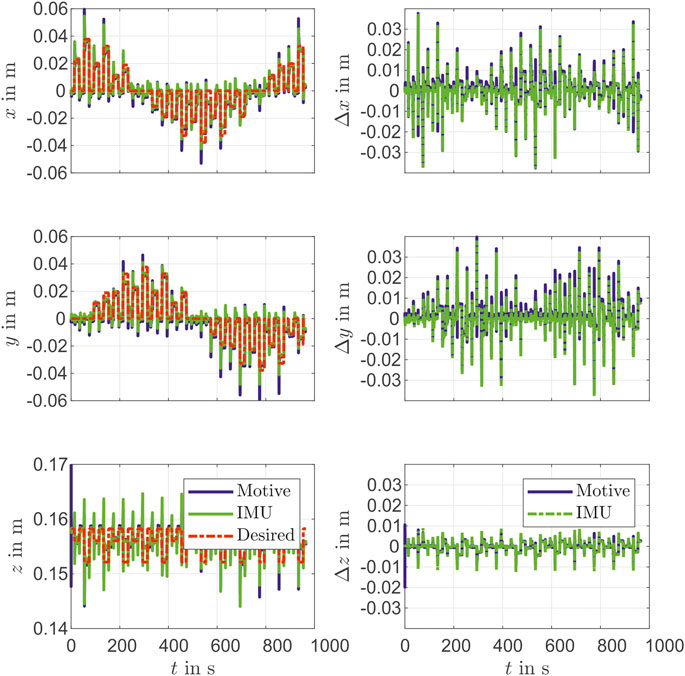
The controller performance is validated with the camera tracking system. For this purpose, the desired marker position is determined based on work from Section Reconstruction with a static inverse measurement model and Parameter of Actuator Model. As shown in Figure 9 there is a mean deviation of
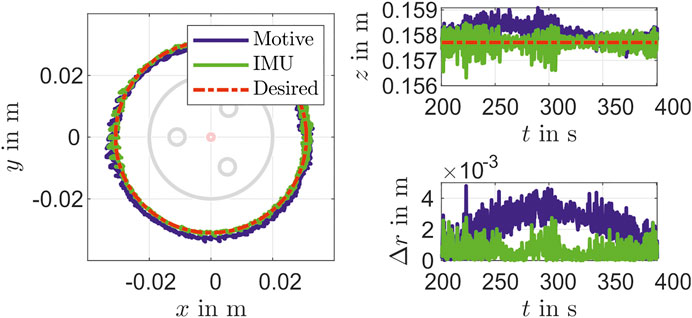
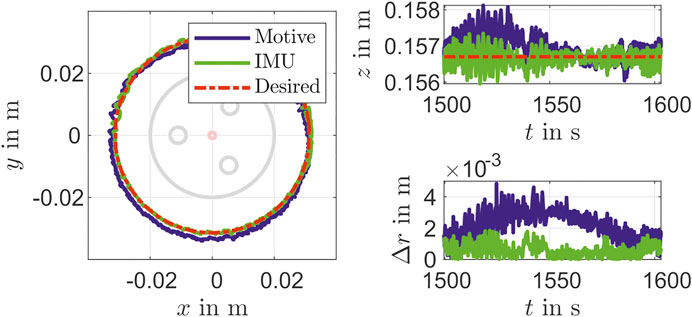
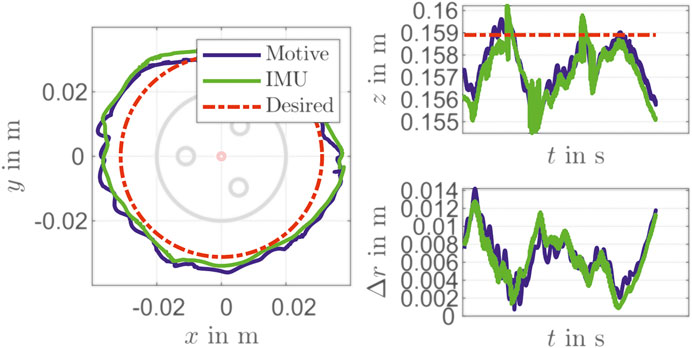
In addition to a set point stabilization that is done with the steps in the validation above, a control for path tracking is considered, too. For that a circle with a radius of about
6 Conclusion
In this research, a model for reconstruction of state variables of a soft pneumatic actuator with an inertial measurement unit was demonstrated. A fiber-reinforced soft pneumatic actuator was chosen for the investigation. With the PCC approach, the shape and the deformation variables of the actuator were described and a geometrical model was developed. Then the dynamics of the actuator chambers were modeled using a nonlinear second order differential equation. A state space representation of the soft robotic system was set up with the air pressure, the chambers’ length and the first and second time derivation of this as state variables. A measurement model was set up to map between the state variables and the measurement data of the IMU. With the geometric model and data of the pressure and orientation measurement, a reconstruction model for the deformation angles was set up, concerning the specific material properties of the actuator. The reconstruction model was used to determine the volume for a sliding mode controller of pressure. Furthermore, the control of the chambers’ lengths of the actuator was investigated.
In the validation of the reconstruction model, a mean error of
To increase the performance of the controller, it is necessary to increase the feedback frequencies of the IMU. A filtering of the measurement signals can also be considered. Due to the fact that the pressure dynamic differs from the actuator dynamic, the reconstruction of the chambers’ length with pressure measurement is insufficient. Therefore, an observer with known model dynamic is necessary. In further work, Kalman-filtering approach for state estimation is recommended. In this approach, different measurement rates and noises from sensors are concerned.
Data Availability Statement
The original contributions presented in the study are included in the article/Supplementary Material, further inquiries can be directed to the corresponding author.
Author Contributions
All authors listed have made a substantial, direct and intellectual contribution to the work, and approved it for publication.
Funding
Funded by the Deutsche Forschungsgemeinschaft (DFG, German Research Foundation)-405032969.
Conflict of Interest
The authors declare that the research was conducted in the absence of any commercial or financial relationships that could be construed as a potential conflict of interest.
References
Al Jaber, F., and Althoefer, K. (2018). “Towards creating a flexible shape senor for soft robots,” in IEEE International Conference on Soft Robotics (Robosoft), Livorno, Italy, 114–119. April, 2018. doi:10.1109/ROBOSOFT.2018.8404906
Ben-Dov, D., and Salcudean, S. E. (1995). A force-controlled pneumatic actuator. IEEE Trans. Robot. Automat. 11, 906–911. doi:10.1109/70.478438
Best, C. M., Wilson, J. P., and Killpack, M. D. (2015). “Control of a pneumatically actuated, fully inflatable, fabric-based, humanoid robot,” in IEEE-RAS 15th international conference on humanoid robots (humanoids). New Jersey, NJ: IEEE, 1133–1140. doi:10.1109/HUMANOIDS.2015.7363495
Donno, M., Palange, E., Di Nicola, F., Bucci, G., and Ciancetta, F. (2008). A new flexible optical fiber goniometer for dynamic angular measurements: application to human joint movement monitoring. IEEE Trans. Instrum. Meas. 57, 1614–1620. doi:10.1109/TIM.2008.925336
Felt, W., Suen, M., and Remy, C. D. (2016). “Sensing the motion of bellows through changes in mutual inductance,” in International Conference on Intelligent Robots and Systems IROS 2016. New Jersey, NJ: IEEE, 5252–5257. doi:10.1109/IROS.2016.7759772
Galloway, K. C., Polygerinos, P., Walsh, C. J., and Wood, R. J. (2013). “Mechanically programmable bend radius for fiber-reinforced soft actuators,” in 16th international conference on advanced robotics (ICAR), November 2013, Montevideo, Uruguay. doi:10.1109/ICAR.2013.6766586
Garcia, M., D. S., Ibrahim, S., Cao, B.-H., and Raatz, A. (2020). Cluj-Napoca, Romania EuCoMeS 2020: New Trends in Mechanism and Machine Science. 488–495. doi:10.1007/978-3-030-55061-5_55
Gerboni, G., Diodato, A., Ciuti, G., Cianchetti, M., and Menciassi, A. (2017). Feedback control of soft robot actuators via commercial flex bend sensors. IEEE/ASME Trans. Mechatron. 22, 1881–1888. doi:10.1109/TMECH.2017.2699677
Gibbs, P. T., and Asada, H. H. (2005). Wearable conductive fiber sensors for multi-Axis human joint angle measurements. J. Neuroeng Rehabil. 2, 7. doi:10.1186/1743-0003-2-7 |
Ibrahim, S., Krause, J. C., and Raatz, A. (2019). Linear and nonlinear low level control of a soft pneumatic actuator. In IEEE International Conference on Soft Robotics (RoboSoft), February 2019, 434–440. doi:10.1109/ROBOSOFT.2019.8722737
Katzschmann, R. K., Santina, C. D., Toshimitsu, Y., Bicchi, A., and Rus, D. (2019). “Dynamic motion control of multi-segment soft robots using piecewise constant curvature matched with an augmented rigid body model.” in IEEE International Conference on Soft Robotics (RoboSoft), February 2019, Seoul, South Korea, 454–461. doi:10.1109/ROBOSOFT.2019.8722799
Krause, J. C., Ibrahim, S., and Raatz, A. (2019). “Evaluation environment for control design of soft pneumatic actuators,” in Tagungsband des 4. Kongresses Montage Handhabung Industrieroboter. Editors T. Schüppstuhl, K. Tracht, and J. Roßmann (Berlin, Heidelberg: Springer, 74–83.
Marchese, A. D., Komorowski, K., Onal, C. D., and Rus, D. (2014). “Design and control of a soft and continuously deformable 2D robotic manipulation system,” in IEEE international Conference on Robotics and automation (ICRA). 2189–2196, September, 2014, Hong Kong, China. doi:10.1109/ICRA.2014.6907161
Mengüç, Y., Park, Y.-L., Martinez-Villalpando, E., Aubin, P., Zisook, M., Stirling, L., et al. (2013). “Soft wearable motion sensing suit for lower limb biomechanics measurements.” in IEEE Int.ernational Conf.erence on Robotics and Automation, May 2013. 5309–5316. doi:10.1109/ICRA.2013.6631337
Polygerinos, P., Wang, Z., Overvelde, J. T. B., Galloway, K. C., Wood, R. J., Bertoldi, K., et al. (2015). Modeling of soft fiber-reinforced bending actuators. IEEE Trans. Robot. 31, 778–789. doi:10.1109/TRO.2015.2428504
Richer, E., and Hurmuzlu, Y. (2000b). A high performance pneumatic force actuator system: Part II-nonlinear controller design. J. dynamic Syst. Meas. Control, 122, 426–434. doi:10.1115/1.1286366
Richer, E., and Hurmuzlu, Y. (2000a). A high performance pneumatic force actuator system: Part i—nonlinear mathematical model. J. of Dyn. Syst., Meas. Control. 122 3, 416–425. doi:10.1115/1.1286336
Roduit, R., Besse, P.-A., and Micallef, J.-P. (1998). Flexible angular sensor and biomechanical application. IEEE Trans. Instrum. Meas. 47, 1020–1022. doi:10.1109/19.744661
Runge, G., and Raatz, A. (2017). A framework for the automated design and modelling of soft robotic systems. CIRP Ann. 66, 9–12. doi:10.1016/j.cirp.2017.04.104
Seel, T., Raisch, J., and Schauer, T. (2014). IMU-based joint angle measurement for gait analysis. Sensors (Basel). 14, 6891–6909. doi:10.3390/s140406891 |
Skorina, E. H., Luo, M., Ozel, S., Chen, F., Tao, W., and Onal, C. D. (2015). “Feedforward augmented sliding mode motion control of antagonistic soft pneumatic actuators,” in IEEE international conference on robotics and automation (ICRA), May 2015, Seattle, United States, 2544. doi:10.1109/ICRA.2015.7139540
Szelitzky, E., Kuklyte, J., Mandru, D., and O’Connor, N. (2014). Low cost angular displacement sensors for biomechanical applications - a review. J. Biomed. Eng. Techn. 2, 21–28. doi:10.12691/jbet-2-2-3
Tan, C. P. E., Nurzaman, S., and Loo, J. (2019). “Non-linear system identification and state estimation in a pneumatic based soft continuum robot,” in 2019 3rd IEEE Conference on control technology (CCTA), August 2019. Hong Kong, China, doi:10.1109/CCTA.2019.8920693
Trivedi, D., Rahn, C. D., Kier, W. M., and Walker, I. D. (2008). Soft robotics: biological inspiration, state of the art, and future research. Appl. Bionics Biomech. 5, 99–117. doi:10.1080/11762320802557865
Visentin, F., and Fiorini, P. (2018). “A flexible sensor for soft-bodied robots based on electrical impedance tomography,“in IEEE international conference on soft robotics (RoboSoft), Livorno, Italy. 158–163. doi:10.1109/ROBOSOFT.2018.8404913
Webster, R. J., and Jones, B. A. (2010). Design and kinematic modeling of constant curvature continuum robots: a review. Int. J. Robotics Res. 29, 1661–1683. doi:10.1177/0278364910368147
Yuen, M. C., Kramer-Bottiglio, R., and Paik, J. (2018). “Strain sensor-embedded soft pneumatic actuators for extension and bending feedback,” in IEEE international conference on soft robotics (RoboSoft), April 2018. doi:10.1109/ROBOSOFT.2018.8404920
Ziegler, J. G., and Nichols, N. B. (1942). Optimum settings for automatic controllers. Trans. ASME. 64. 759–768. doi:10.1115/1.2899060
Glossary
A Valve orifice
D Chamber dampening
l Chamber length
M Chamber mass
p Pressure
R Ideal gas constant
S Substance-specific temperature
s sine
T Temperature
u Input voltage
θ Actuator bending angle
τ Time constant
ϕ Actuator bending direction
FRA Fiber-reinforced actuator
IMU Inertial measurement unit
PCC Piecewise constant curvature
SMC Sliding mode control
SPA Soft pneumatic actuator
Keywords: soft roboitcs, sensorization of soft robots, modeling of soft robots, control of soft robots, nonlinear control, test bench design
Citation: Ibrahim S, Krause JC, Olbrich A and Raatz A (2021) Modeling and Reconstruction of State Variables for Low-Level Control of Soft Pneumatic Actuators. Front. Robot. AI 8:557830. doi: 10.3389/frobt.2021.557830
Received: 30 April 2020; Accepted: 28 January 2021;
Published: 12 March 2021.
Edited by:
Concepción A. Monje, Universidad Carlos III de Madrid, SpainReviewed by:
Kean C Aw, The University of Auckland, New ZealandJorge Muñoz, Universidad Carlos III de Madrid, Spain
Copyright © 2021 Ibrahim, Krause, Olbrich and Raatz. This is an open-access article distributed under the terms of the Creative Commons Attribution License (CC BY). The use, distribution or reproduction in other forums is permitted, provided the original author(s) and the copyright owner(s) are credited and that the original publication in this journal is cited, in accordance with accepted academic practice. No use, distribution or reproduction is permitted which does not comply with these terms.
*Correspondence: Serhat Ibrahim, aWJyYWhpbUBtYXRjaC51bmktaGFubm92ZXIuZGU=
 Serhat Ibrahim
 Jan Christoph Krause
 Alexander Olbrich
 Annika Raatz