
94% of researchers rate our articles as excellent or good
Learn more about the work of our research integrity team to safeguard the quality of each article we publish.
Find out more
ORIGINAL RESEARCH article
Front. Robot. AI, 24 January 2017
Sec. Robot Learning and Evolution
Volume 4 - 2017 | https://doi.org/10.3389/frobt.2017.00001
This article is part of the Research TopicEvolvability, Environments, Embodiment & Emergence in RoboticsView all 8 articles
The genetic operators (GOs) of recombination, mutation, and selection are commonly included in studies of evolution and evolvability, but they are not the only operators that can affect the genotype-to-phenotype (G → P) map and thus the outcomes of evolution. In this paper, we present experiments with an epigenetic operator (EO), interactive wiring of a circuit, alongside common GOs, investigating both epigenetic and GO effects on the evolution of both simulated and physically embodied Braitenberg-inspired robots. As a platform for our experiments, we built a system that encoded the genetics for the physical circuitry of the analog robots and made explicit rules for how that circuitry would be constructed; phenotypic expression consisted of the placement of wires to form the circuitry and thus govern robot behavior. We then varied the presence of gene interactions across populations of robots, studying how the EO—and its effects on G → P maps—affected the results of evolution over several generations. Additionally, a variant of these experiments was run in simulation to provide an independent test of the evolutionary impact of this EO. Our results demonstrate that robot populations with the EO had quantitatively different and potentially less adaptive evolution than populations without it. For example, selection increased the rate at which functional circuitry was lost in the population with the EO, compared to the population without it. In addition, in simulation, EO populations were significantly less fit than populations without it. More generally, results such as these demonstrate the interaction of genetic and EOs during evolution, suggesting the broad importance of including EOs in investigations of evolvability. To our knowledge, our work represents the first physically embodied EO to be used in the evolution of physically embodied robots.
In biology, understanding how development—the mapping of genotype-to-phenotype (G → P)—shapes the creation of phenotypic variation has created a paradigmatic shift in evolutionary theory (Wagner and Altenberg, 1996; Pigliucci, 2010). The long-standing “adult transformation” paradigm treated development as if it were absent, invariant, or instantaneous, in spite of Garstang’s (Garstang, 1922) early hypothesis that ontogenies, not fully formed adults, evolve (Northcutt, 2002). Implementing Garstang’s approach required the tools of modern molecular biology to find and track (1) the expression of genes, (2) the epigenetic processes that convert gene products into working molecular machinery, and (3) the feedback among developing cells and tissues in a system that bootstraps its own manufacture while interacting autonomously with its local ecology. With the understanding that the organism faces and responds to selection pressures throughout its life, evolutionary developmental biology was born (“evo-devo”; Amundson, 2005; Carroll, 2008). For roboticists, the evo-devo challenge is to create physically embodied systems that incorporate the three scales of time and the processes inherent in each: behavior, development, and evolution (Pfeifer and Bongard, 2006). Because of the complexity of building and evolving physical robots, this is a daunting challenge in the quest for the “evolution of things” (Eiben and Smith, 2015). As an initial step toward this goal, in this paper we create a physically embodied system that allows us to examine systematically how developmental and evolutionary processes interact.
An explicit evo-devo approach has proven invaluable in the evolution of artificial neural networks (“ANNs”; Kitano, 1990; Floreano et al., 2008; Mattiussi et al., 2008; for a review). Development serves as a new type of evolutionary driver—alongside the genetic operators (GOs) of mutation, recombination, and selection—facilitating evolvability in embodied agents (Bongard, 2002; Bongard and Pfeifer, 2003; Pfeifer et al., 2007). Since developmental processes, like genetic processes, are complex and varied, we recognize them as a class of operators—epigenetic operators (EOs).
By our restricted definition, EOs alter the phenotypic expression of a genome. Recognizing that EOs work in conjunction with GOs, our goal is to create a conceptual and physical methodology that allows investigators to manipulate the interaction of GOs and EOs in physically embodied robots. For starters, if one compares two genetically identical populations, one with and one without an EO, the evolutionary impact of the EO can be substantial. One can manipulate this EO effect by changing the developmental rules of the EO directly, altering the fitness landscape, and changing the initial position of the populations within that landscape (Figure 1).
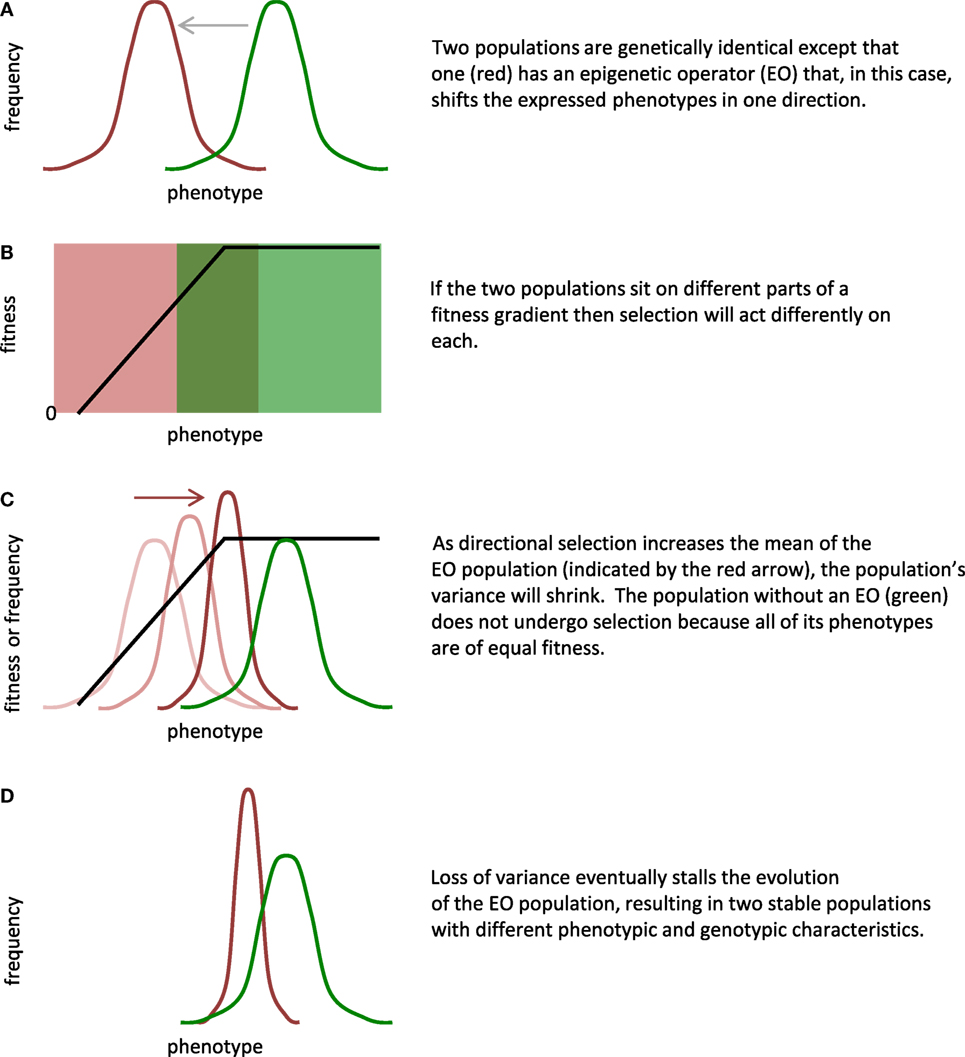
Figure 1. Epigenetic operators (EOs) and selection interact to alter evolution. By design, EOs alter the expression of phenotypes by the genome. In this general scenario, the evolution of two populations that are initially genetically identical (A) is controlled by three main factors: (1) type of phenotypic difference created by the EO; (2) shape of the fitness landscape; and (3) location of the populations on the fitness landscape (B). Assumptions of this model include the following: (1) the fitness gradient is stable over generational time; (2) the rate of mutation is constant but insufficient to replace genetic variance lost by selection; and (3) no gene flow exists between the populations. In this example, selection increases the mean and decreases the variance of the EO population (C); the loss of variance stalls evolution by selection (D). Given the ability to adjust the factors and the assumptions, the scenario shown here is one of many possible.
A G → P map without EOs is the equivalent of Northcutt’s (Northcutt, 2002) adult transformation paradigm: adults appear in final form on the evolutionary stage without explicit recognition of how they were created. In evolutionary robotics (ER), the construction of physically embodied robots has never been, to our knowledge, manipulated directly as an experimental variable. We do so here, creating an embodied EO that recognizes that connections between sensors and motors may interact during a developmental process in which the genome’s instructions are enacted to sequentially wire a circuit board with a limited set of connection pins.
The value of incorporating developmental processes into evolutionary computational models has long been known to the AI community. Gruau’s (Gruau, 1994) proposed model evolved cellularly encoded ANNs: the G → P map does not directly represent aspects of the phenotype but rather encodes the rules for how neural “cells” split and connect to their daughter cells. These rules are ordered in a collection of binary trees, which evolve through the application of the GOs. Each ANN begins as a single cell, but develops into a fully fledged network through execution of the rules in each tree during the G → P mapping process. The model’s strength lies in the fact that the terminal nodes of trees are allowed to point to the root of other trees, allowing for potentially useful substructures to repeat in the completed networks.
This idea of reuse underlies a more recent evo-devo approach to designing ANNs, HyperNEAT (Stanley et al., 2009). HyperNEAT builds on neuro-evolution of augmenting topologies (NEAT, a method for evolving ANNs that does not require the topology of the network to be set a priori) by incorporating a generative and developmental encoding scheme. This encoding scheme, called compositional pattern producing network (CPPN), indirectly encodes the weights between nodes in the ANN (Stanley, 2007). This is done by treating the NEAT-evolved ANN as existing in an n-dimensional Cartesian space. The CPPN, which is essentially a composition of geometric functions, takes the coordinates of every pairwise set of nodes as input, and for each returns the output of the functions, which represents the connection weight between the two nodes. Because the network’s weights are determined by repeated application of the same set of functions, the resultant connectivity network is often highly regular and symmetrical, much like biological brains (cf. Gilbert and Wiesel, 1992). Additionally, given that weights are determined as a function of the nodes’ positions in space, geometric relationships between inputs could be autonomously exploited.
The main advantage of these developmental systems is that they efficiently encode phenotypes by doing so indirectly (Eiben and Smith, 2015). Genes code for processes that build structures rather than for the structures themselves. This efficiency is enhanced when genetic structures are reused and redeployed. These developmental models were designed with the understanding that the process by which a phenotype is constructed is as critical to an individual’s fitness as the information coded in its genome. However, in biological systems, this construction process is not fully specified in the genome (Pigliucci, 2010). Instead, epigenetic processes, together forming the genetic regulatory network (GRN), alter how the genotype is expressed through physical interactions. For example, pleiotropic interactions spread the expression of one gene to many phenotypes. In epistasis, two or more genes interact to alter one phenotype. The dynamic GRN is the enacted G → P map.
Heeding the call for morphogenetic robotics (Jin and Meng, 2011) and morphogenetic engineering (Doursat et al., 2012), we note that what is missing from ER is not development per se but rather physically embodied development (PED). We take the first simple steps toward combining the two here by examining the interactions of EOs and GOs in the evolution of physically embodied and simulated robots. First, we provide a simple conceptual framework for the evolutionary impact of EOs on populations (Figure 1). Second, given the large number of possible EOs in any system, we use the constraints imposed by a physical, analog robot to motivate the creation of a physically embodied EO. The embodied EO is the destructive physical interaction of two or more gene expression pathways, which we call threads. The instantiation of the threads is the physical wiring between sensors and motors (see Materials and Methods for details), a G → P mapping process that we call “interactive thread development.” Third, we test the fundamental hypothesis that an EO will alter the evolutionary trajectory of a population. Using physical and simulated robots, we compare the evolutionary dynamics of populations with and without this EO.
The Ana BBot from Johuco Ltd. (http://johuco.com) is a physical, analog robot inspired by Braitenberg’s (Braitenberg, 1986) vehicles (Figure 2). While a robot with a digital microcontroller could be used, we chose an analog robot so that the genome—which codes for the connections on the circuit—has an actual, not simulated, expression in the physical world. This physical expression of the genome guided our creation of an EO (see EO: Interactive Thread Development) as the physical interaction of the wires that connect components on the circuit board.
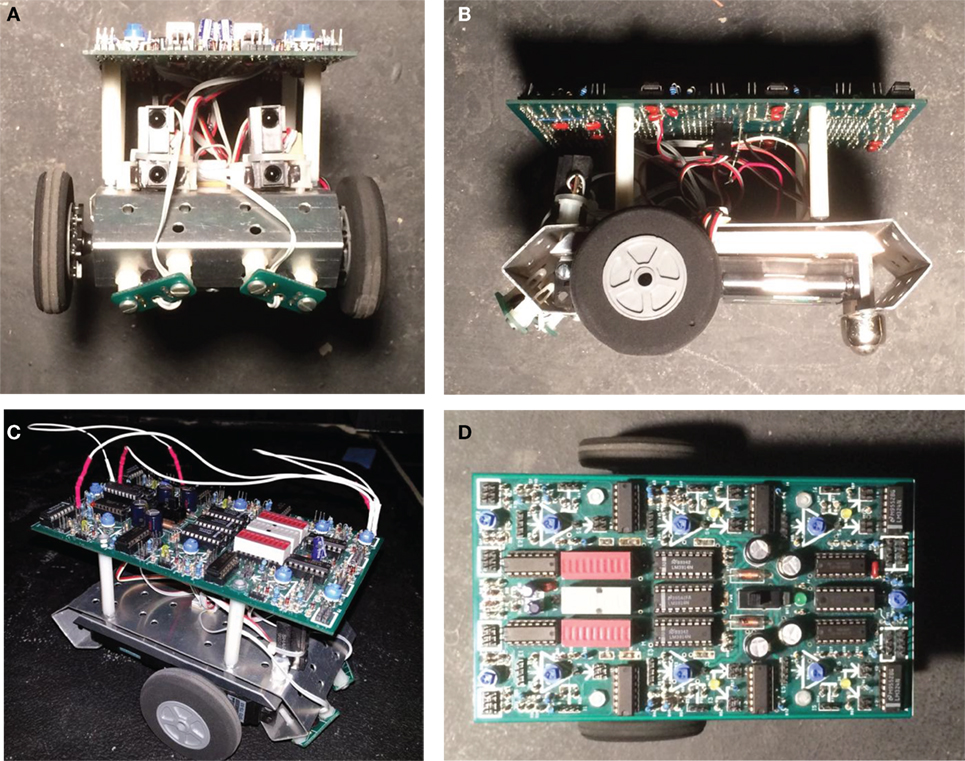
Figure 2. Ana BBot, a mobile robot that is programmable using jumper wires to connect sensors and motors. (A) Front view, with photocells and IR range detectors. (B) Lateral (left) view, showing drive wheels. (C) Robot wired using jumpers. (D) Top view, showing circuit board unwired.
The Ana BBot has four sensors, two IR proximity detectors and two photosensors, mounted on the front. The Ana BBot also has two motors that differentially drive the robot, with an unpowered posterior caster wheel to maintain balance. The open circuit board (Figure 2D) allows different components to be wired together with jumper wires (Figure 2C) that connect to headers (“pins”). The robot is programed by changing the wiring of its circuit board.
Each of the components on the circuit board has a corresponding group of functionally equivalent pins (“pin groups”). For a given input pin group, each pin may receive an electrical signal that comes from a variety of sources; for a given output pin group, each pin produces an identical electrical signal ranging from 0 to 1. While the signal between pin groups can be easily modified via alteration to the wiring, the strength of the signals themselves can be modulated if they pass through one of the robot’s six “neurons.” Each neuron has both excitatory and inhibitory input pin groups. The neuron outputs the sum of its inputs to a pin group directly or via an adjustable threshold for firing. Sensors may bypass the neurons and connect directly to the motors. Additional signal modulation is possible via the associated gain trimpots for the sensors, neurons, and motors and through alterations to the internal resistance of the wires. For the purposes of our experiment, trimpots were all centered and only wires with a 470 kΩ internal resistance (1× multiplication factor) were used.
The genome represents possible wirings of the Ana BBot’s circuit board (Figure 3). The genome itself consists of a fixed number of objects called bases, containing two binary values: a bit value and a crossover point value. The bit serves as a basic unit of genetic expression analogous to biological nucleobases, while the crossover point is used in reproduction to signal a potential stop to the copying of data from a parental genome to its offspring. Both bits and crossover points may be either 1 or 0. Within the initial populations, each bit has an equal chance of being either 1 or 0. Each of the initial genomes in a population has two crossover points (value of 1) assigned randomly to a respective number of bases. In these experiments, crossover points and bits each have a 1/2,000 probability of being altered by the mutation operator.
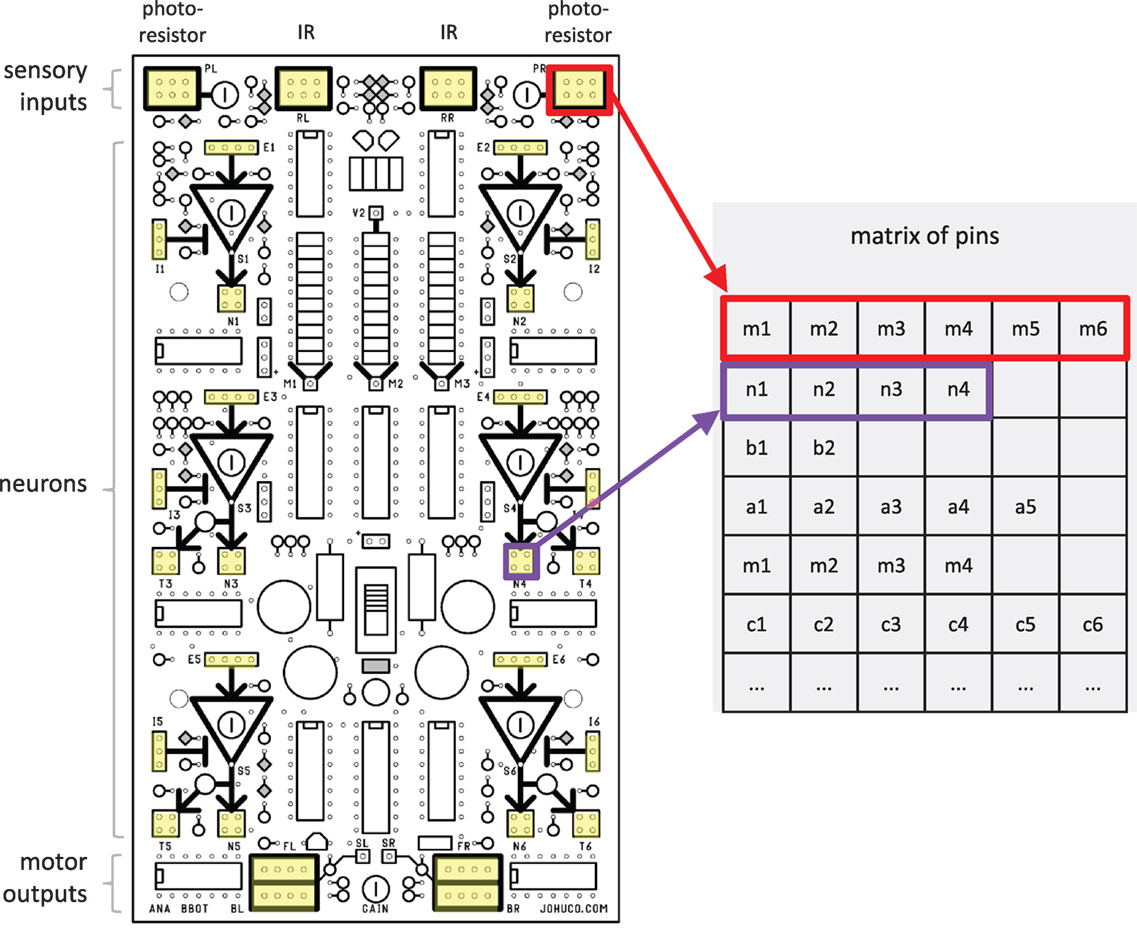
Figure 3. The genome represents the possible wirings of the Ana BBot. The pins on the circuit board of the Ana BBot are represented in a matrix, with each pin group forming a row and the pins within that group forming its elements. Pin groups used are highlighted in yellow. There are 122 pins. Schematic used with permission from Johuco, Ltd. (http://johuco.com).
The genome is split into genetic modules that encode for “threads.” A thread specifies a series of wires that form a connection across the circuit, and each genome can code for 0 or more threads (Figure 4). We specified that wires cannot form self-recurrent connections at input pin groupings of neurons. Self-recurrent connections were allowed between output pins of the neurons; a positive feedback loop that increases signals can be achieved through such a configuration. In total, 7,255 unique wire connections are possible, as calculated:
with p being the total number of pins on the circuit board, 122. We subtracted the disallowed self-recurrent connections,
where a = 6, the number of neurons on the circuit, and b = 7, the number of input pins in each.
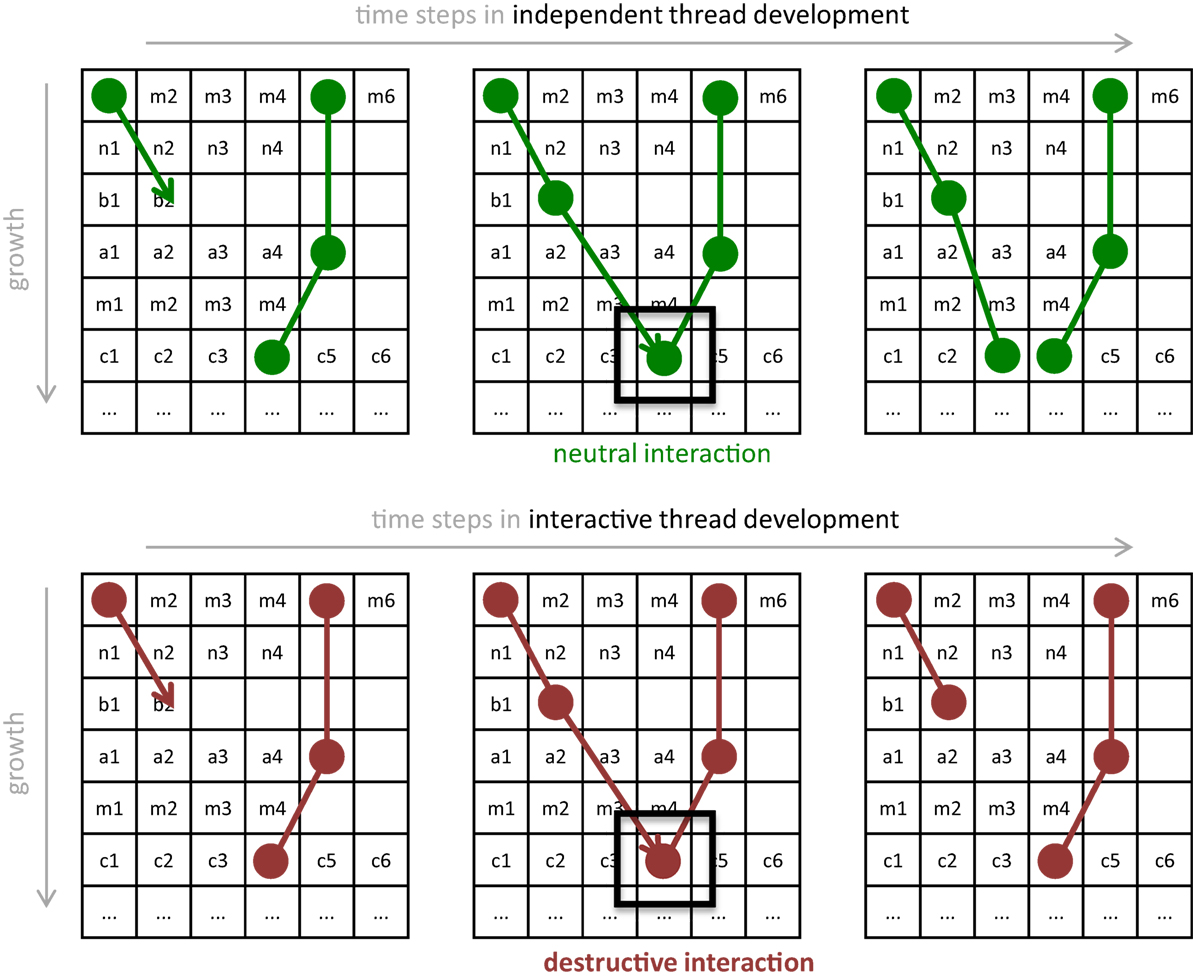
Figure 4. Development of threads with and without the epigenetic operator (EO) that causes threads to interact destructively. (A) Without an EO, independent thread development allows threads to grow as a series of connections that share rows on the pin matrix, as genetically determined. If one thread attempts to attach onto an occupied pin, then it wires on an adjacent pin. (B) With the interactive thread EO, development prevents some threads from forming. If one thread attempts to attach to an occupied pin, then this interaction destroys that wire. The thread retreats to the previous pin and terminates its growth. In either process, once development is completed, the wiring diagram is used to wire the physical Ana BBot. Under the rules of development, the 122 pins may form 7,255 possible unique connection patterns.
In order to map from a binary genome to the physical threads, a decoder operates on the genome, treating the genome as a concatenation of 4-bit strings and translating each 4-bit component into its equivalent decimal number (e.g., 0010 translates to 2, 0101 translates to 5); although 4-bit strings can represent any number from 0 to 15, the decoder only translates components with binary values in the decimal range 0–9, reducing the genetic search space and thus the computational time required to generate viable populations. The resulting decimal digits are then treated as a program for generating the resulting wiring—they can be viewed as encoding instructions for the movement of an “automaton” that traverses the circuit matrix (Figure 3), describing the pattern in which wires are added to create a thread (Figure 4). The first two decoded decimal digits are treated as the starting (X, Y) coordinates for the first wire; the next two digits determine the direction (eight possible, four cardinal, and four inter-cardinal) and distance of the jump to the ending position of that wire. If a thread contains more than one wire, the origin of the second wire will be a free pin in the pin group of the terminus of the previous wire connection.
It is possible for the decimal numbers to specify a coordinate position that is outside of the bounds of the pin matrix, which would not correspond to an actual pin on the circuit. In this event, the thread simply terminates, leaving the previous wire connections, if they exist, intact on the circuit board. It is also possible for multiple genes to express threads that code for connection to the same pin on the matrix.
Because the expression of genetically encoded threads involves the sequential connection of wires to pins on the circuit board, the beginning or end coordinates of wires specified in the second thread or later could in principle already be occupied by a previously specified wire. We treat this kind of physical interaction among wire endpoints as an EO: when interaction occurs, the forming thread is terminated, hence altering the expression of the genotype. We call this EO-driven process interactive thread development (Figure 4).
To test the hypothesis that this EO will alter the evolution of a population of Ana BBots (see Figure 1), we considered two populations: one with interactive thread development; and one with independent thread development (Figure 4), which allows full phenotypic expression of genes whose threads would be otherwise terminated by the EO of interactive threads. The process of gene expression in independent thread development is described in Section “Genome”: a genome that specifies the same pin for two different wires expresses both by shifting one of the wires to the next sequential unoccupied pin in that pin group.
Because of the time-consuming nature of experiments with physically embodied robots, we chose a population size of 10. While small, this population size is larger than that of previous work on evolving physical robots where selection for phototaxis could clearly act in spite of the presence of genetic drift (Long et al., 2006; Roberts et al., 2014; Livingston et al., 2016). Because of the concern that the small size of the population might eliminate or under-represent fit genomes in a standard roulette wheel mating algorithm, we used a simple ranking algorithm for choosing mating pairs.
Pairs of individuals are placed into five ranks by order of their fitness. Once the pair in the first rank has been crossed, these two individuals are moved to the second rank, where they join the two individuals there to form a mating pool of four. From that set of four individuals, two are randomly chosen to mate. Leaving the two unmated individuals in that rank, the two parents are then moved to the third rank, creating another pool of four individuals. This mate-and-move process continues until the fourth pair to mate moves to the fifth and final rank. After the fifth mating, those two parents are removed from the gene pool. Returning to the second rank, the highest remaining with individuals, the process continues with the mating of that pair and their movement to the third rank. This process continues until 10 offspring have been created.
The sexual reproduction algorithm recombines the two parental genomes (Figure 5). One parent is randomly chosen to start the process of replication. Its genome is copied until a crossover point shifts copying to the genome of the other parent. Once the recombined genome is produced, each of the 540 bases is subjected to mutation, with a 1/2,000 chance of mutating either the bit or crossover value of each base.

Figure 5. Reproduction. After two parents are chosen for a given pairing (see text for details), the genome of one is randomly picked to start the process of replication with recombination and mutation. The genome is copied until a crossover point is reached. Copying then switches to the genome of the other parent, and so forth, until the end of one of the genomes is reached. In the pre-offspring genome, each of the 540 bases is put through a mutation operator that gives a 1/1,000 chance of change. The final genome of each offspring is a mosaic of two parental genomes further modified by mutation. As crossover points are genetically coded and hence transferable to the offspring and susceptible to mutation, they may be eliminated by evolution. Zero crossover points would, by this method of reproduction, create asexual reproduction, where only one parent’s genome is copied as the template for the offspring.
Three independent variables were manipulated. The first was the type of development: with or without an EO (see EO: Interactive Thread Development in this section). The second was selection: present or absent. The third was the nature of the crossing over: unconstrained (occurring anywhere in the genome) or constrained to positions between the genes that encode for threads. Our primary hypothesis was that an EO will alter the evolutionary trajectory of a population under selection (see Figure 1).
The task was phototaxis with obstacle avoidance. Each individual circuit phenotype was tested on an Ana BBot in a rectangular arena with a single light source and three barriers that prevented the robot from traveling straight to the light from its starting position (Figure 6). The robot carried a light data logger (Onset model HOBO) on its front, on top of the circuit board. The amount of light gathered over 2 minute was used as a direct measure of fitness for each individual. To control for degradation of hardware over the course of evolution, individuals of the two populations were tested in register with respect to generation and randomly within a generation. In addition, we normalized fitness using performance values from a hand-coded circuit, derived from Braitenberg’s vehicle IIB (Braitenberg, 1986), that we ran each generation.
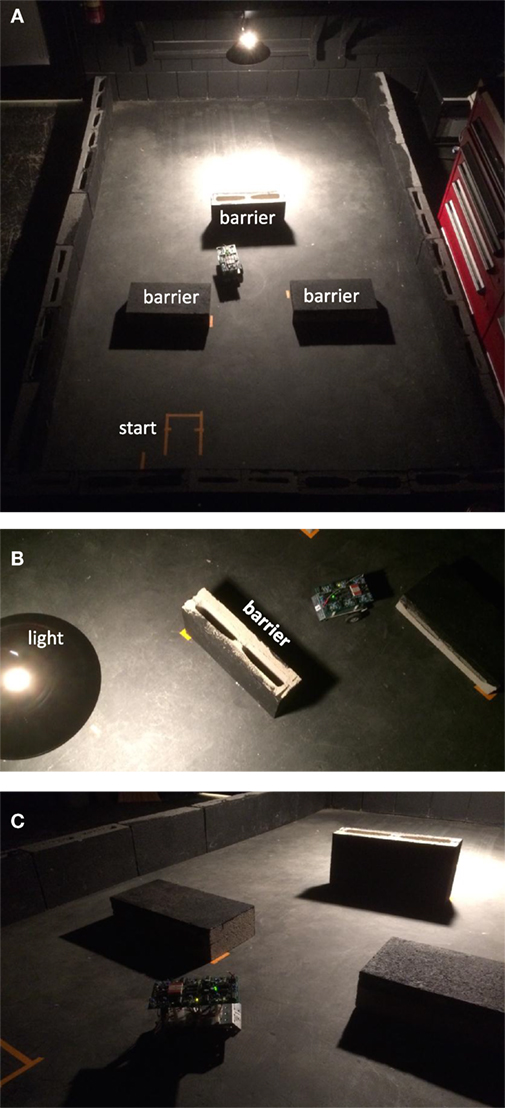
Figure 6. Selection environment for phototaxis with obstacle avoidance. (A) The environment consisted of a rectangular arena (1.8 × 2.8 m) with the perimeter ringed with cinder blocks (0.2 m height) painted matte black. Barriers inside were likewise painted cinder blocks. A single 100 W incandescent light hung 70 cm above the floor over one end of the arena. The starting position was in the dark area, away from the light. (B) Barriers were positioned to prevent any straight path from the start to the light. (C) Barriers cast a shadow. From the perspective of the robot, the light gradient includes the shadows associated with obstacles.
The task, environment, morphology, and fitness function combine to create a complex fitness landscape (Figure 7A). One virtue of simple Braitenberg-type vehicles is that their maximal performance is easy to predict, at least for circuits with just a few threads (Figure 7B). Since our primary goal was to examine the evolutionary impact of EOs, we sought to position our populations at a critical point on the fitness landscape; hence, populations with independent thread development (no EO) and with interactive thread development (EO) had their identical initial distributions of the number of threads with a mode of two threads and a range of one to three threads (Figure 7C). These genomes were randomly generated with a post hoc condition: at least one thread must connect a sensor to a motor. This screen was imposed because many genetically possible threads do not create a functional circuit; hence, we gave the populations, initially, mobility. As early as the third generation in both populations, some individuals lacked functional threads (details in Section “Results”). Because our mating algorithm (see Mating and Reproduction) kept these low-fitness individuals in the gene pool, they have an opportunity to mate. Thus, the experiments were run until mobility was lost. It is important to note that our goal was not to show adaptive evolution per se but rather to test the hypothesis that an EO can alter the evolutionary dynamics of a population of physically embodied robots.
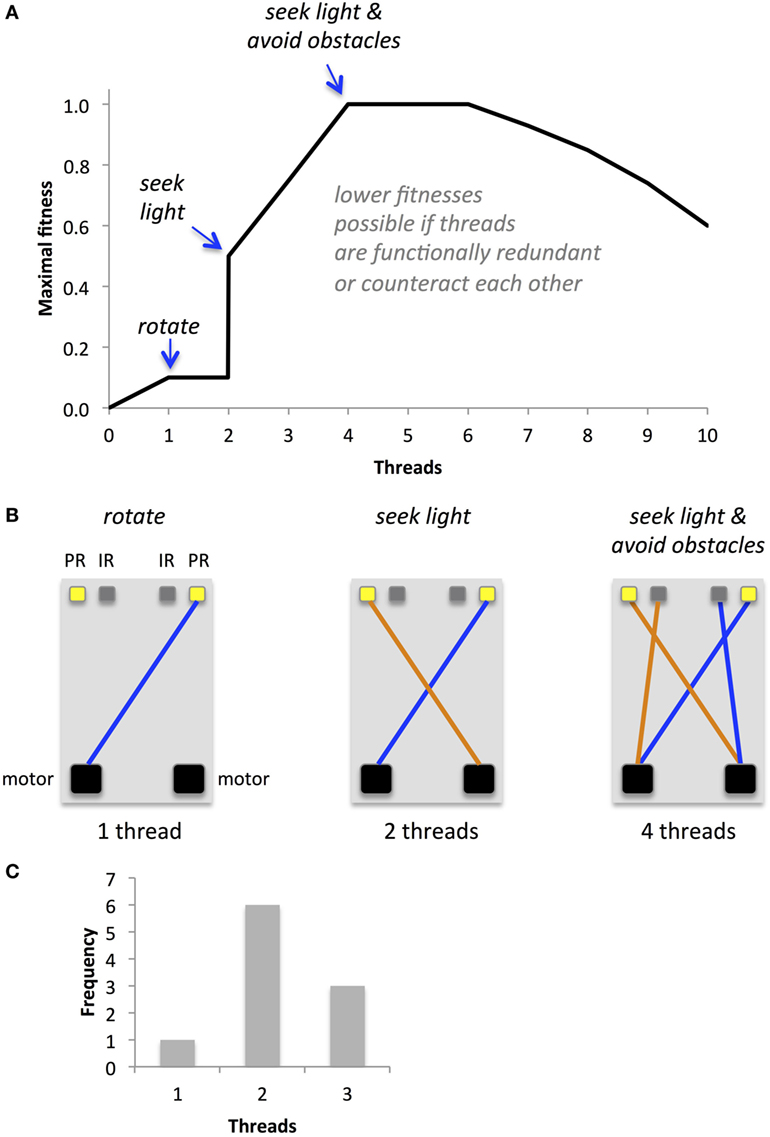
Figure 7. Predicted fitness landscape for Ana BBots. Because threads connect sensors to motors, they should be directly proportional to fitness, which is measured as the amount of light gathered. (A) The maximal fitness (relative units) depends in a non-linear way on the number of threads. (B) Optimal thread configurations for maximal fitness at a given thread number. A single thread connecting a photoresistor (PR) to the motor may allow the robot to rotate toward the light source, allowing for a small increase in fitness. Two threads connecting the photoresistors may create the equivalent of a Braitenberg vehicle IIB; the robot will move forward and orient toward the light until, in this environment, it encounters an obstacle. Four threads connecting the both photoresistors and IR sensors (IR) to the motors may allow the robot to move toward the light and avoid obstacles along the way. For thread numbers of two or higher, lower than maximal fitnesses may occur if threads are redundant in their function or if their functions counteract each other. (C) The starting distribution of operational threads for the two populations under selection, with and without an epigenetic operator, was identical.
During analysis of these selection experiments, five phenotypes in the second generation of the interactive thread development population were found to have threads prematurely terminated due to errors in the decoding process. Two of the five phenotypes lacked an additional motor connection, meaning their behavior, and thus their fitness, were possibly affected. This error was fixed in subsequent generations. We do not think that the error altered the evolutionary trajectory substantially, since the same trend is seen in the independent “no selection” trials.
We also ran trials without selection to test the effect of the EO without selection and to test the importance of constraining the crossover points to intergenic positions. Since these trials require no information about fitness (because there is no selection), they were run using the algorithms for mating, reproduction, and development.
For each statistical analysis, we ran a fully factorial analysis of variance (ANOVA) on SPSS (IBM, version 23). For all tests, the significance level was 0.05.
To complement the experiments on physical robots, we created and evolved simulated Ana BBots to further test the fundamental hypothesis that an EO will alter the evolutionary trajectory of a population. As with the physical robots, we select for enhanced phototaxis with object avoidance. We compare the evolutionary dynamics of populations of simulated robots with and without the interactive thread EO.
The simulated robots operated in a rectangular, walled enclosure modeled after the enclosure of its physical counterpart (Figure 8). The enclosure contained three obstacles between the robot and the light source. The robot was equipped with four sensors: two light sensors (placed at front left and front right) and two proximity sensors (placed at front left and front right). The intensity that a light sensor reads is 1/d2, where d is the distance from the sensor to the light source. Shadows of the obstacles were not simulated. The intensity that a proximity sensor reads is e, where e represents the length of a ray emitted by the sensor, determined by the first collision of the ray with an obstacle or the inside boundary of the arena. The robot had two wheels controlled by differential drive and an additional third caster wheel, used for balance.
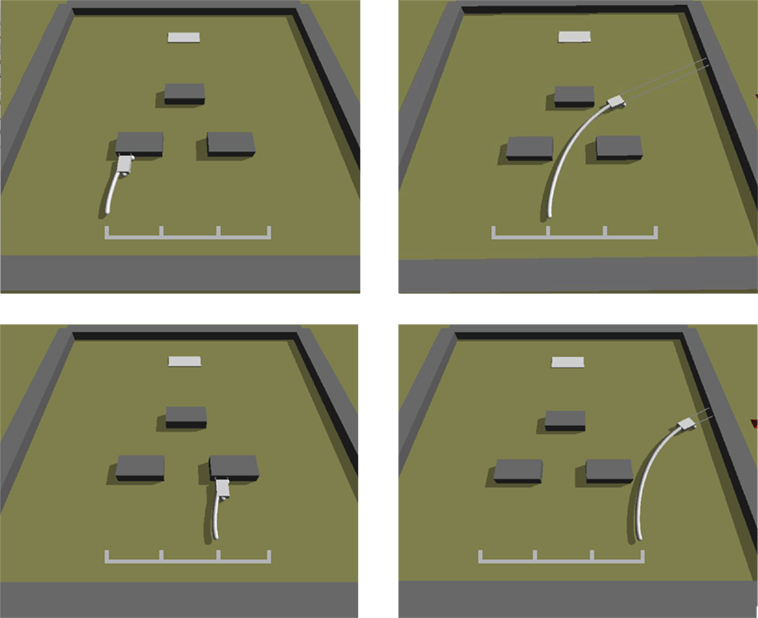
Figure 8. Simulated Ana BBots. As with the physical Ana BBots, the selection environment is phototaxis with obstacle avoidance. Dark gray objects represent the obstacles; the light gray object in the background represents the light source. The curved white lines represent the trajectory of the robot (small gray rectangle) from its starting position to where it stopped. The grid in the foreground indicates the four possible starting positions. In selection experiments, each controller was evaluated four times from four different starting conditions, as shown here for the single best controller evolved without the interactive thread epigenetic operator.
The ANN created to control the simulated robot modeled that of the Ana BBot, with four sensor nodes as inputs, four hidden nodes, analogous to the Ana BBot’s neurons, and two motor output nodes. Like the Ana BBot’s wires, connections in the ANN could occur from the sensor inputs to the motor outputs, the sensor inputs to the hidden nodes, the hidden nodes to each other, and the hidden nodes to the motor outputs. At each time step, the sensor nodes were set to the raw values of the sensors without normalization or thresholding. The hidden and motor nodes were updated according to the following:
where denotes the value of the ith node at the t-th time step, τi denotes the time constant controlling the rate of change of the ith node (here all τi = 0.3 following previous work), and wij denotes the weight of the connection from node j to node i.
The G → P mapping scheme used in the physical experiment was re-implemented in simulation as faithfully as possible. Genomic parameters were maintained across the physical and simulated experiments. Genomes were encoded as strings of 560 bits. These genomes dictated where connections should be added to the ANN. The procedure for building threads was the same as used for the Ana BBot (see Genome), with connections in the ANN equivalent to wires in the Ana BBot.
Similar to the process in the Ana BBot, development can fail in the following conditions: (1) its target location is outside the boundary of the pins; (2) the target pin is already occupied; or (3) the target location equals the starting position, in which case no movement need occur. In trials with the EO and without (labeled “GO”), the process terminates if it experiences condition (1). In the EO trials, it also terminates when it experiences conditions (2) and (3). In the GO trials, the developmental process will attempt to find an empty pin on that row. If it can, it attaches there. If it cannot, it terminates.
The weight of a connection from neuron j to neuron i is set to the following:
if there are one or more wires traveling from pin row j to pin row i, and wij = 0 otherwise. pik denotes the weight of a wire that originates on pin row j and pin column k, and pik = 0, if there is no wire emanating from pin row j and pin column k. Only valid pin row pairs are considered, where a valid pin row pair is one that connects a sensor pin row to a hidden pin row, a sensor pin row to a motor pin row, a hidden pin row to another hidden pin row (including its own pin row), or a hidden pin row to a motor pin row.
To increase the generality of these findings, we employed the standard AFPO algorithm (Schmidt and Lipson, 2011) to evolve the controllers. Each evolutionary trial began with a population of 50 random bitstrings. Each was converted into a controller and embedded in the simulated robot. The robot was then evaluated four times from four different starting positions (Figure 15). Each evaluation lasted 300 time steps. After evaluation, fitness was calculated as follows:
where LPet and RPet denote the values of the left and right photosensors in the e-th environment at the t-th time step, respectively.
After all 50 controllers were evaluated, the dominated individuals were deleted using fitness and age as the two objectives (fitness is maximized while age is minimized). The population was filled back up to 49 individuals by randomly choosing a non-dominated individual, copying it, mutating it, and placing it in the population. The 50th slot was filled with a random bitstring and assigned an age of 0. The next generation was then conducted and continued until 50 generations had elapsed.
Two sets of 30 independent evolutionary trials consisting of 500 generations each were conducted using the EO operator and GO operator, respectively.
The fitness of both populations of Ana BBots decreased significantly (p = 0.009) over generational time (Figure 9A) as determined by a 2 × 7 [Development Type (interactive, independent), Generation (1–7)] repeated-measures ANOVA. A priori contrasts detected a large and significant (p = 0.012) drop in fitness between generations 4 and 5; this drop in fitness may correspond to the predicted fitness “cliff” (see Figure 7). Counter to the hypothesis that the EO population should evolve differently under selection than the non-EO (also referred to as “GO”) population, there was no significant difference in fitness or the rate of change in fitness between the two (Figure 9B). To determine whether selection was present, we measured the selection differential, S, as the difference in average fitness between those parents chosen to mate and the average fitness of the parental generation. Selection was present but decreasing in magnitude over generational time (Figure 9C). The variance in fitness also decreased over generational time (Figure 9D), indicating that the convergence of performance onto less mobile robots was collapsing the possibilities upon which selection could act. Variance was highly correlated with S for both the independent thread (r = 0.982) and interactive thread (r = 0.974) groups. The experiment was terminated when none of the robots showed mobility.
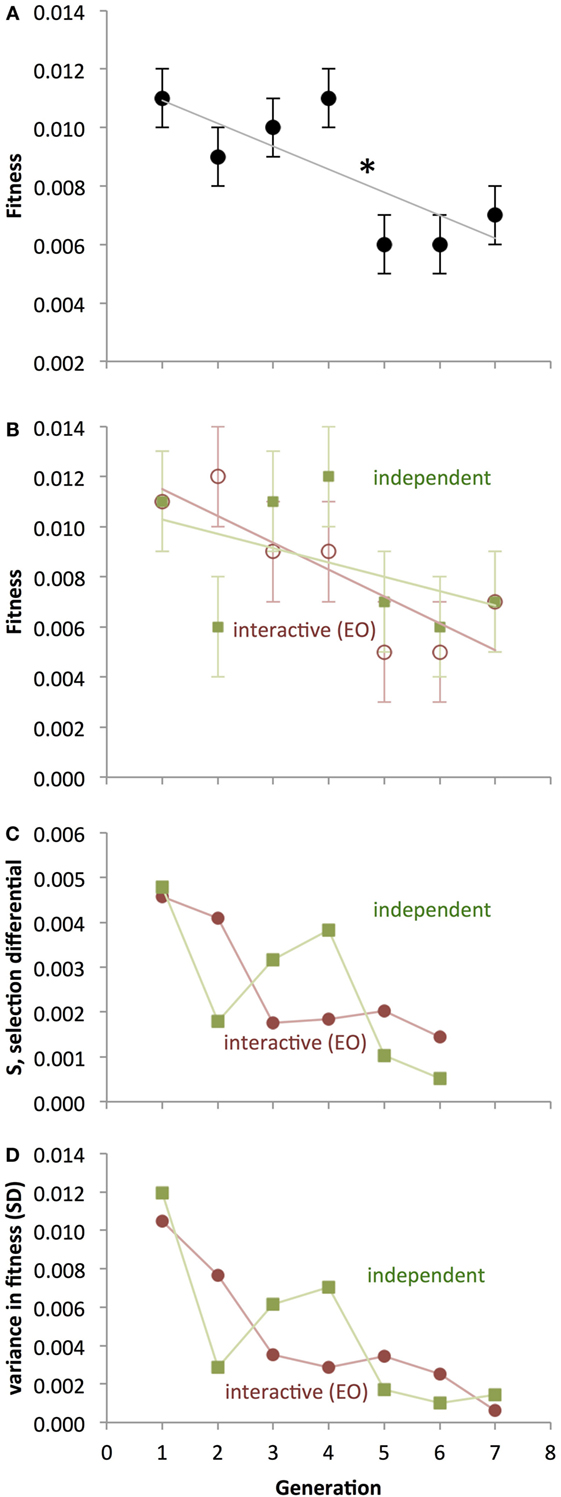
Figure 9. Evolution of physical Ana BBots under selection for enhanced phototaxis and obstacle avoidance. (A) As detected by ANOVA (p < 0.05), fitness decreases over generational time. A significant one-generation decrease between generations 4 and 5 (asterisk) is present as determined by a priori contrasts. Points are estimated marginal means ± 1 SE, with interactive and independent development pooled. (B) Interactive and independent thread developments are shown separately, even though they are not statistically distinct. (C) Selection differential, showing positive selection on fitness decreasing over generational time. The differential shown in a given generation is that applied to the next. (D) Variance in the populations, measured by SD, decreases by an order of magnitude over generational time. For the interactive development, the correlation between S and variance is 0.982; for independent development, the correlation is 0.974.
The hypothesis that the EO population should evolve differently under selection than the non-EO population was tested by examining four phenotypes that had a genetic basis: (1) the number of thread interactions, (2) the number of wire connections, (3) the number of threads, and (4) the number of crossover points. We tested the effects of selection, type of development, and generation with a 3 × 7 [Selection (selection, no-selection), Development Type (interactive, independent), Generation (1–7)] repeated-measures factorial analysis of variance (ANOVA). While 11 generations were run in the no-selection simulations, these data were truncated to 7 to facilitate comparison with the robot group.
In contrast with the results for fitness (see Evolution of Fitness), the phenotypes showed clear evidence of the impact of the EO development on evolution (Figure 10). For the number of thread interactions, there was a significant main effect of Selection (Figures 10A,B; p < 0.001), with the no-selection group having fewer interactions (M = 0.136) than the selection group (M = 0.750).
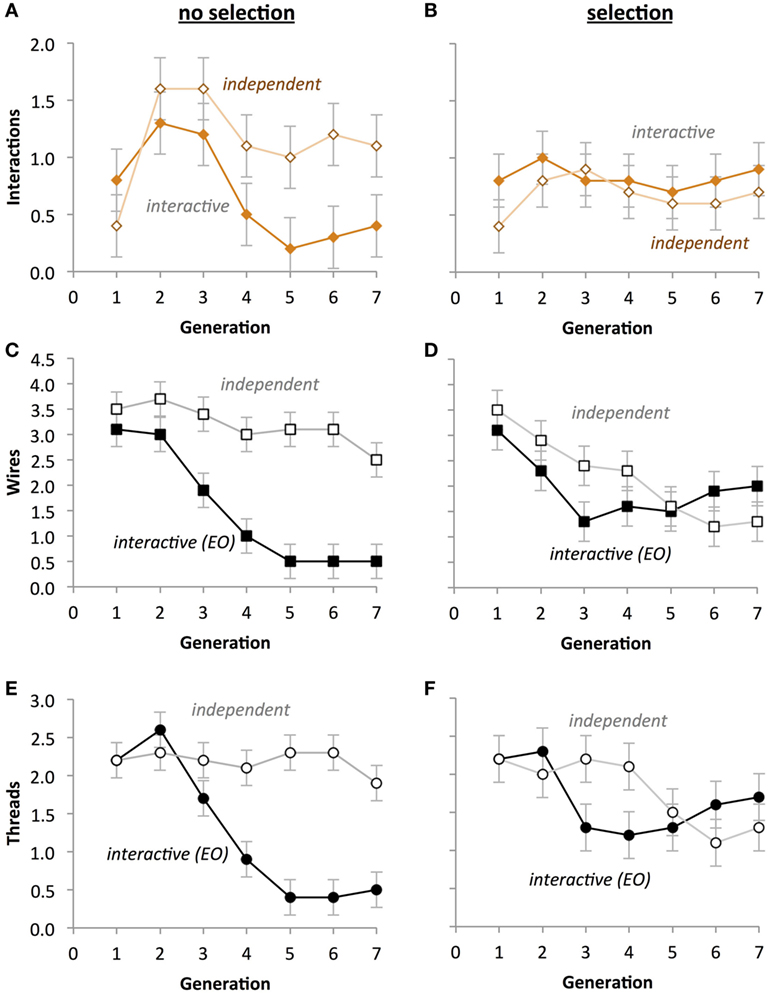
Figure 10. Selection impacts the evolution of circuit phenotypes in physical Ana BBots. (A,B) A significant two-way interaction (p < 0.05) between the type of evolution and the type of development (p < 0.05) indicates that under selection (B), the differences between developmental processes are eliminated. (C,D) A significant three-way interaction indicates that under selection, the number of wires in both types of development is not different and that the number of wires decreases over generational time. (E,F) A significant three-way interaction (p < 0.05) indicates that under selection the number of threads in both types of development is not different and that the number of threads decreases over generational time. A univariate three-way fully factorial ANOVA was run on each phenotype. Scale of the ordinate is identical across rows. Points are estimated marginal means ± 1 SE.
For the number of wires, there was a significant three-way interaction among Selection, Generation, and Development Type (p < 0.05; Figures 10C,D). This effect is due to the fact that there was a two-way interaction between Development Type and Generation for the no-selection condition (p = 0.003), but not one for the selection condition. Additionally there was a two-way interaction between Selection and Development Type on number of wires (p < 0.001) due to the interactive group having significantly smaller mean number of wires (M = 1.743, SD = 0.138) than the independent group (M = 3.257) in the no-selection condition, but there being no significant differences in the selection condition. There was a main effect of Development Type (p = 0.003) explained by the independent group having significantly more wires (M = 2.714) than the interactive group (M = 1.850) collapsed across Selection. Generation also had an effect on wire count (p < 0.001), with the tendency being that wire count decrease with successive generations. Additionally there was a main effect of Selection (p < 0.001), with the no-selection condition having significantly more wires (M = 2.500, SD = 2.064) than the selection condition (M = 2.064, SD = 0.097).
For the number of threads, there was a significant interaction between Selection, Generation, and Development Type (p < 0.05), with a significant interaction between Development Type and Generation in the no-selection condition (Figure 10E; p < 0.001), but not in the selection condition (Figure 10F; p = 0.095). Additionally there was a significant interaction between Generation and Development Type (p = 0.025) indicating that the trend of the interactive thread group’s means was to decrease with increasing generation, whereas the independent thread group’s means showed no clear trend in either direction. Development Type was also found to interact significantly with Selection (p < 0.001), explained by the interactive group’s mean thread count being higher in the selection (M = 1.665) condition than in the no-selection condition (M = 1.000), whereas the independent group’s means were lower in the selection condition (M = 1.771) than in the no-selection condition (M = 2.443). There was also a main effect of Development Type (p < 0.001), with the independent group on average having more threads (M = 2.107) than the interactive group (M = 1.329).
For the number of crossover points, there was a two-way interaction between Selection and Development Type (Figures 11A,B; p = 0.023); also, there was a significant difference between the interactive and independent groups for the selection condition (p < 0.001), but not for the no-selection condition (p = 0.715). Selection and Generation also interacted significantly on number of crossover points, p = 0.019, with crossover points increasing more rapidly with Generation in the selection condition than in the no-selection condition. Additionally, Development Type had a significant effect on crossover (p < 0.001), explained by the independent group having significantly higher means (M = 4.407) than the interactive group (M = 3.786). Generation also had a significant effect (p < 0.001), with crossover points tending to increase with increasing generations. There was also a main effect of Selection (p < 0.001), with the selection group having more crossover points (M = 4.464) than the no-selection group (M = 3.729).
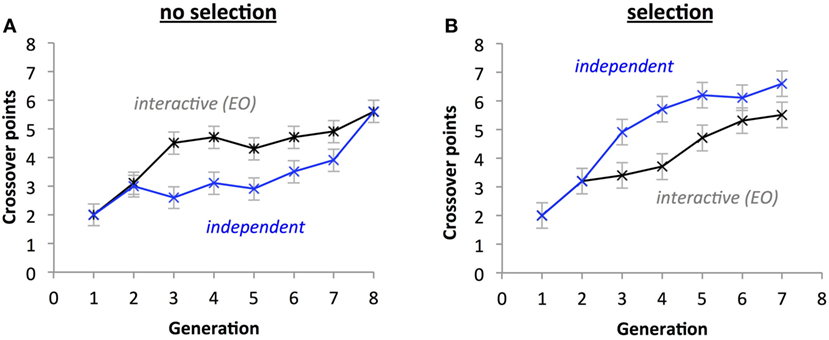
Figure 11. Selection impacts the evolution of the number of crossover points. A significant three-way interaction (p < 0.05) indicates that under selection (B) and independent thread development, the number of crossover points increases faster than without selection (A) and with interactive development. Points are estimated marginal means ± 1 SE.
Given the importance of threads to the function of the robot, we had predicted a fitness landscape (see Figure 7). We see a precipitous decline in the number of threads in the EO population (interactive thread development) under selection from generations 2 to 3 (Figure 10F) that corresponds to a drop in fitness in the EO population under selection from generations 2 to 3 (Figure 9B). We do not see a similar drop in the number of threads or fitness under selection in the non-EO population (independent thread development) until generations 4 to 5. Also note that without selection the number of threads in the EO population plummets (Figure 10E). While these are qualitative results, they are important for three reasons: (1) the number of threads appears to be related to fitness, (2) the EO population responds differently than the non-EO population, and (3) selection changes the behavior of the EO population markedly.
To examine the evolution of threads in more detail, we examined the changes in their distribution patterns over generational time (Figure 12). Under selection, the distribution of the EO population changes more quickly than that of the non-EO population, with the two populations having overlapping distributions but different modes and skew after seven generations. Without selection, we see a similar rapid response of the EO population and different final distributions.
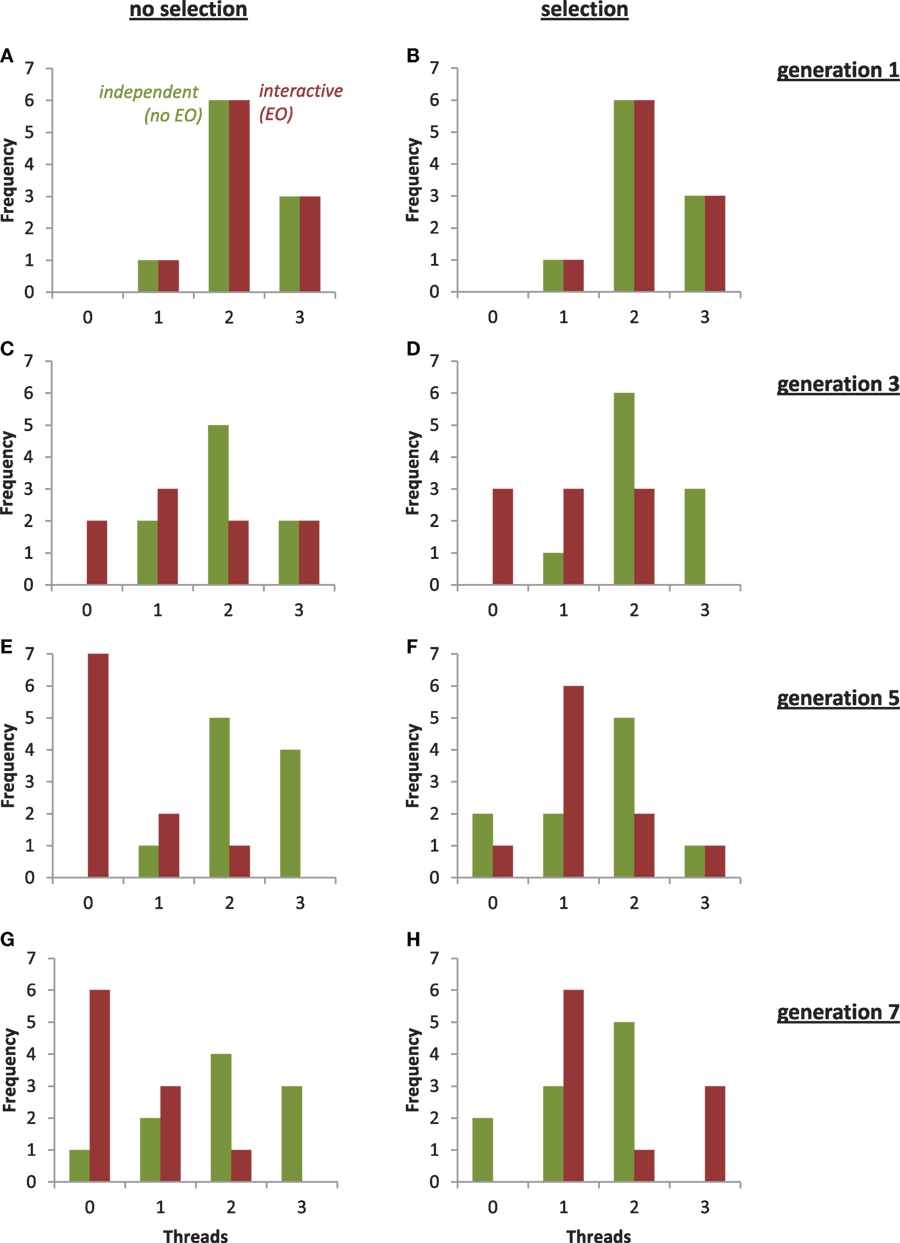
Figure 12. Evolution of threads in the populations of physical robots under selection and with two different types of development. From generations 1 to 7, the mode of the population with independent development and no epigenetic operator (no EO, green) remained stable at two threads, with or without selection. From generations 1 to 7, the mode of the population with interactive development and an EO (red) changed from 2 to 0 without selection and from 2 to 1 with selection. For clarity, an individual with four threads in the EO population was omitted from (D).
To understand the importance of our decision to allow crossover points to be anywhere in the genome, we constrained crossover points to positions between genes. These trials were run without selection. A 2 × 2 × 11 [Crossover Placement (constrained, unconstrained), Development Type (interactive, independent), Generation (1–11)] repeated-measures factorial ANOVA was run on the following measures: normalized performance, mean number of thread interactions, mean number of wires, mean number of crossover points, and mean number of threads. The genomic parameters of the “constrained” population were identical to those of the “unconstrained” population with the exception that crossover points were constrained to the intergenic regions in the former and not the latter.
For the number of interactions between threads, a significant Development Type by Generation interaction (p < 0.001) indicated that interactions generally decreased across generational time under interactive thread development, but tended to increase with generational time under independent thread development (Figures 13A,B). A Crossover Placement by Development Type interaction (p < 0.001) indicates that independent development populations have significantly more interactions (M = 1.300) than interactive development populations (M = 0.600), but only under unconstrained crossover placement. In general, interactive development populations had significantly more interactions (M = 1.159) than interactive development populations (M = 0.841; p < 0.001).
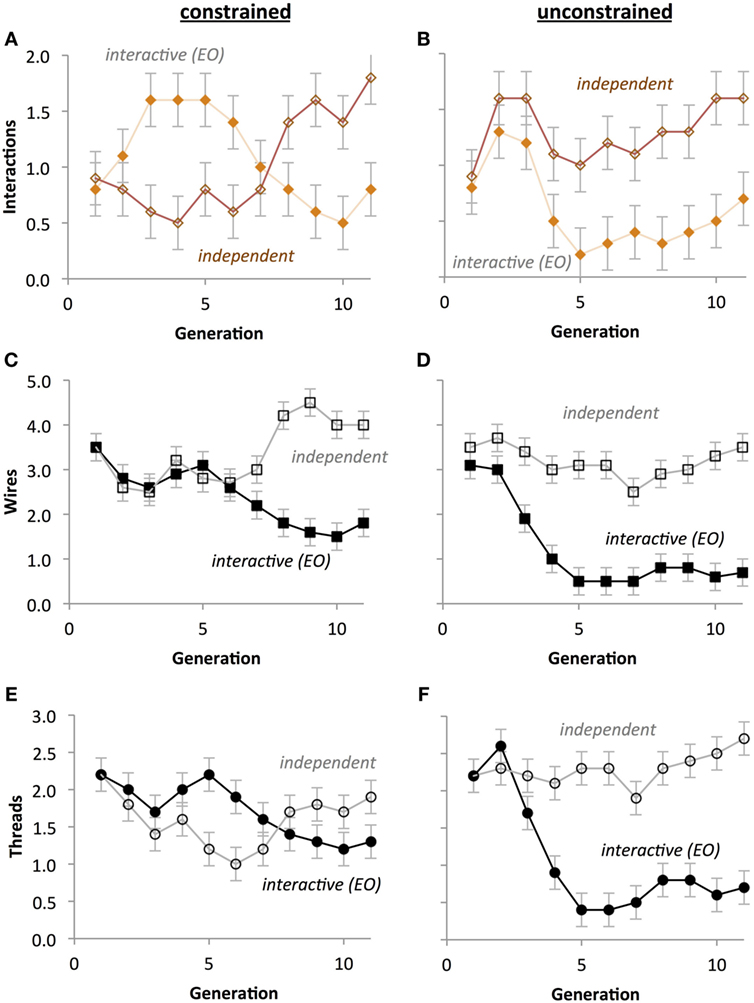
Figure 13. Crossover placement impacts the evolution of circuit phenotypes without selection. (A,B) Compared to unconstrained crossover points, constrained crossover points cause the number of interactions to evolve in anti-phase oscillation with respect to type of development. (C,D) Compared to unconstrained crossover points, constrained crossover points cause the number of wires in both types of development to evolve in concert and then rapidly diverge. (E,F) Compared to unconstrained crossover points, constrained crossover points cause the number of threads to evolve in anti-phase oscillation with respect to type of development. Scale of the ordinate is identical across rows. Points are estimated marginal means ± 1 SE.
For the number of wires, a significant three-way interaction between Crossover Placement, Development Type, and Generation on number of wires (p < 0.05) indicates that with constrained crossover placement the number of wires decreased more slowly for interactive thread development populations and increased less rapidly for independent thread populations (Figure 13C) when compared with unconstrained crossover placement (Figure 13D). There was a significant Development Type by Generation interaction (p < 0.001), indicating that wires tended to attenuate under interactive development, but stayed relatively stable under independent development. A significant Crossover Placement by Development Type interaction (p < 0.05) revealed a significantly larger gap in mean wires between independent development (M = 3.182) and interactive development (M = 1.218) under unconstrained crossover placement versus under constrained crossover placement (M = 3.364 and M = 2.400, respectively). The number of wires decreased with generation (p < 0.05), the independent group had significantly more wires (M = 3.273) than the interactive group (M = 1.809; p < 0.05), and that the mean number of wires was higher with constrained crossover placement (M = 2.882) than with unconstrained (M = 2.200; p < 0.05).
For the number of threads, a significant three-way interaction between Crossover Placement, Development Type, and Generation (p < 0.001) indicates that with interactive thread development, threads attenuated more rapidly under unconstrained crossover placement (Figure 13F) than constrained crossover placement (Figure 13E). A significant Development Type by Generation interaction (p < 0.001) reflects the tendency for thread count to decrease with generational time under interactive development, whereas thread count parabolically decreased then increased under independent development. There was also a Crossover Placement by Development Type interaction (p < 0.001), indicating that thread count is significantly higher under interactive development (M = 1.709) than independent development (M = 1.591) with constrained crossover placement, but significantly lower under unconstrained crossover placement (M = 1.055, M = 2.291, respectively). There was also a main effect of Generation (p < 0.05), reflecting the general upward parabolic change in thread count. Additionally, the independent development populations had significantly more threads (M = 1.941) than the interactive development populations (M = 1.382; p < 0.05).
For number of crossover points, a significant three-way interaction between Crossover Placement, Development Type, and Generation (p < 0.05) indicates that under unconstrained crossover, the number of crossover points generally increases faster with the interactive development group than with the independent group (Figure 14A), but this relationship switches with constrained crossover placement (Figure 14B). A significant two-way interaction between Development Type and Generation (p < 0.05) indicates that the independent development populations accrued crossover points more quickly than the interactive group. A significant Crossover Placement by Generation interaction (p < 0.05) indicates that populations with unconstrained crossover points accrue crossover points more rapidly than populations with constrained crossover points. In general, the number of crossover points increased across generations (p < 0.05) and populations with unconstrained crossover had more crossover points (M = 4.682) than constrained crossover populations (M = 3.041; p < 0.05).
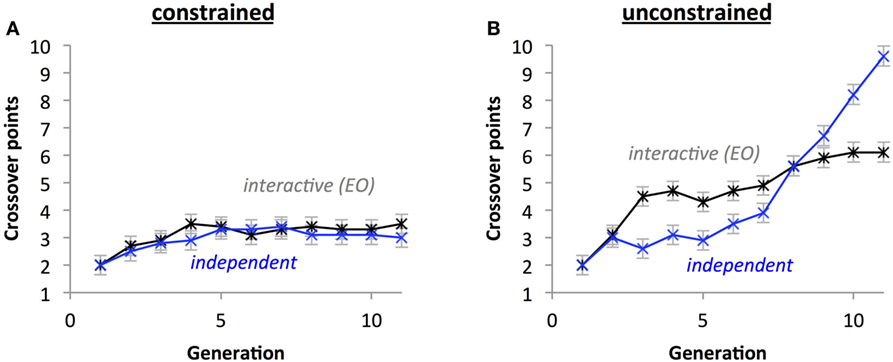
Figure 14. Crossover placement impacts the evolution of the crossover phenotypes without selection. With crossover placement constrained (A), the differences between types of development are eliminated and the growth of points over time is attenuated compared crossover placement being unconstrained (B). Points are estimated marginal means ± 1 SE.
A 2 × 500 [Development (EO, GO), Generation (1–500)] ANOVA revealed a main effect of Development (p < 0.001) and Generation (p < 0.001) on the fitness of the best individual in each population. There was no interaction effect (p = 0.175). These results (Figure 15) suggest that while the fitness of both types of simulated populations increased with successive generations, the EO significantly reduced fitness in comparison to the GO (non-EO) condition. Finally, note that while the fitness in the simulated populations increased over time, the fitness decreased over time in the physical populations (compare Figures 9 and 15).
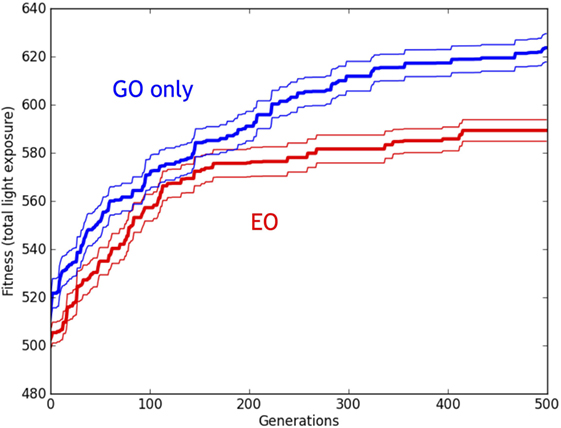
Figure 15. Evolution of simulated Ana BBots with and without epigenetic operators (EOs). Relative performance of the robots with genetic operator (GO) (blue lines) and EO (red lines). Thirty evolutionary trials of GO and EO were performed, for a total of 60 runs, each lasting for 500 generations. While populations with both types of development increased in fitness over time, the GO populations had fitnesses that were significantly greater than the EO populations, as detected by ANOVA (p < 0.05). Thick lines indicate the mean fitness of the best individual in the population, averaged across the trials. Thin lines indicate ±1 SE.
In addition to the standard GOs of ER, EOs are a complementary class of mechanisms that alter the expression of the genome. Physically embodied EOs, as we model them, may have important evolutionary consequences, as determined by the specific effect of the EO, the shape of the fitness landscape, and the position of the population on that landscape (Figure 1). With this model in mind, we hypothesized that an EO will alter the evolutionary trajectory of a population. This hypothesis is supported by the results of preliminary experiments in two populations of physically embodied robots, one with and one without an interactive thread development EO, under selection for enhanced phototaxis and obstacle avoidance.
The generality of this result is extended by experiments run in simulation. The difference between the physical and simulated robots in terms of the direction of the change in fitness (decrease for physical, increase for simulated, Figures 9 and 15, respectively) may reflect different effective algorithms for information transmission in the neural networks. In the physical robots, signaling is implemented in hardware, while in the simulated case we used standard neural network updating models rather than trying to simulate the electronic components on the Ana BBot. However, the key point of comparison is between the EO (a.k.a. interactive thread development) and non-EO (a.k.a. independent thread development or GO) conditions; for both simulated and physical systems we find that the EO condition degrades the effect of selection on the evolution of fitness and phenotypes, respectively. In this critical comparison, the two approaches produce consistent results.
While the changes in mean fitness are statistically indistinguishable in the EO and non-EO populations of physical robots (Figure 9), mean phenotypic values diverge quickly (Figures 10 and 11). Because of its functional role, the key phenotype is the number of threads, where threads are the genetically encoded wiring patterns that may connect sensors to motors on the robot’s physical circuit board (Figure 4). The distributions of thread number within each population are identical initially, in the first generation, but then they diverge rapidly (Figure 12). This rapid divergence occurs in EO populations both with and without selection, which indicates that the EO effect is not selection in disguise; moreover, the effects of EO and selection interact, in a statistical sense, which provides additional evidence supporting the main hypothesis (compare Figure 10E and Figure 10F). In this instance, differences in the evolution under selection of two otherwise identical populations appear to be caused by the embodied EO of interactive thread development (Figure 16).
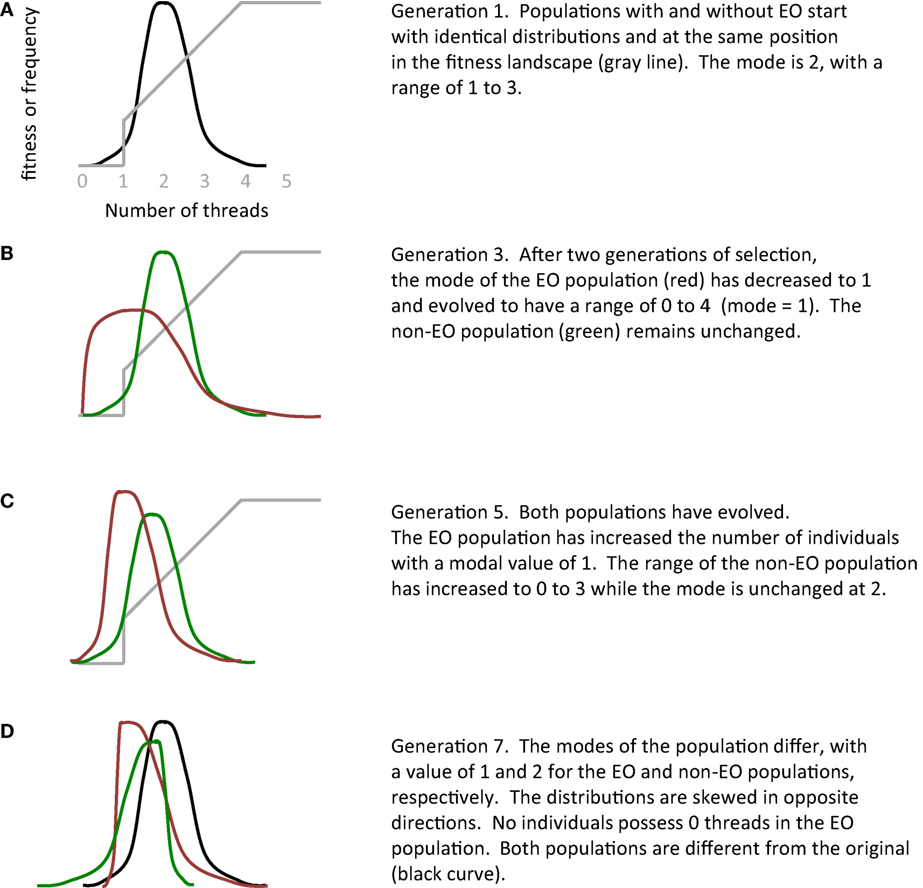
Figure 16. The epigenetic operator (EO) of interactive thread development alters evolution. In this qualitative summary of the experiments with physically embodied Ana BBots, the two genetically identical populations start with identical distributions in terms of the number of threads (A). Exposed to different parts of the fitness landscape (gray line), the two populations quickly diverge from each other (B–D). See Figure 12 for actual distributions.
From simulations, we have a complementary perspective from populations that are larger and evolve for much longer than those in the physical robots. Importantly, the hypothesis that an EO will alter the evolutionary trajectory of a population is upheld. In simulation, otherwise identical populations of Ana BBots with EOs evolve fitness more slowly and with lower magnitudes of fitness than those lacking them (Figure 15).
The populations of simulated Ana BBots with interactive thread EOs—a destructive process predicted to reduce the number of threads (Figure 1)—are less evolvable than populations without them. Although both the EO and GO treatments allow for large amounts of neutral mutation, which has been cited as a contributor to increased evolvability (Smith et al., 2001; Wagner, 2008), the GO treatment may allow for more connections to be constructed between the sensor and motor layers, or perhaps for more efficient, and less self-interfering, networks. This may in turn provide more raw materials for subsequent evolutionary change. By contrast, the EO treatment may produce fewer overall connections between sensor and motor layers, which may in turn make any subsequent mutations that change the nature of this path more disruptive. Future work will involve more detailed analysis of how such pathways in both treatments do change—or fail to change—over evolutionary time.
We note that the evolutionary impact of the interactive thread EO depends on the shape of the fitness landscape and the location of the populations on that landscape (Figure 7). For example, if we shifted the starting populations to the right on the fitness landscape, more threads result in a loss of fitness as threads are redundant in their function or if their functions counteract each other. In this situation, the interactive thread EO would increase the fitness of the populations by pruning threads. Thus the identical EO can have opposite effects on evolution depending on where a population sits in a particular fitness landscape.
As we have narrowly defined it, an EO may be any mechanism inherent to an agent’s developmental system that alters the expression of the genome. This leaves investigators with a daunting array of EOs from which to choose. To avoid an arbitrary decision, we let the physical embodiment of the Ana BBot (Figure 2) guide us. This is an analog robot that is programed using jumper wires to connect sensors to motors (Figure 3). With this in mind, we created a genome that encodes genes that governed multiple, separate wiring patterns called threads (Figure 4). Since only a limited set of pins is available for threads, we created an EO, interactive thread development, that recognized this physical constraint: if different genes code for the same pin, then only the first gene expressed may use it and the expression of the other gene is left incomplete. In development without this EO, all genes are fully expressed by allowing threads that call for the same pin to switch to an alternate and functionally equivalent pin.
We recognize that this developmental system is extremely simple, particularly when compared to one that changes full-body morphology in simulated, embodied mobile robots (Bongard, 2011). But to our knowledge, interactive thread development is the first physically embodied EO used in the evolution of physically embodied robots. Thus the developmental engine of ER (Eiben et al., 2010) has its first physical instantiation, albeit a simple one; physical instantiation is a necessary condition for the complete life cycle of the evolution of things (Eiben and Smith, 2015) and in the physical evolution of ontogenies (Northcutt, 2002).
Embodied development means different things in different contexts. For researchers interested in social and socially assistive robots (Tapus et al., 2007), for example, development focuses on learning and interactive changes in an agent’s cognition (Asada et al., 2001). Others focus on life cycle changes in an agent’s morphology (Jin and Meng, 2011; Doursat et al., 2012). For researchers interested in ER, changes in morphology during a digitally simulated embodied agent’s lifespan dramatically alter the impact of selection on the evolution of behavior (Bongard, 2011). To bridge the reality gap between the simulation of morphological changes and the physical instantiation of those changes, we can incorporate the methods of reconfigurable robots (Levi et al., 2014), self-assembling swarms (Rubenstein et al., 2014), and programmable matter (Toffoli and Margolus, 1991; Felton et al., 2014) to create PED. Combining PED with ER creates an approach, ERPED, exemplified in a preliminary and simple manner in this study.
We have shown that an EO alters the evolution of populations of physical and simulated embodied robots under selection for enhanced phototaxis and object avoidance. While we must be cautious in drawing general conclusions from this preliminary result, the specific method employed is easily extended to other physically embodied robotic systems. Necessary to this extension is to make development explicit, genetic, and physical. When the expression of genes is altered by the physical rules and interactions governing the agent’s physical construction, the genotype-to-phenotype mapping process becomes available as a creative tool to ER.
JBr, AH, and KL conceived of and designed the experiments. JBr and AH programed the genetic and epigenetic systems, and validation of the code was overseen by EA and JL. JBr and AH ran the experiments and reduced the data on the physical robots. JL analyzed the results. JBr and JBo designed, built, ran, and analyzed the simulation. All the authors contributed to the writing of the manuscript.
The authors declare that the research was conducted in the absence of any commercial or financial relationships that could be construed as a potential conflict of interest.
Larry Doe was invaluable to the maintenance and modification of the Ana BBot. John Connell of Johuco Ltd. developed the Ana BBot and provided high-quality schematics. Nick Livingston provided invaluable assistance in the development of the project and revision of the manuscript. Anton Bernatskiy provided critical assistance in developing the simulation.
This work was funded by the U.S. National Science Foundation (grant no. 1344227, INSPIRE, Special Projects).
Amundson, R. (2005). The Changing Role of the Embryo in Evolutionary Thought: Roots of Evo-Devo. Cambridge, UK: Cambridge University Press.
Asada, M., MacDorman, K. F., Ishiguro, H., and Kuniyoshi, Y. (2001). Cognitive developmental robotics as a new paradigm for the design of humanoid robots. Rob. Auton. Syst. 37, 185–193. doi: 10.1016/S0921-8890(01)00157-9
Bongard, J. C. (2002). “Evolving modular genetic regulatory networks,” in Proceedings of the 2002 Congress on Evolutionary Computation, Honolulu, HI.
Bongard, J. C. (2011). Morphological change in machines accelerates the evolution of robust behavior. Proc. Natl. Acad. Sci. U.S.A. 108, 1234–1239. doi:10.1073/pnas.1015390108
Bongard, J. C., and Pfeifer, R. (2003). “Evolving complete agents using artificial ontogeny,” in Morpho-Functional Machines: The New Species, ed. F. Hara (Japan: Springer), 237–258.
Carroll, S. B. (2008). Evo-devo and an expanding evolutionary synthesis: a genetic theory of morphological evolution. Cell 134, 25–36. doi:10.1016/j.cell.2008.06.030
Doursat, R., Sayama, H., and Michel, O. (eds). (2012). Morphogenetic Engineering: Toward Programmable Complex Systems. Berlin: Springer.
Eiben, A. E., Haasdijk, E., and Bredeche, N. (2010). “Embodied, on-line, on-board evolution for autonomous robotics,” in Symbiotic Multi-Robot Organisms: Reliability, Adaptability, Evolution, Vol. 7, 361–382.
Eiben, A. E., and Smith, J. (2015). From evolutionary computation to the evolution of things. Nature 521, 476–482. doi:10.1038/nature14544
Felton, S., Tolley, M., Demaine, E., Rus, D., and Wood, R. (2014). A method for building self-folding machines. Science 345, 644–646. doi:10.1126/science.1252610
Floreano, D., Dürr, P., and Mattiussi, C. (2008). Neuroevolution: from architectures to learning. Evol. Intell. 1, 47–62. doi:10.1007/s12065-007-0002-4
Garstang, W. (1922). The theory of recapitulation: a critical re-statement of the biogenetic law. J. Linn. Soc. Lond. Zool. 35, 81–101. doi:10.1111/j.1096-3642.1922.tb00464.x
Gilbert, C. D., and Wiesel, T. N. (1992). Receptive field dynamics in adult primary visual cortex. Nature 356, 150–152. doi:10.1038/356150a0
Gruau, F. (1994). Automatic definition of modular neural networks. Adapt. Behav. 3, 151–183. doi:10.1177/105971239400300202
Jin, Y., and Meng, Y. (2011). Morphogenetic robotics: an emerging new field in developmental robotics. IEEE 41, 145–160. doi:10.1109/TSMCC.2010.2057424
Kitano, H. (1990). Designing neural networks using genetic algorithms with graph generation system. Complex Syst. J. 4, 461–476.
Levi, P., Meister, E., and Schlachter, F. (2014). Reconfigurable swarm robots produce self-assembling and self-repairing organisms. Rob. Auton. Syst. 62, 1371–1376. doi:10.1016/j.robot.2014.07.001
Livingston, N., Bernatskiy, A., Livingston, K., Smith, M., Schwarz, J., Bongard, J., et al. (2016). Modularity and sparsity: evolution of neural net controllers in physically embodied robots. Front. Robot. AI 3:75. doi:10.3389/frobt.2016.00075
Long, J. H., Koob, T. J., Irving, K., Combie, K., Engel, V., Livingston, N., et al. (2006). Biomimetic evolutionary analysis: testing the adaptive value of vertebrate tail stiffness in autonomous swimming robots. J. Exp. Biol. 209, 4732–4746. doi:10.1242/jeb.02559
Mattiussi, C., Marbach, D., Dürr, P., and Floreano, D. (2008). The age of analog networks. AI Mag. 29, 63.
Northcutt, R. G. (2002). Understanding vertebrate brain evolution. Integr. Comp. Biol. 42, 743–756. doi:10.1093/icb/42.4.743
Pfeifer, R., and Bongard, J. (2006). How the Body Shapes the Way We Think: A New View of Intelligence. Cambridge: MIT Press.
Pfeifer, R., Lungarella, M., and Iida, F. (2007). Self-organization, embodiment, and biologically inspired robotics. Science 318, 1088–1093. doi:10.1126/science.1145803
Pigliucci, M. (2010). Genotype-phenotype mapping and the end of the ‘genes as blueprint’ metaphor. Biol. Sci. 365, 557–566. doi:10.1098/rstb.2009.0241
Roberts, S. F., Hirokawa, J., Rosenblum, H. G., Sakhtah, H., Gutierrez, A. A., Porter, M. E., et al. (2014). Testing biological hypotheses with embodied robots: adaptations, accidents, and by-products in the evolution of vertebrates. Front. Robot. AI 1:12. doi:10.3389/frobt.2014.00012
Rubenstein, M., Cornejo, A., and Nagpal, R. (2014). Programmable self-assembly in a thousand-robot swarm. Science 345, 795–799. doi:10.1126/science.1254295
Schmidt, M., and Lipson, H. (2011). “Age-fitness pareto optimization,” in Genetic Programming Theory and Practice VIII (New York: Springer), 129–146.
Smith, T., Husbands, P., and O’Shea, M. (2001). “Neutral networks and evolvability with complex genotype-phenotype mapping,” in European Conference on Artificial Life (Berlin, Heidelberg: Springer), 272–281.
Stanley, K. O. (2007). Compositional pattern producing networks: a novel abstraction of development. Genet. Programm. Evol. Mach. 8, 131–162. doi:10.1007/s10710-007-9028-8
Stanley, K. O., D’Ambrosio, D. B., and Gauci, J. (2009). A hypercube-based encoding for evolving large-scale neural networks. Artif. Life 15, 185–212. doi:10.1162/artl.2009.15.2.15202
Tapus, A., Mataric, M. J., and Scassellati, B. (2007). Socially assistive robotics. IEEE Robot. Auto. Mag. 14, 35. doi:10.1109/MRA.2007.339605
Toffoli, T., and Margolus, N. (1991). Programmable matter: concepts and realization. Phys. D 47, 263–272. doi:10.1016/0167-2789(91)90296-L
Wagner, A. (2008). Neutralism and selectionism: a network-based reconciliation. Nat. Rev. Genet. 9, 965–974. doi:10.1038/nrg2473
Keywords: epigenetic operators, evolutionary robotics, development, genotype–phenotype mapping, physically embodied robots
Citation: Brawer J, Hill A, Livingston K, Aaron E, Bongard J and Long JHJ (2017) Epigenetic Operators and the Evolution of Physically Embodied Robots. Front. Robot. AI 4:1. doi: 10.3389/frobt.2017.00001
Received: 21 April 2016; Accepted: 03 January 2017;
Published: 24 January 2017
Edited by:
Geoff Nitschke, University of Cape Town, South AfricaReviewed by:
Evert Haasdijk, VU University Amsterdam, NetherlandsCopyright: © 2017 Brawer, Hill, Livingston, Aaron, Bongard and Long This is an open-access article distributed under the terms of the Creative Commons Attribution License (CC BY). The use, distribution or reproduction in other forums is permitted, provided the original author(s) or licensor are credited and that the original publication in this journal is cited, in accordance with accepted academic practice. No use, distribution or reproduction is permitted which does not comply with these terms.
*Correspondence: Jake Brawer, amFrZS5icmF3ZXJAeWFsZS5lZHU=
Disclaimer: All claims expressed in this article are solely those of the authors and do not necessarily represent those of their affiliated organizations, or those of the publisher, the editors and the reviewers. Any product that may be evaluated in this article or claim that may be made by its manufacturer is not guaranteed or endorsed by the publisher.
Research integrity at Frontiers

Learn more about the work of our research integrity team to safeguard the quality of each article we publish.