 Leonn Mende Soares Pereira1,2
 Rafaella do Nascimento Ferreira1,2
 Vânia Nakauth Azevedo1
 Maria Alice Freitas Queiroz1,2
 Carlos Willian Dias Dantas3
 Rommel Thiago Jucá Ramos3
 Sandro Patroca da Silva4
 Carlos Araújo da Costa5
 Maisa Silva de Sousa5
 Izaura Maria Vieira Cayres Vallinoto1,2
 Ana Cecília Ribeiro Cruz4
 Antonio Carlos Rosário Vallinoto1,2*
- 1Laboratório de Virologia, Instituto de Ciências Biológicas, Universidade Federal do Pará, Belém, Pará, Brazil
- 2Programa de Pós-graduação em Agentes Infecciosos e Parasitários, Universidade Federal do Pará, Belém, Pará, Brazil
- 3Faculdade de Biotecnologia, Instituto de Ciências Biológicas, Universidade Federal do Pará, Belém, Pará, Brazil
- 4Seção de Arbovirologia do Instituto Evandro Chagas, Ananindeua, Pará, Brazil
- 5Núcleo de Medicina Tropical, Universidade Federal do Pará, Belém, Pará, Brazil
In this study, we aimed investigated the differential gene expression profiles of samples from uninfected individuals (control group) and study groups of asymptomatic human T-lymphotropic virus 1 (HTLV-1) carriers and patients with HTLV-1-associated myelopathy (HAM) by exploratory RNA sequencing (RNA-Seq) analysis. The gene expression profiles of individuals in the asymptomatic group were represented by 3 genes, most associated with cell cycle regulation. The gene expression profiles of individuals in the HAM group were represented by 12 genes, the majority of which are associated with the immune response. The HLA-A gene and the non-coding RNA LINC02470 were upregulated in the asymptomatic and HAM groups. The HLA-DQB1 and HLA-C genes were downregulated in the asymptomatic and HAM groups. In this pilot study, although limited in terms of methodological rigor, we showed differential gene expression profiles in different clinical groups of HTLV-1 infection. However, further studies are needed to confirm these findings.
1 Introduction
Human T-lymphotropic virus (HTLV) is a deltaretrovirus (International Committee on Taxonomy of Viruses- ICTV, 2022), with approximately 10 million individuals infected worldwide. HTLV-1 infection is most prevalent and considered endemic in parts of southwestern Japan, sub-Saharan Africa, South America, the Caribbean, the Australo-Melanesia region and some regions in the Middle East (Eusebio-Ponce et al., 2019). The second most prevalent type of HTLV infection, HTLV-2 infection, has a limited distribution among intravenous drug users in the United States, Europe, and Southeast Asia and among Native Americans from North America to South America (Ishak et al., 2020).
Brazil is a country with a high prevalence of HTLV infections (700 thousand to 2 million infected individuals) (Miranda et al., 2022). The State of Pará (northern Brazil) is the site of most epidemiological studies of HTLV infection in the Brazilian Amazon region to date and has a variety of different populations, with prevalence rates ranging from 0.3% to more than 30% and infections occurring mainly in indigenous populations (Abreu et al., 2022; Brito et al., 2022; de Lima et al., 2022; Lopes et al., 2022).
HTLV-1 is associated with inflammatory or lymphoproliferative diseases; two such diseases, i.e., adult T-cell leukemia/lymphoma (ATLL) and HTLV-1-associated myelopathy (HAM) are clearly related to the virus, as are other diseases, such as uveitis, dermatitis, strongyloidiasis and tuberculosis (Eusebio-Ponce et al., 2019). Activation of viral genes, such as Tax and HBZ, may be partially related to the pathogenicity of HTLV-1 (Martinez et al., 2019; Brites et al., 2021). However, from the host perspective, the need to understand the factors that trigger different clinical outcomes remains (Vallinoto et al., 2019; Forlani et al., 2021).
In the genomic era, RNA sequencing (RNA-Seq) approaches for obtaining transcriptomes are tools with great potential for answering challenging questions about gene expression profiles of organisms under different conditions and at specific developmental stages and are applied in the analysis of various pathological conditions (Girgenti and Duman, 2018; Schwartz and Stern-Ginossar, 2019). For example, a differential transcriptome of nuclear and cytoplasmic factors that correlates with Tax protein activity has been observed in cell lines transformed by HTLV-1 (Singh et al., 2011). In ATLL models, integrated molecular analyses have revealed transcriptomic abnormalities involving key genes related to cell proliferation, with proliferative potential being associated with specific mutation patterns (Kataoka et al., 2015; Yamagishi et al., 2021).
Microarray analysis has shown that the gene expression of intermediary regulators of the immune response, proliferation and cell migration is increased in individuals with HAM, and the activation of apoptosis factors is likely to regulate signaling involving the proteins encoded by these genes (Menezes et al., 2017; Mozhgani et al., 2019).
In a relatively recent study, a greater number of differentially expressed protein-coding genes were identified and a broader quantitative range of changes in expression levels was detected by RNA-Seq than by microarray analysis in a toxicogenomic evaluation of rat liver tissue (Rao et al., 2018). Specifically, regarding HTLV-1 infection, a meta-analysis revealed that microarray technology can indeed be used to simultaneously measure the expression of tens of thousands of genes in different tissue samples in a cost-effective and high-throughput manner (Jeffery et al., 1999). However, as the results of microarray analysis may not be reproducible or may be influenced by disordered data, the RNA-Seq technique appears to be satisfactory for our research purposes.
In this study, we sought to obtain differential gene expression profiles via exploratory RNA-Seq analysis of samples from HTLV-1-infected individuals (with asymptomatic infection and with HAM) and uninfected individuals inhabiting the Brazilian Amazon region, aiming to identify markers related to the pathogenesis of and/or immune response to HTLV-1 infection.
2 Materials and methods
2.1 Sampling and ethical aspects
Blood samples collected in tubes containing ethylenediamine tetraacetic acid (EDTA) from 18 individuals treated at the Ambulatory of the Tropical Medicine Center of the Federal University of Pará (NMT/UFPA) and at the Fundação Centro de Hematologia e Hemoterapia do Estado do Pará (HEMOPA) were used for this study.
The individuals were over 18 years of age, of both sexes, had laboratory confirmation of HTLV-1 infection with or without clinical indications of HAM and were not being treated with antiretroviral drugs and/or glucocorticoids. The control group was composed of voluntary blood donors who were seronegative for HTLV-1/2. All individuals belonged to the population of the capital Belém (Pará State) and were ethnically characterized as being of mixed race.
The project was approved by the Ethics Committee for Research with Human Beings of the Institute of Health Sciences of the Federal University of Pará (CAAE: 73782017.8.0000.0018).
2.2 DNA and RNA extraction
Total DNA was extracted from peripheral blood using a PureLink® Genomic DNA Mini Kit (Thermo Fisher Scientific, Waltham, MA, United States) following the manufacturer’s protocol.
RNA was extracted from blood samples using a TRIzol™ Plus RNA purification kit (Thermo Fisher Scientific, Waltham, Massachusetts, United States).
2.3 Quantification of leukocytes and the HTLV-1 proviral load
Leukocytes were quantified using a BC-2800Vet hematology analyzer (Mindray, Shenzhen, China) following the manufacturer’s recommendations.
The viral load was quantified by qPCR using three target sequences synthesized with the TaqMan® system (Life Technologies, Carlsbad, California, United States) according to a previously described protocol (Tamegão-Lopes et al., 2006). The values obtained were adjusted with respect to the leukocyte count per mm3.
2.4 RNA purification and sequencing
Extracted RNA was purified using a PureLink RNA Mini Kit (Thermo Fisher Scientific, Waltham, Massachusetts, United States) following the manufacturer’s recommendations.
After purification, the RNA was quantified using a Qubit RNA HS Assay Kit and a Qubit 4.0 fluorometer (Thermo Fisher Scientific, Waltham, Massachusetts, United States). For qualitative analysis of RNA, the integrity of the extracted RNA considering the RNA integrity number (RIN) was determined with Bioanalyzer equipment using an Agilent RNA 6000 Pico Kit (Agilent, Saint Clara, California, United States); RNA transcripts with RIN values of less than 7 were disregarded for downstream analyses.
An RNA library was prepared following the guidelines of the SureSelect Strand-Specific RNA Library Prep System Kit (Agilent, Saint Clara, California, United States) and subjected to paired-end sequencing (2 × 100) on the NextSeq 500 platform (Illumina, San Diego, California, United States) with the NextSeq 500/550 High Output Kit v2.5 (300 cycles) according to the manufacturer’s recommendations.
2.5 Data analysis
The raw sequencing data were analyzed with the miRNA-Seq and RNA-Seq Multiprocess Analysis (miARma-Seq) pipeline using edgeR software for differential expression analysis and the criterion of a false discovery rate (FDR) ≤ 0.05 (Andrés-León and Rojas, 2019). We based our analysis on the reference human genome GRCh38. p13 in the National Center for Biotechnology Information (NCBI) database. The data generated in this study were uploaded to the NCBI public database under accession code GSE224047. Quality control data is available as Supplementary Data S1. Significant gene expressions were represented in reads per million mapped reads (RPKM) in boxplot graphs, showing the medians, their respective interquartile ranges and outliers.
Interprotein interaction networks (interactomes) were inferred using Cytoscape 3.9.1 software (Seattle, Washington, United States) with the GeneMANIA database as a search source; we opted for resulting networks with a maximum of fifty functionally enriched genes and the option of automatic weighting for the selection of networks. Network modularization was carried out using clusterMaker and the MCODE clustering algorithm, followed by selection of the largest network as the main highlight.
Venn diagrams were generated via the Lucidchart website (Utha, United States) according to the number of biological functions of the inferred genes in each network. GraphPad Prism 8.0 software (San Diego, California, United States) was used to graphically visualize gene expression. Multivariate clustering was applied to evaluate similarities between the differential gene expression profiles of the groups, with Ward’s method used for agglomeration, selection of the type of Euclidean distance and standardization of the variables (Ayres et al., 2008). Comparison of the proviral load among the groups was performed using the Mann‒Whitney test (Ayres et al., 2008).
3 Results
3.1 Sample integrity
Among the samples from the 18 subjects, a satisfactory RIN for downstream analyses was obtained for 10 samples: 4 from participants with HAM, 3 from asymptomatic individuals and 3 from individuals in the control group. All individuals with HTLV-1 infection were female; in the control group, two individuals were male (Supplementary Table S1). The log10 values of the proviral load in patients with HAM (4.71 (4.60–4.75)) were greater than those of asymptomatic individuals (0.90 (0.49–1.61); p = 0.0209).
When comparing the groups, we disregarded sex-linked genes (Supplementary Table S2), resulting in a set of 11,946 genes with differential expression (as determined by the fold change (FC) values). A total of 457 of these genes were significantly differentially expressed among the comparison groups, but only 21 genes had an FDR≤ 0.05, as explained below. Principal component cluster analysis (PCA) showed that not all samples were grouped into the same class, however, we observed a tendency for patient samples to cluster in different quadrants from the control group (Figure 1A).
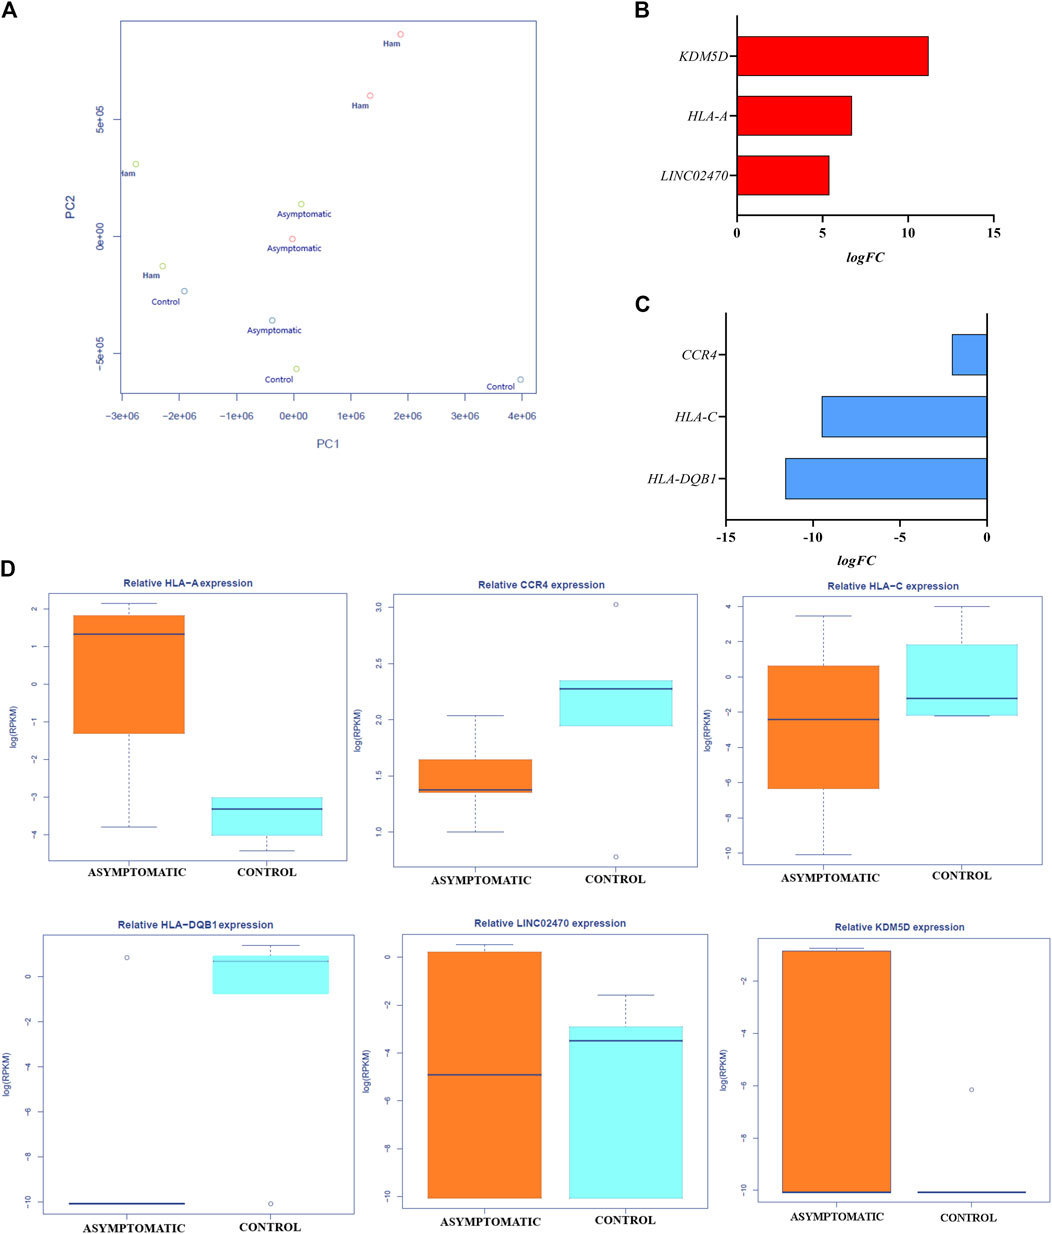
Figure 1. Differential gene expression and profiles in the asymptomatic group vs the control group: (A) Principal component analysis graph showing the distribution and clustering of patients in each group. (B) Genes upregulated in the asymptomatic group compared to the control group. (C) Genes downregulated in the asymptomatic group compared to the control group. (D) Expression data presented as the log(RPKM) values of all genes differentially expressed in peripheral blood between the asymptomatic and control groups.
3.2 Differential expression between the control group and the asymptomatic group
In the comparison between the control group and the asymptomatic group, 6 genes had an FDR≤0.05, of which 3 were upregulated (Figure 1B) and 3 were downregulated (Figure 1C) in the asymptomatic group. Among the upregulated genes, lysine demethylase 5 days (KDM5D) was upregulated by approximately 11-fold (logFC: 11.20; p = 1.33–07; FDR: 0.0002), human leukocyte antigen of the A locus (HLA-A) was upregulated by approximately 7-fold (logFC: 6.72; p = 5.54–06; FDR: 0.032), and the noncoding gene LINC02470 was upregulated by approximately 5-fold (logFC: 5.40; p = 4.76–06; FDR: 1.86–05). Among the downregulated genes, a chemokine receptor gene (CCR4) was downregulated by approximately 2-fold (logFC: −2.01; p = 3.86–05; FDR: 0.03), human leukocyte antigen of the C locus (HLA-C) was downregulated by approximately 10-fold (logFC: −9.5; p = 2.02–06; FDR: 0.02), and human leukocyte antigen of the DQB1 locus (HLA-DQB1) was downregulated by approximately 12-fold (logFC: −11.6; p = 7.49–06; FDR: 0.007). Figure 1D shows the gene expression data as the RPKM values for all genes differentially expressed in peripheral blood between the asymptomatic and control groups.
3.3 Differential expression between the control group and the group with HAM
In the comparison between the control group and the HAM group, 13 genes exhibited an FDR≤0.05, 9 of which were upregulated (Figure 2A) and 4 of which were downregulated (Figure 2B) in the HAM group. Among the upregulated genes, human leukocyte antigen of the DRB3 locus (HLA-DRB3) was upregulated by approximately 11-fold (logFC: 11.28; p = 2.95–24; FDR: 1.7–20), and C-type lectin domain family gene 12 (CLEC12A) was upregulated by approximately 2-fold (logFC: 1.83; p = 0.005; FDR: 0.01). Among the downregulated genes, plakoglobin (JUP) was downregulated by approximately 2-fold (logFC: −1.71; p = 8.1–05; FDR: 0.037), and HLA-DQB1 was downregulated by approximately 10-fold (logFC: −10.49; p = 2.35–05; FDR: 0.012). Figure 2C shows the gene expression data as the RPKM values of all genes differentially expressed in peripheral blood between the control and HAM groups.
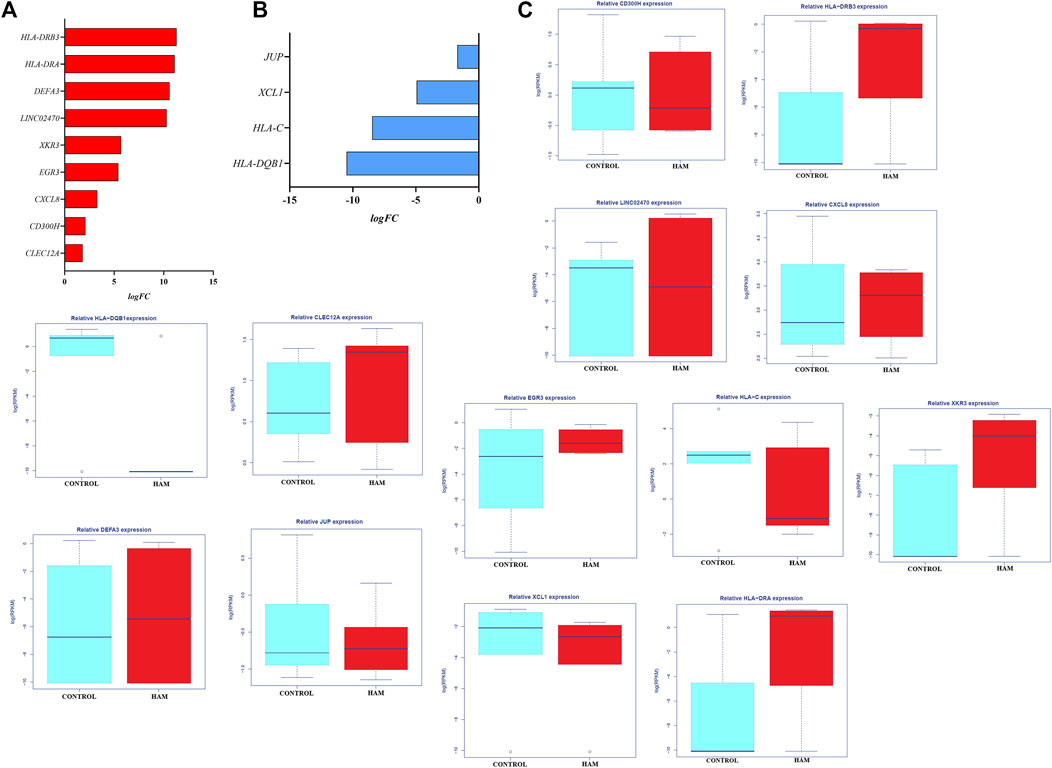
Figure 2. Gene expression profiles in the HAM group vs the control group: (A) Genes upregulated in the HAM group compared to the control group. (B) Genes downregulated in the HAM group compared to the control group. (C) Expression data presented as the log(RPKM) values of all genes differentially expressed in peripheral blood between the HAM and control groups.
3.4 Differential expression between the asymptomatic group and the group with HAM
In addition, 6 genes were upregulated, with an FDR≤ 0.05, in the HAM group compared to the asymptomatic group (Figure 3A). Among these genes, human leukocyte antigen of the DRA locus (HLA-DRA) was approximately 12-fold more highly expressed (logFC: 11.55; p = 0.01; FDR: 6.05–27), and CLEC12B was approximately 3-fold more highly expressed (logFC: 3.47; p = 3.67–05; FDR: 0.007). Figure 3B shows the gene expression data measured in RPKM of all genes differentially expressed in peripheral blood between the asymptomatic and HAM groups.
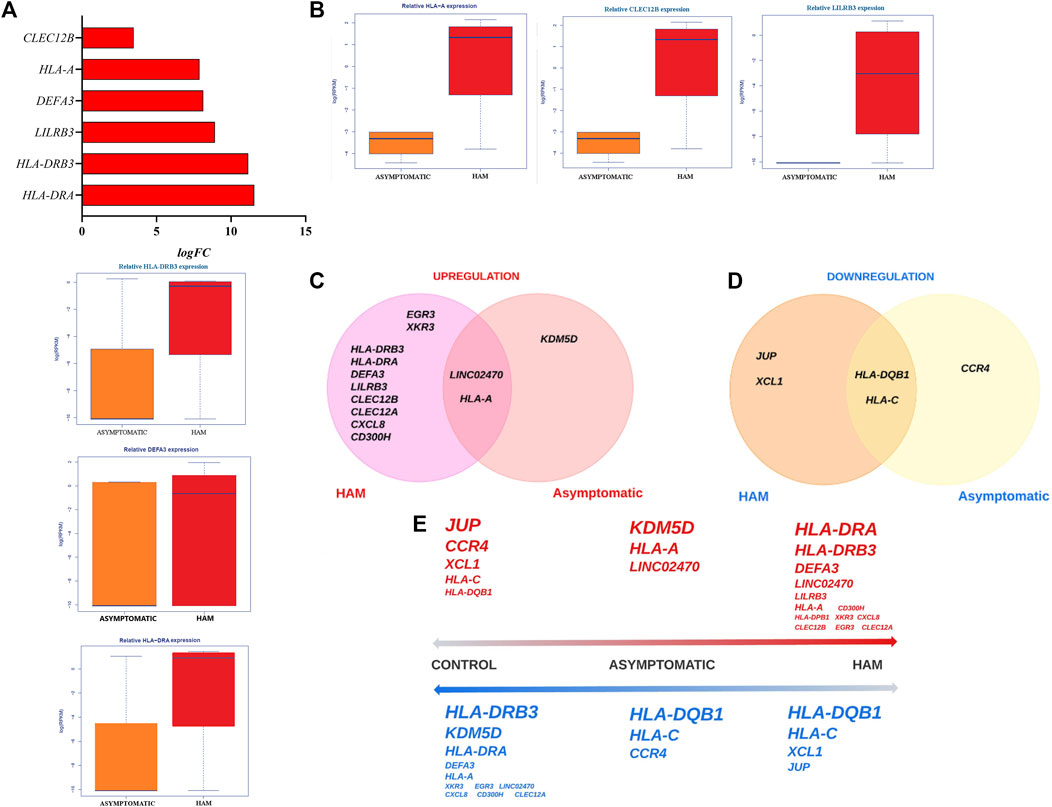
Figure 3. Gene expression profile in the HAM group vs the asymptomatic group and comparative gene expression diagram: (A) Genes upregulated in the HAM group compared to the asymptomatic group. (B) Expression data presented as the log(RPKM) values of all genes differentially expressed in peripheral blood between the HAM and asymptomatic groups. (C) Venn–Euler diagrams showing the upregulated genes in the asymptomatic and HAM groups. (D) Venn–Euler diagrams showing downregulated genes in the asymptomatic and HAM groups. (E) General diagram of the expression profiles with a comprehensive illustration of the upregulated (red, superscript) and downregulated (blue, subscript) genes in all groups; the font size is directly proportional to the logFC value.
More genes were upregulated in the HAM group than in the asymptomatic group. The KDM5D gene was the only gene upregulated only in the asymptomatic group, whereas LINC02470 and HLA-A were upregulated in both groups (Figure 3C). Fewer genes were downregulated than upregulated in either group; CCR4 was the only downregulated gene in the asymptomatic group, HLA-DQB1 and HLA-C were downregulated in both groups, and JUP and chemokine ligand type 1 (XCL1) were downregulated only in the HAM group (Figure 3D).
We constructed a diagram with all the positively regulated and negatively regulated genes ordered by FC. In the qaul we highlighted the upregulated genes in red and the downregulated genes in blue in each group; The font size of each word is related to the FC, the larger fonts indicate the most regulated genes in each specific degree (Figure 3E). In the control group, the JUP gene was the most upregulated, and the HLA-DQB1 gene was the most downregulated. In the asymptomatic group, KDM5D was the most upregulated; in the HAM group, HLA-DRA was the most upregulated. In both the asymptomatic and HAM groups, HLA-DQB1 and HLA-C were the most downregulated with respect to the control group.
3.5 Interactome
Interaction networks were inferred for the genes differentially expressed in each group; by enrichment analysis, these genes were categorized into four functional groups based on general biological properties (Figure 4). The interactome of the control group was formed by seven types of network categories, among which the physical interaction type network accounted for approximately 77.64% of the interactions. The largest cluster encompassed the CCR4, XCL1 and JUP genes, with a clear predominance of categories such as physical interaction and genetic interaction. Most of the genes shown were grouped as immunoregulatory genes, among which HLA-DQB1, HLA-C and CCR4 are tightly related to the immune response. XCL1 clustered into both the immune response and cell cycle regulation categories, and JUP clustered narrowly among cell motility genes (Figure 4A).
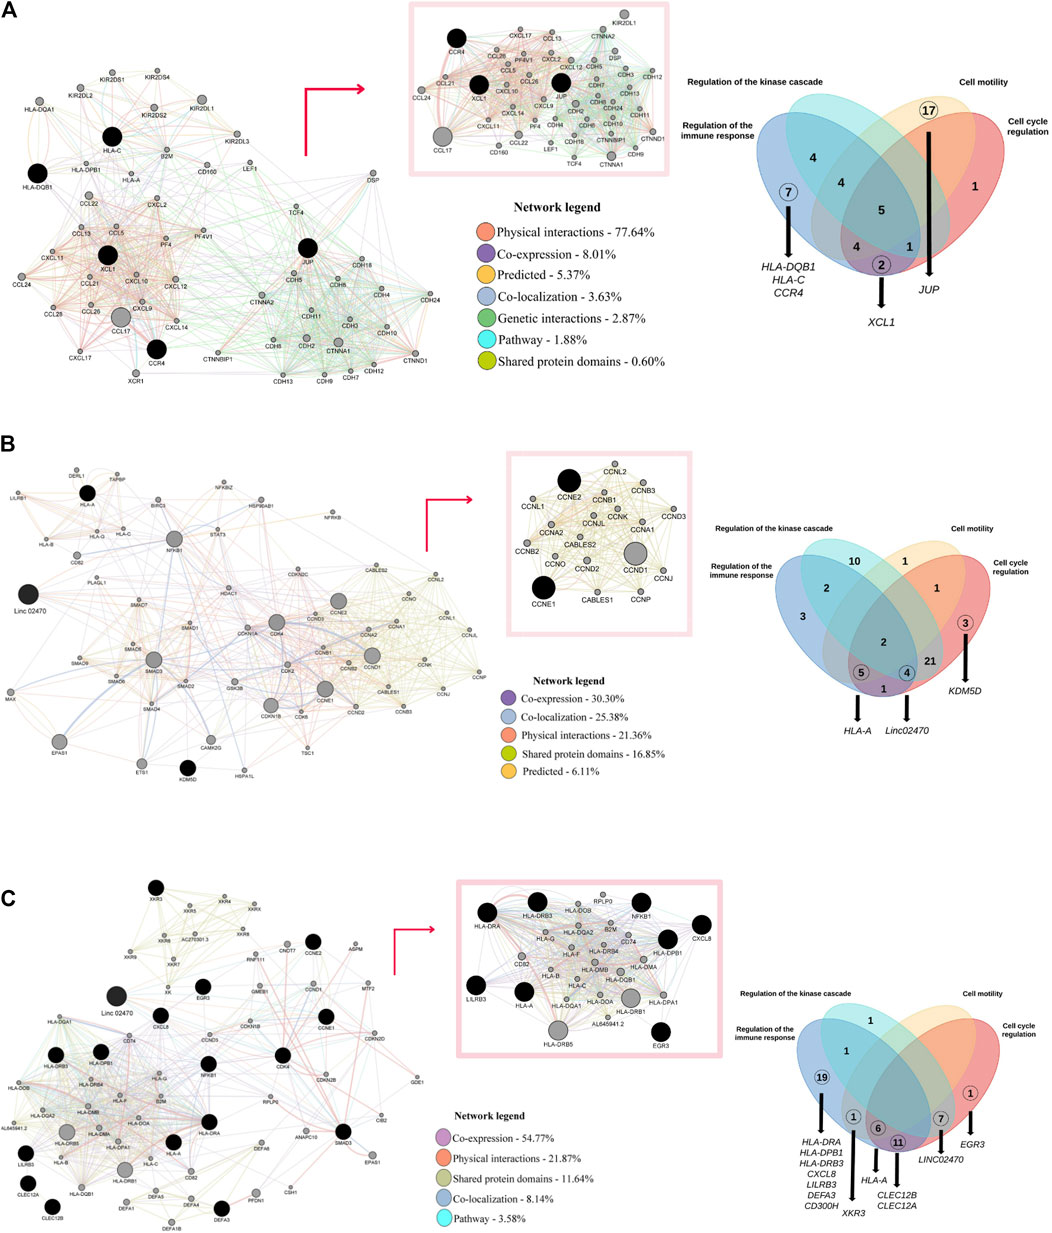
Figure 4. Interaction networks in the groups: (A) Interactome composed of upregulated genes in the control group, represented by seven network categories. The largest network inferred by cluster analysis is highlighted. Four functional categories were proposed: immune response regulation, kinase cascade regulation, cell motility and cell cycle regulation. (B) Interactome composed of upregulated genes in the control group, represented by five network categories. The largest network inferred by cluster analysis is highlighted. Four functional categories were proposed: immune response regulation, kinase cascade regulation, cell motility and cell cycle regulation. (C) Interactome composed of upregulated genes in the HAM group, represented by five network categories. The largest network inferred by cluster analysis is highlighted. Four functional categories were proposed: immune response regulation, kinase cascade regulation, cell motility and cell cycle regulation.
The interactome of the asymptomatic group was formed by five types of network categories, among which the coexpression type network accounted for 30.3% of the interactions. The largest cluster encompassed genes of the G1-type cyclin family (CCNE2 and CCNE1), which are some of the genes that interact with the noncoding RNA LINC02470; in this cluster, we observed a predominance of the prediction type category among the interactions. Most of the genes clustered as cell cycle regulation genes, among which all three genes upregulated in the asymptomatic group were included, although the HLA-A gene also clustered in the immune regulation and cell motility categories, and the RNA LINC02470 clustered in the immune regulation and kinase cascade regulation categories (Figure 4B).
The interactome of the HAM group was formed by five types of network categories, among which the coexpression type network accounted for 50.77% of the interactions. The largest cluster encompassed the genes HLA-A, LILRB3, HLA-DRB3, HLA-DRA, HLA-DPB1, CXCL8, EGR3 and NFKB1 (NFKB1 specifically interacts with the LINC02470 RNA axis). Notably, all network categories were represented in this cluster, although the strongest interactions were observed in the physical interaction type category. Most of the genes clustered as immunoregulatory genes, and only an early growth response gene (EGR3) and the RNA LINC02470 clustered in the kinase cascade regulation and cell cycle regulation categories (Figure 4C).
4 Discussion
In the present study, we reported different differential gene expression profiles between people living with HTLV-1. We observed that individuals with HAM showed greater diversity in the number of differentially expressed genes and gene expression profiles.
The HLA-DQB1 and HLA-C genes were downregulated in individuals with both clinical profiles of infection, possibly suggesting the importance of these genes in the anti-HTLV-1 immune response. Both HLA class I and class II proteins are important in the immune response to HTLV-1 infection (Reith and Mach, 2001). Studies have shown that some HLA-DQB1 alleles associated with HAM are upregulated in different blood cell lines and even in uninfected individuals (Yamano et al., 1997; Zajacova et al., 2018). This observation suggests that the HLA class II-mediated antigen presentation pathway may be effective in maintaining the response to HTLV-1 infection but that enhancement of this proinflammatory profile may be detrimental, especially at the level of the nervous system, as previously suggested (Enose-Akahata et al., 2017).
The HLA-C gene was the second most downregulated gene in patients with HTLV-1 infection. Specifically, one previous study indicated the association of genetic variability in HLA-C with clinical aspects of HTLV-1 infection, based on the role of this gene in infections with other retroviruses (Penova et al., 2021). Furthermore, a genome-wide association study (GWAS) in an HTLV-1 endemic population suggested that haplotypes formed by classical HLA class II alleles in linkage disequilibrium with HLA-C alleles act as protagonists in immune homeostasis during infection (Lei and Takahama, 2012). This observation supports our findings of joint downregulation of HLA class I and II molecules in patients with HTLV-1 infection.
In addition, we observed an interaction network formed by upregulated XCL1, CCR4 and JUP only in the control group. There is no direct interaction pathway between XCL1 and CCR4; however, both participate in directional cell migration during immune surveillance and inflammation and are expressed in the same cell lineages (Aktary et al., 2017; Yoshie, 2021). Beyond its role in cell adhesion, in this context, JUP may function in T-cell lineage differentiation and the regulation of proinflammatory responses (Yu et al., 2010; Saeidi et al., 2023). These findings first appear controversial, considering that the same genes are expressed in individuals with different clinical profiles of HTLV-1 infection: cells that express CCR4 are the preferred target cells for viral transmission and/or persistence, as seen mainly in ATLL (Bai et al., 2017), XCL1 has been shown to be a serum marker of myelopathy (Haynes et al., 2010), and the JUP-regulated signaling pathway is associated with secondary cancer cell lines in patients with ATLL (Tricarico et al., 2020). However, data show these regulatory pathways are activated to promote immune control of infection, but it is chronic activation due to viral persistence that causes systemic damage, as immune homeostasis of the host response is expected for satisfactory control (Watanabe et al., 2020).
Most of the genes represented in the gene expression profiles in the asymptomatic group are related to cell cycle regulation processes. Lysine demethylase 5D (KDM5D), the most upregulated gene in asymptomatic individuals, and its paralog KDM5C encode lysine demethylases that function as epigenetic regulators of large chromatin-modifying complexes and that strongly influence gene expression and processes related to DNA repair, including the recruitment of other epigenetic modifiers and transcription factors to specific sites on chromatin (Niederer et al., 2014).
Studies have shown that alterations in host DNA occur in the asymptomatic phase of HTLV-1 infection (Yeh et al., 2016). In this phase, the HTLV-1 provirus exhibits a tendency to integrate into transcriptionally active regions that favor the expression of viral genes (Chu et al., 2021). Indeed, differential expression of nuclear and cytoplasmic factors was observed in a transcriptomic analysis of cell lines transformed by HTLV-1, which correlated with the activity of viral proteins (Kataoka et al., 2015). Additionally, alterations in the native process of DNA demethylation were found to presuppose the presence of previously detected malignancies in patients with ATLL in a Brazilian population (Pessôa et al., 2023).
We highlighted the upregulation of the noncoding RNA LINC02470 in both clinical profiles of HTLV-1 infection. The immediate target genes of this noncoding RNA (NFKB, SMAD3, CDK4, CCNE1 and CCNE2) were visualized in interaction networks, with the interactomes of CCNE1 and CCNE2 notable in the asymptomatic group. These findings contribute to the knowledge about the prominent control of cell activity already observed in asymptomatic individuals, as E-type cyclins also represent key components of the central cell cycle machinery, as they primarily phosphorylate several regulatory proteins of the G1 and S phases (Nath et al., 1999; Itoh et al., 2018).
A recent Brazilian study showed the expression of relevant microRNAs (miRNAs) in the control of the G1/S transition of the cell cycle in a patient with ATLL after maintenance therapy based on CHOP chemotherapy followed by IFN-α and zidovudine, with the CCNE1 gene being one of the targets of the interaction pathway (Pessôa et al., 2023). In another Brazilian study, differential expression of 128 miRNAs, 34 of which were novel, was detected in asymptomatic patients, with the most evident biological functions of the differentially expressed miRNAs also related to the control of cell proliferation, differentiation and apoptosis (Valadão de Souza et al., 2020). These findings support our finding of the prevalence of differentially expressed noncoding RNAs interfering with pathways related to cell cycle control among patients with different clinical profiles of HTLV-1 infection. The differences in the RNA expression profiles observed in different Brazilian cohorts may be due to several factors, including the ethnic origin of the population under investigation, as well as the presence of other associated clinical conditions.
Our data showed that the HLA-A gene was expressed in asymptomatic individuals, a contradictory finding if we evaluate whether the cellular control generated by viral infection leads to marked maintenance of the immune response (Andrade et al., 2013). Interestingly, one study showed that HLA class I expression induces cell proliferation through functional inhibition of the retinoblastoma protein (Rb) mediated by an interaction with the E-type cyclin pathway (Lubben et al., 2007).
We thus explored whether this interaction pathway is applicable and found that HLA-A is involved in the interaction. The physical interaction network model was very conclusive in inferring the interactome of candidate genes. The most parsimonious interactions among the HLA-A, Rb and CCNE1 proteins involved four intermediate pathways, represented by PACS1–MYC, CD8A–CDK1, TAP1–PSMD10 and CALR–CDK2 protein interactions (Supplementary Figure S1). These interaction pathways have not yet been clarified; however, some lines of evidence indicating their plausibility have been published. For example, interactions of HLA-A with PACS1 and MYC have been described, even as a pathway deregulated in individuals with HIV infection (Zhao and Day, 2001; Lubben et al., 2007). In addition, the MYC oncoprotein appears to interact with Rb (Zhao and Day, 2001) and CCNE1 (Nakayama et al., 2016) in cell cycle maintenance.
Collectively, these data suggests a complex system of interactions in which HLA-A signaling activates an alternative pathway that regulates the cell cycle. In this context, strategic control of HLA expression can spontaneously inhibit the expression of interferons (IFNs), as suggested by studies that evaluated signaling pathways shared between these factors (Browne et al., 2006; Jørgensen et al., 2020). This possibility could justify the lack of detection of genes related to IFNs in infected individuals, in contrast to expectations (Bidkhori et al., 2020).
Most genes that were upregulated in asymptomatic individuals were also expressed in individuals with HAM, indicating a transient and relevant gene expression profile during the progression of infection. Over time, the active contribution of the cellular machinery in asymptomatic individuals likely results in a balance in the expression of viral genes and infected cells, with the targeted immune response being a selection (Chu et al., 2021). However, notorious immune dyshomeostasis is a characteristic of HAM pathogenesis and is strongly hypothesized to be a risk determinant (Cook et al., 2013). This observation may clarify the upregulation of 11 genes related to the immune response, especially HLA class II genes, in patients with HAM.
Our results reinforce the immunological plasticity of HLA types in the anti-HTLV response. Although the balance of HLA-A and HLA-DR expression seems to favor clinical progression, the expression of HLA-C and HLA-DQB suggests an attempt to control the infection. These data are plausible if we consider that this plasticity is well recognized, even among alleles of a single HLA type (Andrade et al., 2013).
We inferred that the non-HLA genes expressed in the HAM group may interact in the HLA regulation pathway. This inference seems logical given that NFKB (Souri et al., 2019) and EGR3 (Li et al., 2012) regulate HLA expression in active T cells; moreover, interestingly, some of the miRNAs downregulated in patients with HAM may favor the expression of NFKB and likely promote cellular senescence (de Souza et al., 2023). There is no clear interaction pathway between the protein products of the CXCL8 and HLA genes; however, the coexpression state of the factors observed in our study may be linked to the relationship between CXCL8 and the activation of CD4+ T lymphocytes (Crespo et al., 2018). Finally, members of the LILRB3 gene family may be associated with maintenance of the immune response through HLA interactions (Bashirova et al., 2014).
An immunological counteroffensive is likely mounted via the expression of the DEFA3 gene in individuals with HAM, as defensins constitute a family of antimicrobial peptides related to the antimicrobial activity of phagocytes, inflammatory fluids and epithelial secretions (Ganz, 2003). The mechanism by which the defensin pathway may influence the pathogenesis of HTLV-1 infection. However, in one study, it was proposed that one of the functional outcomes of the serum vitamin D imbalance in individuals with HAM is an imbalance in defensin production and a consequent impact on the antiviral response (Derakhshan et al., 2020).
In the present study, we used RNA-Seq analysis to investigate differences and similarities in gene expression profiles among noninfected subjects, asymptomatic carriers of HTLV-1 and patients with HTLV-1-associated HAM. Although the small sample size is a limitation of our study, which may require the reconsideration of further conclusions and inferences, we believe that the results are interesting and demonstrate a gene expression profile suggestive of an association with the clinical progression of HTLV-1 infection. However, further multicenter studies utilizing RNA-Seq analysis in a larger cohort, as well as quantitative analysis of gene expression by quantitative PCR (qPCR), are needed to confirm our results. Finally, we recognize that future studies involving functional assays or in vitro experiments will help to elucidate the functional significance of the gene expression alterations identified herein.
Data availability statement
The original contributions presented in the study are publicly available. This data can be found in the Gene Expression Omnibus (GEO) repository, accession number GSE224047 (https://www.ncbi.nlm.nih.gov/geo/query/acc.cgi?acc=GSE224047).
Ethics statement
The studies involving humans were approved by Comitê de Ética em Pesquisa da Universidade Federal do Pará. The studies were conducted in accordance with the local legislation and institutional requirements. The participants provided their written informed consent to participate in this study.
Author contributions
LS: Formal Analysis, Investigation, Methodology, Software, Validation, Writing–original draft, Writing–review and editing. RF: Investigation, Methodology, Resources, Writing–review and editing. VA: Conceptualization, Funding acquisition, Supervision, Writing–review and editing. MF: Formal Analysis, Investigation, Methodology, Writing–review and editing. CD: Investigation, Methodology, Writing–review and editing. RR: Data curation, Methodology, Writing–review and editing. SP: Data curation, Investigation, Methodology, Writing–review and editing. CD: Investigation, Methodology, Resources, Writing–review and editing. MS: Writing–review and editing. IV: Conceptualization, Project administration, Writing–review and editing. AC: Conceptualization, Investigation, Methodology, Supervision, Writing–review and editing. AR: Conceptualization, Funding acquisition, Project administration, Supervision, Writing–original draft, Writing–review and editing.
Funding
The author(s) declare that financial support was received for the research, authorship, and/or publication of this article. The present study was supported by the National Council for Scientific and Technological Development (CNPQ) (processes: #302935/2021-5; #401473/2016-3; #153000/2022-8), Instituto Nacional de Ciência e Tecnologia em Theranóstica e Nanobiotecnologia (INCT-Teranano # CNPq-465669/2014–0) and Instituto Nacional de Ciência e Tecnologia em Viroses Emergentes e Reemergentes (INCT-VER - process: #406360/2022-7).
Acknowledgments
We thank all the patients enrolled in the present study.
Conflict of interest
The authors declare that the research was conducted in the absence of any commercial or financial relationships that could be construed as a potential conflict of interest.
Publisher’s note
All claims expressed in this article are solely those of the authors and do not necessarily represent those of their affiliated organizations, or those of the publisher, the editors and the reviewers. Any product that may be evaluated in this article, or claim that may be made by its manufacturer, is not guaranteed or endorsed by the publisher.
Supplementary material
The Supplementary Material for this article can be found online at: https://www.frontiersin.org/articles/10.3389/frnar.2024.1419833/full#supplementary-material
SUPPLEMENTARY DATA S1 | Sequencing quality control summary data.
SUPPLEMENTARY DATA S2 | Summary of sequencing quality control.
References
Abreu, I. N., Lima, C. N. C., Sacuena, E. R. P., Lopes, F. T., da Silva Torres, M. K., Santos, B. C. D., et al. (2022). HTLV-1/2 in indigenous peoples of the Brazilian Amazon: seroprevalence, molecular characterization and sociobehavioral factors related to risk of infection. Viruses 15 (1), 22. doi:10.3390/v15010022
Aktary, Z., Alaee, M., and Pasdar, M. (2017). Beyond cell-cell adhesion: plakoglobin and the regulation of tumorigenesis and metastasis. Oncotarget 8 (19), 32270–32291. doi:10.18632/oncotarget.15650
Andrade, R. G., Gonçalves, P. d. C., Ribeiro, M. A., Romanelli, L. C., Ribas, J. G., Torres, E. B., et al. (2013). Strong correlation between tax and HBZ mRNA expression in HAM/TSP patients: distinct markers for the neurologic disease. J. Clin. Virology 56 (2), 135–140. doi:10.1016/j.jcv.2012.10.003
Andrés-León, E., and Rojas, A. M. (2019). miARma-Seq, a comprehensive pipeline for the simultaneous study and integration of miRNA and mRNA expression data. Methods 152 (152), 31–40. doi:10.1016/j.ymeth.2018.09.002
Ayres, M., Ayres, J. R. M., Ayres, D. L., and Santos, A. S. (2008). BioEstat 5.0: Aplicações Estatísticas nas Áreas de Ciências Biológicas e Médicas. Belém: Sociedade Civil Mamirauá. Brasília: CNPq.
Bai, X. T., Yeh, C. H., and Nicot, C. (2017). NOTCH1 activation depletes the pool of side population stem cells in ATL. J. Cancer Sci. 4 (1). doi:10.13188/2377-9292.1000013
Bashirova, A. A., Apps, R., Vince, N., Mochalova, Y., Yu, X. G., and Carrington, M. (2014). Diversity of the human LILRB3/A6 locus encoding a myeloid inhibitory and activating receptor pair. Immunogenetics 66 (1), 1–8. doi:10.1007/s00251-013-0730-9
Bidkhori, H. R., Hedayati-Moghaddam, M. R., Mosavat, A., Valizadeh, N., Tadayon, M., Ahmadi Ghezeldasht, S., et al. (2020). The IL-18, IL-12, and IFN-γ expression in HTLV-1-associated myelopathy/tropical spastic paraparesis [HAM/TSP] patients, HTLV-1 carriers, and healthy subjects. J. Neurovirol 26 (3), 338–346. doi:10.1007/s13365-020-00832-5
Brites, C., Grassi, M. F., Quaresma, J. A. S., Ishak, R., and Vallinoto, A. C. R. (2021). Pathogenesis of HTLV-1 infection and progression biomarkers: an overview. Braz. J. Infect. Dis. 25 (3), 101594. doi:10.1016/j.bjid.2021.101594
Brito, W. R. D. S., Cardoso-Costa, G. d. L., Roland Junior, L. M., Pereira, K. A. S., Lopes, F. T., Dos Santos, B. C., et al. (2022). Prevalence and risk factors for HTLV-1/2 infection in quilombo remnant communities living in the Brazilian Amazon. Front. Public Health 10 (10), 871865. doi:10.3389/fpubh.2022.871865
Browne, S. K., Roesser, J. R., Zhu, S. Z., and Ginder, G. D. (2006). Differential IFN-gamma stimulation of HLA-A gene expression through CRM-1-dependent nuclear RNA export. J. Immunol. 177 (12), 8612–8619. doi:10.4049/jimmunol.177.12.8612
Chu, C., Geng, Y., Zhou, Y., and Sicinski, P. (2021). Cyclin E in normal physiology and disease states. Trends Cell Biol. 31 (9), 732–746. doi:10.1016/j.tcb.2021.05.001
Cook, L. B., Elemans, M., Rowan, A. G., and Asquith, B. (2013). HTLV-1: persistence and pathogenesis. Virology 435 (1), 131–140. doi:10.1016/j.virol.2012.09.028
Crespo, J., Wu, K., Li, W., Kryczek, I., Maj, T., Vatan, L., et al. (2018). Human naive T cells express functional CXCL8 and promote tumorigenesis. J. Immunol. 201 (2), 814–820. doi:10.4049/jimmunol.1700755
de Lima, A. C. R., Lopes, F. T., de Oliveira Freitas, V., Assad, M. N., de Sousa, R. S., Gonçalves, J. S. S., et al. (2022). Prevalence and risk factors for HTLV-1/2 infection inRiverside and rural populations of the state of Pará. Viruses 14 (10), 2262. doi:10.3390/v14102262
Derakhshan, R., Mirhosseini, A., Ahmadi Ghezeldasht, S., Jahantigh, H. R., Mohareri, M., Boostani, R., et al. (2020). Abnormal vitamin D and lipid profile in HTLV-1-associated myelopathy/tropical spastic paraparesis (HAM/TSP) patients. Mol. Biol. Rep. 47 (1), 631–637. doi:10.1007/s11033-019-05171-1
de Souza, D. R. V., Pessoa, R., Nukui, Y., Pereira, J., Marcusso, R. N., de Oliveira, A. C. P., et al. (2023). Identification of miRnas with possible prognostic roles for HAM/TSP. Virulence 14 (1), 2230015. doi:10.1080/21505594.2023.2230015
Enose-Akahata, Y., Vellucci, A., and Jacobson, S. (2017). Role of HTLV-1 tax and HBZ in the pathogenesis of HAM/TSP. Front. Microbiol. 8, 2563. doi:10.3389/fmicb.2017.02563
Eusebio-Ponce, E., Anguita, E., Paulino-Ramirez, R., and Candel, F. J. (2019). HTLV-1 infection: an emerging risk. Pathogenesis, epidemiology, diagnosis and associated diseases. Rev. EspQuimioter 32 (6), 485–496.
Forlani, G., Shallak, M., Accolla, R. S., and Romanelli, M. G. (2021). HTLV-1 infection and pathogenesis: new insights from cellular and animal models. Int. J. Mol. Sci. 22 (15), 8001. doi:10.3390/ijms22158001
Ganz, T. (2003). Defensins: antimicrobial peptides of innate immunity. Nat. Rev. Immunol. 3 (9), 710–720. doi:10.1038/nri1180
Girgenti, M. J., and Duman, R. S. (2018). Transcriptome alterations in posttraumatic stress disorder. Biol. Psychiatry 83 (10), 840–848. doi:10.1016/j.biopsych.2017.09.023
Haynes, R. A. H., Ware, E., Premanandan, C., Zimmerman, B., Yu, L., Phipps, A. J., et al. (2010). Cyclosporine-induced immune suppression alters establishment of HTLV-1 infection in a rabbit model. Blood 115 (4), 815–823. doi:10.1182/blood-2009-07-230912
International Committee on Taxonomy of Viruses- ICTV. (2022). Available at: https://talk.ictvonline.org/taxonomy/. [Accessed in: May 27, 2022].
Ishak, R., de Oliveira Guimarães Ishak, M., and Vallinoto, A. C. R. (2020). The challenge of describing the epidemiology of HTLV in the Amazon region of Brazil. Retrovirology 17 (1), 4. doi:10.1186/s12977-020-0512-z
Itoh, Y., Saitoh, M., and Miyazawa, K. (2018). Smad3-STAT3 crosstalk in pathophysiological contexts. Acta Biochimica Biophysica Sinica 50 (1), 82–90. doi:10.1093/abbs/gmx118
Jeffery, K. J., Usuku, K., Hall, S. E., Matsumoto, W., Taylor, G. P., Procter, J., et al. (1999). HLA alleles determine human T-lymphotropic virus-I (HTLV-I) proviral load and the risk of HTLV-I-associated myelopathy. ProcNatlAcadSci U. S. A. 96 (7), 3848–3853. doi:10.1073/pnas.96.7.3848
Jørgensen, N., Sayed, A., Jeppesen, H. B., Persson, G., Weisdorf, I., Funck, T., et al. (2020). Characterization of HLA-G regulation and HLA expression in breast cancer and malignant melanoma cell lines upon IFN-γ stimulation and inhibition of DNA methylation. Int. J. Mol. Sci. 21 (12), 4307. doi:10.3390/ijms21124307
Kataoka, K., Nagata, Y., Kitanaka, A., Shiraishi, Y., Shimamura, T., Yasunaga, J. i., et al. (2015). Integrated molecular analysis of adult T cell leukemia/lymphoma. Nat. Genet. 47 (11), 1304–1315. doi:10.1038/ng.3415
Lei, Y., and Takahama, Y. (2012). XCL1 and XCR1 in the immune system. Microbes Infect. 14 (3), 262–267. doi:10.1016/j.micinf.2011.10.003
Li, S., Miao, T., Sebastian, M., Bhullar, P., Ghaffari, E., Liu, M., et al. (2012). The transcription factors Egr2 and Egr3 are essential for the control of inflammation and antigen-induced proliferation of B and T cells. Immunity 37 (4), 685–696. doi:10.1016/j.immuni.2012.08.001
Lopes, F. T., de Sousa, R. S., Carvalho Gomes, J. L., Vallinoto, M. C., de Lima, A. C. R., Lima, S. S., et al. (2022). The relevance of a diagnostic and counseling service for people living with HTLV-1/2 in a metropolis of the Brazilian Amazon. Front. Public Health 10, 864861. doi:10.3389/fpubh.2022.864861
Lubben, N. B., Sahlender, D. A., Motley, A. M., Lehner, P. J., Benaroch, P., and Robinson, M. S. (2007). HIV-1 Nef-induced down-regulation of MHC class I requires AP-1 and clathrin but not PACS-1 and is impeded by AP-2. Mol. Biol. Cell 18 (9), 3351–3365. doi:10.1091/mbc.e07-03-0218
Martinez, M. P., Al-Saleem, J., and Green, P. L. (2019). Comparative virology of HTLV-1 and HTLV-2. Retrovirology 16 (1), 21. doi:10.1186/s12977-019-0483-0
Menezes, S. M., Leal, F. E., Dierckx, T., Khouri, R., Decanine, D., Silva-Santos, G., et al. (2017). A fashi lymphoproliferative phenotype reveals non-apoptotic fas signaling in HTLV-1-associated neuroinflammation. Front. Immunol. 8, 97. doi:10.3389/fimmu.2017.00097
Miranda, A. E., Rosadas, C., Assone, T., Pereira, G. F. M., Vallinoto, A. C. R., and Ishak, R. (2022). Strengths, weaknesses, opportunities and threats (SWOT) analysis of the implementation of public Health policies on HTLV-1 in Brazil. Front. Med. (Lausanne) 9, 859115. doi:10.3389/fmed.2022.859115
Mozhgani, S. H., Piran, M., Zarei-Ghobadi, M., Jafari, M., Jazayeri, S. M., Mokhtari-Azad, T., et al. (2019). An insight to HTLV-1-associated myelopathy/tropical spastic paraparesis (HAM/TSP) pathogenesis; evidence from high-throughput data integration and meta-analysis. Retrovirology 16 (1), 46. doi:10.1186/s12977-019-0508-8
Nakayama, K., Rahman, M. T., Rahman, M., Nakamura, K., Ishikawa, M., Katagiri, H., et al. (2016). CCNE1 amplification is associated with aggressive potential in endometrioid endometrial carcinomas. Int. J. Oncol. 48 (2), 506–516. doi:10.3892/ijo.2015.3268
Nath, N., Bian, H., Reed, E. F., and Chellappan, S. P. (1999). HLA class I-mediated induction of cell proliferation involves cyclin E-mediated inactivation of Rb function and induction of E2F activity. J. Immunol. 162 (9), 5351–5358. doi:10.4049/jimmunol.162.9.5351
Niederer, H. A., Laydon, D. J., Melamed, A., Elemans, M., Asquith, B., Matsuoka, M., et al. (2014). HTLV-1 proviral integration sites differ between asymptomatic carriers and patients with HAM/TSP. Virol. J. 11, 172. doi:10.1186/1743-422X-11-172
Penova, M., Kawaguchi, S., Yasunaga, J. I., Kawaguchi, T., Sato, T., Takahashi, M., et al. (2021). Genome wide association study of HTLV-1-associated myelopathy/tropical spastic paraparesis in the Japanese population. ProcNatlAcadSci U. S. A. 118 (11), e2004199118. doi:10.1073/pnas.2004199118
Pessôa, R., de Souza, D. R. V., Nukui, Y., Pereira, J., Fernandes, L. A., Marcusso, R. N., et al. (2023). Small RNA profiling in an HTLV-1-infected patient with acute adult T-cell leukemia-lymphoma at diagnosis and after maintenance therapy: a case study. Int. J. Mol. Sci. 24 (13), 10643. doi:10.3390/ijms241310643
Rao, M. S., Van Vleet, T. R., Ciurlionis, R., Buck, W. R., Mittelstadt, S. W., Blomme, E. A. G., et al. (2018). Comparison of RNA-seq and microarray gene expression platforms for the toxicogenomic evaluation of liver from short-term rat toxicity studies. Front. Genet. 9, 636. doi:10.3389/fgene.2018.00636
Reith, W., and Mach, B. (2001). The bare lymphocyte syndrome and the regulation of MHC expression. Annu. Rev. Immunol. 19, 331–373. doi:10.1146/annurev.immunol.19.1.331
Saeidi, M., Vahidi, Z., Nahayati, M. A., Rezaiyan, M. K., Zemorshidi, F., Mahdifar, M., et al. (2023). XCL1, a serum biomarker in neurological diseases; HTLV-1-associated myelopathy and multiple sclerosis. Microb. Pathog. 174, 105962. doi:10.1016/j.micpath.2022.105962
Schwartz, M., and Stern-Ginossar, N. (2019). The transcriptome of latent human cytomegalovirus. J. Virol. 93 (11), e000477–19. doi:10.1128/JVI.00047-19
Singh, S., Quann, K., Coelho-dos-Reis, J., Khan, Z. K., and Jain, P. (2011). Transcriptome analysis of HTLV-1-infected cells in comparison to the normal and Tax-expressing T cells. Retrovirology 8 (Suppl. 1), 123. doi:10.1186/1742-4690-8-S1-A123
Souri, Z., Wierenga, A. P. A., van Weeghel, C., van der Velden, P. A., Kroes, W. G. M., Luyten, G. P. M., et al. (2019). Loss of BAP1 is associated with upregulation of the NFkB pathway and increased HLA class I expression in uveal melanoma. Cancers (Basel) 11 (8), 1102. doi:10.3390/cancers11081102
Tamegão-Lopes, B. P., Rezende, P. R., Maradei-Pereira, L. M. C., and Lemos, J. A. R. d. (2006). Carga proviral do HTLV-1 e HTLV-2: um método simples através da PCR quantitativa em tempo real. Rev. Soc. Bras. Med. Trop. 39 (6), 548–552. doi:10.1590/s0037-86822006000600007
Tricarico, R., Nicolas, E., Hall, M. J., and Golemis, E. A. (2020). X- and Y-linked chromatin-modifying genes as regulators of sex-specific cancer incidence and prognosis. Clin. Cancer Res. 26 (21), 5567–5578. doi:10.1158/1078-0432.CCR-20-1741
Valadão de Souza, D., Pessoa, R., Nascimento, A., Nukui, Y., Pereira, J., Casseb, J., et al. (2020). Small RNA profiles of HTLV-1 asymptomatic carriers with monoclonal and polyclonal rearrangement of the T-cell antigen receptor γ-chain using massively parallel sequencing: a pilot study. Oncol. Lett. 20 (3), 2311–2321. doi:10.3892/ol.2020.11803
Vallinoto, A. C. R., Cayres-Vallinoto, I., Freitas Queiroz, M. A., Ishak, M. d. O. G., and Ishak, R. (2019). Influence of immunogenetic biomarkers in the clinical outcome of HTLV-1 infected persons. Viruses 11 (11), 974. doi:10.3390/v11110974
Watanabe, T., Yamashita, S., Ureshino, H., Kamachi, K., Kurahashi, Y., Fukuda-Kurahashi, Y., et al. (2020). Targeting aberrant DNA hypermethylation as a driver of ATL leukemogenesis by using the new oral demethylating agent OR-2100. Blood 136 (7), 871–884. doi:10.1182/blood.2019003084
Yamagishi, M., Kubokawa, M., Kuze, Y., Suzuki, A., Yokomizo, A., Kobayashi, S., et al. (2021). Chronological genome and single-cell transcriptome integration characterizes the evolutionary process of adult T cell leukemia-lymphoma. Nat. Commun. 12 (1), 4821. doi:10.1038/s41467-021-25101-9
Yamano, Y., Kitze, B., Yashiki, S., Usuku, K., Fujiyoshi, T., Kaminagayoshi, T., et al. (1997). Preferential recognition of synthetic peptides from HTLV-I gp21 envelope protein by HLA-DRB1 alleles associated with HAM/TSP (HTLV-I-associated myelopathy/tropical spastic paraparesis). J. Neuroimmunol. 76 (1-2), 50–60. doi:10.1016/s0165-5728(97)00041-6
Yeh, C. H., Bai, X. T., Moles, R., Ratner, L., Waldmann, T. A., Watanabe, T., et al. (2016). Mutation of epigenetic regulators TET2 and MLL3 in patients with HTLV-I-induced acute adult T-cell leukemia. Mol. Cancer 15, 15. doi:10.1186/s12943-016-0500-z
Yoshie, O. (2021). CCR4 as a therapeutic target for cancer immunotherapy. Cancers 13 (21), 5542. doi:10.3390/cancers13215542
Yu, Q., Sharma, A., and Sen, J. M. (2010). TCF1 and β-catenin regulate T cell development and function. Immunol. Res. 47 (1-3), 45–55. doi:10.1007/s12026-009-8137-2
Zajacova, M., Kotrbova-Kozak, A., and Cerna, M. (2018). Expression of HLA-DQA1 and HLA-DQB1 genes in B lymphocytes, monocytes and whole blood. Int. J. Immunogenetics 45 (3), 128–137. doi:10.1111/iji.12367
Keywords: HTLV-1, asymptomatic, HAM, transcriptome, RNA-seq, gene expression
Citation: Soares Pereira LM, Ferreira RdN, Azevedo VN, Freitas Queiroz MA, Dias Dantas CW, Ramos RTJ, Patroca da Silva S, da Costa CA, Sousa MSd, Vieira Cayres Vallinoto IM, Cruz ACR and Rosário Vallinoto AC (2024) RNAseq-differentiated gene expression profile of people living with HTLV-1 in the Brazilian Amazon region: a pilot study. Front. RNA Res. 2:1419833. doi: 10.3389/frnar.2024.1419833
Received: 19 April 2024; Accepted: 02 August 2024;
Published: 26 August 2024.
Edited by:
Juliana Echevarria Lima, Federal University of Rio de Janeiro, BrazilReviewed by:
Feng Jiang, Stanford University, United StatesMaria Grazia Romanelli, University of Verona, Italy
Hidekatsu Iha, Faculty of Medicine, Oita University, Japan
Copyright © 2024 Soares Pereira, Ferreira, Azevedo, Freitas Queiroz, Dias Dantas, Ramos, Patroca da Silva, da Costa, Sousa, Vieira Cayres Vallinoto, Cruz and Rosário Vallinoto. This is an open-access article distributed under the terms of the Creative Commons Attribution License (CC BY). The use, distribution or reproduction in other forums is permitted, provided the original author(s) and the copyright owner(s) are credited and that the original publication in this journal is cited, in accordance with accepted academic practice. No use, distribution or reproduction is permitted which does not comply with these terms.
*Correspondence: Antonio Carlos Rosário Vallinoto, dmFsbGlub3RvQHVmcGEuYnI=