
94% of researchers rate our articles as excellent or good
Learn more about the work of our research integrity team to safeguard the quality of each article we publish.
Find out more
BRIEF RESEARCH REPORT article
Front. RNA Res., 20 February 2024
Sec. RNA Processing and Regulation
Volume 2 - 2024 | https://doi.org/10.3389/frnar.2024.1334873
 Mónica Padilla-Gálvez1,2,3
 Leo J. Arteaga-Vazquez1,3
 Ana B. Villaseñor-Altamirano1
 Yalbi Itzel Balderas-Martínez4
 Leonardo Collado-Torres5,6†
 Javier De Las Rivas7,8
 Daniel Blanco-Melo2
 Alejandra Medina-Rivera1*
The pathophysiology underlying coronavirus disease 2019 (COVID-19) across tissues and cell types upon severe acute respiratory syndrome coronavirus 2 (SARS-CoV-2) infection remains to be fully characterized. Diverse cellular processes have been described, including interferon (IFN) and pro-inflammatory responses and functions of ACE2 and TMPRSS2 proteins. Characterizing how transcriptional programs are activated or repressed could give us a better understanding of the disease progression; this can be better understood via gene regulatory network reverse engineering. Here, we make use of multiple publicly available transcriptional data, such as primary cells and tissue samples obtained from COVID-19 patients’ lung autopsies, to build the transcriptional regulatory networks for each condition. Our results describe the regulatory mechanisms underlying SARS-CoV-2 infection across tissues and cell lines, identifying antiviral and pro-inflammatory networks.
Coronavirus disease 2019 (COVID-19), caused by severe acute respiratory syndrome coronavirus 2 (SARS-CoV-2), has spread around the world and continues to be a major risk to public health worldwide. Previous work has established that SARS-CoV-2 enters cells through interaction between the viral S protein and its cellular receptor, ACE2 (Yan et al., 2020) mediated by TMPRSS2. ACE2 and TMPRSS2 are highly expressed in epithelial cells but can also be found in other cell types, such as myocardial, renal, enterocytes, and endothelial cells (Hoffmann et al., 2020; Xu et al., 2020). Determining the interaction mechanism of these viral and cellular proteins has been key to the understanding of the disease—COVID-19 symptoms, including respiratory limitations and diarrhea, are probably related to epithelial cells infection in the lung and gut (Ryu and Shin, 2021; Guimarães Sousa et al., 2022).
Inside the infected cell, the virus uses the cellular machinery to replicate, eventually resulting in cell death. Cells can recognize viral nucleic acids through pattern recognition receptors (PRRs), triggering a transcriptional response mediated by IFN regulatory factors (IRFs) and nuclear factor kB (NF-kB) (Hur, 2019). While some mechanisms are shared across infections from different viruses due to evolutionary constraints (García-Sastre, 2017), each viral infection will trigger a unique response.
Determining the molecular mechanisms triggered by these host–virus interactions is key to understanding COVID-19 and the reasons for its high variability in symptoms. A transcriptome analysis on the host response to SARS-CoV-2 infection in lung epithelium-derived cell lines found that it causes a reduced IFN response but an exacerbated inflammatory response that could explain the virus active replication and severe inflammation (Blanco-Melo et al., 2020). Moreover, tissue infection transcriptome analyses have helped in understanding the relationship between IFN response, presence of viral RNA, and disease duration (Desai et al., 2020). However, the full detailed extent of the transcriptional regulatory networks that are involved in this response is not yet clear.
Transcriptional regulatory mechanisms can help establish the information cascades that trigger or repress gene expression during SARS-CoV-2 infection. Computational approaches can determine gene regulatory networks from gene expression data and identify co-regulated genes and the transcription factors (TFs) involved in this regulation. Lung regulatory networks built using single-cell RNA-seq data have allowed the identification of the regulating presence of TFs and the absence of tropism factors specific to SARS-CoV-2 that could explain differences in cell-type infection (Tong et al., 2022). This study helped identify regulatory mechanisms that change the expression of tropism factors after SARS-CoV-2 infection. However, a more global infection analysis of regulatory networks to understand the full cellular response to infection remains to be done.
Here, we aim to determine the gene regulatory networks deployed during the response to SARS-CoV-2 infection in humans. To achieve this, we analyzed published SARS-CoV-2 transcriptome infection data in cell lines and tissues, identifying regulatory interactions affecting gene expression. Our results will help complete current knowledge on human-SARS-CoV-2 interactions by providing insights into relevant regulatory mechanisms.
Four RNA-seq datasets were retrieved from public databases for the present analysis (Figure 1). Cell line data (Blanco-Melo et al., 2020) were retrieved from NCBI using the SRP253951 BioProject identifier. For COVID patient tissue data, a search was done in NCBI using the key terms “rna-seq,” “lung,” “COVID,” and “Homo sapiens”. Two available datasets were selected for tissue data: i) data from Desai et al. (2020) downloaded using BioProject identifier SRP261138 (lung, heart, liver, bowel, and kidney samples), and ii) data from Delorey et al. (2021) downloaded from GEO using the GSE171668 identifier (lung samples). Due to the lack of healthy tissue samples in the available datasets, for the purpose of our project we retrieved lung data (TPM count matrix) from the GTEx project version 8 (Aguet et al., 2020). To be able to compare gene expression in cell culture vs. cells-in-tissue context, we retrieved single-cell data from Liao et al. (2020) using GEO with the GSE145926 identifier.
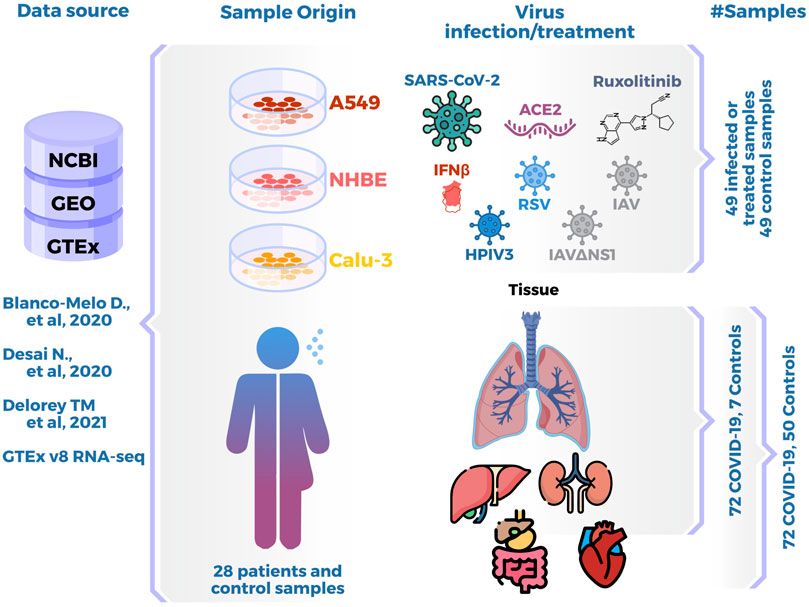
FIGURE 1. Data Summary. Data origin: studies and databases used to retrieve data. Sample origin: cell lines, patient or control biopsies, and in vitro viral infection or tissue. Last columns show number of samples in each analysis.
A uniform RNA-seq in-house preprocessing pipeline was used when raw data were available. In brief, a quality check was done using FastQC 0.11.3 (Andrews, 2010). Low-quality base calls, TruSeq2 adapters, and reads <40 base pairs (bps) were removed using Trimmomatic 0.33 (Bolger et al., 2014). Transcript quantification was performed using kallisto quant 0.45 (Bray et al., 2016) with GENCODE v38 as transcriptome reference (as similarly used in retrieved count matrices), and TPM counts were used for downstream analyses. A count matrix was generated using costume-made code (see Section 2.5). Batch correction was performed using ComBat_seq from the sva package 3.38.0 (Leek et al., 2012) with dates and sequencing platforms as batches and cell lines or tissue and state (healthy or infected) conditions as covariates.
Data were normalized to CPM counts when available only as count matrices. Batch correction was not performed for the Delorey et al. (2021) dataset as no sequencing differences were reported. For GTEx data, we divided data by tissues of interest (lung, heart, liver, bowel, and kidney samples) and performed batch correction using ComBat_seq across samples using a combination of batches identified by nucleic acid isolation and sequencing run (see Supplementary Table S2.1) and using tissue of origin as a covariate.
For downstream analyses, data were merged into three separate joint datasets: the first contained cell line data; the second contained all tissue data from Desai COVID samples and GTEx healthy samples; and the third joint dataset contained all lung samples from the first three sources (Supplementary Table S1). Each dataset was further processed and analyzed in parallel: i) data were summarized to one protein-coding transcript per gene (removing isoforms), and ii) batch correction was performed across samples when necessary. Batch correction was verified using PCA base function in R (Team, 2021).
For single-cell RNA-seq data, data were transformed to pseudo-bulk data using the function “aggregateAcrossCells” with default options from the scuttle version 1.0.4 package in R (McCarthy et al., 2017).
Gene regulatory networks were constructed using pySCENIC (Van de Sande et al., 2020) with the scenic_multiruns pipeline implemented by vsn-pipelines version 0.25.0 in a Nextflow (version 20.10.0) workflow, running it 100 times (params.sc.scenic.numRuns = 100) per joint dataset.
Regulons (sets of transcription factors and their target genes) were filtered according to their reproducibility; regulons had to be found at least 10 times across all runs, and target genes had to be assigned to the same TF at least five times. Assessment for differential activation (DA) was done with AUC SCENIC’s metric of transcriptional activity by comparing infected and mock samples using both Mann–Whitney U and Kolmogorov–Smirnov tests. Multiple testing correction was done using the Benjamin–Hochberg method in Python using the SciPy package (adjusted p-value <0.05 threshold was used for tissue analysis, and an adjusted p-value <0.1 for cell lines, given that detecting DA regulons for SARS-CoV-2 infecting Calu-3 was minimal). Regulon tissue/cell line and infection specificity was assessed using log2 fold change of the regulon specificity score log2 fold change (RSS LFC ≥ 0.001) by comparison with corresponding mock samples. Regulons were further filtered for over-activation (DA LFC >0).
Further data analysis was performed in R with Bioconductor packages. For general purposes, the tidyverse packages were used. For heatmaps and upset plots, the ComplexHeatmap (Gu, 2022) package was used. In-house code was developed to search for specific shared regulons across conditions. For biological term enrichment analysis, clusterProfiler and enrichplot were used (Wu et al., 2021).
The whole code developed for this project is available in GitHub: https://github.com/amedina-liigh/PulmonDB_COVID/.
To identify regulatory mechanisms unique to SARS-CoV-2 infection, we set out to characterize regulatory networks analyzing transcriptome data of viral infections by different respiratory viruses published by Blanco-Melo et al. (2020). They infected A549, NHBE, and Calu-3 cell lines with SARS-CoV-2 respiratory syncytial virus (RSV), influenza A virus (IAV), and human parainfluenza virus 3 (HPIV3). In order to further disentangle the impact of infection in the cellular response, they used a NS1 mutant for IAV (IAVdNS1), overexpressed ACE2 (cellular receptor used by SARS-CoV-2 to infect cells) in A459, and stimulated IFNβ response for NHEB.
To gain a general appreciation of how gene expression changes are triggered by each viral infection, we performed principal component analysis (PCA) (Figure 2A). After correcting for batch effects, we observed that samples from the same viral infection on the same cell type were clustered together (the same can be observed in the corresponding heatmap in Supplementary Figure S1A). In general, different viral infection data points generated separate clusters, the only exception being SARS-CoV-2 infecting Calu-3 and HPIV3 infecting A549 experiments that clustered together. SARS-CoV-2 infections cluster together with NHBE treated with IFNβ and A549 overexpressing ACE2, indicating that ACE2 is key for SARS-CoV-2 infection as reported by Yan et al. (2020). As expected, NHBE infected by IAV and the less pathogenic variant IAVdNS1 are located on opposite sides of the PCA. Moreover, we observed that cells cluster based on the extent of the IFN response to the viral infection. In general, our observations are consistent with previous reports (Blanco-Melo et al., 2020).
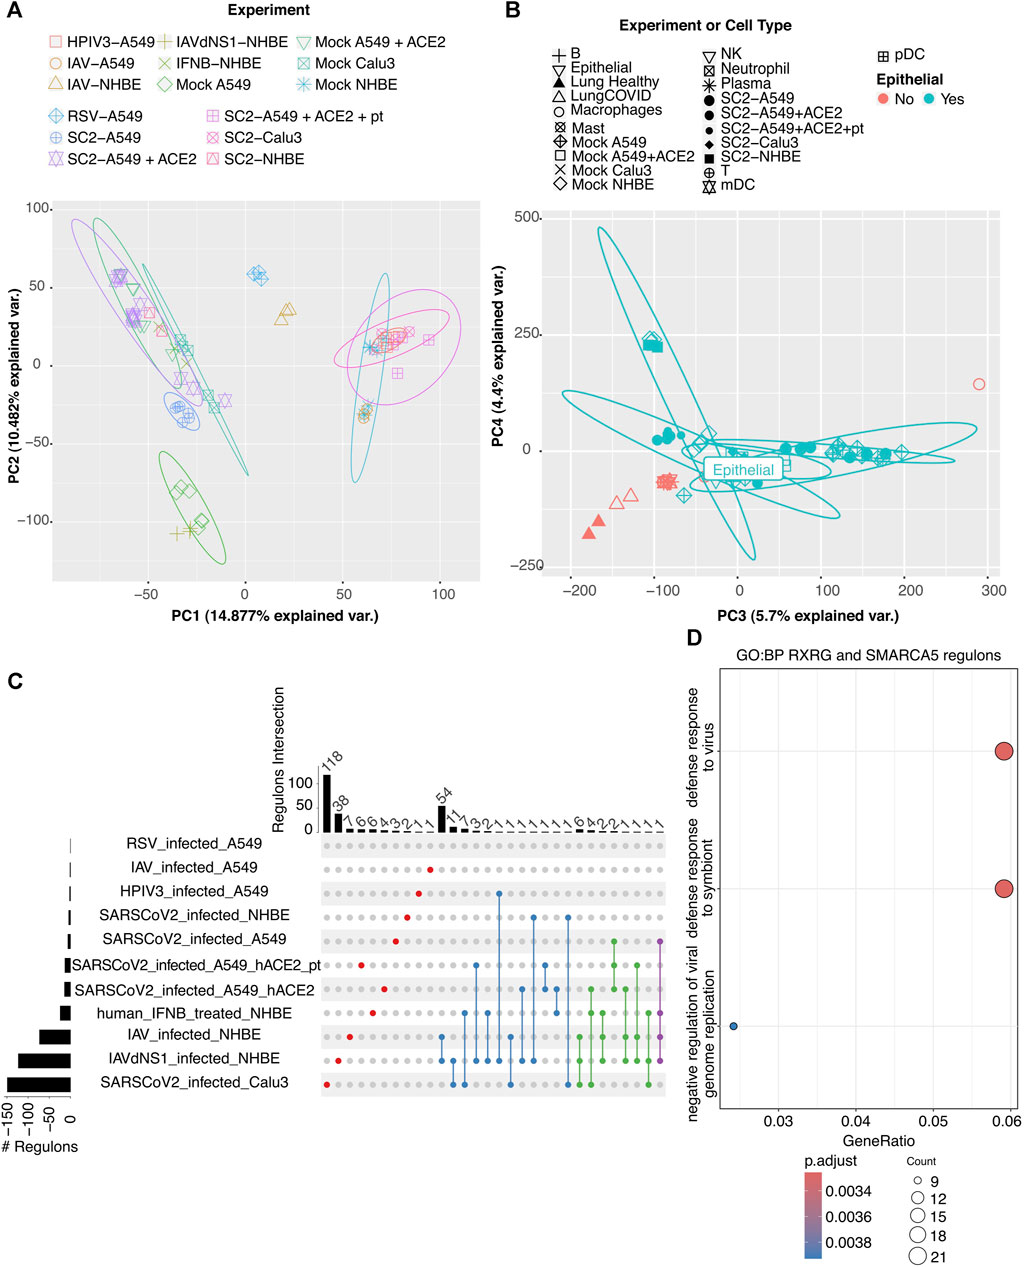
FIGURE 2. Analysis of transcriptome data for SARS-CoV-2 infection response in human lung cell lines. PCA of the transcriptome profile of cell lines with viral infections. (A) All viral infections (SARS-CoV-2, RSV, IAV, HPIV3, and IAVdNS1) and/or treatment (IFNβ and ACE2 expression) of A549, NHBE, and Calu-3. Each experimental condition has a specific color and data point shape and is indicated in the labels. (B) Same data as in (A) plus pseudo-bulk profiles of annotated lung epithelial and immune cells from single-cell RNA-seq from BALF. Dot shape corresponds to experiment or cell type and dot color to whether it is epithelial (green) or not (red). Epithelial cells from BALF are labeled. (C) Upset plot of differentially active and specific regulons per experiment compared to mock. Enriched Gene Ontology terms for (D) RXRG and SMARCA5, the regulons uniquely turned on upon SARS-CoV-2 infection.
To assess whether cell culture data could recapitulate viral infection in a tissue context, we integrated single-cell transcriptomic data for epithelial cells AT1 or AT2 from bronchoalveolar lavage fluid (Liao et al., 2020) and pseudo-bulked it to make it comparable to the bulk RNA-seq datasets. In our PCA, the AT2 data point (labeled as epithelial) was located in the vicinity of A549 infected by SARS-CoV-2 (Figure 2 B), confirming that cell line modeling could recapitulate this cell-type gene expression.
Regulatory networks were calculated using SCENIC (Aibar et al., 2017; Van de Sande et al., 2020). This tool uses correlation analysis across genes and samples, coupled with motif enrichment to identify regulatory networks. Using non-parametric tests (see “Methods” above) and the regulon specificity score (RSS), we identified regulons (sets of transcription factors and their target genes) that were differentially activated (DA), either over-activated or down-regulated, across cell types and viral infections. Supplementary Table S2 lists the DA regulons in the different cell lines in SARS-CoV-2 infection. We further selected DA regulons shared across SARS-CoV-2 infected cell lines (Figure 2C). We observed regulons RXRG and SMARCA5 to be unique to SARS-CoV-2 infection compared to other viral infections, and we found FOXP4 and ZNF730 regulons to be specific of SARS-CoV-2 infection in A549. DA regulons in SARS-CoV-2 infection were enriched for terms encompassing the main physiological responses related to COVID-19, such as viral response, apoptosis, and NF-kB signaling (Supplementary Figure S1C). Moreover, RXRG and SMARCA5 regulons’ enriched terms describe AT2 response to infection: viral response, apoptosis, and cell differentiation (Liao et al., 2020) (Figure 2D). In particular, for SARS-CoV-2 infection in NHBE, we found RNAi-mediated gene silencing terms, while for Calu-3, we observed cell migration, growth factor, and TGFbeta annotations, indicating tissue repair (Supplementary Figures S1B,D).
To assess the effect of SARS-CoV-2 in the regulatory response in the tissue context, we used data from Desai et al. (2020) and Aguet et al. (2017), taking data for patients and controls, respectively. In order to reliably combine data from different experiments, we performed a batch effect correction within each dataset and between them (see “Methods”). This correction reduced bias due to data origin (Figure 3B, Supplementary Figure S2). After correction, PCA showed clustering based on tissue type and infection; nevertheless, COVID-infected lung data showed the highest heterogeneity.
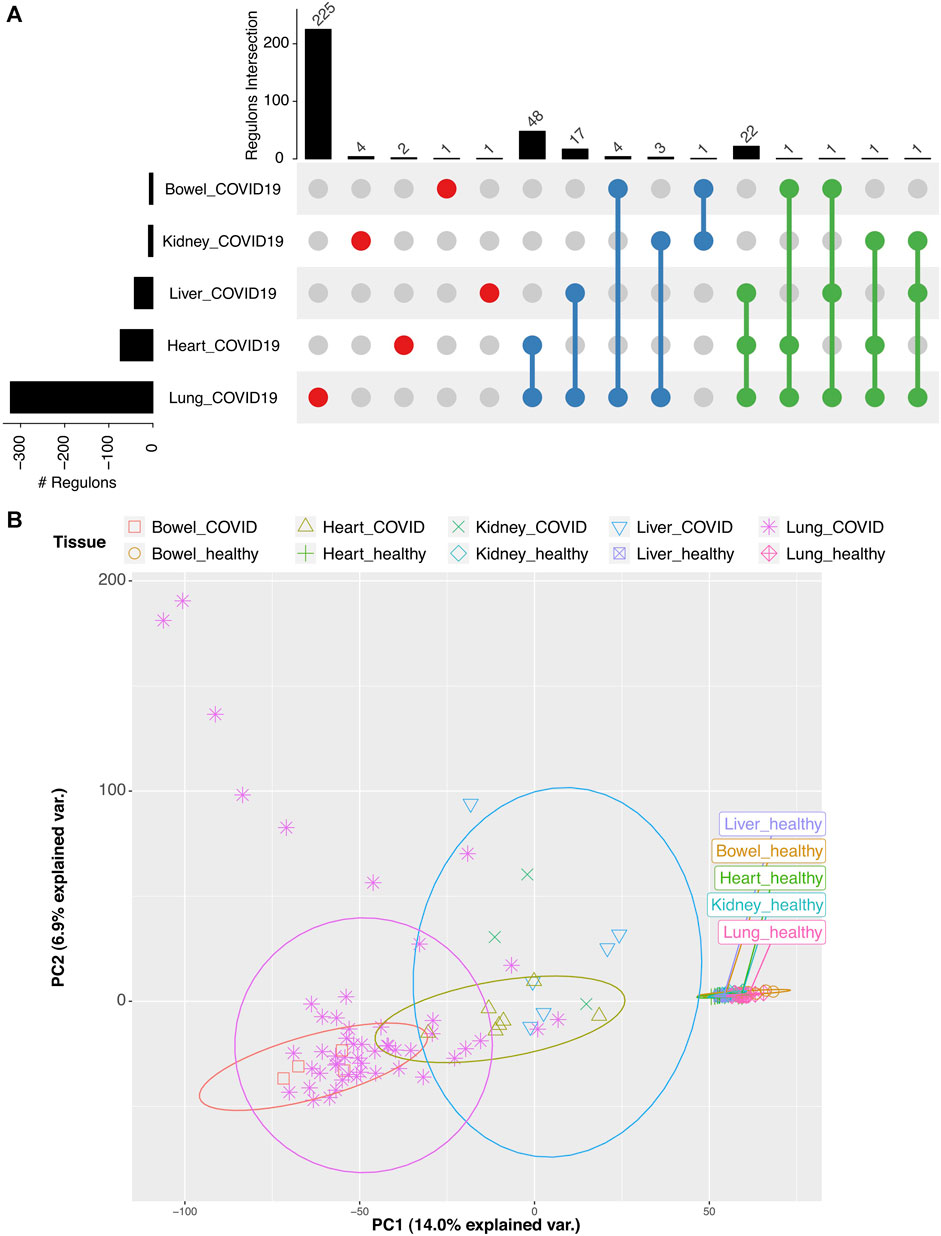
FIGURE 3. Analysis of transcriptome data for tissues with COVID-19 and controls. (A) Upset plot of differentially active and specific regulons per experiment compared to controls. (B) PCA of transcriptome profiles of tissues with COVID-19 and controls after batch correction.
Analyzing DA regulons in COVID tissues vs. controls (Supplementary Table S4), we found that the lung had the highest number (225) of tissue-specific DA regulons (Figure 3A), indicative of a more pronounced response due to the extensive consequences of an efficient viral replication. In comparison, other tissues showed a limited number of tissue-specific DA regulons (Figure 3A). The lung and heart shared the highest number (48) of DA regulons. Interestingly, the lung, heart, and liver shared 22 regulons, which included TFs known to play a role in IFN regulation—IRF1 and SMARCC1. The liver is one of the tissues reported to suffer extensive damage during SARS-CoV-2 infection (Lozano-Sepulveda et al., 2020). The KLF14 regulon is the only liver-specific DA regulon, and it is related to down-regulation of the type II receptors of TGFβ (Truty et al., 2009) (Supplementary Table S3).
Our functional enrichment analysis could not identify particular terms enriched in lung DA-activated regulons, probably due to extensive tissue damage. However, for the heart, liver, and kidney, we found enrichment for terms related to tissue repair under inflammatory conditions such as pathogen infection response, endocytosis, and proteolysis (Supplementary Figure S3).
In this study, we aimed to identify the DA regulons in SARS-CoV-2 infection to help elucidate relevant regulatory mechanisms that could open new research avenues. We set out to identify the DA regulons across different biological conditions and a variety of infected cell lines and tissues in order to identify regulons involved in particular infection response mechanisms for SARS-CoV-2 infection.
The comparison of DA regulons across cell lines infected with different viruses enabled us to identify regulons unique to SARS-CoV-2 infection, such as RXRG and SMARCA5. Target genes of these regulons are related to general viral response (Figure 2D). Retinoid X receptor α has been reported to suppress type I interferon response in viral infection, increasing host susceptibility to infections (Ma et al., 2014); hence, RXRG could underlie a similar response requiring further characterization. SMARCA5 is a general epigenetic remodeling factor, known for being related to cell immortalization (Thakur et al., 2022); SARS-CoV-2 might be triggering a survival response mediated by the upregulation of this TF. Of particular interest is the FOXP4 regulon upregulation because the loci have been recently reported to be related to long COVID (Lammi et al., 2023). Little is known about the functions of ZNF730; however, as with most zinc finger TFs, it was recently reported as overexpressed in tick-borne encephalitis virus-infected neurons and astrocytes (Selinger et al., 2022), making it of interest for future research.
We recovered previously identified regulons related to inflammatory response, such as IRF1 and SMARCC1. In particular, IRF1 has been previously reported to be upregulated in the lung, liver, and pancreas and related to changes in blood sugar metabolism (Shin et al., 2022). We further confirm this finding and demonstrate that target genes are also changing expression; hence, the regulon is likely active during SARS-CoV-2 infection.
Taking advantage of community efforts to unravel new biology by reanalyzing data is key for research continuity. Our analysis is based on public data that have been quickly released by the scientific community, enabling us to identify regulons relevant for future characterization of SARS-COV-2 infections. However, our study has limitations. Future studies including the identification of regulons using single-cell data are necessary as other efforts have been focused on releasing this type of data (Stephenson et al., 2021). Moreover, our results remain exploratory, and additional experiments remain to be implemented to confirm the biological relevance of our findings.
The original contributions presented in the study are included in the article/Supplementary Materials; further inquiries can be directed to the corresponding author.
MP-G: conceptualization, data curation, formal analysis, investigation, methodology, software, visualization, and writing–review and editing. LA-V: software and writing–review and editing. AV: conceptualization, data curation, formal analysis, methodology, supervision, and writing–review and editing. YIB-M: conceptualization, data curation, investigation, methodology, supervision, and writing–review and editing. LC: conceptualization, supervision, and writing–review and editing. JD: methodology, supervision, and writing–review and editing. DB-M: conceptualization, data curation, methodology, supervision, and writing–review and editing. AM-R: conceptualization, funding acquisition, investigation, methodology, project administration, resources, supervision, writing–original draft, and writing–review and editing.
The author(s) declare that financial support was received for the research, authorship, and/or publication of this article. AMR was supported by CONACYT-FORDECYT-PRONACES (grant no. [11311]) and Programa de Apoyo a Proyectos de Investigación e Innovación Tecnológica–Universidad Nacional Autónoma de México (PAPIIT-UNAM) (grant no. IA203021). YIB-M was supported by CONAHCYT-Fronteras (grant CF-2023-I-1653). Funding was provided to MP-G by RIABIO (Red Iberoamericana de Inteligencia Artificial para Big BioData, CYTED, reference 521RT0118, https://cyted.org/RIABIO) for a research stay in the CiC-IBMCC (CSIC/USAL) of Salamanca (Spain) where part of this work was developed.
This work received support from Luis Aguilar, Alejandro León, and Jair García of the Laboratorio Nacional de Visualización Científica Avanzada. The authors thank Carina Uribe Díaz, Christian Molina-Aguilar and Alejandra Castillo Carbajal for their technical support.
The authors declare that the research was conducted in the absence of any commercial or financial relationships that could be construed as a potential conflict of interest.
All claims expressed in this article are solely those of the authors and do not necessarily represent those of their affiliated organizations or those of the publisher, the editors, and the reviewers. Any product that may be evaluated in this article or claim that may be made by its manufacturer is not guaranteed or endorsed by the publisher.
The Supplementary Material for this article can be found online at: https://www.frontiersin.org/articles/10.3389/frnar.2024.1334873/full#supplementary-material
Aguet, F., Anand, S., Ardlie, K. G., Gabriel, S., Getz, G. A., Graubert, A., et al. (2020). The GTEx Consortium atlas of genetic regulatory effects across human tissues. Science 369, 1318–1330. doi:10.1126/science.aaz1776
Aguet, F., Ardlie, K. G., Cummings, B. B., Gelfand, E. T., Getz, G., Hadley, K., et al. (2017). Genetic effects on gene expression across human tissues. Nature 550, 204–213. doi:10.1038/nature24277
Aibar, S., González-Blas, C. B., Moerman, T., Huynh-Thu, V. A., Imrichova, H., Hulselmans, G., et al. (2017). SCENIC: single-cell regulatory network inference and clustering. Nat. Methods 14, 1083–1086. doi:10.1038/nmeth.4463
Blanco-Melo, D., Nilsson-Payant, B. E., Liu, W., Uhl, S., Hoagland, D., Møller, R., et al. (2020). Imbalanced host response to SARS-CoV-2 drives development of COVID-19. Cell 181, 1036–1045.e9. doi:10.1016/j.cell.2020.04.026
Bolger, A. M., Lohse, M., and Usadel, B. (2014). Trimmomatic: a flexible trimmer for Illumina sequence data. Bioinformatics 30, 2114–2120. doi:10.1093/bioinformatics/btu170
Bray, N., Pimentel, H., Melsted, P., and Pachter, L. (2016). Near-optimal probabilistic RNA-seq quantification. Nat. Biotechnol. 34, 525–527. doi:10.1038/nbt.3519
Delorey, T. M., Ziegler, C. G. K., Heimberg, G., Normand, R., Yang, Y., Segerstolpe, Å., et al. (2021). COVID-19 tissue atlases reveal SARS-CoV-2 pathology and cellular targets. Nature 595, 107–113. doi:10.1038/s41586-021-03570-8
Desai, N., Neyaz, A., Szabolcs, A., Shih, A. R., Chen, J. H., Thapar, V., et al. (2020). Temporal and spatial heterogeneity of host response to SARS-CoV-2 pulmonary infection. Nat. Commun. 11, 6319. doi:10.1038/s41467-020-20139-7
García-Sastre, A. (2017). Ten strategies of interferon evasion by viruses. Cell Host Microbe 22, 176–184. doi:10.1016/j.chom.2017.07.012
Guimarães Sousa, S., Kleiton de Sousa, A., Maria Carvalho Pereira, C., Sofia Miranda Loiola Araújo, A., de Aguiar Magalhães, D., Vieira de Brito, T., et al. (2022). SARS-CoV-2 infection causes intestinal cell damage: role of interferon’s imbalance. Cytokine 152, 155826. doi:10.1016/j.cyto.2022.155826
Hoffmann, M., Kleine-Weber, H., Schroeder, S., Krüger, N., Herrler, T., Erichsen, S., et al. (2020). SARS-CoV-2 cell entry depends on ACE2 and TMPRSS2 and is blocked by a clinically proven protease inhibitor. Cell 181, 271–280.e8. doi:10.1016/j.cell.2020.02.052
Hur, S. (2019). Double-stranded RNA sensors and modulators in innate immunity. Annu. Rev. Immunol. 37, 349–375. doi:10.1146/annurev-immunol-042718-041356
Lammi, V., Nakanishi, T., Jones, S. E., Andrews, S. J., Karjalainen, J., Cortés, B., et al. (2023). Long COVID host genetics initiative, FinnGen, DBDS genomic consortium, GEN-COVID multicenter study. Genome-wide association study of long COVID. bioRxiv Available at: https://www.medrxiv.org/content/10.1101/2023.06.29.23292056v1.
Leek, J. T., Johnson, W. E., Parker, H. S., Jaffe, A. E., and Storey, J. D. (2012). The sva package for removing batch effects and other unwanted variation in high-throughput experiments. Bioinformatics 28, 882–883. doi:10.1093/bioinformatics/bts034
Liao, M., Liu, Y., Yuan, J., Wen, Y., Xu, G., Zhao, J., et al. (2020). Single-cell landscape of bronchoalveolar immune cells in patients with COVID-19. Nat. Med. 26, 842–844. doi:10.1038/s41591-020-0901-9
Lozano-Sepulveda, S. A., Galan-Huerta, K., Martínez-Acuña, N., Arellanos-Soto, D., and Rivas-Estilla, A. M. (2020). SARS-CoV-2 another kind of liver aggressor, how does it do that? Ann. Hepatology 19, 592–596. doi:10.1016/j.aohep.2020.08.062
Ma, F., Liu, S.-Y., Razani, B., Arora, N., Li, B., Kagechika, H., et al. (2014). Retinoid X receptor α attenuates host antiviral response by suppressing type I interferon. Nat. Commun. 5, 5494. doi:10.1038/ncomms6494
Rostron, A. J., Stephenson, E., Reynolds, G., Botting, R. A., Calero-Nieto, F. J., Morgan, M. D., et al. (2021). Single-cell multi-omics analysis of the immune response in COVID-19. Nat. Med. 27, 904–916. doi:10.1038/s41591-021-01329-2
Ryu, G., and Shin, H.-W. (2021). SARS-CoV-2 infection of airway epithelial cells. Immune Netw. 21, e3. doi:10.4110/in.2021.21.e3
Selinger, M., Věchtová, P., Tykalová, H., Ošlejšková, P., Rumlová, M., Štěrba, J., et al. (2022). Integrative RNA profiling of TBEV-infected neurons and astrocytes reveals potential pathogenic effectors. Comput. Struct. Biotechnol. J. 20, 2759–2777. doi:10.1016/j.csbj.2022.05.052
Shin, J., Toyoda, S., Nishitani, S., Onodera, T., Fukuda, S., Kita, S., et al. (2022). SARS-CoV-2 infection impairs the insulin/IGF signaling pathway in the lung, liver, adipose tissue, and pancreatic cells via IRF1. Metabolism 133, 155236. doi:10.1016/j.metabol.2022.155236
Stephenson, E., Reynolds, G., Botting, R. A., Calero-Nieto, F. J., Morgan, M. D., Tuong, Z. K., et al. (2021). Single-cell multi-omics analysis of the immune response in COVID-19. Nat. Med. 27, 904–916. doi:10.1038/s41591-021-01329-2
Team, R. C. (2021). R: a language and environment for statistical computing. Vienna: R Foundation for Statistical Computing. Others (No Title).
Thakur, S., Cahais, V., Turkova, T., Zikmund, T., Renard, C., Stopka, T., et al. (2022). Chromatin remodeler Smarca5 is required for cancer-related processes of primary cell fitness and immortalization. Cells 11, 808. doi:10.3390/cells11050808
Tong, H., Chen, H., and Williams, C. M. (2022). Identification of transcription factors regulating SARS-CoV-2 tropism factor expression by inferring cell-type-specific transcriptional regulatory networks in human lungs. Viruses 14, 837. doi:10.3390/v14040837
Truty, M. J., Lomberk, G., Fernandez-Zapico, M. E., and Urrutia, R. (2009). Silencing of the transforming growth factor-β (TGFβ) receptor II by krüppel-like factor 14 underscores the importance of a negative feedback mechanism in TGFβ signaling. J. Biol. Chem. 284, 6291–6300. doi:10.1074/jbc.m807791200
Van de Sande, B., Flerin, C., Davie, K., De Waegeneer, M., Hulselmans, G., Aibar, S., et al. (2020). A scalable SCENIC workflow for single-cell gene regulatory network analysis. Nat. Protoc. 15, 2247–2276. doi:10.1038/s41596-020-0336-2
Wu, T., Hu, E., Xu, S., Chen, M., Guo, P., Dai, Z., et al. (2021). clusterProfiler 4.0: a universal enrichment tool for interpreting omics data. Innovation 2, 100141. doi:10.1016/j.xinn.2021.100141
Xu, H., Zhong, L., Deng, J., Peng, J., Dan, H., Zeng, X., et al. (2020). High expression of ACE2 receptor of 2019-nCoV on the epithelial cells of oral mucosa. Int. J. Oral Sci. 12, 8. doi:10.1038/s41368-020-0074-x
Keywords: COVID, SARS-CoV-2, gene regulatory network, transcription factor, interferon
Citation: Padilla-Gálvez M, Arteaga-Vazquez LJ, Villaseñor-Altamirano AB, Balderas-Martínez YI, Collado-Torres L, De Las Rivas J, Blanco-Melo D and Medina-Rivera A (2024) Identification of regulons modulating the transcriptional response to SARS-CoV-2 infection in humans. Front. RNA Res. 2:1334873. doi: 10.3389/frnar.2024.1334873
Received: 07 November 2023; Accepted: 18 January 2024;
Published: 20 February 2024.
Edited by:
Tobias von der Haar, University of Kent, United KingdomReviewed by:
Sean F. Monaghan, Rhode Island Hospital, United StatesCopyright © 2024 Padilla-Gálvez, Arteaga-Vazquez, Villaseñor-Altamirano, Balderas-Martínez, Collado-Torres, De Las Rivas, Blanco-Melo and Medina-Rivera. This is an open-access article distributed under the terms of the Creative Commons Attribution License (CC BY). The use, distribution or reproduction in other forums is permitted, provided the original author(s) and the copyright owner(s) are credited and that the original publication in this journal is cited, in accordance with accepted academic practice. No use, distribution or reproduction is permitted which does not comply with these terms.
*Correspondence: Alejandra Medina-Rivera, YW1lZGluYUBsaWlnaC51bmFtLm14
†ORCID ID: Leonardo Collado-Torres, orcid.org/0000-0003-2140-308X
Disclaimer: All claims expressed in this article are solely those of the authors and do not necessarily represent those of their affiliated organizations, or those of the publisher, the editors and the reviewers. Any product that may be evaluated in this article or claim that may be made by its manufacturer is not guaranteed or endorsed by the publisher.
Research integrity at Frontiers
Learn more about the work of our research integrity team to safeguard the quality of each article we publish.