 Felipe R. Blasco1,2
 Cleo A. C. Leite
 F. Tadeu Rantin
 David J. McKenzie
- 1Department of Physiological Sciences, Federal University of São Carlos, São Carlos, SP, Brazil
- 2Joint Graduate Program in Physiological Sciences, Federal University of São Carlos—UFSCar/São Paulo State University—UNESP, Araraquara, SP, Brazil
- 3School of Biosciences, University of Birmingham, Birmingham, United Kingdom
- 4UMR Marbec, Université Montpellier, CNRS, IRD, Ifremer, INRAE, Montpellier, France
We evaluated interindividual variation in traits of warming and hypoxia tolerance in a cohort (n = 24) of juvenile pacu Piaractus mesopotamicus, acclimated to 26°C, to investigate whether individuals tolerant to warming were also tolerant to hypoxia and whether individual tolerance depended on body mass or intrinsic traits of aerobic metabolism. Two traits of warming tolerance were measured, the critical thermal maximum (CTmax) in a static tank, with loss of equilibrium as the endpoint, and the critical thermal maximum for aerobic swimming (CTSmax) in a swim tunnel, with fatigue as the endpoint. Two traits of hypoxia tolerance were derived by static respirometry during progressive hypoxia, the critical saturation for regulation of standard metabolic rate (Scrit) and the regulation index (RI). At 39.7 ± 0.4°C (mean ± SD), CTmax was significantly higher than CTSmax, at 38.0 ± 1.0°C. Both traits had very low coefficient of variation within the cohort (CV, 1.1 and 2.6%, respectively), and CTmax was not correlated with any other trait. Individual Scrit (18.5 ± 7.2% saturation, CV 38.9%) and RI (76.0 ± 16.1% regulation, CV 45.6%) were correlated (R = 0.686), and both were significantly correlated with CTSmax (R = 0.472 and 0.475, respectively). This indicates that individuals tolerant to warming were also tolerant to hypoxia, although two individuals with low CTSmax were drivers of the correlations against Scrit and RI. The CTmax, CTSmax, and Scrit showed no dependence on body mass, but RI increased with mass (R2 = 0.286), indicating that larger individuals were more tolerant to hypoxia. When corrected for body mass, RI was no longer correlated with CTSmax, further revealing that the correlations were rather tenuous. Finally, we found no evidence that individual tolerance was dependent on intrinsic traits of aerobic metabolism. The results indicate that sublethal indicators, such as CTSmax, Scrit, and RI, can be useful in exploring correlations among traits of tolerance to warming and hypoxia in fishes, but more studies on more species with larger sample sizes are required to confirm these results and reveal if there are general patterns.
1 Introduction
Heatwaves and declines in dissolved oxygen concentrations are among the main threats that anthropogenic global change poses to fish populations worldwide, especially in tropical freshwater habitats (1–4). It is, therefore, important to evaluate tolerance to these stressors. Acute warming and hypoxia may share a common physiological mode of action in fishes because both stressors can challenge the animal's cardiorespiratory capacity to provide sufficient O2 to respiring tissues. In warming, this is mainly because O2 demand increases, in hypoxia because O2 availability falls (5–7). This has instigated research into whether the tolerance of the two stressors is interrelated [e.g., (5, 8–11)].
Individual variation in traits of physiological tolerance within fish species is expected to be a highly significant component of the relative vulnerability of populations to environmental stressors. This is because the prevailing patterns of variation in phenotypic tolerance will influence population sensitivity to stressors in the immediate term, and if the phenotypic variation is linked to underlying genetic diversity, this can provide scope for adaptability over the long term (12–16). Research has, therefore, been conducted to investigate whether individual tolerance to warming and hypoxia is linked in fish species such that an individual tolerant to one is also tolerant to the other (10, 17–20).
In general, these studies measured tolerance to warming and hypoxia using rapid tests in which fish were exposed to progressively higher temperatures in a critical thermal maximum (CTmax) protocol, or progressively lower dissolved oxygen levels in an incipient lethal oxygen saturation (ILOS) protocol (10, 17–20). These protocols use the loss of equilibrium (LOE) as the endpoint, which presumably reflects an acute failure of critical organs, the heart and the brain, that prevents fish from maintaining posture and equilibrium. This endpoint is an incipient lethal threshold because animals are unable to escape the condition and their survival is therefore threatened (17, 21). Presently, there is very little evidence that interindividual variation in CTmax is correlated with variation in ILOS (10, 17–20). However, it has been suggested that the lack of correlation may be because LOE occurs by different mechanisms in warming and hypoxia. At the CTmax, LOE may be caused by direct thermal impairment of critical organs, such as the heart and the brain (5, 22), whereas, at the ILOS, the LOE is presumably caused by O2 limitation (20).
There are less extreme protocols, which use sublethal thresholds with better-known underlying mechanisms, for measuring tolerance to warming and hypoxia than CTmax and ILOS in fishes. For instance, the critical thermal maximum for aerobic swimming (CTSmax) test uses fatigue from sustained exercise as a sublethal tolerance endpoint. A fish is progressively warmed while swimming aerobically until it transitions from aerobic to anaerobic swimming and then fatigues, which is attributed to an inability of the cardiorespiratory system to meet the combined oxygen demands of swimming plus warming (23–26). However, very little is known about interindividual variation in CTSmax in fish. There is evidence that it is not correlated with CTmax (24), but nothing is known about whether it is related to sublethal tolerance to hypoxia.
Sublethal tolerance to progressive hypoxia can be evaluated by respirometry, measuring the cardiorespiratory capacity of a fish to meet its metabolic demands for oxygen as availability falls (27–31). Most fish can regulate their oxygen uptake until a low dissolved oxygen threshold, below which their metabolic rate is obliged to “conform” to water oxygen availability and declines progressively. That threshold is the critical oxygen tension [Pcrit or saturation Scrit; see (27, 29)], and the lower an individual's Scrit, the greater their tolerance to hypoxia. Quite considerable interindividual variation in Scrit has been reported in fishes (32–34), and individual Scrit has been positively correlated with individual ILOS (34). The regulation index (RI) is another approach to measuring tolerance to progressive hypoxia from respirometry data. Rather than identifying a threshold oxygen saturation the RI provides a relative value of regulatory capacity throughout progressive hypoxia. It calculates the area between a line of perfect oxyregulation (oxygen uptake remains unchanged from normoxic rates throughout hypoxia) and a line of total oxyconformation (oxygen uptake rate declines in direct proportion to declining water oxygen saturation) and then calculates what percentage of this area is occupied by oxygen uptake of the fish during progressive hypoxia [see (31, 35)]. Nothing appears to be known about interindividual variation in fish RI, but all these sublethal thresholds offer opportunities to explore potential tolerance correlations.
Beyond correlations among tolerance traits, there has also been interest in evaluating whether body mass is significant for individual tolerance of warming and hypoxia in fish because aerobic metabolism and oxygen demand decline allometrically with mass (36–38). While there is little evidence that CTmax is affected by body mass (13), a single study to date has found that CTSmax declined significantly with increasing mass (24). Various studies have found that Scrit is influenced by body mass, but there is no clear consensus about the direction of effects [e.g., (32, 39–43)]. The potential relevance of individual body mass to correlations among tolerance traits has never been investigated.
Fishes show significant individual variation in traits of aerobic metabolism that is independent of their mass (44, 45) and there has been interest in exploring whether this is significant for tolerance of warming and hypoxia. The standard metabolic rate (SMR) of a fish is their minimal maintenance metabolic rate at their acclimation temperature when they are in a post-absorptive and inactive state and is typically measured indirectly by respirometry, as oxygen uptake (45, 46). The magnitude of an individual's SMR could clearly affect their capacity to meet their oxygen demands in progressive hypoxia (27, 32). Furthermore, individual SMR could also affect tolerance of warming, because there is evidence that individuals with low SMR have higher CTmax in a fish species (47). The absolute aerobic scope (AAS) is the cardiorespiratory capacity to provide oxygen for activities beyond SMR, it is also measured by respirometry and is calculated as the maximum capacity for oxygen uptake minus SMR (13, 45, 48). Previous studies have reported that high AAS is associated with high CTmax and low Scrit in fishes (32, 34).
We studied interindividual variation in CTmax, CTSmax, Scrit, and RI in a cohort of juvenile pacu, Piaractus mesopotamicus, a neotropical freshwater serrasalmid. Based on the previous research that we cited earlier, we investigated Hypothesis 1: that individuals tolerant to warming would also be tolerant to hypoxia. We evaluated whether tolerance traits depended on mass and whether this contributed to any correlations among traits. Once again, based on the previous research we cited earlier, we investigated Hypothesis 2: that relative individual tolerance would depend on mass-independent variation in traits of aerobic metabolism, with a particular focus on SMR and AAS.
2 Material and methods
2.1 Animals
Juvenile pacu (n = 24, body mass: ~50 g) of undetermined sex were provided by a local commercial supplier (Piscicultura Polettini, Mogi Mirim, State of São Paulo, Brazil) and transported to the Department of Physiological Sciences, Federal University of São Carlos (São Carlos, State of São Paulo). They were held indoors in tanks (500 L) supplied with well-aerated water within a recirculating bio-filtered system, at 26 ± 1°C and natural photoperiod, which was ~12 h of light and 12 h of dark during all experiments. Fish were fed ad libitum every 2 days with commercial pellets. After 3 weeks of acclimation, animals were passive integrated transponder (PIT)-tagged for individual identification. This involved anesthesia by balneation in an aerated solution of benzocaine (0.1 g l−1), with loss of dorsoventral orientation and cessation of ventilation within 5 min; the animal was immediately placed on a damp cloth, and the tag inserted into the dorsal musculature by hypodermic syringe in <30 s. The animal was then placed in a tank of well-aerated water, where they recovered normal swimming behavior within <20 min. All animals were fed again the following day and were then given at least 96 h before experimentation. Each fish was fasted for 24 h before any experimental protocol. The tagging and experimental protocols followed Brazilian National Council for Control of Animal Experimentation regulations and were approved by the Ethics Committee on Animal Use of the Federal University of São Carlos.
2.2 Experimental protocols
Each pacu was submitted to a series of protocols that followed the order shown in Supplementary Figure S1, and each protocol is described in detail later. After acclimation and PIT tagging, they were submitted to a swim test protocol in a tunnel respirometer, to measure traits of aerobic metabolism (Supplementary Figure S1). They were then recovered in a holding tank for at least 96 h and then tested for their tolerance of warming as CTmax and CTSmax (Supplementary Figure S1). After 4–5 weeks of recovery in routine holding conditions, each fish was placed in a static respirometer chamber to evaluate tolerance to hypoxia (Supplementary Figure S1).
2.2.1 Traits of aerobic metabolism by swimming respirometry
This swim test provided the first measure of individual SMR, denoted as SMRswim because it was measured by swimming respirometry (46), and of active metabolic rate (AMR), taken as the maximum rate of oxygen uptake achieved during aerobic exercise (23, 48). The AAS was then calculated as AMR – SMRswim. The swimming performance protocol also permitted the establishment of the relative swimming speed to be used in their CTSmax test (23).
The initial swim test (Supplementary Figure S1) was performed at 26 ± 0.1°C in a Steffensen-type swim tunnel as described by Blasco et al. (23). Fish were weighed to the nearest gram and measured for fork length to the nearest millimeter, then placed in the tunnel (volume 13.4 L and swim chamber dimension 400 × 110 × 110 mm) supplied with aerated, biofiltered water and left overnight at a swimming speed equivalent to 1 body length·s−1 [BL·s−1, corrected for solid blocking effect; (23)] to recover from handling. The next morning, the swimming speed was increased every 30 min in stages of 1 BL up to 5 BL·s−1. The objective was to obtain a range of speeds over which all individuals only used steady aerobic swimming (49, 50), that is, a swimming gait involving a steady rhythmic beating of the tail that relies on slow-twitch oxidative muscle (49, 50). Beyond 5 BL·s−1, swimming speed was increased by 0.1 BL every 10 s to identify gait transition speed (UGT) when an individual began to engage an unsteady anaerobic gait. This comprised intermittent powerful tailbeats that propelled the fish forward in the swim tunnel, after which it coasted back and then repeated the powerful tailbeat, a “burst and coast” swimming gait that relies on the recruitment of fast-twitch glycolytic muscle (49, 50). This was followed closely by fatigue when the fish fell back against the rear screen. The trial was then terminated by immediately reducing swimming speed to 1 BL·s−1, and after 30 min, the fish was returned to a second holding tank for at least 96 h under normal rearing conditions before testing thermal tolerance as described later.
Measurements of oxygen uptake (ṀO2) were made by stopped-flow respirometry at each aerobic swimming speed between 1 and 5 BL·s−1 and calculated as absolute rates (mmol·fish−1·h−1), considering the mass of the fish, the volume of the tunnel (minus the mass of the fish), and oxygen solubility at the prevailing temperature. Blank measurements were made before and after each trial and, if they increased over a trial, were presumed to do so linearly. Background respiration did not exceed 10% of fish ṀO2, and all data were corrected accordingly (51). The SMRswim, AMR, and AAS were then calculated (23, 24).
2.2.2 Tolerance to warming as critical thermal maxima
These tests were performed as described by Blasco et al. (23, 24). Fish were submitted to these two tests in groups of three at a time. To avoid a possible effect of exposure history on the two tolerance thresholds, 50% of fish were exposed to the CTmax first, and the other 50% to the CTSmax first, with at least 96 h of recovery between (24), with three fish being placed in a separate holding tank. The CTSmax was measured on a single individual per day in the swim tunnel over 3 days.
The static CTmax test was studied on groups of three fish at a time. The pacu were measured for mass to the nearest gram and then placed in a 68-L tank containing vigorously aerated water at 26°C and left overnight to recover from handling. The following morning, the water was warmed stepwise at 1°C every 30 min. The fish were warmed stepwise in a small tank until they start to exhibit erratic behavior, rolling sideways, followed by complete LOE. At the LOE, each fish was rapidly transferred to a recovery tank containing water at 26°C. Once they had regained normal swimming behavior, they were moved to their holding tank to recover. Their CTmax was then calculated as described by Blasco et al. (23), considering the highest temperature step fully completed plus the proportion of the last step that was endured before the LOE. For example, if a fish completed 30 min at 30°C and then 15 min at 31°C, the CTmax would be 30.5°C. Survival was 100%. If this was the first test applied (Supplementary Figure S1), the three fish were returned to a second holding tank for at least 96 h before their CTSmax test.
During a CTSmax test, fish are warmed stepwise while they swim using a steady aerobic gait up until a certain warm temperature when they increasingly engage in unsteady burst-and-coast anaerobic swimming, culminating in fatigue (23–25). Each individual was weighed to the nearest gram and measured for fork length to the nearest millimeter; then it was placed in the tunnel and recovered overnight from handling, swimming at a speed equivalent to 1 BL·s−1. The next morning, the speed was increased over 30 min until 85% of its own UGT so that each fish was exercising at the same relative proportion of its own aerobic swimming capacity (23). After 30 min at that speed, the temperature was increased by 1°C every 30 min. If a pacu rested against the rear screen for at least 10 s, they were rapidly removed from the tunnel and placed in a recovery tank at 26°C for 30 min. Fatigue is not due to lack of endurance—pacu acclimated to 26°C can swim steadily at 85% of UGT for at least 9 h, exceeding the duration of the CTSmax (23). The CTSmax was calculated as for CTmax but using fatigue as the endpoint (23). If this was the first test applied (Supplementary Figure S1), the animal was returned to a second holding tank for at least 96 h before the CTmax.
At each temperature step during the CTSmax, measurements of ṀO2 were made over the last 20 min as described for the swim test earlier, and the highest rate achieved was denoted as ṀO2max (23), which should not be confused with AMR at acclimation temperature in the swim test. Blank measurements were made before all trials, and at the highest temperature achieved after all trials, increases in background were presumed to be linear over temperature. Background respiration did not exceed 10% of fish ṀO2, and all data were corrected accordingly.
2.2.3 Metabolic rate and tolerance of hypoxia by static respirometry
After 4–5 weeks of recovery from the warming trials, in routine holding conditions, each fish was placed in a static respirometer chamber to obtain a second measure of their SMR, denoted as SMRstatic because it was measured by static respirometry (46). Their tolerance to hypoxia was then evaluated as Scrit and RI (27, 35) (Supplementary Figure S1). This was performed on four fish at a time over 36 h.
Static respirometry was performed using four semi-opaque white plastic respirometer chambers (LocknLock® food containers, vol. 4.4 l, dimensions 260 × 185 × 130 mm) immersed in 30 cm of water in a shallow tank, which received a flow of biofiltered, aerated water at a constant temperature of 26°C under a natural photoperiod. Disruption was kept to a minimum; ambient lighting was low, and opaque black plastic sheeting was positioned to avoid visual disturbance of the fish. All fish were placed into the respirometers in the afternoon between 16:00 and 17:00 to avoid any possible effects of circadian rhythms on metabolic rate, and the fish could not see each other to interact while in the chambers (51, 52).
Routine ṀO2 was measured once every 20 min for 36 h using an automated intermittent stopped-flow technique with continuous mixing of water by an external loop and submersible pump (51, 53, 54). Water oxygen levels in the respirometers were measured and recorded every 15 s with optodes (PreSens Oxy-4 mini, www.presens.de) and the associated software (Pre-Sens Oxy 4v2). Following 36 h, the fish were exposed to progressive hypoxia by closed respirometry (29). That is, the flushing pump was turned off, and the fish consumed the oxygen in its chamber down until 5% oxygen saturation, with oxygen recorded every 15 s throughout. At that point, the fish were removed and placed in a tank of aerated water at 26°C for 30 min of recovery, and then they were returned to their holding tank. Survival was 100%.
The ṀO2 over 36 h was calculated using linear least squares regression during each stopped-flow phase, as described previously (52). Overall water volume was 4.468 L when considering the volume of the recirculation loop, and fish mass (volume) was subtracted from the overall chamber volume. Background bacterial respiration was measured when fish were removed from their respirometers, and the chambers were refilled with aerated water at the end of an experimental run. Such consumption was negligible and never exceeded 5% of fish ṀO2, and corrections were applied accordingly. Individual SMR in the chambers (SMRstatic) was estimated by the quantile method, with q fixed at 0.15 (46, 51, 55).
To evaluate Scrit and RI in progressive hypoxia, measures of ṀO2 were resolved from 95 to 5% oxygen saturation by steps of 5 (95, 90, 85, 80, etc.) along the progressive decline in O2 saturation in the respirometer chamber. The pacu shows a typical oxyregulator response to hypoxia, maintaining routine ṀO2 relatively unchanged until a critical oxygen level beyond which ṀO2 declines below SMR and toward zero (56). Individual Scrit was calculated empirically, as the intersection of SMRstatic and a regression of ṀO2 values in the oxyconforming range of oxygen saturations (31, 32). The RI was also calculated empirically, based on the concept developed by Mueller and Seymour (35). First, we considered that perfect regulation and an RI of 100% would be attributed if an individual maintained their routine ṀO2 unchanged between 90 and 5%. By contrast, complete conformity and an RI of 0% would indicate that routine ṀO2 declined in a straight line from the rate measured at 90% down to the lowest ṀO2 measured, 5%. This line of conformity was calculated for each individual, from routine normoxic ṀO2 at 90% to the low hypoxic ṀO2 measure at 5%. The difference between the individual's measured ṀO2 and the estimated ṀO2 of complete conformity was calculated at each saturation step and summed. This sum was then calculated as a percentage of the total area defined by the horizontal line of perfect regulation and the linear decline of complete conformity (35).
2.3 Statistical analysis
All analyses were performed with Windows Excel and Sigma Plot 13.0 (Systat Software Inc.). The extent of individual variation in all traits was assessed as the coefficient of variation (CV). Hypothesis 1, that relative tolerance of warming and hypoxia was correlated across individuals, was tested by Pearson product-moment correlation of CTSmax, CTmax, Scrit, and RI. A paired t-test was used to compare CTSmax and CTmax. A potential contribution of individual body mass to tolerance was investigated by first regressing the four tolerance traits against mass to reveal if there was a significant effect. If there was a significant effect of mass, we calculated residuals for the trait in question and then investigated whether these residuals were correlated to the other tolerance traits. To investigate Hypothesis 2, that tolerance was dependent on traits of respiratory metabolism, the mass-independent measures of SMR, AMR, and AAS, as well as ṀO2max during the CTSmax, were first corrected for the well-established effect of body mass that follows a power relationship (24, 37) to calculate residuals. These residuals were then correlated with the tolerance traits, including, when relevant, the residuals of those traits against mass. A false discovery rate procedure was applied to each series of correlations to correct for the potential effects of multiple comparisons (57). The residual SMRswim was correlated with residual SMRstatic to investigate evidence of repeatability in the trait. The slope of the regression was compared to a slope of one, and the intercept was compared to zero using a t-test. All effects were considered statistically significant at p ≤ 0.05.
3 Results
The results are structured to respond to the hypotheses and research questions, we do not present the data from each protocol in the sequence in which they were measured. We collected a complete data set on 24 pacu. The mean (± SD) fish mass during the measures of respiratory metabolism and thermal tolerance was 84 ± 24 g, and individuals changed mass by <1 g between the sequential measures of respiratory metabolism, CTmax and CTSmax. The ratio of fish volume to swim tunnel volume was in the order of 1:165. The mean fish mass during the hypoxia trials was 106 ± 29 g, and the ratio of fish-to-chamber volume was in the order of 1:40.
3.1 Hypothesis 1: individual variation in tolerance of warming and hypoxia is correlated
The mean ṀO2 during the CTSmax and progressive hypoxia protocols is shown in Supplementary Figure S2. Warming caused a marked increase in the mean ṀO2 during the CTSmax protocol (Supplementary Figure S2A). In progressive hypoxia, the mean ṀO2 was regulated at or above the mean SMRstatic until an oxygen saturation between 15 and 20%, after which it declined steeply toward zero (Supplementary Figure S2B).
The mean and CV of the tolerance traits are shown in Table 1. The measures of warming tolerance, CTmax and CTSmax, showed limited interindividual variation, with CVs that were numerically much lower than the measures of hypoxia tolerance and all other measured traits (Table 1). The mean CTmax was significantly higher than the mean CTSmax (Table 1), but the two measures of warming tolerance were not correlated (Figure 1A). The two measures of hypoxia tolerance, Scrit and RI, had much higher CVs (Table 1) and were significantly negatively correlated (Figure 1B). This is consistent with their relative relationship to hypoxia tolerance, in which tolerant individuals would be expected to have low Scrit and high RI.
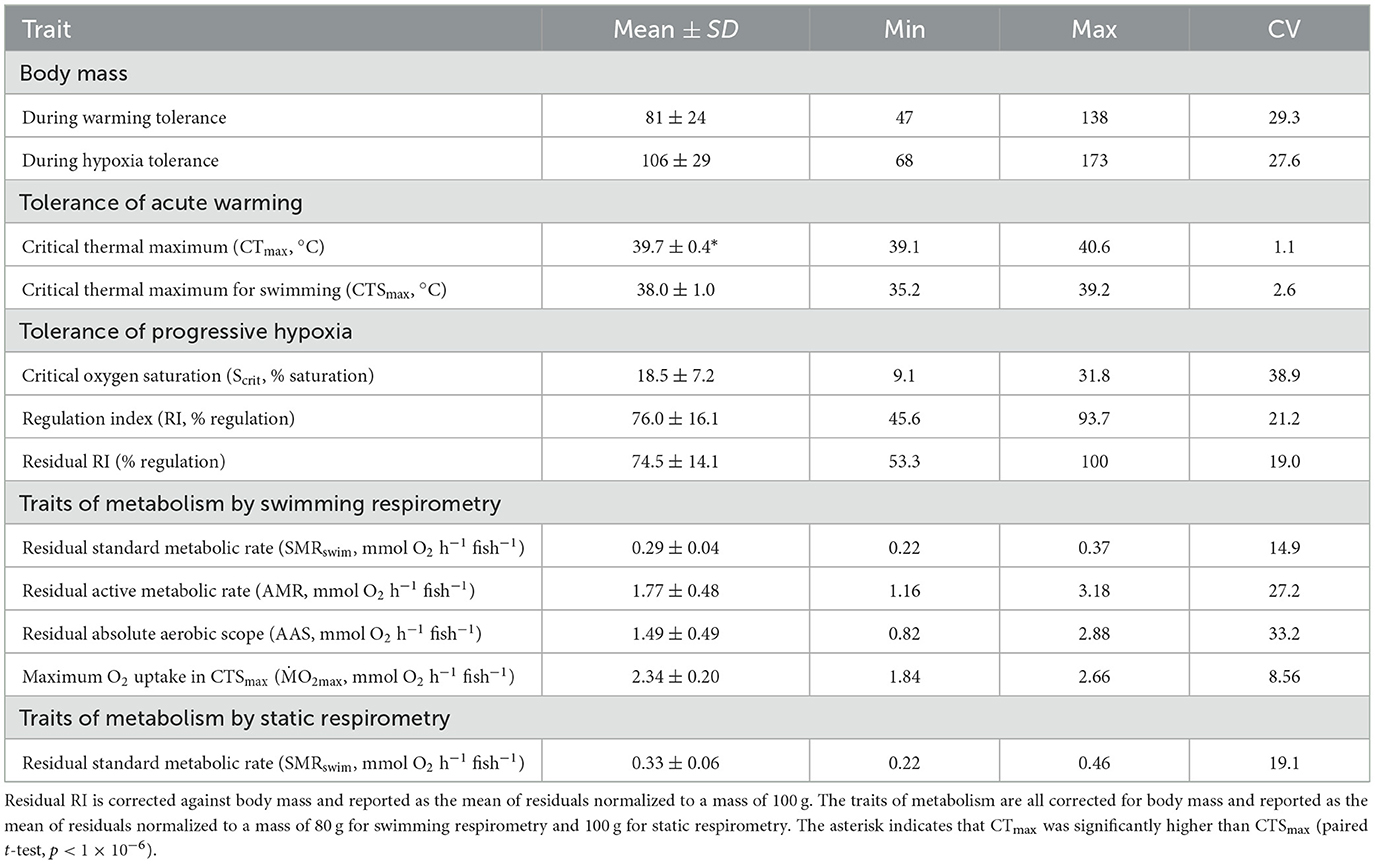
Table 1. Mean (± SD) of all measured variables in n = 24 pacu, plus the minimum (min), maximum (max), and coefficient of variation (CV) for each.
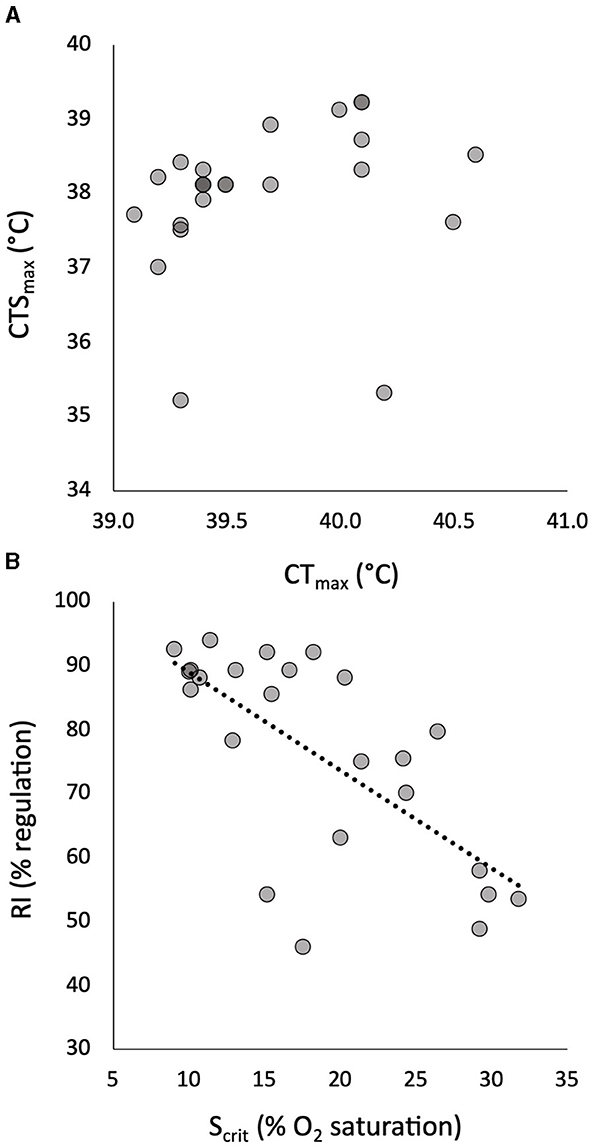
Figure 1. The relationship of individual critical thermal maximum (CTmax) to critical thermal maximum for aerobic swimming (CTSmax) in 24 pacu showed no significant correlation (A). The relationship of individual critical oxygen saturation (Scrit) to regulation index (RI) in progressive hypoxia in the same pacu showed a significant negative correlation (B). The least squares linear relationship in (B) is described by RI = −1.54(Scrit) + 104 (R = 0.686, p = 0.0002).
Individual CTmax had no relationship to the two traits of hypoxia tolerance (Figure 2A) whereas CTSmax was significantly correlated with both of them—negatively with Scrit and positively with RI (Figure 2B). That is, individuals with a high CTSmax during acute warming tended to have a lower Scrit and a higher RI in progressive hypoxia. It is noticeable, however, that two individuals with very low CTSmax were the drivers of the relationships, especially for Scrit (Figure 2B).
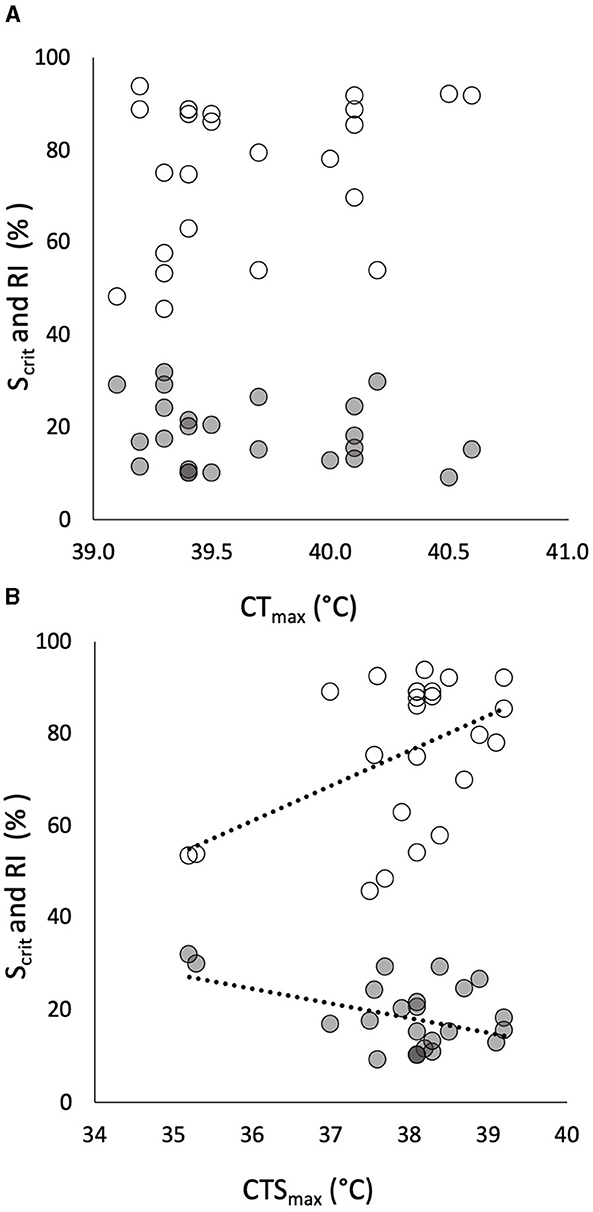
Figure 2. The relationships of individual critical oxygen saturation (Scrit, in % saturation, gray symbols) and regulation index (RI, in % regulation, white symbols) in progressive hypoxia (in % on the same axis) to individual critical thermal maximum (CTmax) in 24 pacu showed no significant correlation (A). The relationships, in the same pacu, of the same measures of hypoxia tolerance to individual critical thermal maximum for aerobic swimming (CTSmax) showed significant correlations (B). The least squares relationships in (B) are described by RI = 7.63(CTSmax) – 213 (R = 0.472, p = 0.020) and Scrit = −3.13(CTSmax) + 137 (R = 0.435, p = 0.034).
3.2 The contribution of body mass to tolerance
There was no significant effect of body mass on CTmax (R2 = 0.026, p > 0.05), CTSmax (R2 = 0.001, p > 0.05) or Scrit (R2 = 0.020, p > 0.05). The RI, however, showed a significant positive relationship to body mass, whereby this element of hypoxia tolerance was greater in the larger individuals of the cohort (Figure 3A). Once RI was corrected for this effect of body mass, residual RI still retained quite a large CV (Table 1), but the residuals were no longer correlated with CTSmax (Figure 3B).
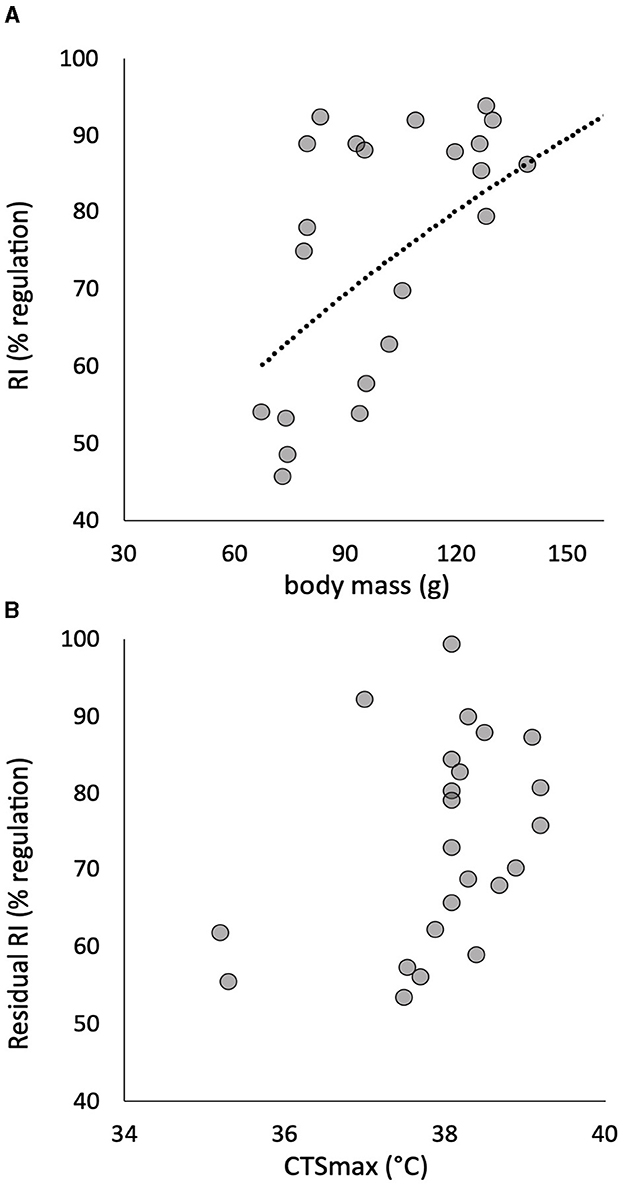
Figure 3. The power relationship of the individual regulation index (RI) to body mass in 24 pacu (A) showed a significant effect described by the least squares relationship RI = 7.36(mass0.50) + 104 (R2 = 0.286, p = 0.011). The residuals of this relationship are plotted against CTSmax, and there is no significant correlation (B). Residuals are calculated for a fish with a mass of 100 g.
3.3 Hypothesis 2: tolerance of warming and hypoxia is influenced by individual aerobic metabolism
All the traits of respiratory metabolism showed a strong positive dependence on body mass described by a power function (Supplementary Figure S3). The calculated residuals of the traits showed significant individual variation, with CVs that were intermediate between those of the warming tolerance and hypoxia tolerance traits (Table 1). There was a significant positive correlation between residuals of the two sequential measures of SMR, namely, SMRswim and SMRstatic (Supplementary Figure S3), despite being estimated by two different techniques of respirometry and the 4-week interval between the two measures. The estimated slope coefficient (± standard error) was 0.756 ± 0.259, which did not differ significantly from a slope of 1 (p > 0.05, Supplementary Figure S3). The intercept coefficient was 0.105 ± 0.077, which did not differ significantly from zero (p > 0.05). There was absolutely no evidence, however, that any of the tolerance traits had a significant dependence on any element of intrinsic metabolic phenotype. For example, neither CTmax nor CTSmax showed a remotely statistically significant dependence on residual SMRswim or residual AAS (Figure 4). Similarly, neither Scrit nor residual RI showed a remote statistical dependence on residual SMRstatic or residual AAS (Figure 5).
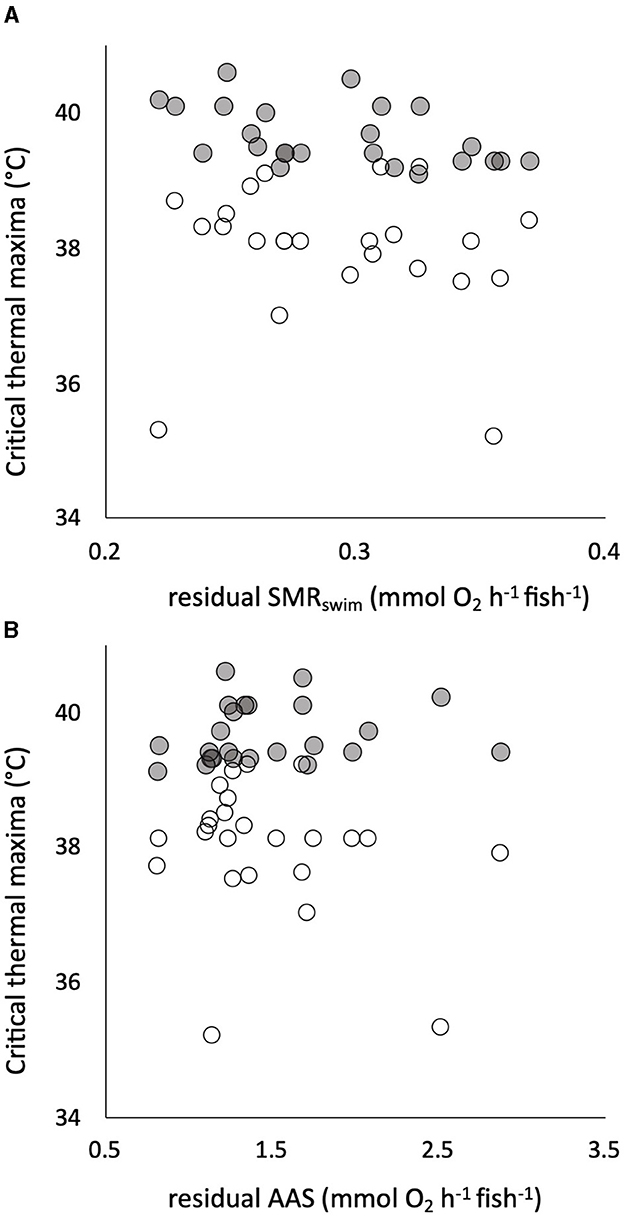
Figure 4. Individual critical thermal maximum (CTmax, gray symbols) and critical thermal maximum for aerobic swimming (CTSmax, white symbols) are plotted (in °C on the same axis) against the residuals of the relationship of standard metabolic rate (SMRswim) to body mass in 24 pacu (A). The same two measures of warming tolerance are plotted against the residuals of the relationship of absolute aerobic scope (AAS) to mass in the pacu (B). There were no significant relationships. Residuals were calculated assuming a mean body mass of 80 g, SMRswim indicates that it was measured by swimming respirometry (see the text for details).
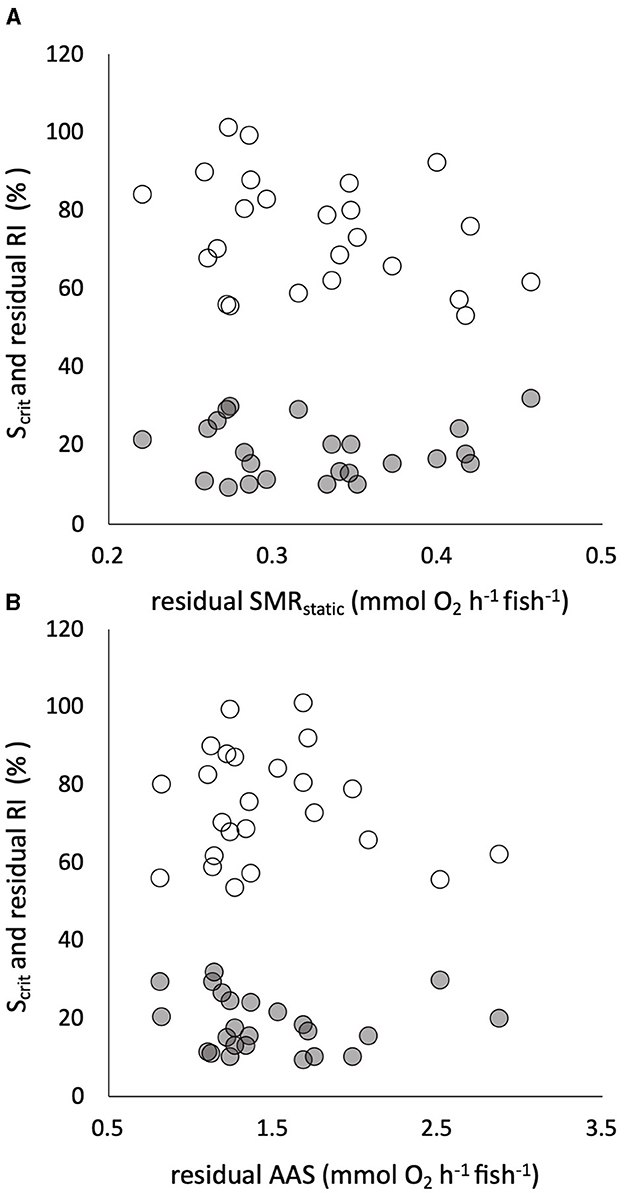
Figure 5. Individual critical oxygen saturation (Scrit, in % saturation, gray symbols) and the residuals of the regulation index (RI, in % regulation, white symbols) against body mass are plotted (in % on the same axis) against the residuals of the relationship of standard metabolic rate (SMRstatic) to body mass in 24 pacu (A). The two measures of hypoxia tolerance are plotted against the residuals of the relationship of absolute aerobic scope (AAS) to mass in the same pacu (B). There were no significant relationships. Residuals were calculated assuming a mean body mass of 100 g for SMR and 80 g for AMR, SMRstatic indicates that it was measured by static respirometry (see the text for details).
4 Discussion
The results provide support for the hypothesis that individual variation in sublethal tolerance of warming is positively correlated with variation in sublethal tolerance of hypoxia in a teleost fish. The correlation depended, however, on the method used and the tolerance endpoint, and the conclusion is tempered by the fact that (1) significant correlations were driven by two extreme individuals among the 24 pacu and (2) one correlation was annulled when RI was corrected for the effects of body mass. The results provide no support for the hypothesis that relative individual tolerance depends on intrinsic metabolic phenotype.
4.1 Intrinsic variation in tolerance traits
The fact that the mean CTmax was about 2°C higher than the mean CTSmax is in agreement with a previous study on this species (23). The finding that CTmax was not correlated with CTSmax has been observed previously in another tropical freshwater species, the Nile tilapia, Oreochromis niloticus (24). This may be partially due to the limited intrinsic variation in these traits, revealed by their very low CV, especially for CTmax; this limited range of phenotypic variation provides little scope to analyse correlation with other traits. Low interindividual variation in CTmax has been remarked on in other studies and is especially pronounced in tropical fish species (15, 20). The lack of variation may arise because the LOE is an incipient lethal endpoint at which acute heating causes the functional collapse of organs critical to immediate survival, the heart and the brain (22), which occurs at a similar high temperature in all individuals. Tropical species live at temperatures closer to this absolute thermal limit and so have less scope for individual variation in tolerance (15). It is interesting that CTSmax also had a very low CV compared to all other measured traits; this may also be linked to functional integrity approaching a common physiological “ceiling” (58) as the pacu were warmed.
The lack of correlation of CTmax and CTSmax may also, however, indicate that the two tolerance endpoints, LOE vs. fatigue from aerobic swimming, do not share common underlying mechanisms in the pacu. A similar conclusion was reached for a temperate marine teleost, the European sea bass, Dicentrarchus labrax (25). The LOE at CTmax may have many underlying mechanisms, which can differ among species, context and warming protocol (22, 59–61). The endpoint in the CTSmax, fatigue from aerobic swimming, has been attributed to an inability of the cardiorespiratory system to meet the combined oxygen demands of exercise plus warming. This supposition is supported by the fact that fatigue is preceded by gait transition from an aerobic to an anaerobic swimming style, a response that has been observed in six teleost species so far [(23, 25, 26); D.J. McKenzie, unpublished observations].
Studies that use Scrit to evaluate interindividual variation in hypoxia tolerance are not common in fishes (32, 34). Most studies have used LOE as an incipient lethal endpoint [e.g.. (10, 17, 19, 20, 62)] rather than focusing on sublethal endpoints linked clearly to the capacity for oxyregulation (32–34). There is evidence of quite broad individual variation in hypoxia tolerance in fish, irrespective of the endpoint used, which is coherent with the large CVs we obtained for Scrit and RI (17, 19, 32, 33, 62). The finding that Scrit and RI were significantly negatively correlated, in a manner consistent with their relative relationship to hypoxia tolerance, indicates that they share a causal mechanism. That is, they both reflect aspects of cardiorespiratory capacity for regulation of AMR as oxygen availability falls in progressive hypoxia (31, 32, 35). These results support previous findings by Zhang et al. (34), of a positive correlation between individual Scrit and the ILOS with the LOE as the endpoint in rainbow trout, Oncorhynchus mykiss.
4.2 Evidence that tolerance of acute warming is correlated with tolerance of progressive hypoxia
The finding that CTmax was not correlated with the measures of hypoxia tolerance may be for the same reasons as its lack of correlation to CTSmax. The finding that individuals with high CTSmax tended to have low Scrit and high RI suggests that these tolerance endpoints share common underlying mechanisms. Physiological traits that may be important for CTSmax, Scrit, and RI in fishes could include the capacity for respiratory gas exchange at the gills and O2 transport to tissues, and the efficiency of adenosine triphosphate (ATP) generation (62); these are interesting topics for further study. The correlations of CTSmax to Scrit and RI are in contrast to previous studies that compared CTmax and ILOS, with only one instance of significant correlation (20) compared to four instances where there was none (10, 17–19). The correlations in the present study were also, however, particularly dependent on two individuals with unusually low CTSmax, so these findings need confirmation in further fish species and with larger sample sizes.
4.3 Dependence of individual tolerance upon mass
The absence of any effect of body mass on CTmax is coherent with previous reports [reviewed in (13)]. The absence of any dependence of CTSmax on mass differs from a previous study on Nile tilapia, in which tolerance declined significantly with mass (24). Blasco et al. (24), however, studied fish of different ages over a mass range that was greater than one order of magnitude whereas the cohort of pacu were all the same age and only varied 3-fold in mass from smallest to largest. There is quite conflicting evidence regarding the effects of body mass on Scrit within species, with evidence that it decreases with mass (32, 39, 42), does not change (40, 43), or increases (41). This is the first evaluation of the potential effects of mass on RI in fishes, the increase in RI with mass would be consistent with studies finding a decrease in Scrit (32, 39, 42). If differences in mass within the cohort reflected differences in nutritional condition and physiological wellbeing between the largest and smallest individuals, it might be expected that all tolerance variables would increase with increasing mass, which was not the case. This increase in capacity for oxyregulation with mass in the pacu, measured as the RI, requires confirmation in other species. The fact that correcting RI for mass annulled the correlation with CTSmax is rather hard to interpret at this stage, without further studies, but it does reveal the somewhat tenuous nature of the correlation between RI and CTSmax. It is possible that, rather than whole body mass, the relative mass of organs, such as slow-twitch aerobic muscle, might correlate with an individual's tolerance of warming or hypoxia in fish.
4.4 Dependence of individual tolerance upon traits of aerobic metabolism
The data demonstrate that relative individual tolerance did not depend on variation in mass-independent traits of aerobic metabolism within the pacu cohort. In terms of thermal tolerance, there was no evidence of the dependence of CTmax on SMR that Ozolina et al. (47) reported in European seabass or of the positive link between AAS and CTmax when comparing rainbow trout, Oncorhynchus mykiss, strains (34). This study is the first to assess whether mass-independent metabolic traits influence CTSmax–the absence of any influence of AAS might be considered unexpected but was nonetheless very clear-cut. In terms of hypoxia tolerance, there was no evidence of the positive correlation of SMR to Scrit observed in Gulf killifish, Fundulis grandis (32), which might seem axiomatic because individuals with lower basal oxygen demand might be expected to be less challenged to regulate their metabolism in hypoxia. This finding in pacu also contrasts with previous studies that have shown correlations between individual SMR and behavioral responses to hypoxia such as the intensity of ASR and, in a species with bimodal respiration, the intensity of air-breathing (63, 64). By the same token, there was no evidence of the negative correlation of AAS to Scrit reported for Gulf killifish (32). The correlation of residual SMRswim with SMRstatic in the pacu demonstrates that metabolic phenotype was relatively repeatable, as has been demonstrated for many traits related to aerobic metabolism in fish [e.g., (32, 65–67)], and this reassures us about the reliability of our metabolic measurements in the pacu. Once again, it may be the relative mass of aerobic organs that defines an individual's relative tolerance to warming or hypoxia. More studies are therefore required, in more species, to evaluate the extent to which tolerance of environmental stressors depends on intrinsic metabolic phenotype in fishes.
5 Conclusion and perspectives
This study provides the first measures of inter-individual variation in CTSmax and RI within a cohort of fishes. It demonstrates that CTSmax, Scrit, and RI can be useful indicators to investigate correlations within individuals for their sublethal tolerance of warming and hypoxia. The finding that individuals tolerant of progressive warming, when measured as fatigue from aerobic swimming (CTSmax), were also more tolerant of progressive hypoxia, when measured as regulation of metabolism (Scrit and RI), is worthy of investigation in more species. There is also a need for further investigation of how body mass affects tolerance in individuals within and across cohorts of fish species and how tolerance depends on metabolic phenotype because the current evidence is mixed.
Data availability statement
The raw data supporting the conclusions of this article will be made available by the authors, without undue reservation.
Ethics statement
The study was conducted in accordance with the local legislation and institutional requirements. The tagging and experimental protocols followed Brazilian National Council for Control of Animal Experimentation (CONCEA) regulations and were approved by the Ethics Committee on Animal Use of the Federal University of São Carlos (CEUA/UFSCAR).
Author contributions
FB: Investigation, Writing—original draft, Methodology, Formal analysis, Data curation, Conceptualization. CL: Writing—review & editing, Validation, Supervision, Resources, Project administration, Funding acquisition, Conceptualization. FR: Methodology, Writing—review & editing, Supervision, Resources, Project administration, Funding acquisition, Conceptualization. ET: Writing—review & editing, Resources, Methodology, Conceptualization. DM: Writing—original draft, Validation, Supervision, Formal analysis, Data curation, Resources, Methodology, Conceptualization.
Funding
The author(s) declare that financial support was received for the research, authorship, and/or publication of this article. This study was financed in part by a grant to FRB from the Coordenação de Aperfeiçoamento de Pessoal de Nível Superior—Brasil (CAPES)–Finance Code 001, and by internal funding from the Centre National de la Recherche Scientifique (CNRS) to DM.
Acknowledgments
The authors are grateful to Piscicultura Polletini for donating the fish.
Conflict of interest
The authors declare that the research was conducted in the absence of any commercial or financial relationships that could be construed as a potential conflict of interest.
Publisher's note
All claims expressed in this article are solely those of the authors and do not necessarily represent those of their affiliated organizations, or those of the publisher, the editors and the reviewers. Any product that may be evaluated in this article, or claim that may be made by its manufacturer, is not guaranteed or endorsed by the publisher.
Supplementary material
The Supplementary Material for this article can be found online at: https://www.frontiersin.org/articles/10.3389/frish.2024.1276161/full#supplementary-material
References
1. Costa MF, Barletta M. Special challenges in the conservation of fishes and aquatic environments of South America. J Fish Biol. (2016) 89:4–11. doi: 10.1111/jfb.12970
2. Stillman JH. Heat waves, the new normal: summertime temperature extremes will impact animals, ecosystems, and human communities. Physiology. (2019) 34:86–100. doi: 10.1152/physiol.00040.2018
3. Woods HA, Moran AL, Atkinson D, Audzijonyte A, Berenbrink M, Borges FO, et al. Integrative approaches to understanding organismal responses to aquatic deoxygenation. Biol Bull. (2022) 243:85–103. doi: 10.1086/722899
4. Woolway RI, Jennings E, Shatwell T, Golub M, Pierson DC, Maberly SC. Lake heatwaves under climate change. Nature. (2021) 589:402–7. doi: 10.1038/s41586-020-03119-1
5. Earhart ML, Blanchard TS, Harman AA, Schulte PM. Hypoxia and high temperature as interacting stressors: will plasticity promote resilience of fishes in a changing world? Biol Bull. (2022) 243:149–70. doi: 10.1086/722115
6. Fry FEJ. The effect of environmental factors on the physiology of fish. In: Hoar WS, Randall DJ, , editors. Fish Physiology Volume 6. New York, NY: Academic Press (1971). p. 1–98.
7. McBryan TL, Anttila K, Healy TM, Schulte PM. Responses to temperature and hypoxia as interacting stressors in fish: Implications for adaptation to environmental change. Integr Comp Biol. (2013) 53:648–59. doi: 10.1093/icb/ict066
8. Anttila K, Dhillon RS, Boulding EG, Farrell AP, Glebe BD, Elliott JAK, et al. Variation in temperature tolerance among families of atlantic salmon (Salmo salar) is associated with hypoxia tolerance, ventricle size and myoglobin level. J Exp Biol. (2013) 216:1183–90. doi: 10.1242/jeb.080556
9. Burleson ML, Silva PE. Cross tolerance to environmental stressors: Effects of hypoxic acclimation on cardiovascular responses of channel catfish (Ictalurus punctatus) to a thermal challenge. J Therm Biol. (2011) 36:250–4. doi: 10.1016/j.jtherbio.2011.03.009
10. Healy TM, Brennan RS, Whitehead A, Schulte PM. Tolerance traits related to climate change resilience are independent and polygenic. Glob Chang Biol. (2018) 24:5348–60. doi: 10.1111/gcb.14386
11. McBryan TL, Healy TM, Haakons KL, Schulte PM. Warm acclimation improves hypoxia tolerance in Fundulus heteroclitus. J Exp Biol. (2016) 219:474–84. doi: 10.1242/jeb.133413
12. Bolnick DI, Amarasekare P, Araujo MS, Burger R, Levine JM, Novak M, et al. Why intraspecific trait variation matters in community ecology. Trends Ecol Evol. (2011) 26:183–192. doi: 10.1016/j.tree.2011.01.009
13. McKenzie DJ, Zhang Y, Eliason EJ, Schulte PM, Blasco FR, Claireaux G, et al. Intraspecific variation in tolerance of warming in fishes. J Fish Biol. (2020) 98:1536–55. doi: 10.1111/jfb.14620
14. Moran EV, Hartig F, Bell DM. Intraspecific trait variation across scales: Implications for understanding global change responses. Glob Chang Biol. (2016) 22:137–50. doi: 10.1111/gcb.13000
15. Nati JJH, Svendsen MBS, Marras S, Killen SS, Steffensen JF, McKenzie DJ, et al. Intraspecific variation in thermal tolerance differs between tropical and temperate fishes. Sci Rep. (2021) 11:1–8. doi: 10.1038/s41598-021-00695-8
16. Pacifici M, Foden WB, Visconti P, Watson JEM, Butchart SHM, Kovacs KM, et al. Assessing species vulnerability to climate change. Nat Clim Chang. (2015) 5:215–25. doi: 10.1038/nclimate2448
17. Claireaux G, Théron M, Prineau M, Dussauze M, Merlin FX, Le Floch S. Effects of oil exposure and dispersant use upon environmental adaptation performance and fitness in the European sea bass, Dicentrarchus labrax. Aquat Toxicol. (2013) 130–1:160–70. doi: 10.1016/j.aquatox.2013.01.004
18. Joyce W, Perry SF. Hypoxia inducible factor-1 α knockout does not impair acute thermal tolerance or heat hardening in zebrafish. Biol Lett. (2020) 16:20200292. doi: 10.1098/rsbl.2020.0292
19. Mauduit F, Farrell AP, Domenici P, Lacroix C, Le Floch S, Lemaire P, et al. Assessing the long-term effect of exposure to dispersant-treated oil on fish health using hypoxia tolerance and temperature susceptibility as ecologically relevant biomarkers. Environ Toxicol Chem. (2019) 38:210–21. doi: 10.1002/etc.4271
20. Strowbridge N, Northrup SL, Earhart ML, Blanchard TS, Schulte PM. Acute measures of upper thermal and hypoxia tolerance are not reliable predictors of mortality following environmental challenges in rainbow trout (Oncorhynchus mykiss). Conserv Physiol. (2021) 9:coab095. doi: 10.1093/conphys/coab095
21. Beitinger T, Lutterschmidt W. Temperature| measures of thermal tolerance. In: Farrell AP, , editor. Encyclopedia of Fish Physiology: From Genome to Environment. San Diego, CA: Elsevier Ltd. (2011). p. 1695–702.
22. Ern R, Andreassen AH, Jutfelt F. Physiological mechanisms of acute upper thermal tolerance in fish. Physiology. (2023) 38:141–58. doi: 10.1152/physiol.00027.2022
23. Blasco FR, Esbaugh AJ, Killen S, Rantin FT, Taylor EW, McKenzie DJ. Using aerobic exercise to evaluate sub-lethal tolerance of acute warming in fishes. J Exp Biol. (2020) 223:jeb218602. doi: 10.1242/jeb.218602
24. Blasco FR, Taylor EW, Leite CAC, Monteiro DA, Rantin FT, McKenzie DJ. Tolerance of an acute warming challenge declines with body mass in Nile tilapia: evidence of a link to capacity for oxygen uptake. J Exp Biol. (2022) 225:jeb244287. doi: 10.1242/jeb.244287
25. Nati JJH, Blasco FR, Rodde C, Vergnet A, Allal F, Vandeputte M, et al. In a marine teleost, the significance of oxygen supply for acute thermal tolerance depends upon the context and the endpoint used. J Exp Biol. (2023) 226:jeb245210. doi: 10.1242/jeb.245210
26. Steinhausen MF, Sandblom E, Eliason EJ, Verhille C, Farrell AP. The effect of acute temperature increases on the cardiorespiratory performance of resting and swimming sockeye salmon (Oncorhynchus nerka). J Exp Biol. (2008) 211:3915–26. doi: 10.1242/jeb.019281
27. Claireaux G, Chabot D. Responses by fishes to environmental hypoxia: Integration through Fry's concept of aerobic metabolic scope. J Fish Biol. (2016) 88:232–51. doi: 10.1111/jfb.12833
29. Rogers NJ, Urbina MA, Reardon EE, Mckenzie DJ, Wilson RW. A new analysis of hypoxia tolerance in fishes using a database of critical oxygen level (P crit). Conserv Physiol. (2016) 4:1–19. doi: 10.1093/conphys/cow012
30. Ultsch GR, Regan MD. The utility and determination of Pcrit in fishes. J Exp Biol. (2019) 222:1–9. doi: 10.1242/jeb.203646
31. Wood CM. The fallacy of the Pcrit - Are there more useful alternatives? J Exp Biol. (2018) 221:jeb163717. doi: 10.1242/jeb.163717
32. Reemeyer JE, Rees BB. Plasticity, repeatability, and phenotypic correlations of aerobic metabolic traits in a small estuarine fish. J Exp Biol. (2020) 223:jeb.228098. doi: 10.1242/jeb.228098
33. Rees BB, Matute LA. Repeatable interindividual variation in hypoxia tolerance in the gulf killifish, fundulus grandis. Physiol Biochem Zool. (2018) 91:1046–56. doi: 10.1086/699596
34. Zhang Y, Healy TM, Vandersteen W, Schulte PM, Farrell AP. A rainbow trout Oncorhynchus mykiss strain with higher aerobic scope in normoxia also has superior tolerance of hypoxia. J Fish Biol. (2018) 92:487–503. doi: 10.1111/jfb.13530
35. Mueller CA, Seymour RS. The regulation index: a new method for assessing the relationship between oxygen consumption and environmental oxygen. Physiol Biochem Zool. (2011) 84:522–32. doi: 10.1086/661953
36. Clarke A, Johnston NM. Scaling of metabolic rate with body mass and temperature in teleost fish. J Anim Ecol. (1999) 68:893–905. doi: 10.1046/j.1365-2656.1999.00337.x
37. Killen SS, Atkinson D, Glazier DS. The intraspecific scaling of metabolic rate with body mass in fishes depends on lifestyle and temperature. Ecol Lett. (2010) 13:184–93. doi: 10.1111/j.1461-0248.2009.01415.x
38. White CR, Marshall DJ, Alton LA, Arnold PA, Beaman JE, Bywater CL, et al. The origin and maintenance of metabolic allometry in animals. Nat Ecol Evol. (2019) 3:598–603. doi: 10.1038/s41559-019-0839-9
39. Everett MV, Crawford DL. Adaptation versus allometry: population and body mass effects on hypoxic metabolism in Fundulus grandis. Physiol Biochem Zool. (2010) 83:182–90. doi: 10.1086/648482
40. Nilsson GE, Östlund-Nilsson S. Does size matter for hypoxia tolerance in fish? Biol Rev. (2008) 83:173–89. doi: 10.1111/j.1469-185X.2008.00038.x
41. Pan YK, Ern R, Esbaugh AJ. Hypoxia tolerance decreases with body size in red drum Sciaenops ocellatus. J Fish Biol. (2016) 89:1488–93. doi: 10.1111/jfb.13035
42. Sloman KA, Wood CM, Scott GR, Wood S, Kajimura M, Johannsson OE, et al. Tribute to R. G. Boutilier: the effect of size on the physiological and behavioural responses of oscar, Astronotus ocellatus, to hypoxia. J Exp Biol. (2006) 209:1197–205. doi: 10.1242/jeb.02090
43. Virani NA, Rees BB. Oxygen consumption, blood lactate and inter-individual variation in the gulf killifish, Fundulus grandis, during hypoxia and recovery. Comp Biochem Physiol. (2000) 126:397–405. doi: 10.1016/S1095-6433(00)00219-1
44. Burton T, Killen SS, Armstrong JD, Metcalfe NB. What causes intraspecific variation in resting metabolic rate and what are its ecological consequences? Proceedings. Biol Sci. (2011) 278:3465–73. doi: 10.1098/rspb.2011.1778
45. Metcalfe NB, Van Leeuwen TE, Killen SS. Does individual variation in metabolic phenotype predict fish behaviour and performance? J Fish Biol. (2016) 88:298–321. doi: 10.1111/jfb.12699
46. Chabot D, Steffensen JF, Farrell AP. The determination of standard metabolic rate in fishes. J Fish Biol. (2016) 88:81–121. doi: 10.1111/jfb.12845
47. Ozolina K, Shiels HA, Ollivier H, Claireaux G. Intraspecific individual variation of temperature tolerance associated with oxygen demand in the European sea bass (Dicentrarchus labrax). Conserv Physiol. (2015) 4:1–10. doi: 10.1093/conphys/cov060
48. Norin T, Clark TD. Measurement and relevance of maximum metabolic rate in fishes. J Fish Biol. (2016) 88:122–51. doi: 10.1111/jfb.12796
49. Hachim M, Rouyer T, Dutto G, Kerzerho V, Bernard S, Bourjea J, et al. Oxygen uptake, heart rate and activities of locomotor muscles during a critical swimming speed protocol in the gilthead sea bream Sparus aurata. J Fish Biol. (2021) 98:886–90. doi: 10.1111/jfb.14621
50. Webb PW. Swimming. In: Evans DD, , editor. The Physiology of Fishes. Boca Raton, FL: CRC Press (1998). p. 1–38.
51. Killen SS, Christensen EAF, Cortese D, Závorka LZ, Norin T, Cotgrove L, et al. Guidelines for reporting methods to estimate metabolic rates by aquatic intermittent-flow respirometry. J Exp Biol. (2021) 224:jeb242522. doi: 10.1242/jeb.242522
52. McKenzie DJ, Estivales G, Svendsen JC, Steffensen JF, Agnèse JF. Local adaptation to altitude underlies divergent thermal physiology in tropical killifishes of the genus Aphyosemion. PLoS ONE. (2013) 8:e54345. doi: 10.1371/journal.pone.0054345
53. Mckenzie DJ, Vergnet A, Chatain B, Vandeputte M, Desmarais E, Steffensen JF, et al. Physiological mechanisms underlying individual variation in tolerance of food deprivation in juvenile European sea bass, Dicentrarchus labrax. J Exp Biol. (2014) 217:3283–92. doi: 10.1242/jeb.101857
54. Steffensen JF. Some errors in respirometry of water breathers: how to avoid and correct for them. Fish Physiol Biochem. (1989) 6:49–59. doi: 10.1007/BF02995809
55. Dupont-Prinet A, Chatain B, Grima L, Vandeputte M, Claireaux G, McKenzie DJ. Physiological mechanisms underlying a trade-off between growth rate and tolerance of feed deprivation in the European sea bass (Dicentrarchus labrax). J Exp Biol. (2010) 213:1143–52. doi: 10.1242/jeb.037812
56. Rantin FT, Del Guerra C, Kalinin AL, Glass ML. The influence of aquatic surface respiration (ASR) on cardio-respiratory function of the serrasalmid fish Piaractus mesopotamicus. Comp Biochem Physiol Part A. (1998) 119:991–7. doi: 10.1016/S1095-6433(98)00016-6
57. Pike N. Using false discovery rates for multiple comparisons in ecology and evolution. Methods Ecol Evol. (2011) 2:278–82. doi: 10.1111/j.2041-210X.2010.00061.x
58. Sandblom E, Clark TD, Gräns A, Ekström A, Brijs J, Sundström LF, et al. Physiological constraints to climate warming in fish follow principles of plastic floors and concrete ceilings. Nat Commun. (2016) 7:1–8. doi: 10.1038/ncomms11447
59. Andreassen AH, Hall P, Khatibzadeh P, Jutfelt F, Kermen F. Brain dysfunction during warming is linked to oxygen limitation in larval zebrafish. Proc Natl Acad Sci USA. (2022) 119:e2207052119. doi: 10.1073/pnas.2207052119
60. Lefevre S, Wang T, McKenzie DJ. The role of mechanistic physiology in investigating impacts of global warming on fishes. J Exp Biol. (2021) 224:jeb238840. doi: 10.1242/jeb.238840
61. Rezende EL, Castañeda LE, Santos M. Tolerance landscapes in thermal ecology. Funct Ecol. (2014) 28:799–809. doi: 10.1111/1365-2435.12268
62. Kraskura K, Nelson JA. Hypoxia tolerance is unrelated to swimming metabolism of wild, juvenile striped bass (Morone saxatilis). J Exp Biol. (2020) 223:jeb.217125. doi: 10.1242/jeb.217125
63. Killen SS, Marras S, Ryan MR, Domenici P, McKenzie DJ. A relationship between metabolic rate and risk-taking behaviour is revealed during hypoxia in juvenile European sea bass. Funct Ecol. (2012) 26:134–43. doi: 10.1111/j.1365-2435.2011.01920.x
64. McKenzie DJ, Belao TC, Killen SS, Rantin FT. To boldly gulp: standard metabolic rate and boldness have context-dependent influences on risk-taking to breathe air in a catfish. J Exp Biol. (2015) 218:3762–70. doi: 10.1242/jeb.122903
65. Killen SS, Glazier DS, Rezende EL, Clark TD, Atkinson D, Willener AST, et al. Ecological influences and morphological correlates of resting and maximal metabolic rates across teleost fish species. Am Nat. (2016) 187:592–606. doi: 10.1086/685893
66. Norin T, Malte H, Clark TD. Differential plasticity of metabolic rate phenotypes in a tropical fish facing environmental change. Funct Ecol. (2015) 30:369–78. doi: 10.1111/1365-2435.12503
Keywords: CTmax, CTSmax, Scrit, regulation index, standard metabolic rate, aerobic scope
Citation: Blasco FR, Leite CAC, Rantin FT, Taylor EW and McKenzie DJ (2024) Individual variation in sublethal tolerance of warming and hypoxia in the pacu Piaractus mesopotamicus: an investigation of correlations and dependence on intrinsic metabolic phenotype. Front. Fish Sci. 2:1276161. doi: 10.3389/frish.2024.1276161
Received: 11 August 2023; Accepted: 29 March 2024;
Published: 26 April 2024.
Edited by:
Sébastien Alfonso, Université de Nice Sophia Antipolis, FranceReviewed by:
Christel Lefrancois, UMR7266 Littoral, Environnement et Sociétés (LIENSs), FrancePierluigi Carbonara, COISPA Tecnologia & Ricerca, Italy
Copyright © 2024 Blasco, Leite, Rantin, Taylor and McKenzie. This is an open-access article distributed under the terms of the Creative Commons Attribution License (CC BY). The use, distribution or reproduction in other forums is permitted, provided the original author(s) and the copyright owner(s) are credited and that the original publication in this journal is cited, in accordance with accepted academic practice. No use, distribution or reproduction is permitted which does not comply with these terms.
*Correspondence: David J. McKenzie, ZGF2aWQubWNrZW56aWVAY25ycy5mcg==