 Yasar Majib
 Mohammed Alosaimi
 Andre Asaturyan
 Charith Perera
95% of researchers rate our articles as excellent or good
Learn more about the work of our research integrity team to safeguard the quality of each article we publish.
Find out more
DATA REPORT article
Front. Internet Things , 17 October 2023
Sec. Security, Privacy and Authentication
Volume 2 - 2023 | https://doi.org/10.3389/friot.2023.1275080
This article is part of the Research Topic Socio-technical Cybersecurity and Resilience in the Internet of Things View all 8 articles
The smart home concept is becoming increasingly popular due to the amenities it offers such as improving the quality of life of occupants by increasing convenience, comfort, privacy, and security. The emergence of the Internet of Things (IoT) has made it possible to join smart devices connected to the physical world to the internet. This allows remote monitoring, automation, and control by either users, other devices, or other systems over the internet. Due to the impact of IoT devices on our lives, smart homes are becoming dynamic and more complex, with various devices and sensors which are constantly generating massive amounts of data. These data have various applications, such as understanding users’ behaviour, improving efficiency (e.g., energy), and detecting anomalies. This report presents a dataset from a variety of sources such as cyber (network traffic), smart devices, and environmental sensors. Along with individual RAW datasets, we also provide a dataset based on a single timeline by merging together the separate datasets, making it easier to analyse user behaviour and detect subsequent anomalies. Furthermore, we inflate smart devices and environmental sensor datasets from a lower frequency—such as a maximum of one second—to a higher frequency according to the cyber dataset (because of its very high frequency). The total period of the dataset is 4 weeks, of which 3.5 weeks were acted by a main actor (for normal activities) and 3 days by a second actor (for anomalous activities). The main motivation for this study is to create a dataset for researchers to train and evaluate machine learning (ML) models for smart homes and analyse and detect anomalies in user behaviour. By combining data from multiple sources, a complete picture of user behaviour can be visualised which can also help in detecting anomalous activities that may not be detectable from a single data source. The resulting dataset can be utilised to improve the performance of existing ML models or to develop new ML models to capture the complexity of smart home environments. We used a combination of tools and techniques to capture the data.We captured network traffic using TShark (2023) and HomeAssistant (2023) (HA) for smart device activity. We created a custom tool to capture environmental data from sensors, including temperature, humidity, motion, illumination, air quality, proximity, pressure, and noise. The devices were installed on two different floors of a house, connected via WiFi, Ethernet, or ZigBee (ZB). After capturing the data, we processed, cleaned, normalised, and repaired it to remove any capture errors or static/irrelevant information. We then merged the separate datasets into a single timeline to create a unified dataset from multiple sources. Its final form is a CSV file with 564 features from a large number of heterogeneous devices. We thus present a comprehensive, processed, cleaned, normalised, and ready-to-use dataset from cyber–physical sources that can be used to train machine learning models for smart home applications such as activity detection, user behaviour recognition, and context-aware anomaly detection.This dataset will help researchers find answers to the following research questions: i) whether both cyber and physical on a single timescale can enhance results activity recognition or anomaly detection in smart homes; ii) determine the different techniques for fusing data from multiple sources in smart homes; iii) compare datasets for both activity recognition and anomaly detection in smart homes. One of the use cases of the dataset can be to detect the behaviour of new actors in smart homes who may be an intruder with some high level of understanding of the legitimate resident of the smart home. The dataset contains activities of two different researchers/actors. The first actor is considered the primary resident of the smart home and the second actor (introduced for a short time) can be considered an intruder/anomalous actor. This dataset can thus be used to detect behavioural anomalies (drifts) of users in a smart home environment.
The rise of smart devices and the IoT for domestic applications has resulted in an exponential growth in the data generated by smart homes. These can provide valuable insights into users’ behaviour and habits and thus can be used to develop context-aware applications for a smart home. However, analysing smart home data can be overwhelming because of the diversity and heterogeneity of smart devices, environmental sensors, and network traffic added to the complexity of user behaviour. Furthermore, smart home datasets are typically siloed into separate data streams of information on different time scales and frequencies, such as environmental sensors or data from smart devices or network traffic packets, making it difficult to form a holistic understanding of users’ behaviour. For example, Figure 1v reflects generic cyber–physical data from human activity in a smart home; the text in blue represents continuous activity, whereas all other activities are binary. In order to better understand the activity from the data, it is vital to gain a holistic view of cyber and physical data from the activity. It is also important to have multiple data sources to develop anomaly detection algorithms with better accuracy and fewer false positives. To address these challenges, we present a novel smart home dataset that combines network traffic, smart devices, and environmental sensor data into a single timeline, enabling considerable analysis of user behaviour in order to detect anomalies.

FIGURE 1. Zero-Bills house in BRE and generic example of cyber–physical activity.
The main motivation for this dataset is to enable researchers to develop novel ML models or to enhance/optimise existing ML models that can predict and detect anomalies in user behaviour. Existing, publicly available datasets contain data from either physical sensing or network traffic, whereas our dataset contains both cyber and physical data streams. Our aim, by publishing this dataset, is to facilitate research into smart home applications that are tailored and context-aware. This dataset should be valuable to researchers in the fields of smart homes, IoT, and machine learning, as well as to developers of applications. We hope that it will enable the development of useful and innovative applications that promote energy efficiency, enhance user experience (UX), and, most importantly, heighten the privacy and security of users in future smart homes.
Our aim is to explain the need for a cyber–physical smart home dataset and to explain in detail how we collected the dataset, which will help researchers better employ it for their own analysis. This work presents a new dataset that combines multiple (cyber–physical) sources captured in a smart home environment over a 4-week period. The dataset includes data from network traffic, smart devices such as smart TV, voice assistants, smart power plugs, smartphone, smart light bulbs, motion sensors, and security cameras, as well as environmental sensors such as temperature, humidity, illumination, proximity, air quality, and noise sensors. The dataset contains the activities of two researchers who acted independently over different time frames, knowing little about each other’s activity patterns; this can help detect anomalous behaviour in activities of daily living (ADLs). The dataset was converted into a single timeline, keeping a timestamp of network packets due to rapid frequency. We thus inflated the dataset according to the frequency of the cyber dataset, and we filled the data of each stream with latest known values. The contribution of this work is twofold. First, it provides a comprehensive impression of the smart home environment by capturing the interactions between cyber, smart devices, and environmental sensor data. It also includes a timeline that merges all data sources as a single source, making it easier to analyse and develop ML models.
This section introduces a number of smart home datasets that are already publicly available to researchers in the smart home domain. Some of these datasets provide both network traffic and sensor reading data, similar to our work. These datasets are useful for researchers to perform experiments and to evaluate and test smart home applications along with privacy and security. Two datasets published by the MIT Media Lab’s “House_n” repository are used by various researchers for the smart home domain. Tapia et al. (2004) includes single-occupant data from environmental sensors, energy consumption, and wearable sensors for a period of 3 months. Another dataset by Intille et al. (2005), also known as MIT PlaceLab, provides a multi-occupant dataset for 3 weeks that includes audio–visual recordings on top of environmental sensors, energy consumption, and wearable sensors. The Georgia Tech Aware Home (GTAH) Research Initiative offers an on-request dataset that provides features from sensors and smart devices with four participants. This dataset of Kientz et al. (2008) includes motion sensors, door sensors, and smart devices such as thermostats. DOMUS is a publicly available smart home dataset that contains data for temperature, humidity, light, and motion sensors (Gallissot et al., 2011). It was collected from a real smart home for a period of almost a year. The sensors were installed in different areas of the house to monitor the activities of its occupants and environmental conditions. It has a high sampling rate, which provides fine-grained temporal information about environmental conditions while enabling researchers to analyse the data from different time scales and identify patterns and trends that might not be apparent at coarser time scales. DOMUS has been adopted in many studies to develop ML models for activity recognition, occupancy detection, and energy consumption prediction in smart homes. Another publicly available dataset published by UCI Smart Home (UCIH) uses similar sensors and devices for ADLs and behaviour in smart homes with a single participant (Anguita et al., 2012). The Center for Advanced Studies in Adaptive Systems (CASAS) dataset provides data from various sensors and devices for ADLs and user behaviour as well as energy consumption in multiple smart homes and participants (Cook et al., 2013). The Ambient-Assisted Living (AAL) Research and Application System (ARAS) dataset was published in the same year by Alerndar et al. (2013) and includes multi-user data from motion, contact, and environmental sensors, including information about user activities over a couple of months. A non-intrusive load management (NILM) dataset named UK-DALE (Domestic Appliance-Level Electricity) was shared by Kelly et al. (2015) for six homes in the United Kingdom. This dataset contains both aggregated and appliance-level power consumption data and 5,000 h of power readings from lighting, kitchen, audio–visual, laundry, and heating category appliances with a 1-s frequency. A cyber-only dataset was collected by Miettinen et al. (2017) which provides network traffic and smart devices data for public use, IoT-Sentinel focused on cyber threats and attack detection by fingerprinting IoT devices. Lastly, Luca Arrotta et al. (2022) recently published a 16-hour multi-occupant dataset collected using environmental sensors and wearable and smart devices from a single house. Table 1 provides a holistic comparison between other publicly accessible smart-home datasets with our dataset, based on the activities of daily living, user behaviour, energy consumption, network traffic, environmental sensors, and smart devices. All datasets are publicly available except for GTAH, which is available on request. In contrast with previous datasets, ours provides cyber (network traffic), physical (environmental sensors), smart device, energy consumption of individual devices, user behaviour, and activities of daily living data on a synchronised single shared timeline.
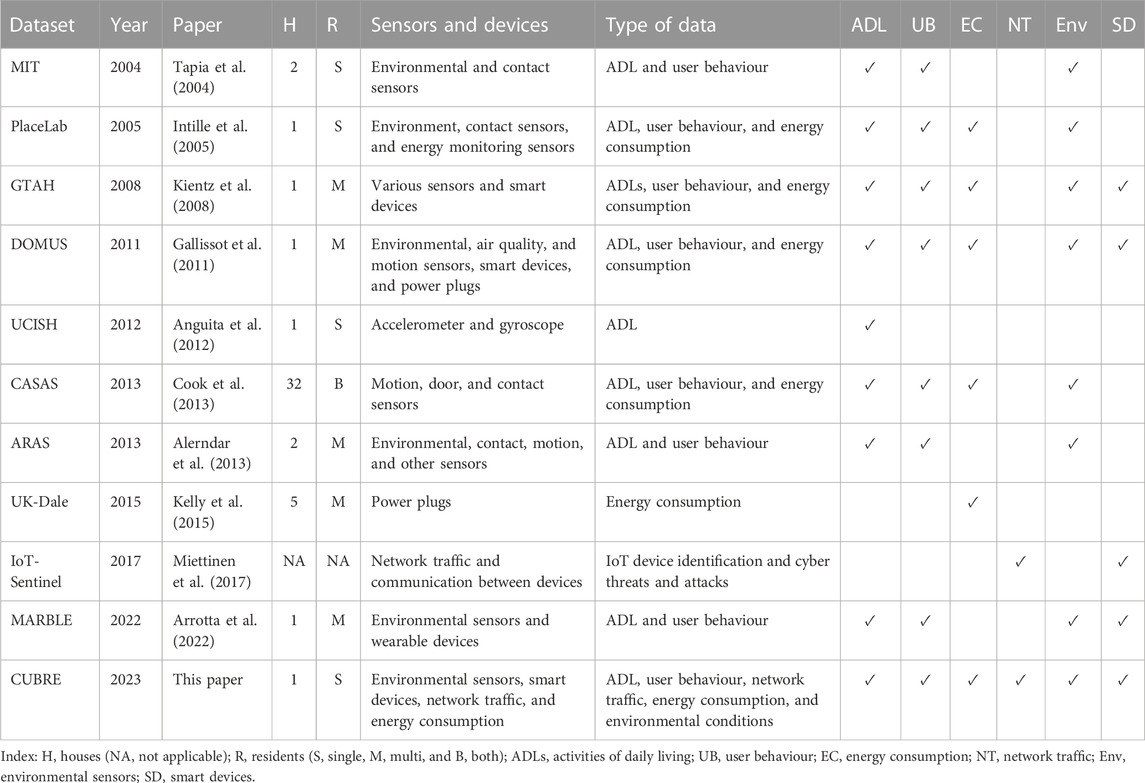
TABLE 1. Comparison of publicly available datasets.
Data collection was based on a house named Zero-Bills, built on the Building Research Establishment (BRE) Innovation Park in Watford. This house was designed for a future-concept zero-carbon emission plan. It has timber and steel construction and is highly insulated, with a solar loft and an overheating mitigating mechanism. The house has three floors; we used the ground and first floors for a few activities for this dataset collection project. The second floor has some sensors installed by BRE; data from these sensors are available in the dataset. The house’s dimensions were approximately 9400 mm × 8200 mm (depth × width). Visuals of both the front (in red boundary) and rear of the house are shown in Figures 1i, ii, respectively.
The entrance door is almost in the middle of the house facing the stairs to the first floor. The left section of the house on this floor was used as storage/garage. Most of the activities took place on this floor. It had a kitchen, dining area, and lobby as usable areas (Figure 1iv). The garage area is accessible from outside using a different door; it was used as storage.
Unlike the ground floor (GF), the first floor (FF) of the house was fully utilised. It consisted of a bedroom, toilet, study room, and a kids’ room (Figure 1iii). But the activities performed on this floor were comparatively lesser than GF.
Like the ground floor, the second floor (SF) was not fully used. There was a solar loft at the rear of this floor. However, some sensors were installed on this floor, as reflected in the datasets. No activity occurred on the second floor.
This section discusses physical elements such as components, connectivity, and arrangement. We had a heterogeneous physical setup that generated data through various states and formats. A holistic view of our physical architecture is presented in Figure 2i. We discuss our physical architecture in a structured format to ensure it is clearly understood, as it was the key component of the data collection setup. The physical architecture consisted of four components:
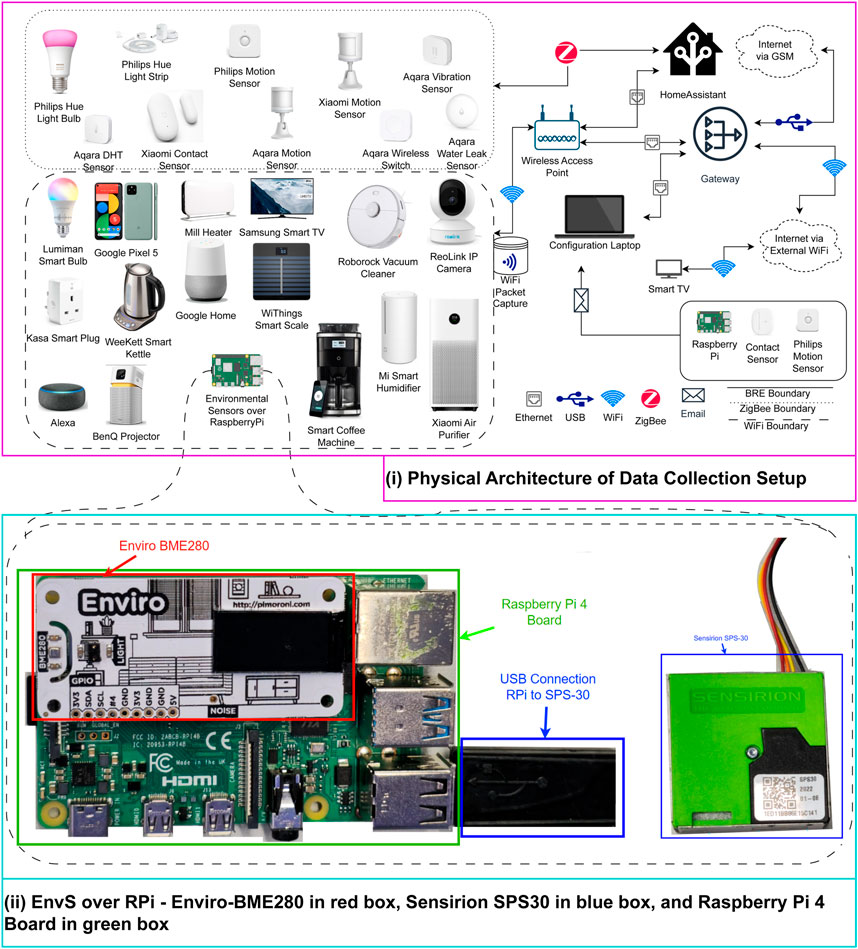
FIGURE 2. Physical architecture and EnvS over RPi for the data collection setup.
These are mission-critical devices that are mandatory for data collection operations; failure of any of these could result in major faults in the whole operation. There were three core devices in the architecture:
• Gateway (GW), as discussed previously, is the most important device in this physical architecture. It was responsible for tasks like data storage, data ingestion, network packet capture, and services such as the dynamic host configuration protocol (DHCP), hyper-text transfer protocol (HTTP), and internet sharing using the network address translation (NAT) protocol, an RPi-based industrial IoT gateway; OnLogic FR201 hardware was used for this purpose.
• HomeAssistant (HA) is based on the HomeAssistant Operating System (HAOS) installed on an 8 GB RAM variant of a RPi4 device with a 256 GB solid-state drive (SSD) storage. One other option was to use a docker container on GW to install HA; this could have added extra load on the GW hardware, which may have resulted in low performance.
• Wireless access point (WAP): Our initial plan was to assign this task to GW but there was a limitation to how many devices could be controlled using a built-in wireless card on RPi. Since the number of devices was excessive, we introduced TP-Link TL-WR940N in the network to be used to create a wireless network as a bridge to GW (no DHCP was configured on this device).
These were the devices in the middle, connected physically or over the network with end-point devices. We had two types of intermediary devices: Raspberry Pi (RPi) v4 was used to extract data from environmental sensors and transfer to GW, and a Philips Smart Hub, connected to HA via Ethernet to create separate ZB networks for some end-point devices (EPDs).
These are the sensors or actuators that were the actual sources of data. There were three types of EPDs in the dataset:
• Smart devices directly connected to HA over ZB.
• Smart sensors connected to HA through smart hubs (internal or external WiFi).
• Environmental sensors (EnvS) attached to RPi over internal WiFi.
There were six different Layer-1 physical networks in the architecture:
i. Ethernet core: This network physically connected GW, HA, WAP, and Smart Hubs using Ethernet cables. The network ID of this network was 10.11.12.0, and the broadcast ID was 10.11.12.255.
ii. Ethernet management: This interface was used to transfer captured packets to the configuration laptop. This network was created to ignore the transfer over the core network which may have doubled the data storage for packet captures.
iii. Internal WiFi: The internal WiFi was created using WAP with Wi-Fi Protected Access Pre-Shared Key version 2 (WPA2-PSK). The SSID of the network was shtb.
iv. External WiFi: Any external WiFi network can be considered for this physical network, such as a hot-spot sharing network using a mobile phone or the open-to-public network BRE-Visitors.
v. GSM Network: A data SIM was used as a backup in case of the unavailability of external WiFi networks. A D-Link DWM-222, LTE (4G) USB modem was used for GSM connection. This switch-over was manually performed.
vi. ZB LAN: A USB-based ZB dongle connected to HA was used for this network.
The busiest device in the whole architecture was the GW, which performed a number of critical operations like ingestion and transformation, forwarding, or storage of data in final format.
This section discusses the logical architecture of our data collection setup. As seen in Figure 3, our architecture was based on six horizontally separated sections. The most critical section in the logical architecture was core interfaces, which interacted with almost all parts of the data. The two core components HA and GW hosted most of the core interfaces with the exception of one data receiving point—a weekly comma-separated value (CSV) file from BRE which held data from BRE-owned sensors and smart devices.
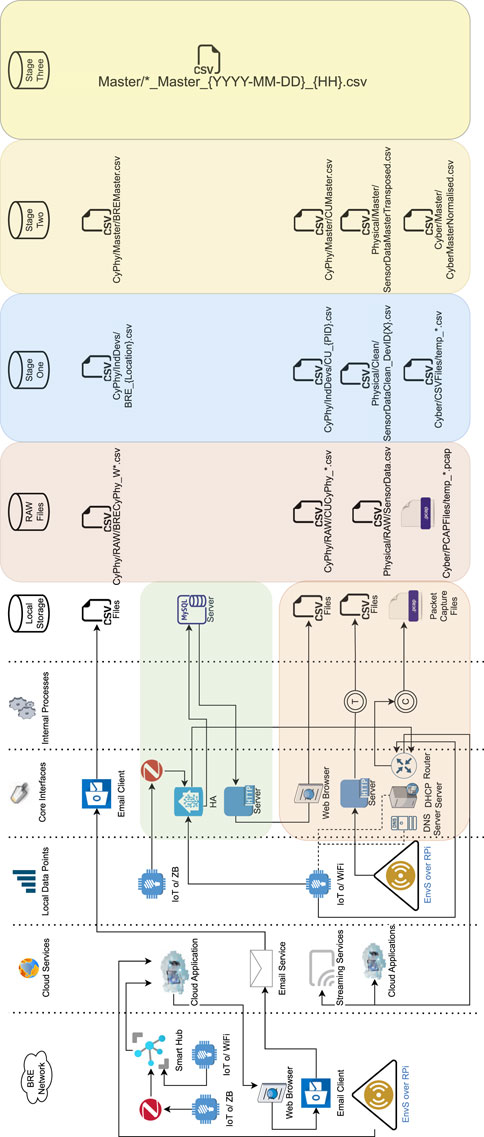
FIGURE 3. Logical architecture of the data collection setup: orange background area represents Gateway and green background area shows HA.
The HA worked on both IP and ZB protocols to gather data from smart devices (connected directly using ZB, Internal WiFi, or Internet) and perform automation steps, such as controlling temperature via a smart radiator after using temperature sensors. It then stored the data in a MariaDB database as states for each entry. The MariaDB server database was accessed using the phpMyAdmin package using a web browser on GW to download a CSV file containing the log of all entities connected to HA. The GW hosted an HTTP server that received data from EnvS via RPi, adding some information as reflected in “a T process in a dual circle” in the processes section, and stored the sensor log in a CSV file. GW also enabled NAT service, DHCP, and domain name service (DNS) to allow local IoT devices to obtain dynamic IP addresses and perform DNS queries. All traffic passing through the NAT service was captured using the Tshark package, reflected by “a C process in a dual circle” in the processes section, and stored in pcap format; a new pcap file was created every hour to prevent load on the RAM of the GW hardware. The routing interface also allowed some IoT devices connected via internal WiFi to access internet-based cloud services. An email client ran on the configuration laptop and saved the CSV formatted BRE data dump received weekly to local storage.
A few cloud services were utilised relatively less frequently, as most of the data were stored in local storage. Cloud Services were used to access cloud applications by some IoT devices, audio/video streaming services (Smart TV and Alexa), or email services to receive external data via email.
The main data generating (source) was the IoT devices connected either through ZB via a ZB wireless network or IP—both IoT and EnvS—connected through internal WiFi. IoT devices sent data directly to HA or via Cloud Services, whereas EnvS directly ingested data to GW’s HTTP service. The BRE Network section was only known through sensor emails and device logs in CSV format. The local storage section has three different types of data formats: i) CSV files, ii) pcap files, and iii) the MariaDB database (eventually converted into CSV). Internal processes as discussed previously are “T” for transforming the data coming from EnvS and “C” for capturing the data flowing through routing services running on GW.
We developed the sensor nodes using three hardware components: i) Enviro BME280 Environmental Sensor, ii) Sensirion SPS30, and iii) RPi4. Figure 2ii displays all three components integrated together. BME280 contains temperature, humidity, noise, pressure, illumination, and proximity; it was installed as a HAT on top of RPi. SPS30 is an air quality (AQ) sensor connected to RPi via a USB port; it provides various types of AQ measurements. The frequency of EnvS data was 1 second; details of the data specifications are discussed in Section 4.1.1.
This section discusses the smart devices we used in the data collection setup. Table 2 lists the devices’ communication, location, data, and frequency information, followed by individual device specifications. Product identification (PID) numbers can be used to extract data for a particular device from the dataset for only one item—Samsung Smart TV has a PID or −1. Details on individual device specifications and entities can be found in Supplementary Content S7. Section 1 contains the specifications of each device in its sub-sections, and a table of entities of each device can be found in Section 3. Sub-section numbers in Supplementary Content Document (SCD) 7 are synchronised with this document—for example, Section 3.5.9 contains brief specification details on Kasa Smart Plug, and Section 2.9 provides specifications of the same smart device, and Xiaomi Motion Detector details are in Sections 3.5.2 and 2.2.
• binary_sensor.smartthings_contact_sensor_pid_{X}_moving
• binary_sensor.smartthings_contact_sensor_pid_{X}_tamper
• binary_sensor.smartthings_contact_sensor_pid_{X}_battery_low
• binary_sensor.smartthings_contact_sensor_pid_{X}_contact
• sensor.smartthings_contact_sensor_pid_{X}_z_axis
• sensor.smartthings_contact_sensor_pid_{X}_y_axis
• sensor.smartthings_contact_sensor_pid_{X}_x_axis
• sensor.smartthings_contact_sensor_pid_{X}_battery
• sensor.smartthings_contact_sensor_pid_{X}_temperature
• binary_sensor.contact_sensor_pid_{X}_moving
• binary_sensor.contact_sensor_pid_{X}_tamper
• binary_sensor.contact_sensor_pid_{X}_battery_low
• binary_sensor.contact_sensor_pid_{X}_contact
• sensor.contact_sensor_pid_{X}_z_axis
• sensor.contact_sensor_pid_{X}_y_axis
• sensor.contact_sensor_pid_{X}_x_axis
• sensor.contact_sensor_pid_{X}_battery
• sensor.contact_sensor_pid_{X}_temperature
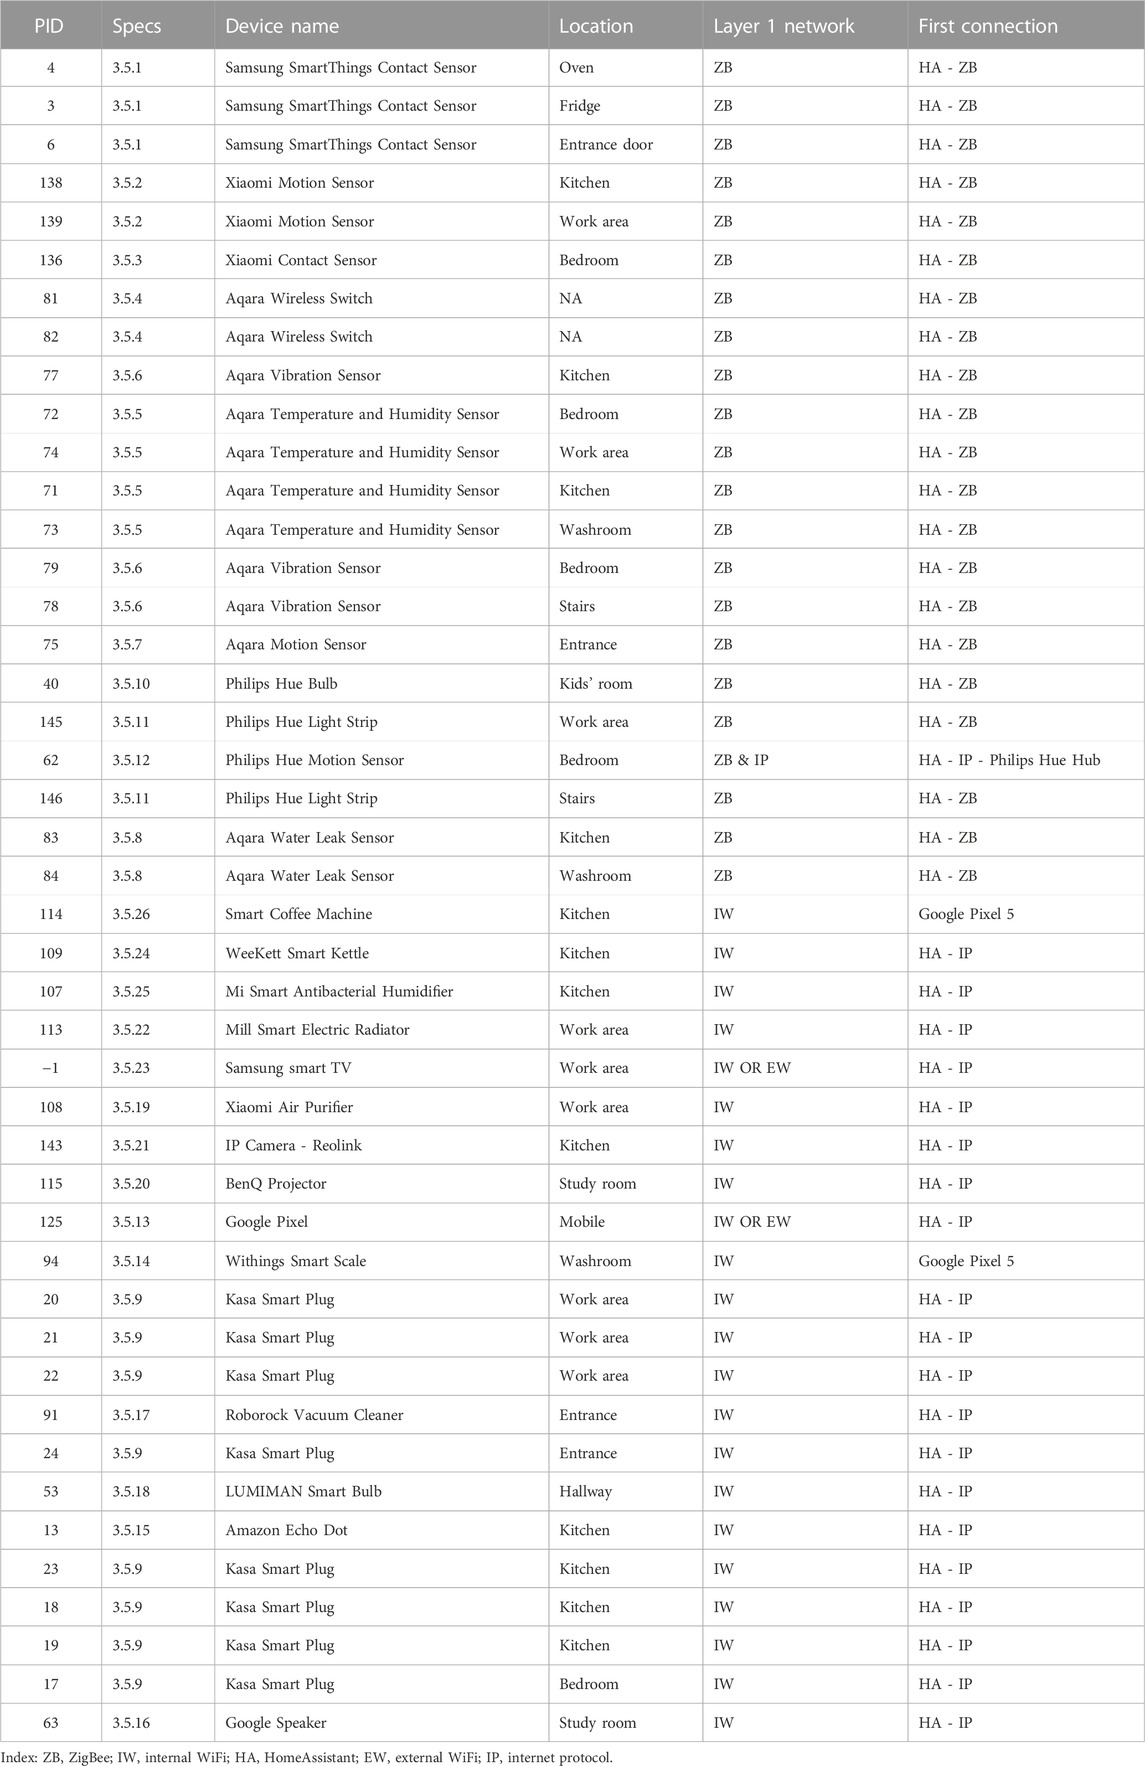
TABLE 2. Smart devices used in data collection.
In-depth details of individual devices are presented in sub-sections. Each individual device has a unique internal PID; in the case of multiple items for the same device, the {X} can be replaced with a three-digit (zero-filled) PID from Table 2 to obtain the entity_id for a particular device. For example, there were three Samsung SmartThings contact sensors used in the dataset, each having a different PID: 3, 4, and 6. The resulting entity ID for binary_sensor.smartthings_contact_sensor_pid_{X}_moving from PID 3 will become binary_sensor.smartthings_contact_sensor_pid_003_moving.
Samsung SmartThings Contact Sensor, also known as Samsung SmartThings Multipurpose sensor, is a battery-powered device connected via ZB. It provides open/close event data, environmental readings to the SmartThings hub, and can integrate with third-party ecosystems. We installed three of these sensors on the oven, fridge, and main entrance doors. Supplementary Table S2 in SCD 7 shows the entity_ids and format of the data provided by Samsung SmartThings Contact Sensor, and Section 2.1 provides its detailed specifications. An image of the Samsung SmartThings Contact Sensor is provided with Supplementary Content S7 as Supplementary Figure S1.
The Xiaomi Motion Detector detects body heat and movement in a close area up to 7 m in range using an infrared sensor; it communicates with HA via a USB ZB Dongle. It is a battery-powered sensor and can be easily installed on any type of door or window. It can also be connected to other smart home ecosystems. Other than the primary sensor—motion—it provides battery information and power outage count. Detailed specifications are available in Section 2.2 of SCD 7, and Supplementary Table S7 show the details of data and frequency of each entity_ids. For both Xiaomi Motion Detectors, PIDs are not configured in the entity_id. An image of the Xiaomi Motion Detector is provided in Supplementary Content S7 as Supplementary Figure S2.
The Xiaomi Contact Sensor is a battery-powered, ZB-based device primarily used with the manufacturer’s hub, but it can also be used with other third-party smart home ecosystems. Only one device of this model was installed, in the bedroom on the first floor. Supplementary Table S8 provides a list of entities in the Smart Devices’ dataset, and detailed specifications can be found in Section 2.3 of SCD 7. An image of the Xiaomi Contact Sensor is provided in Supplementary Content S7 as Supplementary Figure S3.
The Aqara Wireless Switch comes with a push button, is battery-powered, and can communicate with the HA via ZB without any physical installation. Various operations can be triggered upon button-press events using any supported smart home hub. It also provides device temperature. We had two of these buttons, both of which were added in HA but not used during the data collection process. Its technical specifications are listed in Section 2.4 of SCD 7, and all data entities provided by this switch are presented in Supplementary Table S9. An image of the Aqara Wireless Switch is provided in Supplementary Content S7 as Supplementary Figure S4.
The Aqara Temperature and Humidity Sensor (AqaraDHT) is a compact, battery-powered device with a high-precision sensor for temperature and humidity measurements which can communicate with any support hub via ZB. We installed four of these sensors in GF: kitchen and work area; FF: bedroom and washroom. Details of data provided by this sensor are available in Supplementary Table S1 with technical specifications in Section 2.5 of SCD 7. An image of the AqaraDHT is provided in Supplementary Content S7 as Supplementary Figure S5.
The Aqara Vibration sensor is also based on the ZB protocol with a built-in battery. It is compatible with Aqara Hub as well as other ecosystems. We installed three of these vibration sensors in Kitchen, Stairs, and Bedroom. It primarily sends vibration events but also provides device temperature and 3-axis. Its detailed specification can be found in Section 2.6 with a complete list of entities from Supplementary Table S7 of SCD 7. An image of the Aqara Vibration Sensor is provided in Supplementary Content S7 as Supplementary Figure S6.
The Aqara Motion Sensor, like other Aqara devices, is battery-operated and can be connected to Aqara Hub or other smart home ecosystems via ZB. There was only one of these motion sensors installed, at the main entrance door. Other than occupancy events, it also provides illuminance and device temperature information. A detailed specification is provided in Section 2.7 and all entity_ids are listed in Supplementary Table S10 of SCD 7. An image of the Aqara Motion Sensor is provided in Supplementary Content S7 as Supplementary Figure S7.
As with this manufacturer’s other items, the Aqara Water Leak Sensor provides connectivity over ZB and has a built-in battery. As well as water leakage information, it provides device temperature information along with other entities. We installed two of these sensors in kitchen and washroom. Detailed specifications are shown in Section 2.8, and all entities are listed in Supplementary Table S13 in SCD 7. An image of the Aqara Water Leak Sensor is provided in Supplementary Content S7 as Supplementary Figure S8.
The Kasa Mini Smart Plug is a WiFi-based device and can be connected with Kasa Smart App as well as various smart home ecosystems. It provides current and voltage information as well as other key properties. All details are available in Supplementary Table S4, with detailed specifications in Section 2.9 of SCD 7. We installed eight of these smart plugs with various devices at entrance, kitchen, work area, and bedroom. An image of the Kasa Mini Smart Plug by TP-Link is provided in Supplementary Content S7 as Supplementary Figure S9.
The Philips Hue Light Bulb is a ZB device that connects to HA through the Philips Hue Hub or a ZB repeater. Its electrical connection is B22 standard. It is a multi-colour smart bulb that provides bulb status to the smart hub. Detailed specifications of this light bulb are listed in Section 2.10, and dataset entities are provided in Supplementary Table S3 in SCD 7. Only one of these bulbs was installed: in the kids’ room on the first floor. An image of the Philips Hue Light Bulb is provided in Supplementary Content S7 as Supplementary Figure S10.
The Philips Hue Light Strip is a rope light with smart features and various colours. It can also integrate with HA and other ecosystems over ZB via the Philips Hue Smart Hub or a repeater. We installed two of these lights on the stairs and work area. Supplementary Table S11 lists all data entities related to this light strip with detailed specifications in Section 2.11 of SCD 7. An image of the Philips Hue Light Strip is provided in Supplementary Content S7 as Supplementary Figure S11.
Philips Hue Motion Sensor is also a ZB device with a built-in battery. It is easy to install and integrates sensors. In addition to motion events, it provides temperature and illumination readings. All entities with their details are shown in Supplementary Table S12, and detailed specifications can be found in Section 2.12 of SCD 7. Only one motion sensor by Philips was installed in the work area. An image of Philips Hue Motion Sensor is provided with Supplementary Content S7 as Supplementary Figure S12.
Google Pixel 5 comes with 8 GB RAM and 128 GB storage with an Octa-core 2400 MHz processor; detailed specification can be found in Section 2.13. It provides many data points, like other Android phones to HA, Supplementary Table S5 in SCD 7 lists all entities provided by Google Pixel 5 in the dataset. We had only one mobile phone, used to access various applications, and it was mostly kept with the actors. An image of Google Pixel 5 is provided in Supplementary Content S7 as Supplementary Figure S13.
Withings Smart Scale provides body weight along with additional features like body composition. All features of this device are given in Section 2.14 of SCD 7. This device does not connect to HA but rather provides a connection with its own Withings Health Mate mobile application (which was installed in Google Pixel 5); hence, data were not available in HA. An image of the Withings Smart Scale is provided in Supplementary Content S7 as Supplementary Figure S14.
Amazon Alexa is a well-known voice assistant, connected to HA using WiFi. It provides media information and alarm-related details to HA; all entities are listed in Supplementary Table S14, and its specification can be found in Section 15 of SCD 7. We frequently used Alexa Dot for daily activities; it was placed in the work area. An image of the Alexa Dot 3rd Generation is provided in Supplementary Content S7 as Supplementary Figure S15.
Google Home or Google Speaker is another well-known voice assistant native to the Google ecosystem. It can also be integrated with HA via WiFi. Detailed specifications of Google Home are listed in Section 2.16 of SCD 7. There was only one Google Home, placed on first floor, but there are no data available in HA. An image of Google Home is provided in Supplementary Content S7 as Supplementary Figure S16.
A Roborock Vacuum Cleaner was connected to HA via WiFi and provided status and stats to HA. There were very few activities performed with this device. The specification can be found in Section 17, and a list of entities in Supplementary Table S15 of SCD 7. We had one robot cleaner, placed in the entrance area near the door. An image of the Roborock Vacuum Cleaner S5 Max is provided in Supplementary Content S7 as Supplementary Figure S17.
The LUMIMAN Smart Bulb is multi-colour bulb connected via WiFi with HA; it only provided status. It had an E27 electrical connection; detailed specifications are provided in Section 2.18 and Supplementary Table S16 of SCD 7. We had one of these smart bulbs which was installed in the hallway of the first floor. An image of the LUMIMAN Smart Bulb is provided in Supplementary Content S7 as Supplementary Figure S18.
A Xiaomi Air Purifier 4 Pro was connected to HA via WiFi; it purifies air as well as providing environmental information like air quality, temperature, and humidity. A detailed specification of this air purifier is available in Section 2.19, and a list of dataset entities is available in Supplementary Table S17 in SCD 7. It was installed in work area. An image of the Xiaomi Air Purifier 4 Pro is provided in Supplementary Content S7 as Supplementary Figure S19.
BenQ GV1 is a smart projector with multiple input options. It has a built-in battery and a USB-C connection for laptop/mobile display connectivity; detailed specifications are available in Section 2.20 of SCD 7. There were no data entities for this device. The smart projector was installed in study room. An image of the BenQ GV1 Projector is provided in Supplementary Content S7 as Supplementary Figure S20.
A Reolink E1 Pro was used to capture video of activities being performed by actors; it was not installed in HA. It was connected to the internet to upload recordings to the Reolink Cloud. As it was not installed in HA, only cyber activity is available in the Cyber dataset. Specifications of the Reolink E1 Pro Camera are provided in Section 2.21 of SCD 7. An image of the Reolink E1 Pro is provided in Supplementary Content S7 as Supplementary Figure S21.
A Mill WiFi Portable Heater was connected to HA via WiFi. Apart from managing room temperature, it also provided environmental information and daily and annual electricity usage analysis. The heater was installed in work area. Detailed specifications of this heater are available in Section 2.22 and all entities are listed in Supplementary Table S18 of SCD 7. An image of the Mill WiFi Portable Heater 1200W is provided in Supplementary Content S7 as Supplementary Figure S22.
A Samsung Smart TV was first connected to HA via Internal WiFi but was later switched to external WiFi due to network issues. This TV was mostly used to watch news, for creating activities, that increases noise and network footprint. It was owned by BRE and was installed in work area. Specifications of this TV are provided in Section 2.23, and detailed entities are listed in Supplementary Table S19 of SCD 7. An image of the Samsung Smart TV is provided in Supplementary Content S7 as Supplementary Figure S23.
Although the WeeKett Smart Kettle is a WiFi device, it does not integrate with HA, so we connected it with Google Pixel 5 to obtain data. One of the smart features of this device is to keep water heated to a specific temperature. It was installed in the kitchen and was mostly used to make tea. A list of all important specifications is provided in Section 2.24 and entity_ids in Supplementary Table S20 of SCD 7. An image of the WeeKett Smart WiFi Kettle is provided in SSupplementary Content S7 as Supplementary Figure S24.
The Mi Smart Antibacterial Humidifier maintains humidity levels as configured to keep the environment pleasant. It was installed in the kitchen area; its effects can be seen in the physical dataset to compare data provided by this humidifier; details of entities are provided in Supplementary Table S21, and specifications are provided in Section 2.25 of SCD 7. An image of the Mi Smart Antibacterial Humidifier is provided in Supplementary Content S7 as Supplementary Figure S25.
A Smart Coffee machine was frequently used for multiple types of activities. Two of these coffee machines were used in the data collection project: the first one had hardware issues, so it was replaced by a new one. Detailed specifications of the coffee machine are available in Section 2.26 of SCD 7. The coffee machine was installed in the kitchen. No data are available in HA; perhaps the cyber dataset contains network packets to/from it. An image of the Smart Coffee 2nd Generation is provided in Supplementary Content S7 as Supplementary Figure S26.
The dataset consists of four physical, cyber, and cyber–physical sub-datasets, captured simultaneously by inter-connected devices at the same location, but each dataset contains different data types and formats. We captured the following types of subsets for this dataset:
• Physical (In situ sensors): Environmental reading of temperature, humidity, light, noise, and air quality.
• Cyber (network router): All internal network traffic passes via NAT router (Gateway).
• Smart devices (home assistant): Smart devices connected to the home assistant directly or via intermediate devices or the internet.
• Video recordings (while performing activities): An IP camera was installed in the kitchen area to record video of activities being performed by actors.
This section briefly discusses each individual dataset. Section 4 of SCD 7 contains in-depth technical details on each.
The physical dataset was captured using two different environment-sensor kits: i) Enviro BME280 (environment sensors, e.g., temperature and humidity) and ii) Sensirion (air quality). Both add-on devices were physically installed on an RPi using HAT and USB interfaces, respectively. The Enviro kit was installed from the start on all RPis, while only one RPi (RPi-3) had Sensirion. Refer to Section 4.1 of for technical details about the Physical dataset, including a list of all entities and RPis. After 2 November 2022, all five RPis were equipped with both kits. We developed two services that ran on RPi Client (RPi-C) at startup to collect and transfer data to a data storage device via HTTP. We developed a service for a data storage device that listens to HTTP requests to receive and store the data from all RPis to a single locally formatted CSV file. Supplementary Table S22 of SCD 7 shows the device ID, IP address, MAC address, name, and location of each RPi-C in the house. Following is the header of the CSV file: in the aforementioned list PIR (x), AirQuality (x), Accelero (x), Gyro (x), Pressure (x), and Motion (x) values are static in the dataset. The timestamp is generated at the time of sensor readings; DevID is unique and hard-coded in each RPi-C, and DevIP is generated by data-storage service using the remote_addr function in the Python requests library. The frequency of HTTP requests is 1 second, similar to the Enviro sensors, whereas Sensirion air quality (SRS-30) values were read every 2 seconds. Air quality data were read by another service and stored the current values in a.txt file read by main service. In case of a network-related failure, the data are stored locally on RPi-C with a timestamp and sent to a HTTP service once the service is reachable. This dataset is stored in SensorData.csv in the “Physical” directory; the size of this file is 2.7 gigabytes.
The cyber dataset captured at the router contains network traffic to/from all internal devices connecting to the internet using an “shtb” wireless network. The Gateway plays a key role in this dataset because it provides all services required to connect the internet to internal devices, as well as capturing the network traffic. The services offered by Gateway are DHCP, DNS, and NAT. Refer to Section 4.2 in SCD 7 for technical details of the Cyber dataset, including device hostnames, MAC, and IP addresses. Gateway has two ethernet ports: eth1 and eth0. The first is connected to an internal WAP which bridges the wireless network to eth1. The second port, eth0, is directly connected to the maintenance laptop, and this network is not captured. Because the dataset was transferred to a laptop over a network at the end of every day while the eth1 network was being captured, this would have created another footprint of this transfer that would have significantly increased the storage requirement of the cyber dataset. The idea was to capture the network traffic without adding any exceptions, so an additional maintenance network was introduced. Gateway’s internet protocol (IP) address was 10.11.12.1, Network ID was 10.11.12.0, Broadcast ID was 10.11.12.255, and netmask was 255.255.255.0 of eth1 network. Tshark (TShark, 2023), a network packet capture tool, was used to dump the network captures to a pcap file. These files were created at 1-h frequency, so a new file was created every hour with the start timestamp in the filename. Supplementary Table S23 in SCD 7 provides a list of IP and Mac addresses for all internal devices. The DHCP lease time was configured to be unlimited to save any conflict in device identification using the IP address. The dataset consisted of network packet capture format (.pcap) files stored in the “Cyber” directory. The file name format is temp_{HourID}_{YYYYMMDDhhmmss}.pcap; for example, the file name of the first hour is temp_00001_20221019140448.pcap.
This dataset contains data from smart devices connected to HA. Most of the smart devices were connected to HA, either directly using IP, ZB, an intermediate device, or the internet. This makes HA the most critical component of this dataset. HA was first connected to Gateway via a wireless network and later via ethernet, and, in both scenarios, via WAP. This is why there are two DHCP lease entries for HA in Supplementary Table S23 SCD 7: IP 10.11.12.22 and 10.11.12.54. The devices were manually added in the respective areas in HA. This dataset was exported using the phpMyAdmin add-on in HA; the output format is CSV, which contains the headers described in the following sections.
This dataset is captured by BRE. It includes data from motion, contact, air quality (various), temperature, tamper, humidity, and illumination sensors. Its average frequency is 5 s, but there was a power cut for the central hub due to human error, so the dataset is missing 1 week of data. There is a total of 21 devices in the dataset, and each device contains one or more sensors, Supplementary Table S25 of SCD 7 lists all locations, and the sensor codes can be matched in Supplementary Table S24. The location column has a pre-fix UK-WAT-ZB, which reflects the house Zero-Bills followed by MTS ID (internal network number). The latter part of the location holds, separated by “-”, a type code of a device; for example, OC for contact sensor, floor number (starting from 00), and area information like K1 for kitchen and B1 and B2 for Bedrooms 1 and 2.
Video recordings of the activities were captured using a Reolink IP Camera. It initiates video recording after detecting motion in the field of view, and the recorded video is sent to the cloud service provided by the manufacturer. The video files were later downloaded from the cloud service and stored in the VideoRecordings directory.
All datasets except video recordings were processed. Both RAW and processed datasets are available in the repository. For a comprehensive look at all the dataset locations and properties, please refer to Supplementary Table S26 in SCD 7.
We had control over the physical data format at the time of capture and intake, making it easier to handle, clean, and normalise. However, an error has affected the values of a few sensors in the capture stage. There are seven columns that have single (for each device) static values; for Stage 1, we removed static columns (PIR, AirQuality, Accelero, Gyro, Pressure, and Motion) as well as DevIP and DevID from the RAW dataset. There were three sensors that had errors at the capture stage: i) (Temp) temperature values dipped, while ii) (Lux) illumination and iii) (Humidity) humidity values rose abruptly. This issue started after 2 November 2022 after the installation of AirQuality Sensors (Sensirion SRS-20) in EnvS (1,2,4, and 5). EnvS 3 had this issue from the start because SRS-30 was installed then. This behaviour for all Humidity and Temperature/Lux sensors was for two iterations and one iteration respectively every time. To resolve this data issue, we calculated the average of the previous and next rows to update the dip in temperature and rise in humidity and lux (Figures 4i, iifig4).
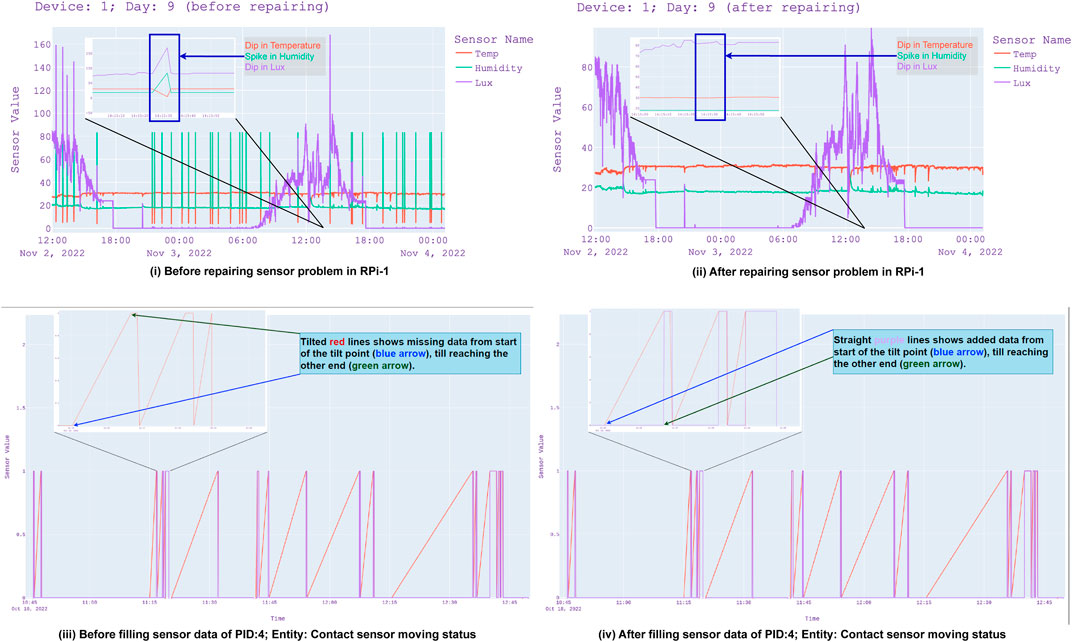
FIGURE 4. Data cleaning and filling (missing data).
We converted the Cyber dataset in a four-step operation: i) convert hourly pcap files to csv using TShark (2023) utility; ii) add start time (taken from each file name) of each file to timestamp column (_ws.col.Time) and convert into timestamp format; iii) join all csv files as one data-frame; and iv) normalise the resulting dataset by mapping protocols and converting strings columns into integers. The output CSV file contains the following columns:
1. frame.number: Frame number of packet.
2. _ws.col.Time: Epoch formatted timestamp.
3. _ws.col.Source: Source IP address.
4. _ws.col.Destination: Destination IP address.
5. _ws.col.Protocol: Protocol.
6. _ws.col.Length: Length of packet (in bytes).
7. _ws.col.Info: Remaining information of the packet (structure depending on the type of protocol).
The last column “_ws.col.Info” contains information based on the previous columns; for example, column structure varies based on protocol. So, in the case of TCP, the Info column structure will be different than for the UDP, ICMP, or ARP protocols.
This dataset was occasionally exported from MariaDB of HA using the phpMyAdmin add-on in CSV format. These CSV files have duplicate entries which were dropped after reading them and creating a single CSV file containing data from the start to end times. After creating a single CSV file, we extracted data for entities and saved a separate file for each PID. Later, a 1-s frequency timestamp was added manually from a specific time frame and then synced with each column in the new timeline. Missing values in the resulting dataset were filled using forward fill and then backward fill operations, and the outcome was saved as the CUMaster dataset. A sample for this inflating process for entity binary_sensor.smartthings_contact_sensor_pid_004_moving of PID 4 is demonstrated in Figure 4iii, iv. The tilt in the red lines (red lines are from the RAW dataset) shows missing values, whereas purple lines (purple lines are from an inflated dataset) show continuous values parallel to the tilted red line.
The original form of this dataset was also based on multiple files (one file per week). At first, we merged all files and converted the location column along with associated sensor columns for transposing into columns for each location-sensor. We then repeated the same operation of inflating this dataset, similar to the CU dataset, with a 1-s frequency to prepare it to be synchronised with all other datasets.
This section discusses the data fusion and integration of multiple datasets. We compiled most information about the single and multi-dimensional datasets in Supplementary Table S26 of SCD 7. We noted the time scales of each stage of all datasets because of the variations during data processing. Dataset locations are mentioned in Type and Stage, where “Type” is a directory located in the root directory and “Stage” is a directory located in each type directory.
This section discusses the anomaly creation setup for our dataset. The first actor performed most of the activities in the house from the beginning until 7 November 2022, and after 11 November 2022 until the end of the dataset timeline. The second actor performed activities on 8–10 November 2022. Neither discussed how they would perform the activities so that the activity signatures should be different. This labelling was to help develop supervised ML algorithms or evaluate unsupervised algorithms on the dataset. Both actors logged start time, end time, and details about the activities they performed; these files are discussed and listed in Supplementary Table S27 of SCD 7.
As discussed previously, both actors logged their activities with the start and end times. We also mapped a list of databases and associated devices which are associated with each activity; Figure 5i demonstrates a holistic view of these mappings. ActivityLabels.json contains these relations in JSON format. Figure 5ii shows a holistic view of the timelines of all datasets and the activities of both actors.
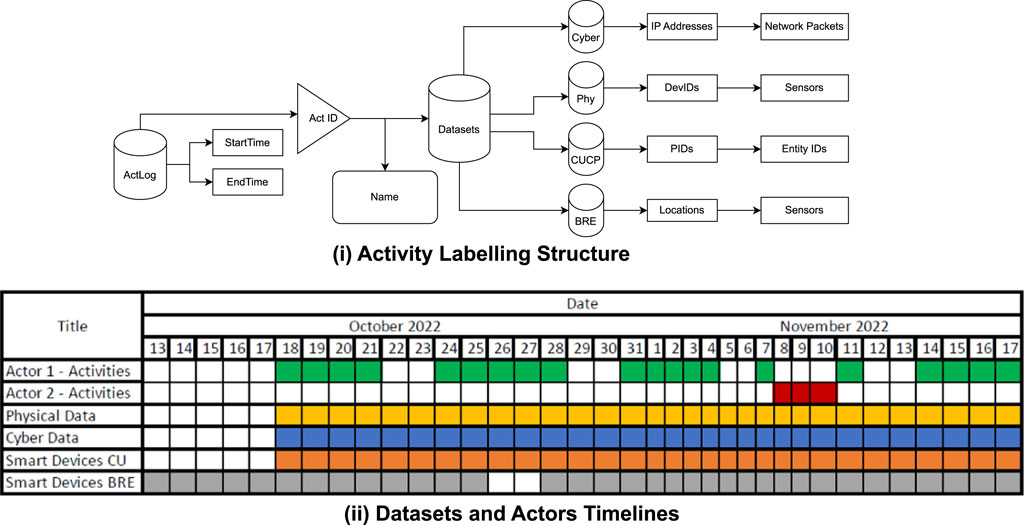
FIGURE 5. Activities label structure and datasets and actors timelines.
Apart from the datasets, there are some important files to be noted; these are listed and explained in Supplementary Table S27 of SCD 7. Each file contains different information and structure. For example, CSV files contain a list of activities performed by both actors as well as headers of the physical dataset, whereas JSON files contain list mapping for normalisation, and information about devices. There is only one XLSX file that contains information about the PID and entities of each device model (in case of multiple devices for one make/model).
This section discusses the quality of each dataset and the limitations faced during data collection. Some issues were faced when collecting the physical dataset: the temperature, humidity, and lux readings fluctuated randomly, which seems like a hardware issue. The issue in the physical dataset was reversed, but the source of the problem could not be determined. The physical dataset is based on 1-s frequency; due to the hardware limitations of sensors, we tried to reduce the timeframe, but this resulted in the script crashing. On the other hand, the SRS-30 reading also had a similar issue, so we set up a 5-s delay between each iteration of the sensor readings. For our cyber dataset, we planned to capture all traffic on the network, whether it communicated device-to-device directly or via Gateway. However, due to limitations in the built-in wireless adapter, which could only handle nine maximum wireless clients simultaneously, we installed an extra WAP in the system. With this trade-off, we were only able to capture traffic from internal devices to other networks via Gateway’s NAT service. In the HA dataset, due to limitations in the system, the data had to be occasionally manually downloaded/exported. There is thus duplication in the resulting dataset, which we resolved by dropping all duplicated entries in the collective dataset from all files. The BRE dataset was not captured for 1 week due to an accident that resulted in turning off the central hub. This incident was not reported until a week after the incident, resulting in 1 week of missing data.
Some of the limitations in the collection process were: i) limited access to the BRE Innovation Park which was only on weekdays 7 am–7 pm and ii) the BRE sensing network being internal and restricted so that it was not possible to create a dataset pipeline to collect/intake all data in single timestamp format from the beginning; instead, it was carried out in post-processing. Thus, it was not possible to collect a dataset for the nycthemeral cycle of activities, such as sleep. Another limitation faced was a non-functional lavatory, a life necessity, which made it inherently impossible to record all activities.
This research presents a novel and real-world dataset from cyber (network traffic), smart devices, and physical sources in a smart home setting. The dataset includes activities of two actors, both of whom performed and recorded their activities at different times. The main actor performed activities for 3 weeks and the secondary actor performed activities for a few days. These settings can be considered the training dataset for Actor 1 and the testing dataset for Actor 2 (considering the latter an anomalous actor). We also inflated the dataset based on the frequency of the network traffic. We created a master dataset holding all features of various sources in a single table, which can facilitate the development of ML models for user behaviour analysis and anomaly detection in a cyber–physical environment.
In future, a similar nycthemeral cycle-based activity dataset (cyber–physical) should be captured and made publicly available so that the research can be conducted on wider range of activities. Similar data could be captured and shared based on a longer period of time—at least a year would be helpful for better understanding and bench-marking. Similar datasets with smart home scenarios could be captured in buildings with data from building management systems (BMS) with its related network traffic to advance research on built environments.
The datasets presented in this study can be found in online repositories. The names of the repository/repositories and accession number(s) can be found at: https://ieee-dataport.org/documents/cyber-physical-anomaly-detection-smart-homes.
YM: data curation, formal analysis, investigation, software, visualisation, writing–original draft, and writing–review and editing. MA: methodology and writing–review and editing. AA: resources and writing–review and editing. CP: conceptualization, funding acquisition, project administration, supervision, and writing–review and editing.
The author(s) declare that financial support was received for the research, authorship, and/or publication of this article. This work was supported by the PETRAS National Centre of Excellence for IoT Systems Cybersecurity, which was funded by the United Kingdom EPSRC under grant number EP/S035362/1.
AA was employed by the Building Research Establishment, BRE Group.
The remaining authors declare that the research was conducted in the absence of any commercial or financial relationships that could be construed as a potential conflict of interest.
Author CP declared that they were an editorial board member of Frontiers at the time of submission. This had no impact on the peer review process and the final decision.
All claims expressed in this article are solely those of the authors and do not necessarily represent those of their affiliated organizations, or those of the publisher, the editors, and the reviewers. Any product that may be evaluated in this article, or claim that may be made by its manufacturer, is not guaranteed or endorsed by the publisher.
The Supplementary Material for this article can be found online at: https://www.frontiersin.org/articles/10.3389/friot.2023.1275080/full#supplementary-material
Alerndar, H., Ertan, H., Incel, O. D., and Ersoy, C. “ARAS human activity datasets in multiple homes with multiple residents,” in Proceedings of the 2013 7th International Conference on Pervasive Computing Technologies for Healthcare and Workshops, Venice, Italy, May 2013, 232–235.
Anguita, D., Ghio, A., Oneto, L., Parra, X., and Reyes-Ortiz, J. L. (2012). Human activity recognition on smartphones using a multiclass hardware-friendly support vector machine. Int. Workshop Ambient Assisted Living Home Care, 216–223. doi:10.1007/978-3-642-35395-6_30
Arrotta, L., Bettini, C., and Gabriele, C. (2022). “The MARBLE dataset: multi-inhabitant activities of daily living combining wearable and environmental sensors data,” in Lecture notes of the institute for computer Sciences, social informatics and telecommunications engineering (Berlin, Germany: Springer), 451–468.
Cook, D. J., Crandall, A. S., Thomas, B. L., and Krishnan, N. C. (2013). Casas: a smart home in a box. IEEE Comput. 46, 62–69. doi:10.1109/MC.2012.328
Gallissot, M., Caelen, J., Bonnefond, N., Meillon, B., and Pons, S. (2011). Using the multicom domus dataset. RR-LIG-020. Lyon, France: HAL Open Science.
HomeAssistant, (2023). Home assistant. https://www.home-assistant.io/.
Intille, S. S., Larson, K., Beaudin, J. S., Nawyn, J., Tapia, E. M., and Kaushik, P. (2005). A living laboratory for the design and evaluation of ubiquitous computing technologies. CHI Ext. Abstr., 1941–1944. doi:10.1145/1056808.1057062
Kelly, J. L., Kelly, J., and Knottenbelt, W. J. (2015). The UK-DALE dataset, domestic appliance-level electricity demand and whole-house demand from five UK homes. Sci. Data 2, 150007. doi:10.1038/sdata.2015.7
Kientz, J. A., Patel, S. N., Jones, B., Price, E., Mynatt, E. D., and Abowd, G. D. (2008). The Georgia Tech aware home. CHI Ext. Abstr., 3675–3680. doi:10.1145/1358628.1358911
Miettinen, M., Marchal, S., Hafeez, I., Frassetto, T., Asokan, N., Sadeghi, A.-R., et al. “IoT sentinel demo: automated device-type identification for security enforcement in IoT,” Proceedings of the IEEE Int. Conf. Distributed Comput. Syst. Atlanta, GA, USA, June 2017, 2177–2184. doi:10.1109/ICDCS.2017.283
Tapia, E. M., Intille, S. S., and Larson, K. “Activity recognition in the home setting using simple and ubiquitous sensors,” in Proceedings of the Second International Conference, PERVASIVE 2004, Vienna, Austria, April 2004.
Tshark, (2023). TShark. https://www.wireshark.org/docs/man-pages/tshark.html.
Keywords: dataset, smart building, anomaly detection, Internet of Things, cyber–physical, human activities
Citation: Majib Y, Alosaimi M, Asaturyan A and Perera C (2023) Dataset for cyber–physical anomaly detection in smart homes. Front. Internet. Things 2:1275080. doi: 10.3389/friot.2023.1275080
Received: 09 August 2023; Accepted: 20 September 2023;
Published: 17 October 2023.
Edited by:
Oktay Cetinkaya, University of Oxford, United KingdomReviewed by:
Francesco Cauteruccio, Marche Polytechnic University, ItalyCopyright © 2023 Majib, Alosaimi, Asaturyan and Perera. This is an open-access article distributed under the terms of the Creative Commons Attribution License (CC BY). The use, distribution or reproduction in other forums is permitted, provided the original author(s) and the copyright owner(s) are credited and that the original publication in this journal is cited, in accordance with accepted academic practice. No use, distribution or reproduction is permitted which does not comply with these terms.
*Correspondence: Yasar Majib, bWFqaWJ5QGNhcmRpZmYuYWMudWs=
Disclaimer: All claims expressed in this article are solely those of the authors and do not necessarily represent those of their affiliated organizations, or those of the publisher, the editors and the reviewers. Any product that may be evaluated in this article or claim that may be made by its manufacturer is not guaranteed or endorsed by the publisher.
Research integrity at Frontiers
Learn more about the work of our research integrity team to safeguard the quality of each article we publish.