
95% of researchers rate our articles as excellent or good
Learn more about the work of our research integrity team to safeguard the quality of each article we publish.
Find out more
ORIGINAL RESEARCH article
Front. Internet Things , 11 December 2023
Sec. IoT Enabling Technologies
Volume 2 - 2023 | https://doi.org/10.3389/friot.2023.1255995
This article is part of the Research Topic Real-World Deployment of Internet of Things (IoT) Applications, Experiences, and Challenges View all 5 articles
 Olakunle Elijah1,2*
 Sye Loong Keoh3*
 Sharul Kamal bin Abdul Rahim1Chee Kiat Seow3
 Qi Cao3Mohammad Adib bin Sarijari4Noor Farizah Ibrahim5
 Achmad Basuki6
In today’s fast-paced world, efficient and reliable public transportation systems are crucial for optimising time and reducing carbon dioxide emissions. However, developing countries face numerous challenges in their public transportation networks, including infrequent services, delays, inaccurate and unreliable arrival times, long waiting time, and limited real-time information available to the users. GPS-based systems have been widely used for fleet management, but they can be a significant infrastructure investment for smaller operators in developing countries. The accuracy of the GPS location can be easily affected by the weather condition and GPS signals are susceptible to spoofing attacks. When the GPS device is faulty, the entire location traces will be unavailable. This paper proposes the use of Internet-of-Things (IoT)-enabled Bluetooth Low Energy (BLE) systems as an alternative approach to fleet tracking for public bus service. The proposed approach offers simplicity and easy implementation for bus operators by deploying BLE proximity beacons on buses to track their journeys, with detection devices using Raspberry Pi (RPi) Zero strategically placed at terminals and selected stops. When the bus approaches and stops at the bus stops, the BLE advertisements emitted by the proximity beacons can be reliably detected by the RPi Zero. Experiment results show that the BLE signals can be detected up to 20 m in range when the RPi Zero is placed inside a metal enclosure. The location of the bus is then sent to the cloud to estimate the arrival times. A field trial of the proposed IoT-based BLE proximity sensing system involving two public bus services in southern Malaysian cities, namely, Johor Bahru, Iskandar Puteri and Kulai is presented. Based on the data collected, a bus arrival time estimation algorithm is designed. Our analysis shows that there was a 5–10 min reduction in journey time on public holidays as compared to a normal day. Overall, the paper emphasises the importance of addressing public transportation challenges. It also describes the challenges, experience, and mitigation drawn from the deployment of this real-world use case, demonstrating the feasibility and reliability of IoT-based proximity sensing as an alternative approach to tracking public bus services.
The efficient use of a public transportation system plays a significant role in urban mobility. Some of the requirements for Intelligent Transportation Systems (ITS) for urban mobility include Automatic Vehicle Location (AVL), Estimated Time of Arrival (ETA), Automatic Fare Collection (AFC), Automatic Passenger Counters (APC), and fleet sensor onboard maintenance (Qureshi and Abdullah, 2013; Boukerche and Wang, 2020). The AVL provides real-time geographic locations to track fleets of vehicles while the ETA provides real-time updates on the progress of transportation services. The deployment of ITS for land transports involves real-time tracking of bus fleets, displaying ETA on panels at bus stations or through mobile apps, interactive apps for commuters to find buses and the quickest routes, and cashless payment options. Implementing such an efficient public transport system brings numerous benefits, including reduced reliance on private vehicles, thus leading to lower carbon emissions, fewer accidents and decreased road congestion and parking demand. Moreover, it contributes to improved economic growth by enabling commuters to plan their journeys more efficiently, reducing delays at bus stations and on congested roads. In recent years, the transportation industry has witnessed a revolution through various technological approaches, including GPS-based systems (Alam et al., 2021; Taparia and Brady, 2021), and non-GPS-based systems.
In the GPS-based approach, a GPS tracking device is installed on the bus to transmit its geographical coordinates and speeds to a cloud server via cellular or satellite communication. The received data is then analysed and displayed in real-time through a user interface for passengers and transit authorities. Some of these approaches rely on crowd-sourced GPS data (Lim et al., 2016; Lohokare et al., 2017) from passengers. This approach offers a high level of accuracy, simplicity, and affordability in terms of installation cost. However, it also requires maintenance expenses and lacks support for multiple data types.
Conversely, the non-GPS-based approach utilises alternative technologies to determine the location of the bus fleet. These technologies include Radio-Frequency Identification (RFID) (Prinsloo and Malekian, 2016; Vinod and Mohan, 2018), Bluetooth Low Energy (BLE) (Gunady and Keoh, 2019; Park and Choi, 2021), cellular information (Song, 1994), IEEE 802.11p which is also referred to as the Wireless Access in Vehicular Environments (WAVE) (Gan et al., 2023). Most of these approaches are facilitated by the adoption of the Internet of Things (IoT). The IoT is a network of physical objects that are embedded with sensors, software, and other technologies for the purpose of collecting and exchanging data with other devices and systems over the Internet (Elijah et al., 2018). IoT has the potential to improve efficiency, safety, and sustainability in urban transportation. These include the use of IoT devices to track the movement of vehicles and passengers, monitor traffic conditions, and identify potential hazards. Some of the benefits include the optimisation of traffic flow, reduction of congestion and improvement of transportation services, smart parking, automated fare collection, and automated passenger counters with less human intervention. This can be achieved by the use of various sensors deployed to collect information such as the bus’s location, speed, direction, fuel level, and additional relevant data like passenger counting, automatic fare collection, weather conditions, and road conditions. The collected information is then transmitted to a central cloud server using communication technologies such as cellular networks, low power wide area networks (Sigfox, LoRaWan, NB-IoT), or Wi-Fi. These IoT-enabled approaches offer scalability as they can handle multiple types of data compared to the GPS-based approach. Some of these technologies have already been adopted in advanced countries such as the United Kingdom, Germany, the United States of America, and Singapore.
In many developing countries, e.g., Malaysia, public bus services often suffer from a lack of real-time information, infrequent bus schedules, unpredictable travel times, and safety concerns, though there are some efforts to improve the Level of Service (LoS) through increased service frequency, wider coverage for rural areas, improved waiting facilities, etc (Bachok et al., 2015). In response to these challenges, efforts are being made to introduce intelligent public bus services aiming to encourage the use of public transportation. Examples of such initiatives include the Smart Selangor Bus Service provided by the Selangor state government and Bas Muafakat Johor, a free bus service provided by the Johor state government in Malaysia (Bernama, Accessed on 03 June 2023). myBas (Causeway Link, 2023), a Malaysia government’s Stage Bus Service Transformation (SBST) programme is launched to standardise the operation, service level and management of the public bus services in several states of Malaysia, in Johor alone the government is expending RM150 million over 3 years to boost the quality of stage bus services in Johor Bahru (the capital city of Johor) and its nearby townships. These buses are well-equipped with a GPS onboard, an e-payment system, a WiFi router to provide Internet connectivity to the commuters and a mobile app for journey planning. However, there are still some smaller bus operators that are not part of the myBas ecosystem, especially in small towns. Managing the fleet can be challenging and without adequate funding from the government, the operators are reluctant to invest in the infrastructure, i.e., GPS system on the buses to improve their service offering. Given such a constraint, the idea is to investigate the use of alternative approaches to GPS, i.e., by using IoT technology, which is potentially lower in cost, easier to deploy and yet sufficiently reliable to provide the basic fleet management needs to improve their bus services, so that they are at least on par with the other major operators.
This paper presents an alternative approach to tracking the location of buses without using a GPS device, offering an innovative IoT-enabled Bluetooth approach as a potential solution to collect bus location data based on proximity sensing. This work is funded by ASEAN ICT Virtual Organisation (IVO) to improve the urban mobility in developing countries. Bluetooth technology plays a pivotal role in the IoT landscape, providing reliable and energy-efficient connectivity for a diverse range of applications across various industries such as healthcare (Cicceri et al., 2020; Tartarisco et al., 2024), smart cities (Boukhechba et al., 2017), smart agriculture (Maddikunta et al., 2021), industrial IoT (Gore et al., 2019), wearable technology (Lo and Yohan, 2020), and smart home devices (Amoran et al., 2021). Its versatility, low power consumption, and widespread adoption make it a cornerstone in the development of interconnected and smart ecosystems. BLE has been widely used and deployed for presence sensing, e.g., Apple’s AirTag, indoor positioning, e.g., Estimote’s Bluetooth beacons, as well as proximity-based contact tracing (Trivedi and Vasisht, 2020; Ng et al., 2021; Tang et al., 2021) during COVID-19 period. Our approach aims to build smart infrastructure at the bus stop by embedding IoT devices to perform sensing and information dissemination. The first task is to sense the arrival of buses at the bus stop using wireless proximity sensing and then transmit the location data to the cloud. Proximity sensing using BLE is fast and accurate as it is efficient to broadcast BLE advertisements periodically and no communication handshake is required. A Raspberry Pi device is installed at the bus stop to continuously scan for BLE advertisements. As for the bus, a low-cost BLE beacon can be easily attached to the dashboard so that it continuously emits BLE advertisements. As there are many Raspberry Pi being installed at multiple bus stops along the bus service route, this provides redundancy to the proposed proximity-based fleet tracking mechanism such that the sparse bus location data can still be collected even though one of the Raspberry Pi devices is down. As compared to a GPS approach, in the event that the GPS device is faulty, the entire journey data of the bus becomes unavailable. In the future, the Raspberry Pi installed at the bus stop can further provide crowd-level sensing, bus arrival information display, information exchange with the bus fleet, etc.
The proposed IoT-based fleet management for public bus system is currently on trial and deployed on two bus services in Johor servicing three cities in the state of Johor, Malaysia: Johor Bahru, Iskandar Puteri, and Kulai, working with the bus operator and the respective city councils to deploy IoT devices at bus stops and BLE beacons on public buses. By utilising IoT technology and Bluetooth connectivity, this research has shown the potential of an additional approach to location tracking in a cost-effective manner for the local bus operators, thus enabling them to provide improved stage bus services to their passengers. The contributions of this paper are as follows.
• Design, implementation, and deployment of the proposed IoT-based BLE proximity sensing for bus location tracking in a real-world public stage bus service in Malaysia.
• Derive insights relating to the bus journey, duration between bus stops, and traffic patterns based on the bus location data collected to provide ETA for the bus services.
• Devise a base algorithm to compute the ETA based on the historical journey time of the bus services, using the real-time location data obtained from the proposed IoT-based proximity sensing system to estimate the arrival times for subsequent bus stops.
• Share the challenges, experiences, and lessons learnt from this real-world deployment, discussing the deployment architecture, power supply, reliability of IoT devices, and efforts in engaging the relevant stakeholders.
The rest of the paper is structured as follows. Section 2 reviews the related work on intelligent bus systems, specifically the GPS-based and IoT-based fleet management systems. Section 3 presents the proposed IoT-enabled BLE proximity sensing for bus location tracking, its architectural design, implementation, deployment, and field trials in Johor Malaysia. In Section 4, we provide a preliminary analysis of the data collected, deriving insights on the journey duration, and travel time between bus stops and propose a base algorithm to compute the ETA based on this historical data. Finally, we discuss the deployment challenges, and lessons learnt and conclude the paper with future work in Section 5.
Bus tracking involves two distinct components: hardware and software. The hardware aspect of bus tracking revolves around the utilisation of IoT devices and GPS technology to monitor and track the movement of buses in real-time. These hardware components, such as GPS receivers and IoT sensors, are responsible for collecting and transmitting location data, enabling accurate bus tracking. Numerous designs have been proposed and implemented for bus tracking systems. One such system involves installing GPS modules on buses to transmit real-time bus locations to a central server. Kumbhar et al. (2016) proposed a system that consists of GPS transceivers that track the location of the bus, a central control unit that uploads information about the bus, bus stops, and routes to the database, and an interactive web-based application for remote users. Sridevi et al. (2017) proposed a bus-tracking prototype system using low-cost GPS sensor connected to an Arduino UNO board and transmits location data to the cloud via GSM and/or Wifi. Sujatha et al. (2014); Lim et al. (2016) on the other hand, proposed tracking of buses through mobile phone GPS. By using in-built GPS on both the passengers and bus drivers’ mobile phones, the bus location information can be transmitted to a central server via GSM. This can reduce the cost of installing GPS on every bus. However, there needs to be a mechanism to incentivise the passengers onboard the bus to share their location information and there is a potential privacy issue in which the passenger’s location information is misused.
On the other hand, the software aspect focuses on processing the collected data and employing predictive algorithms to estimate the bus’s time of arrival at various stops along its route. By analysing historical data, traffic patterns, and other relevant factors, the software algorithms can generate reliable predictions for passengers, allowing them to plan their journeys more efficiently. In Amita et al. (2016), a bus travel time prediction model was developed using Artificial Neural Network (ANN) and GPS data obtained for a 17.4 km route in Delhi, India with 43 bus stops. The result showed that ANN outperformed the linear regression model. In Lin et al. (2013), the bus arrival time was predicted using ANN and hierarchical ANN based on GPS data and automatic fare collection (AFC) system data for an 8.1 km route in Jinan, China with 15 bus stops. In a more recent study, Han et al. (2020) introduced the GPS position calibration method to help increase arrival accuracy using Long Short-Term Memory (LSTM) models. The results of their experiment demonstrated good accuracy in both peak-time and off-peak-time prediction as compared to other traditional methods.
A study by Gunady and Keoh (2019) proposed the use of BLE proximity beacons for bus tracking and estimation of arrival time as an alternative to using a GPS device. This study focused on a single route with 37 bus stops and demonstrated an alternative to GPS for collecting, analysing, and disseminating bus transport information. However, the evaluation was limited to the accuracy of beacon detection by RPi 3 devices installed at the bus stops and the proposed method of ETA estimation was based on the historical speed of the bus. The concept of smart bus stops involves deploying smart devices to provide services such as passenger counting, wireless connectivity, USB charging, bike rental, air conditioning, taxi hailing, tourist information, news, advertisements, weather forecasts, surveillance, and more. Leveraging the IoT, Jalaney and Ganesh (2020) predicted the bus arrival time using the data gathered from the vehicles stored in a cloud server. The proposed method showed that accurate appearance time under different traffic conditions can be predicted using the bus and route with different parameters such as average speed, number of passengers, rush hour information, and number of bus stops. In a different study by Desingu et al. (2023) that analysed arrival time using historic and real-time route data, beacons were installed on all the busses and the best stops to estimate the arrival time. The captured data were then analysed using machine learning models to predict the arrival schedule and at the same time, allow the commuters to access the running status of the buses. The study revealed that IoT solutions like beacons can be leveraged with prediction algorithms to produce a dynamic prediction.
Wi-Fi has been proposed as a method to perform passenger counting, including the counting of the origin and destination (O-D) of public transit passengers (Algomaiah and Li, 2022). A Wi-Fi detector was installed in the bus to detect passengers, assuming that they each carry a mobile phone. The number of passengers is estimated based on the MAC Address of the mobile phones. The proposed approach was able to recognise 78.7% of the total passengers as well as to detect their boarding and alighting activities. However, the use of Wi-Fi is affected by the dynamic change of MAC IDs operated by some smartphones. Similarly, Dunlap et al. (2016) used Bluetooth and Wi-Fi to tackle the O-D counting and advocated that although Wi-Fi has a longer detection range, it adds a significant amount of spatial uncertainty to the data. Hence, Wi-Fi data are much noisier than Bluetooth data. The findings suggest that for onboard transit passenger detection, Bluetooth may provide more useable data, but passengers may have turned off their Bluetooth. Kostakos et al. (2013) proposed passenger sensing using Bluetooth and showed that it achieved almost 80% accuracy of the daily fluctuation of actual passenger flows. These studies have shown the wide usage of wireless technologies for object and passenger sensing.
Motivated by the increasing deployment of smart bus stops and the use of IoT technology, the state-of-the-art survey has shown the feasibility and viability of using proximity sensing approaches for fleet tracking on a small scale. In this paper, we propose a data collection and analytic framework for public bus services based on BLE proximity sensing and scale up the solution for deployment in a real-world setting, i.e., trials on multiple bus services, spanning multiple cities in Johor, Malaysia. This further demonstrates the feasibility of using the IoT-based BLE proximity sensing as an alternative to the GPS-based system. The experience drawn from the real-world deployment of such a large-scale field trial in a developing country like Malaysia, involving the public bus operator and city councils is valuable. Despite the many challenges faced, this paper also highlights the solutions and strategies for mitigating both the technical and soft challenges encountered during the deployment.
This paper proposes a fleet data collection and analytic framework for public bus services using IoT. The aim is to investigate the feasibility of deploying low-cost IoT devices at bus stops to equip them with smart infrastructure for fleet tracking, passenger information display, and crowd detection in the future. Such an IoT infrastructure is important to enabling fast deployment of bus fleet tracking and passenger information systems, allowing the passengers to obtain live location of the buses and their ETA, hence reducing waiting time. Figure 1 illustrates the proposed system for tracking the location of public buses along their service route using BLE proximity sensing. Instead of installing a GPS device and 3G data connectivity on each bus, a BLE beacon (i.e., Estimote iBeacon) that periodically broadcasts Bluetooth advertisement in a specified interval is placed and attached to the dashboard of the bus. When the bus passes by a bus stop that is equipped with a BLE detection device (i.e., Raspberry Pi (RPi)) that continuously scans for the beacon signal in the vicinity, it is able to detect the arrival of the bus at the bus stop. The RPi will then send the bus location data and the timestamp to the cloud-based data analytic service to estimate the arrival time of the bus at subsequent bus stops toward the destination.
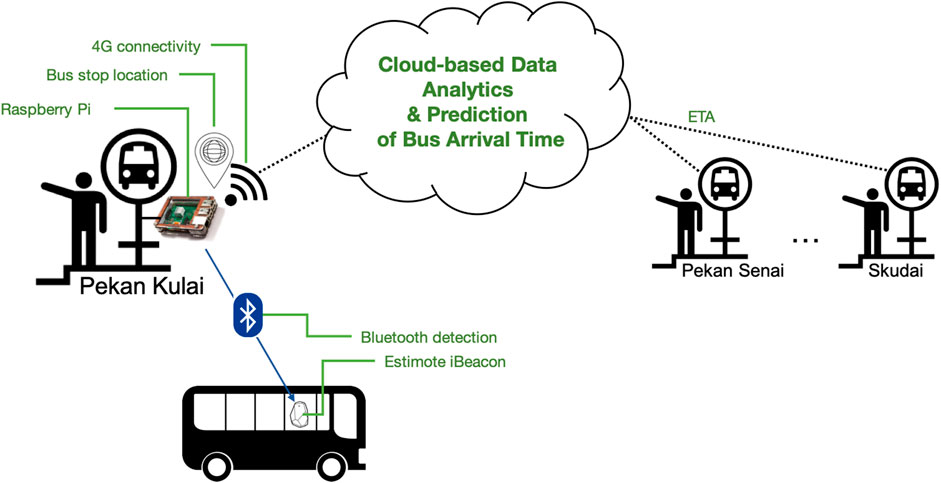
FIGURE 1. Architecture of Public Bus Fleet Tracking using BLE in Johor Malaysia.
As we are proposing an alternative approach to fleet tracking using an IoT-based BLE system, some of its advantages as compared to a GPS-based system onboard the bus are described as follows.
• GPS devices are significantly more expensive than a BLE beacon to be installed on the bus. A reliable GPS device is 3x the price of a BLE Estimote Beacon.
• The accuracy of the GPS location can be easily affected by the weather conditions though the location data logged is much more granular. As for BLE, the detection is based on the distance between the bus and the BLE detection device.
• GPS signals are susceptible to spoofing (Chauhan and Gao, 2021; Chu et al., 2022), thus rendering the inaccurate computation of ETA.
• By investing in building the infrastructure of bus stops, the city councils can further deploy additional smart city applications such as crowd-level detection, information display, and surveillance at bus stops in the future.
Although the use of the proposed IoT-enabled BLE system has some advantages there are some disadvantages which are described as follows.
• It requires and relies on adequate Infrastructure to be in place. For example, all the bus stops need to be equipped with RPi and power supply. This may lead to higher complexity and cost.
• The BLE’s range is significantly shorter than the GPS. Hence can only be used where high-precision short-range applications are required. This makes it suitable for transit stations.
Hence, the choice of application of the proposed IoT-enabled BLE system is based on the trade-off between precision, range, infrastructure needs, cost, and energy consumption.
The bus location data collected from this research will then be fed into a machine learning model trained using nonlinear regression techniques, i.e., decision tree regressor, random forest regressor and k-nearest neighbors regressor, as well as other methods using Artificial Neural Network (ANN) (Phon-Amnuaisuk et al., 2023) and Multi-Layer Perceptron (Xu et al., 2023) to refine the prediction engine, thus increasing the accuracy of the estimation of bus arrival time. The initial exploration shows that ANN has the capability of capturing the journey duration and temporal dynamics of the traffic environment from this dataset, producing a reasonable estimation of the journey duration.
Bluetooth Low Energy (BLE) is a power-conserving sub-technology of Bluetooth, designed for devices and machines that are connected to the Internet. Due to the low maintenance cost and long-lasting battery life, it is a popular technology that is being widely used for pervasive computing and IoT applications in recent years. BLE devices when set at 0 dBm (decibels/milliwatts) output power could produce a detection range of up to 50 m. Any Bluetooth device, such as a RPi will be able to determine within the set range of the BLE, whether there are devices within the proximity.
Our proposed system uses BLE proximity sensing in order to detect whether a bus is 1) stationary at the parking bay of the bus terminal 2) stopping at the bus stop, or 3) passing through a bus stop along its service route. When the bus is detected at the bus stop, the location information together with a timestamp are sent to the cloud service and this triggers real-time estimation of bus arrival time for all subsequent bus stops along the bus service route. The ETA service will query a predictive model trained based on past historical journey time between bus stops to estimate the arrival time at subsequent bus stops in real-time.
The Estimote BLE beacon is placed inside the dashboard of the bus, broadcasting BLE advertisements using iBeacon protocol. The Estimote beacon can be configured to adjust the broadcasting power, the maximum range of broadcast, and the advertising interval. We advocate that the maximum range of ≈ 70 m is used, to ensure that the BLE beacon can be picked up by the BLE detection device. A RPi device can be used as the BLE detection device installed at bus stops and bus terminals. It is programmed to periodically scan and discover BLE devices in proximity. There is a white list that contains the MAC addresses of all the Estimote BLE beacons deployed on the buses, and it is updated daily from the cloud server. This allows for the RPi to filter out non-relevant BLE devices, and only discover buses plying the route that stops at and/or passes by the bus stops.
A RPi device must be mounted at the bus terminal to detect the departure of the bus. The RPi maintains a list of detected beacons (also the buses) at the parking bays; If it discovers that the BLE beacon signal is no longer detected, this implies that the bus has left the bus terminal. As the BLE detection can be inconsistent due to interference, a single non-detection does not necessarily mean that the bus has departed. Therefore, when there are three consecutive non-detection of the BLE beacon, RPi assumes that the bus has left the bus terminal. Subsequently, the RPi sends the location of the bus (i.e., the coordinates of the bus terminal) to the cloud-based analytic server, as the last known location of the bus. This would in turn trigger the prediction of bus ETA based on the bus’s departure time at the bus terminal.
Typically, the bus stops at bus stops to pick up passengers and to allow for passengers to alight. As the bus is stationary for about 1–2 minutes at the bus stop, this allows for the RPi to accurately pick up the BLE advertisement emitted by the Estimote BLE beacon in the bus, and upon successful detection, sends the location of the bus stop (pre-set in the RPi) to the cloud-based analytic service for processing. In the case that the bus stays at the bus stop for a longer period of time, as the RPi scans for the beacons continuously, it will send the bus location to the cloud service for every detection of BLE advertisement from the bus. In this way, the system is aware that the bus is still at the bus stop, and the ETA to the next stop will be updated accordingly and accurately until the bus leaves the bus stop.
It is possible that RPi detects buses in the opposite direction of travel and this would have an adverse effect on the ETA if the bus is mistakenly classified as plying the opposite service route. This can be mitigated by first checking the travel direction of the detected bus, i.e., by checking whether the ETA of the last stop for that particular service route is known. If the ETA for the destination is not known, this implies that the bus is traveling in the opposite direction.
In partnership with Johor Public Transport (Pengangkutan Awam Johor) (PAJ) and three city councils in Johor Malaysia, namely, Johor Bahru (MBJB), Iskandar Puteri (MBIP) and Kulai (MPKu), we have deployed the proposed IoT-based fleet tracking and analytic framework for two bus routes serviced by PAJ, i.e., P-411 (Kulai ⇔ Larkin Sentral) and P-211 (Taman Universiti ⇔ Larkin Sentral).
Both P-411 and P-211 service the Larkin Sentral bus terminal in Johor Bahru to Kulai and Taman Universiti respectively as shown in Figure 2. These buses are free bus services for Malaysian citizens. Larkin Sentral is one of the main bus terminals for long-distance express bus service to other cities in Peninsular Malaysia. Both P-411 and P-211 routes travel via the main trunk road; for P-411, the distance between Kulai and Larkin Sentral is 31 km and the typical journey time is approximately 45–60 min. There are approximately 31 bus stops along the P-411 bus route in each direction, including the terminal stations. Currently, there is only one bus plying this route with a daily frequency of five trips in each direction.
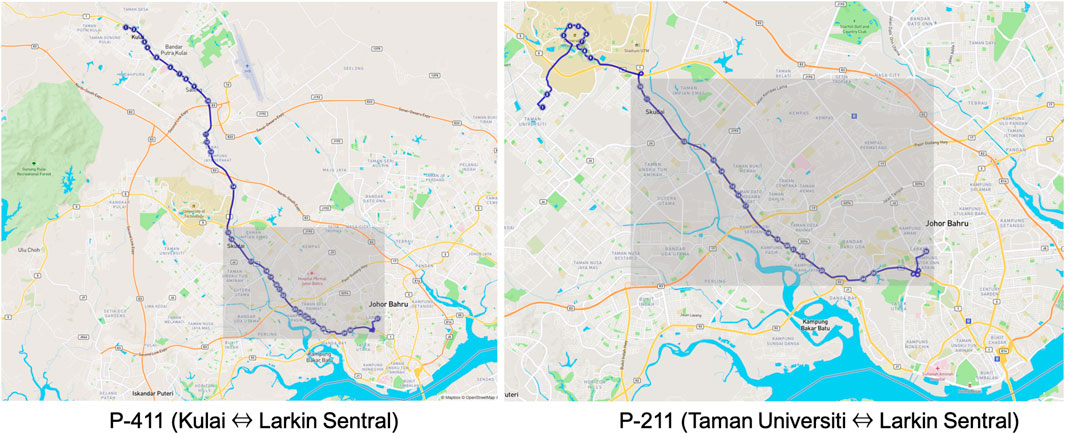
FIGURE 2. Bus routes of P-411 and P-211 in Johor Malaysia.
As for P-211, the route distance between Taman Universiti and Larkin Sentral is 22.3 km. There are 26 bus stops in each direction of travel, including the bus terminals. There are 16 bus stops that serve both P-411 and P-211, as both routes overlap from Skudai to Larkin Sentral as indicated in the grey area on the map in Figure 2. Currently, there are two buses plying the P-211 route with a daily frequency of 14 trips in each direction. Each journey takes around 35–45 min in duration.
The first version of the BLE detection device used RPi 3 with a 4G USB dongle, unfortunately, due to the global shortage of RPi Model 3 and the high power consumption of RPi 4, we decided to scale down the device’s capability to use a RPi Zero which consumes less power. Essentially, the BLE detection device only runs the BLE signal scanning, sends HTTP requests to log bus location data, and periodically sends the device status to Thingsboard using MQTT. Hence, the computational need is very minimal. The BLE detection device consists of RPi Zero connected to a Quectel LTE (EC20 CEFHLG) USB dongle for Internet connectivity.
While conducting a site survey along the bus service routes, we discovered that all the bus stops in Malaysia are not equipped with a continuous power supply. It is observed that only approximately 50% of the bus stops have lights installed which are powered by tapping on the adjacent street lighting pole’s power supply. This means that there is no electricity to power the RPi Zero during the day, and the electricity is only available at night from 19:00 p.m. to 07:00 a.m. for 12 hours. Consequently, we have designed a system that uses 12V/7.2A lead acid batteries to provide power supply to the RPi Zero during the day. When the electricity is available at night, the batteries are charged for 12 hours till the next morning. Figure 3A shows the circuit diagram to tap on the power supply from the street lighting or bus stop to charge the batteries at night.
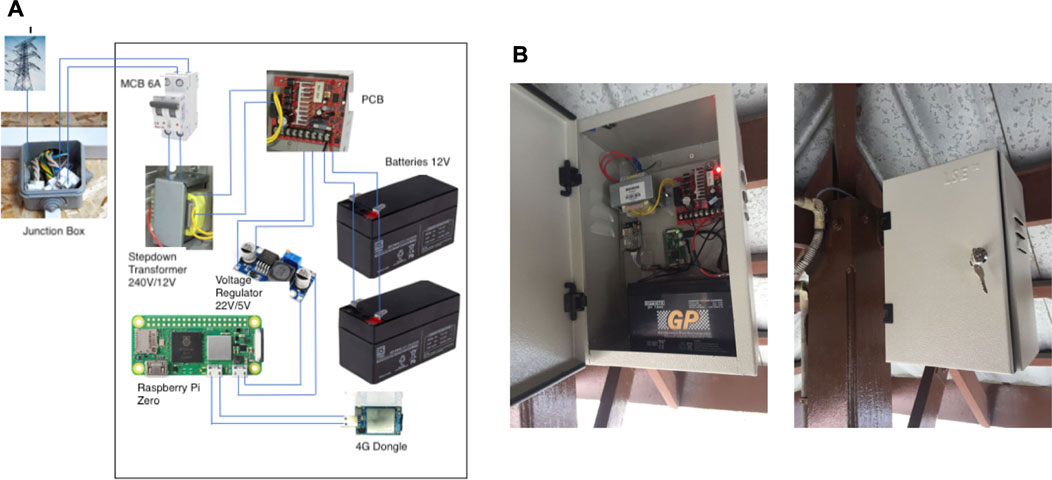
FIGURE 3. (A) circuit diagram for tapping the power supply from the bus stop to charge batteries (B) metal enclosure for the battery charging system and RPi Zero.
A metal box enclosure (25 cm × 30 cm x 12 cm) with a weight of 2.5 kg is used to house the battery charging system, RPi Zero, SD card, and mobile data SIM, to protect the circuitry from heat and rain in tropical weather. In addition, there are safety and vandalism concerns raised by the city council officers and they suggested that the deployed system must be secured, and locked to prevent any tampering and theft. Figure 3B illustrates the metal enclosure deployed in the field.
We also tested the ability of RPi Zero when housed inside the metal enclosure to detect the BLE signals emitted by the BLE beacon. This is important as the metal enclosure would slightly obstruct the signal detection, thus reducing the range of the BLE signal by RPi Zero. It is noted that for a distance of 5–40 m when the bus is stationary or moving at a slow speed, the BLE signals can be detected satisfactorily.
As there are 31 stops and 26 stops for P-411 and P211 respectively study, numerous site surveys were conducted to identify suitable locations to install the BLE detection devices (RPi Zero in a metal enclosure). The locations are chosen based on the following considerations.
• Power Supply—Most of the bus stops tap on the electricity from the adjacent street lighting to light up the bus stop at night. In cases where there are no lighting at the bus stops, the nearby pedestrian overhead bridge was considered as the next alternative for energy sources as it is lit up at night too. The locations were chosen based on the availability to tap on the electricity at night to charge the batteries in order to power the BLE detection device.
• Bus Terminal—All bus terminals must have a BLE detection device installed as they serve as the departure point of the bus service.
• Shelter—Most of the bus stops are sheltered and this ensures that the BLE detection devices are not exposed to direct sunlight and rain, though the metal enclosure is water-proof.
• Crowd Level—Popular bus stops serving as passenger hubs were chosen to ensure the safety of the BLE detection devices. This helps prevent potential vandalism as the bus stop is busy most of the time. In the future, the passenger information display can be integrated with the installed BLE detection device (RPi Zero) to show the bus arrival information.
• Road Traffic—More BLE detection devices are installed at the congested road segment, so that the traffic congestion can be tracked, thus providing a finer granularity of the journey time data.
Once the bus stops had been identified, formal approval was sought from the respective city councils. Installation was done together with the electrician and contractor of the city councils to ensure safety. Figure 4 shows the location of the RPi Zero installed and in operation. Ten BLE detection devices are installed at bus stops that are served by both P-411 and P-211. The bus terminal stations, namely, Kulai, Taman Universiti and Larkin Sentral were first installed, together with the subsequent bus stops after the terminal station. Note that only the Larkin Sentral bus terminal has a continuous power supply for 24 h. With the RPi Zero installed, we are able to track the departure of the buses from the terminals and their arrival time at the destination, thus collecting data on their entire journey duration for analysis.
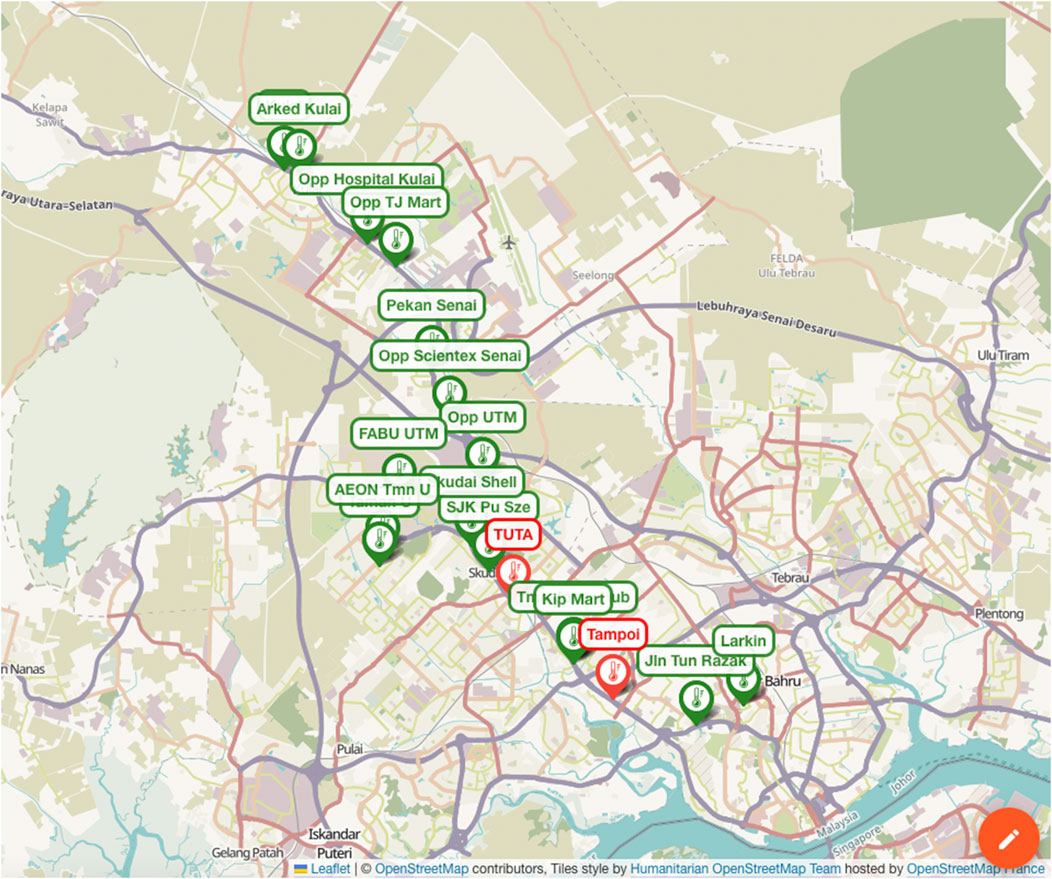
FIGURE 4. Map of the BLE detection devices (RPi zero) installed along P-411 and P-211 routes in Johor Malaysia.
As shown in Figure 5A, our team of engineers spent a few weeks installing the battery charging system and RPi Zero for BLE detection along the bus service routes. The installed RPi zero will also start the BLE signal detection and automatically connect to the Internet. The RPi Zero can also be accessed remotely via the Real VNC service. The metal enclosures are installed and attached to the highest possible location to prevent vandalism from the public.
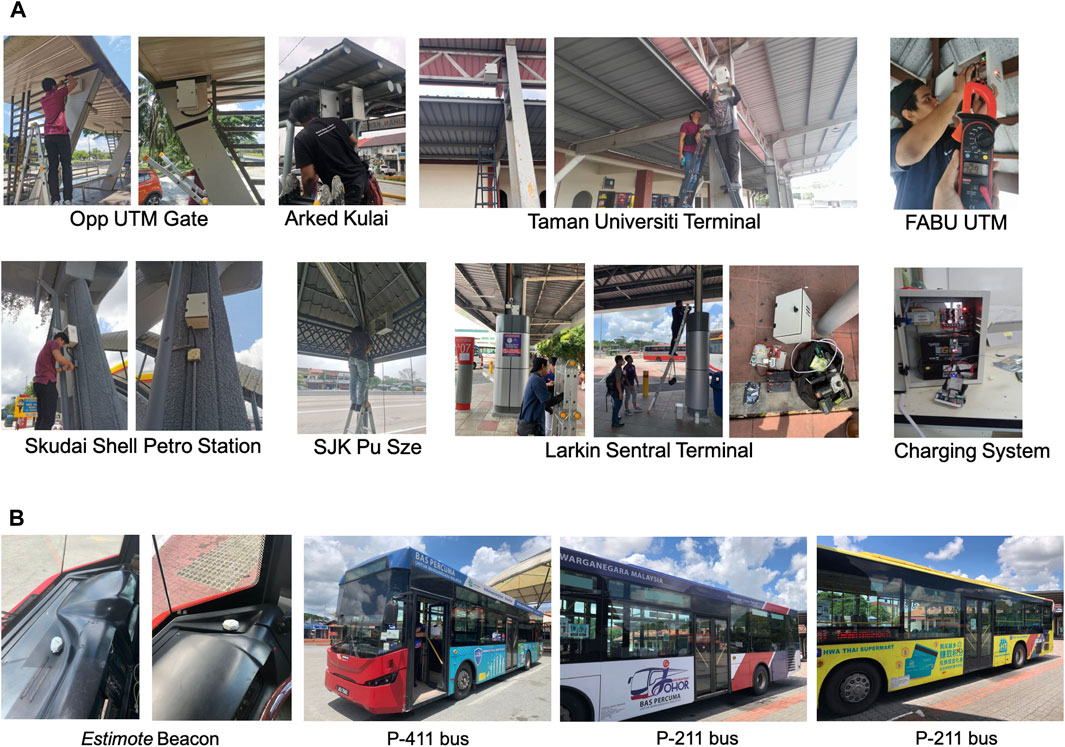
FIGURE 5. (A) Installation of BLE Detection Devices at Various Sites in Johor Malaysia, (B) Estimote BLE Beacons Installed on the Dashboard of Bas Muafakat Johor fleet.
Off the shelf, Estimote BLE beacons are used and placed on the dashboard of the bus fleet. The Estimote beacon is developed based on Bluetooth 4.2 LE standard, with a range of up to 100 m (330 feet) and output power between −20 and +4 dBm in 4 dB steps. It is powered by two AA batteries and it supports both Eddystone and iBeacon protocols. In this deployment, the Estimote beacon is configured to transmit the BLE advertisement every 100 ms with the highest transmission power of 4 dBm. Without any obstruction, the signals can be detected up to 70 m in range. As shown in Figure 5B, three buses have been installed with an Estimote beacon each on its dashboard.
Table 1 shows the preliminary recorded BLE RSSI detected by the RPi Zero without the metal enclosure box based on the distance of the BLE beacon from the RPi Zero, and when the RPi Zero was placed inside the metal enclosure box. It is observed that the RSSI signal slightly weakened when it is placed inside a metal enclosure and when the distance is greater than 20 m. It is noted that an RSSI
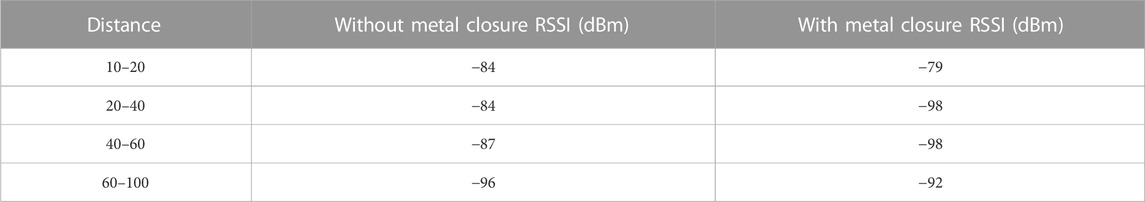
TABLE 1. RSSI recorded by RPi Zero without and with Metal Enclosure.
Figure 6 shows the software system architecture of the deployed system in Johor. RPi Zero is used as the BLE detection device as mentioned previously, and the NodeJS Noble Bluetooth library is used for detecting BLE signals. A cron job is scheduled to run every 10 minutes to monitor the RPi Zero, and whether the following processes are running.
• NodeJS BLE signal detection is running.
• 4G LTE Internet connectivity is up.
• Gather the RPi Zero temperature and send it to the Thingsboard.
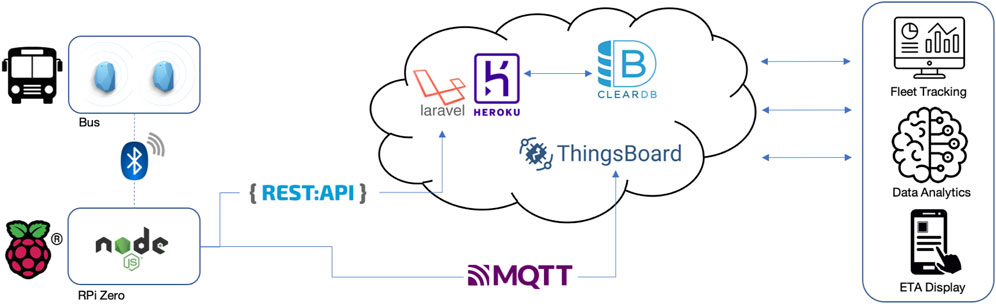
FIGURE 6. The system architecture of the IoT deployment.
As the NodeJS BLE signal detection process is running continuously, the successful detection of the bus approaching or stopping at the bus stops will be sent to the cloud. The information logged includes
This section presents the analysis of the data collected from the 10th of April to the 4th of May, 2023. Specifically, it provides insights on the travel duration per trip, the journey time between bus stops, average travel duration per day, reliability of RPi zero, and cost-benefit analysis. In addition, based on the results, an approach to compute the ETA at the bus stops is proposed based on the data collected.
Figure 7 shows the journey duration for P-211 and P-411 routes derived using Equation (1).
where TD(k) is the travel duration for bus k, A(k) is the arrival time of bus k and D(k) is the departure time for bus k.
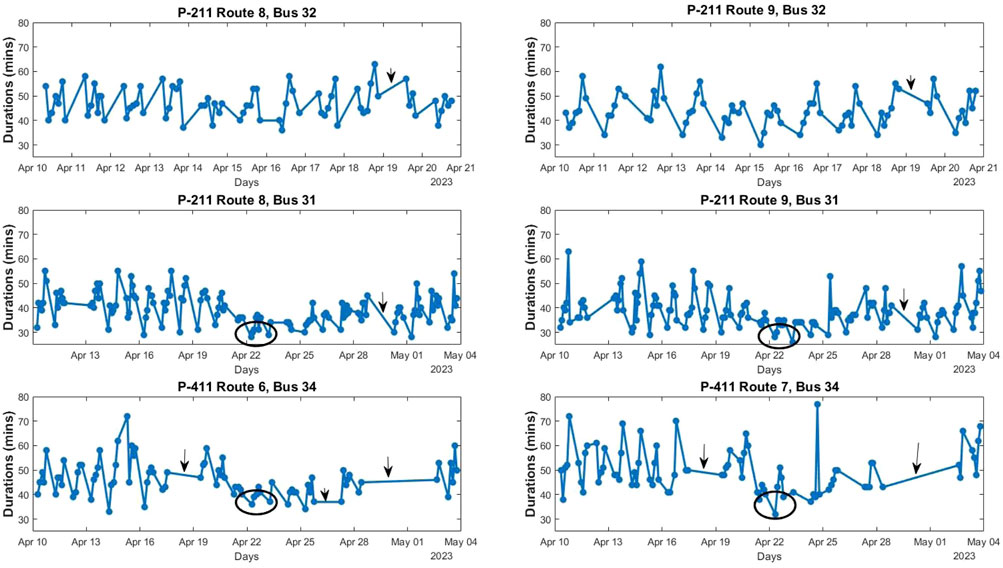
FIGURE 7. Derived journey duration for P-211 (bus 31 and 32) and P-411 (bus 34)
In the current deployment, the P-211 has two buses: bus 32 and bus 31 plying the route while the P-411 has only bus 34. For buses 31 and 32 on P-211 route, the journey from Taman Universiti to Larkin Sentral is considered as route 8 while the reverse direction is considered as route 9. As for P-411 route serviced by bus 34, route 6 indicates the journey from Kulai to Larkin Sentral while the reverse direction is denoted as route 7. It is observed that there is no data logged for bus 32 after April 20th, upon checking with the bus operator, it was sent to the workshop for servicing. Similarly, the arrow in the graph for bus 31 and 34 indicates the downtime of the buses as they were not running due to repair and servicing (Note that a replacement bus was put into service by the bus operator, however, there was no BLE beacon installed on the replacement buses). It is observed that the consistently low travel duration for all the trips on 21st April was due a public holiday. In general, the analysis conforms to the traffic patterns in that early hours trips between 6:00 a.m. to 7:00 a.m. were fast and smooth, while the trip duration was longer during the afternoon peak hours from 15:00 p.m. to 19:00 p.m.
The bus terminal stations have daily scheduled trips and each bus station is equipped with a BLE detection device such that when the BLE signals on the bus cannot be detected, this indicates that the bus had departed the terminal station. The proposed system enables the transport management agency and bus operators to monitor the on-time performance of bus departures and track the movement of buses. For instance, a daily analysis of data from Figure 7 shows that there is a maximum delay of 12 min with an average delay of 4 min. Such early departures or delays will impact the ETA of the buses and these irregularities need to be accounted for. With only 32% on-time departure in a day, the on-time performance of the public transit system must be improved. From the analysis, 11% of early departures and 57% of delayed departures were also observed for P-211.
The trip duration varies throughout the day as the traffic condition changes throughout the day. Figures 8A,B show example instances of journey duration of all the scheduled trips of P-211:route 9 and P-411:route 6 respectively. It is observed that the average daily travel duration for P-211:route 9 on 20th April is 41 min 51 s. While for P-411:route 6, the average journey duration is 48 min and 8 s. The average travel duration AD is determined using Equation (2)
where N is the total number of trips.
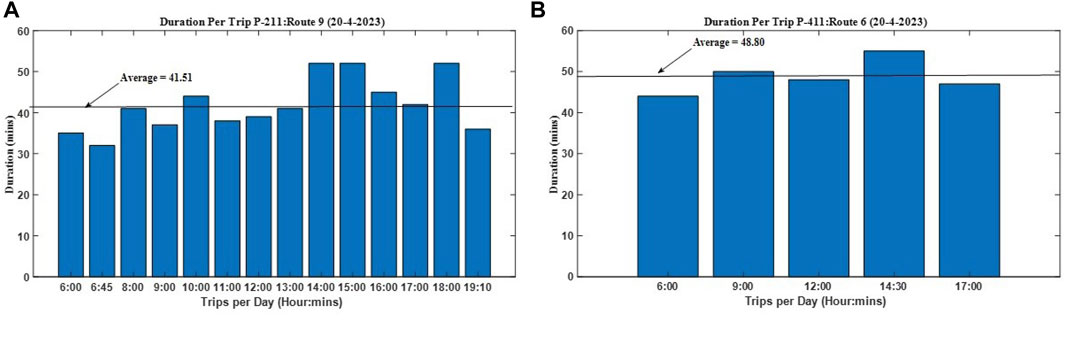
FIGURE 8. Average daily trip duration for (A) P-211 and (B) P-411 on 20th April.
The travel duration per trip varies throughout the day. The variation is a result of increasing passenger count and traffic conditions at different times of the day. Hence, the use of the average daily travel duration to predict the ETA will lead to inaccurate results.
We further analysed the effect of public holidays on the journey duration. Figures 9A,B show the statistics of journey duration on a public holiday and non-holiday for routes P-411 and P-211, respectively. For P-411, there was a significant reduction in journey time on public holidays by approximately 10 min as compared to a normal day. The results show that on a typical day, the average journey time is around 51–52 min, while on a public holiday, it is observed that all trips made throughout the day regardless of the travel direction (either route 6 or route 7) were consistently between 39–43 min. Traffic conditions appeared to be rather smooth.
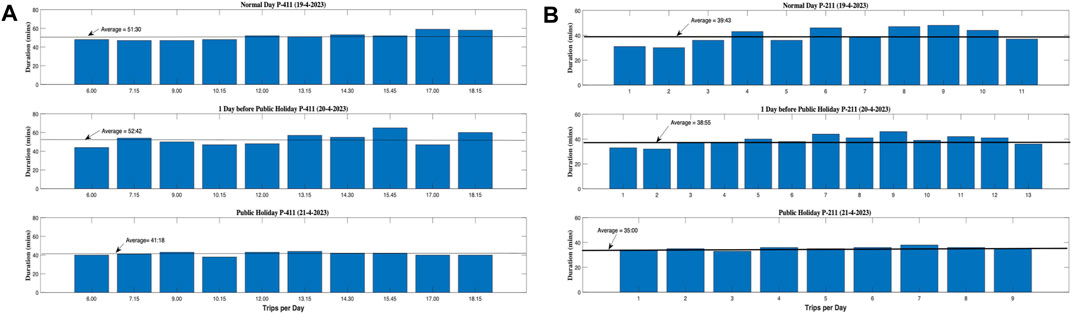
FIGURE 9. Journey Duration on Normal Day vs. Public Holiday for (A) P-411 and (B) P-211.
As shown in Figure 9B, for P-211, there was only a reduction of 5 min on a public holiday, which was an average of 35 min for the entire journey. This is logical as the routes of P-211 and P-411 overlap for 14 km between Skudai and Larkin Sentral, in which they split to travel to Taman Universiti and Kulai respectively.
With the BLE detection devices installed at bus stops, the proposed system is able to derive the travel duration between two consecutive bus stops using Equation (3).
where tdi,j(k) is the travel duration between bus stop i to the next bus stop j, aj(t) is the arrival time at bus stop j and di(k) is the departure time from bus stop i.
The use of average speed of the bus based on previous stops was used to determine the ETA in Gunady and Keoh (2019). The use of historical average speed may not reflect the current situation as the bus speed can change due to congestion or delays. Hence, to overcome this problem, the following method is adopted.
• Step 1: The travel duration for all the routes was first analysed by taking the historical average duration between each bus stops and the routes with the shortest travel duration per trip were determined using Equation (1).
• Step 2: The shortest travel duration per trip was selected for each route. Then the travel duration tdi,j(k) between the bus stops along the routes was computed using Equation (3). The sum of the tdi,j(k) is set as the default ETA for the journey.
• Step 3: The average tdi,j(k) computed in step 2 was set as the default travel time ttj between each bus stop for the selected route.
• Step 4: At every bus stop, the arrival time tj, that is, the time the RPi detects the arrival of the bus is recorded and sent to the server.
• Step 5: The time difference dj = tj − ttj is computed and added to the default ETA in step 2 in order to compute the current ETA as follows.
where m is the number of bus stops in a route.
• Step 6: The step 3 to step 5 is repeated until the bus arrives at the final bus terminal.
Figure 10A illustrates an example of ETA computation based on the analysed data collected from the RPi. The tt1 is the derived travel duration from the bus terminal to bus stop A, while tt2 is the derived travel duration from bus stop A to B, tt3 is for bus stop B to C and so on and so forth. t1 is the time the RPi detected the bus and d1 = t1 − tt1 is the time difference between the t1 and tt1. The sum of the tt1 and d1 is used to compute the ETA at each bus stop. An example is shown in Figure 10B. The bus departs from Larkin Terminal at 18:15 p.m. and ETA at the Kulai Terminal is 18:53 p.m. based on the derived travel time from Step 1. At the next bus stop Skudai, the RPi detects the arrival of the bus at 18:35 p.m. The travel duration is 20 min instead of 17 min default time. Hence a delay of 3 min is added to the ETA. This is repeated for subsequent bus stops until the bus arrives at the Kulai Terminal station. Hence, a total delay of 6 min was added to the ETA.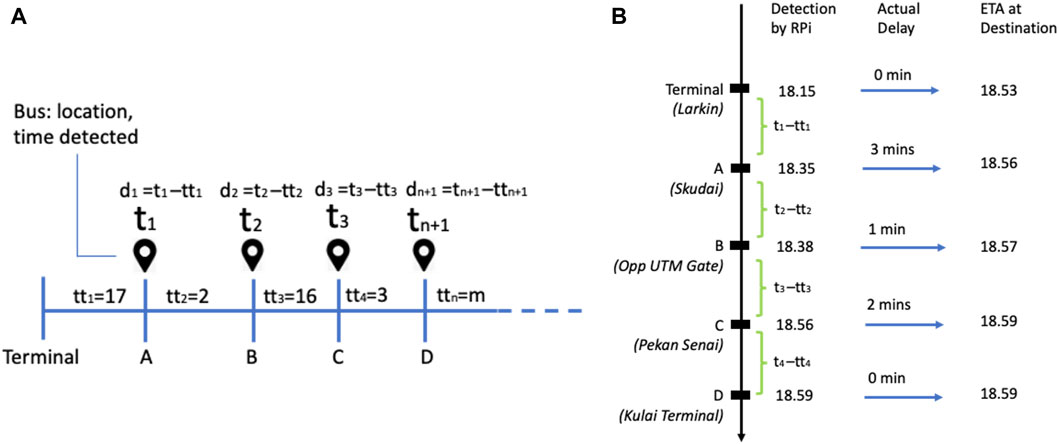
FIGURE 10. (A) Computation of ETA based on Data Collected from BLE Detection Devices (RPi Zero) (B) An Example of the Computed ETA for Route P-411.
Throughout the first month of deployment, the RPi Zero CPU temperature reading ranged from 40°C to 57°C, and typically the temperature is at its peak between noon to 4 p.m. This is evident and illustrated in Figures 11A,B. All the metal enclosures are installed under the shelter and they are not exposed to direct sunlight. It is observed that the temperature of RPi Zero of the Larkin Sentral Terminal Bus Terminal has a higher temperature with an average of 49.9°C than the rest of the installed devices. This could be due to the topography of the area.
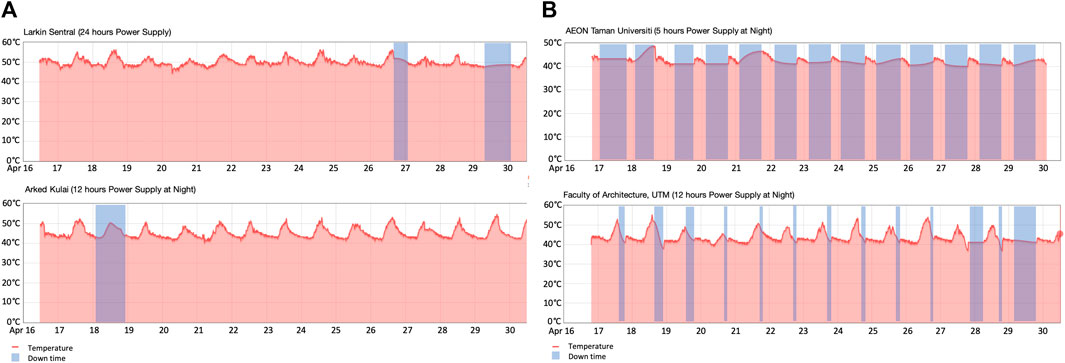
FIGURE 11. Temperature of RPi Zero and system up time of (A) Larkin sentral and Arked Kulai (B) AEON Taman Universiti and UTM
The other aspect of monitoring is to assess the reliability of RPi Zero as it is important that they are operational 24/7 to facilitate fleet tracking. As shown in Figure 11A, the reliability of RPi Zero is excellent when there is a continuous power supply or at least 12 h of uninterrupted power supply. There were only two occasions of system downtime logged by Larkin Sentral (with a 24-h power supply), and one instance of downtime for Arked Kulai (12-h power supply).
However, as can be seen in Figure 11B, when the power supply is intermittent, for example, there were only 5 hours of power supply at night at AEON Taman Universiti bus stop, it was not able to fully charge the batteries and hence resulting in the continuous down time during the day time. This rendered the RPi Zero useless as the bus services are only available between 6:00 a.m. and 7:15 p.m. and the majority of the time the RPi Zero was not operational. In another scenario at the Faculty of Architecture UTM, although the power supply is supposed to be continuous for 12 hours at night, it turns out that there was a power shutdown during some weekends thus resulting in a low battery level. Consequently, even though the 12-h power supply resumed after the weekend, it was not sufficient to fully charge the batteries and hence resulted in partial operations of RPi Zero during the day. As can be seen in the figure, the RPi Zero was down daily between 14:00 p.m. - 15:00 p.m. until the power supply resumed at 19:00 p.m. As these locations are not able to provide a reliable power supply, we advocate that the RPi Zero devices be relocated to other bus stops.
In this work, the main federal trunk road is served by numerous bus services as they are bringing people from smaller cities like Kulai, Taman Universiti, Pontian, Gelang Patah, Taman Selesa Jaya, Pulai, Senai, etc., to the main capital city of Johor Bahru for work, business, leisure, tourism and vice versa. Hence, with the BLE detection devices installed at the bus stops along this road are the most optimal as many of these buses can also be tracked without additional cost. As shown in Figure 12, in the current deployment, two bus routes (P-411 and P-211) can be fully tracked, this can be extended to 12 other bus services where approximately 28%–81% of the BLE detection devices installed currently overlap with the extended service routes. In particular, Bus No 229, 13, and T30 operated by three different operators serve a similar route to P-411, except that its final destination is to Johor Bahru (JB) Sentral instead of Larkin where the last BLE detection point is at UDA bus stop. This means that 15/21 (71%) installed BLE detection devices between Kulai and UDA can be used for tracking these bus services. Additionally, Bus No 2 plying Air Hitam and Larkin Sentral can be tracked by all the BLE detection devices installed for P-411 route as part of the service overlaps with the entire P-411 route. This means a utilisation of 80% of the installed BLE detection devices. However, additional BLE detection devices need to be installed between Kulai and Air Hitam. As for Johor Premium Outlet (JPO) route and Senai Airport route (AA1), 57% and 48% of the installed BLE detection devices can be used respectively.
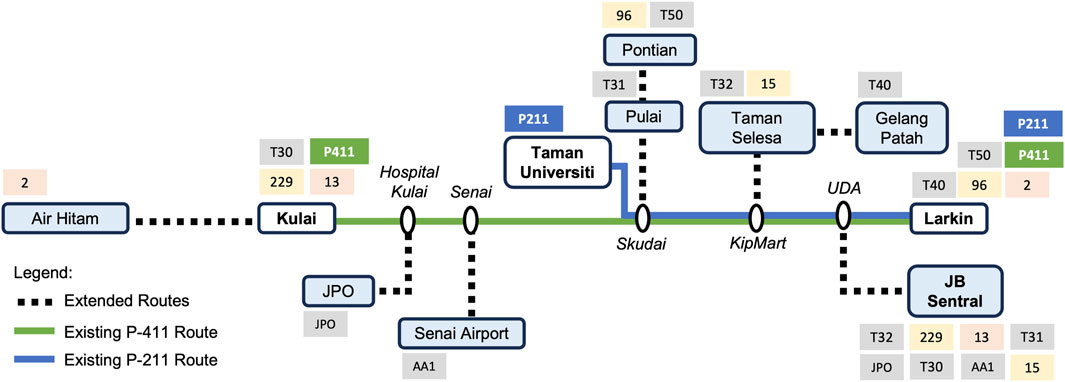
FIGURE 12. Extension of BLE-based system to cover additional bus service routes.
As we present the IoT-based tracking system as an alternative approach to bus fleet tracking, when comparing the proposed approach with the GPS-based approach in terms of cost, our approach appears to incur a lower recurring cost though the initial installation cost is higher. From the literature, an entry-level GPS installation costs around US$99 - US$150 (Some service providers offer free installation but with higher monthly subscription cost). Usually, the provider will charge around US$20 - US$35 per month per vehicle. On the other hand, our deployment requires a BLE beacon to be installed per vehicle, i.e., US$24 and the battery can be replaced using two AA batteries. As for the BLE detection device installation cost, it is approximately US$450 per site, details are as follows.
• RPi Zero and 4G dongle, US$150
• Battery Charging System in a Metal Enclosure, US$300
Assuming that the bus service frequency is every 30 min operating from 6:00 a.m. to 10:00 p.m. With 12 service routes, there would be 48 buses required to run the half-hourly service schedule. Table 2 shows the initial cost incurred for the first 2 years of operation respectively. Although our approach requires a significantly higher initial cost for the installation of BLE detection devices at bus stops (assuming that our approach needs to increase the number of sites from the current 21 bus stops to 40 bus stops to cover all the 12 bus service routes completely). The monthly recurring cost for the BLE-based approach mostly consists of the Internet data cost for each BLE detection device, and the cloud server cost, while for GPS-based approach the service provider charges a fixed fee per bus. Consequently, the monthly recurring cost for the GPS-based approach is an additional US$740 per month as compared to our BLE-based approach. As shown in Figure 13, the cost incurred for GPS-based and BLE-based becomes parity in Year 2, and the accumulated additional cost of GPS-based approach increased drastically. However, we recognised that the BLE-based system would require timely maintenance and replacement of hardware as well as batteries due to degradation over time. At the moment, there are no electricity charges incurred as the city councils have kindly provided the power supply from the street lighting at night only.
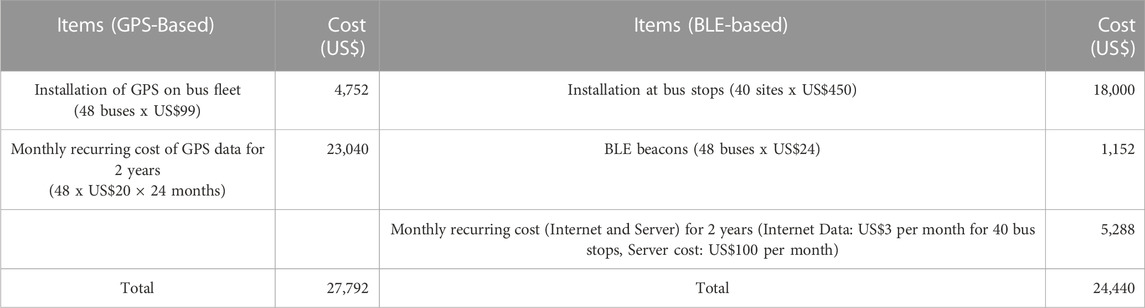
TABLE 2. Comparison of cost of fleet tracking for the first two years (GPS-based and BLE-based).
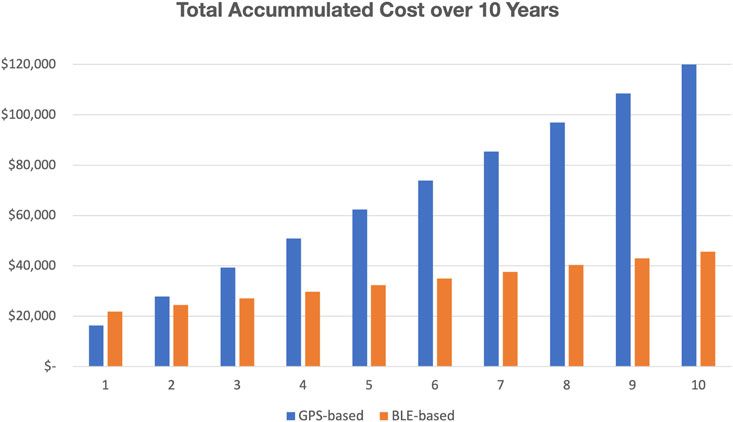
FIGURE 13. Cost Analysis of GPS-based vs. BLE-based Approaches.
The challenges faced in the deployment of the proposed systems in the Johor deployment and field trials are discussed in this section.
A major challenge faced is the availability of an adequate electric power supply for the RPi Zero at some of the bus stops. Some of the bus stops only had a scheduled power supply from 19:00 p.m. to 07:00 a.m. This implies a lack of power for the RPi Zero during the day. In order to mitigate this situation, we carried out a power consumption analysis for the RPi Zero and concluded that it is possible to use of a dual battery system to power the RPi Zero during the day, while tapping on the 12-h power supply at night to charge the batteries. Our deployment shows that this is sustainable to ensure that the BLE detection is operational. In the future, we will investigate the cost-effectiveness of deploying solar panels for RPi Zero.
The intermittent power supply will typically lead to some services on the RPi Zero to be unavailable, e.g., when the battery’s voltage drops below 6V, this will not be sufficient to power the 4G dongle even though the RPi Zero is still running. Without Internet connection, the bus location data though the BLE signal was detected by the RPi Zero, it cannot be sent to the cloud. Consequently, this may lead to intermittent inaccuracy of the bus ETA. However, once the bus is detected at the next bus stop, the location data updates will resume. In this case, although the Internet was down for the RPi Zero, once the power supply resumes, the Internet connectivity will also recover, this means that all the bus detection data logged on the RPi Zero can be sent to the cloud in a batch. This ensures that the bus location data is not lost, and they are valuable as the dataset for training the journey duration prediction model.
The reliability of the RPi Zero plays an important role in the success of the proposed system. The RPi Zero must be operational during the day, and the BLE detection and Internet connectivity must be up at all times. We observed that there were instances where the RPi Zero was down due to a power cut, but it recovered automatically once the power supply resumed. While deploying the RPi Zeros in the field, we have created cron jobs to send heat-beats to Thingsboard to continuously monitor the RPi Zero’s operational status, a daily restart is triggered to reset any transient software or BLE fault and Internet connectivity issue.
The advantage of the system is that even though one RPi Zero is down, the subsequent RPi Zero if not down can still track the traveling bus as the system is only losing one data point in the fleet tracking. Unlike GPS devices, if it is down the entire fleet location information will be lost. We have built-in sufficient redundancy such that coarse location tracking can at least be guaranteed. For example, if the RPi Zero at the bus terminal is down, this means the system is not aware that the bus has departed the terminal; however, we have installed the RPi Zero at the next stop after the bus terminal such that when such a situation occurs, the next bus stop RPi Zero is able to detect the bus and trigger the computation of ETAs of the bus journey.
There was a significant coordination effort that had to be done to seek permission from the city councils in Johor to facilitate the installation of BLE detection device (RPi Zero) at the bus stops, as this is under the purview of the city councils’ infrastructure team. Additionally, many site surveys had to be done to find a suitable location for the installation, e.g., the availability of the power supply and to minimise the exposure to heat and rain. Safety is also a concern raised by the city councils as the installation should be compliance with the safety at the bus stops to prevent any accidents and hazards. As there were significant amount of vandalism of public infrastructures reported by the city councils, they advised that the metal box enclosure be secured and installed at a location that is not easily reachable. Overall, the city councils were very supportive of the deployment of the proposed system.
In this paper, we have demonstrated the IoT-based BLE proximity sensing as a low-cost and reliable alternative approach to fleet tracking by working closely with the various stakeholders such as the city councils and the bus operators. Our engagement with the stakeholders show that there is an interest from the bus operators to explore the use of IoT-based fleet management technologies, while for the city councils they are interested in how IoT can be used to transform conventional bus stops into smart infrastructure. The main contribution of this paper is to showcase the deployment of the proposed IoT-based fleet management platform in a real-world setting in the southern cities of Malaysia, involving two public bus service routes spanning three cities in Johor. The findings from this work show that IoT-enabled BLE system is a viable solution for tracking, providing accurate ETA, and effective public transport management solutions for transport agencies. The results show that using BLE for proximity sensing is very efficient and reliable, as the detection of BLE advertisements is fast. From the data collected, we first devised an ETA algorithm based on the historical data. Traffic patterns between bus stops and the bus service routes are derived by analysing the bus journey duration, average daily trip and the on-time performance of the bus service. One notable observation is that the journey duration on public holidays are 15%–18% faster than normal workdays, and this can be a unique feature to be used for journey duration prediction modeling using machine learning in the future. The real-world deployment also provided insights into the practical challenges of implementing an IoT application in the real environment as compared to a lab setting. Experiences in addressing these challenges have been shared, thus providing various mitigation strategies to be adopted to ensure the smooth operation of the IoT applications deployed.
As this is only the first step towards transforming urban mobility using IoT, based on the data collected, a machine learning model for journey duration prediction will be trained and deployed to predict the ETA based on the real-time location detected. With accurate machine learning prediction, it is anticipated that the number of BLE detection devices to be mounted at bus stops could be optimised in order to minimise operating costs in the future. Secondly, with the RPi Zero deployed at the bus stop, there is now some form of computational capability and Internet connectivity available at the bus stops; the next step is to integrate a passenger information display at the bus stop using low-cost E-Ink paper display to indicate the bus ETA. Though a mobile app has been developed, the passenger information display at the bus stops seems to be more convenient. Thirdly, the use of wireless technologies such as Bluetooth and Wi-Fi can be further exploited to perform passenger counting in an unintrusive manner. Information on the crowd level at the bus stops as well as onboard the bus is important to help bus operators to optimise their operations and achieve their service level agreement. Lastly, the proposed IoT-based BLE proximity sensing system will be expanded and deployed in various other cities in Indonesia and Malaysia, with an aim to truly transform the transport systems for the benefit of people relying on public transport by providing them easy access to buses, thus increasing the use of public transport in general.
The datasets presented in this article are not readily available because the data contains the location information of the bus fleet managed by the public bus operator. Request to access the datasets should be directed to the corresponding authors.
OE: Conceptualization, Formal Analysis, Writing–original draft, Writing–review and editing. SK: Conceptualization, Data curation, Formal Analysis, Methodology, Software, Writing–original draft, Writing–review and editing. SKbA: Conceptualization, Resources, Writing–review and editing. CS: Writing–review and editing, Supervision. QC: Investigation, Writing–review and editing, Conceptualization. MA: Writing–review and editing, Investigation, Methodology. NI: Writing–review and editing, Conceptualization. AB: Methodology, Writing–review and editing.
The author(s) declare financial support was received for the research, authorship, and/or publication of this article. This work is the output of the ASEAN ICT Virtual Organisation (IVO) project, “An IoT-based Public Transport Data Collection and Analytic Framework using Bluetooth Proximity Beacons” (UTM Grant No: R.J130000.7606.4B856), and financially supported by NICT (http://www.nict.go.jp/en/index.html) and Universiti Teknologi Malaysia (UTM) Matching Grant (Q.J130000.3006.04M36).
We gratefully acknowledge the support from the Kulai, Iskandar Puteri, and Johor Bahru City Councils, and Johor Public Transport (Pengangkutan Awam Johor (PAJ)) for providing its bus fleet in this trial and deployment. We would also like to thank Siti Fatimah binti Ausordin, Aslam, Haziq, Agung Setia Budi, Adhitya Bhawiyuga, Yung-Wey Chong, Mohd Najwadi Yusoff and Sydneyanata Gunady for their assistance in deploying this project in Johor.
The authors declare that the research was conducted in the absence of any commercial or financial relationships that could be construed as a potential conflict of interest.
All claims expressed in this article are solely those of the authors and do not necessarily represent those of their affiliated organizations, or those of the publisher, the editors and the reviewers. Any product that may be evaluated in this article, or claim that may be made by its manufacturer, is not guaranteed or endorsed by the publisher.
Alam, O., Kush, A., Emami, A., and Pouladzadeh, P. (2021). Predicting irregularities in arrival times for transit buses with recurrent neural networks using gps coordinates and weather data. J. Ambient Intell. Humaniz. Comput. 12, 7813–7826. doi:10.1007/s12652-020-02507-9
Algomaiah, M., and Li, Z. (2022). Utilizing wi-fi sensing and an optimized radius algorithm to count passengers with transfers to enhance bus transit o-d matrix. J. Transp. Eng. Part A Syst. 148, 04022049. doi:10.1061/JTEPBS.0000699
Amita, J., Jain, S., and Garg, P. K. (2016). Prediction of bus travel time using ann: a case study in Delhi. Transp. Res. Procedia 17, 263–272. doi:10.1016/j.trpro.2016.11.091
Amoran, A. E., Oluwole, A. S., Fagorola, E. O., and Diarah, R. (2021). Home automated system using bluetooth and an android application. Sci. Afr. 11, e00711. doi:10.1016/j.sciaf.2021.e00711
Bachok, S., Osman, M. M., Ibrahim, M., and Ponrahono, Z. (2015). Regenerating ipoh city mobility through high level of service (los) of public bus service. Procedia - Soc. Behav. Sci. 170, 680–689. doi:10.1016/j.sbspro.2015.01.070
Boukerche, A., and Wang, J. (2020). Machine learning-based traffic prediction models for intelligent transportation systems. Comput. Netw. 181, 107530. doi:10.1016/j.comnet.2020.107530
Boukhechba, M., Bouzouane, A., Gaboury, S., Gouin-Vallerand, C., Giroux, S., and Bouchard, B. (2017). A novel bluetooth low energy based system for spatial exploration in smart cities. Expert Syst. Appl. 77, 71–82. doi:10.1016/j.eswa.2017.01.052
Chauhan, S. V. S., and Gao, G. X. (2021). Spoofing resilient state estimation for the power grid using an extended kalman filter. IEEE Trans. Smart Grid 12, 3404–3414. doi:10.1109/tsg.2021.3051920
Chu, Y. H., Keoh, S. L., Seow, C. K., Cao, Q., Wen, K., and Tan, S. Y. (2022). “Gps signal authentication using a chameleon hash keychain,” in Critical infrastructure protection XV. Editors J. Staggs, and S. Shenoi (Cham: Springer International Publishing), 209–226.
Cicceri, G., De Vita, F., Bruneo, D., Merlino, G., and Puliafito, A. (2020). A deep learning approach for pressure ulcer prevention using wearable computing. Human-centric Comput. Inf. Sci. 10, 5–21. doi:10.1186/s13673-020-0211-8
Desingu, K., Isaac, D. M., Mirunalini, P., Bharathi, B., and Philipose, C. M. (2023). Locatemybus: iot-driven smart bus transit. J. Commun. Softw. Syst. 19, 136–146. doi:10.24138/jcomss-2022-0143
Dunlap, M., Li, Z., Henrickson, K., and Wang, Y. (2016). Estimation of origin and destination information from bluetooth and wi-fi sensing for transit. Transp. Res. Rec. 2595, 11–17. doi:10.3141/2595-02
Elijah, O., Rahman, T. A., Orikumhi, I., Leow, C. Y., and Hindia, M. N. (2018). An overview of internet of things (iot) and data analytics in agriculture: benefits and challenges. IEEE Internet things J. 5, 3758–3773. doi:10.1109/jiot.2018.2844296
Gan, F. I. X. R., Mayuga, G. P. T., Lao, L. B. K., and Magsino, E. R. (2023). “An implementation of a bus following model in an 802.11 p based simulator in matlab,” in 2023 1st International Conference on Advanced Innovations in Smart Cities (ICAISC) (IEEE), 1–6.
Gore, R. N., Kour, H., Gandhi, M., Tandur, D., and Varghese, A. (2019). “Bluetooth based sensor monitoring in industrial iot plants,” in 2019 International Conference on Data Science and Communication (IconDSC) (IEEE), 1–6.
Gunady, S., and Keoh, S. L. (2019). “A non-gps based location tracking of public buses using bluetooth proximity beacons,” in 2019 IEEE 5th World Forum on Internet of Things (WF-IoT) (IEEE), 606–611.
Han, Q., Liu, K., Zeng, L., He, G., Ye, L., and Li, F. (2020). A bus arrival time prediction method based on position calibration and lstm. IEEE Access 8, 42372–42383. doi:10.1109/access.2020.2976574
Jalaney, J., and Ganesh, R. (2020). Highly accurate bus arrival time prediction using k-nearest neighbor prediction in the internet of things (iot) environment. J. Green Eng. 10, 4752–4762.
Kostakos, V., Camacho, T., and Mantero, C. (2013). Towards proximity-based passenger sensing on public transport buses. Personal. Ubiquitous Comput. 17, 1807–1816. doi:10.1007/s00779-013-0652-4
Kumbhar, M., Survase, M., Mastud, P., Salunke, A., and Sirdeshpande, S. (2016). Real time web based bus tracking system. Int. Res. J. Eng. Technol. 3, 632–635.
Lim, W. L. H., Lum, J. T. W., Yeo, I. J. W., and Keoh, S. L. (2016). “A crowd-assisted real-time public transport information service: No more endless wait,” in 2016 IEEE International Conference on Pervasive Computing and Communication Workshops, PerCom Workshops 2016, March 14-18, 2016 (Sydney, Australia: IEEE Computer Society), 1–6. doi:10.1109/PERCOMW.2016.7457088
Lin, Y., Yang, X., Zou, N., and Jia, L. (2013). Real-time bus arrival time prediction: case study for jinan, China. J. Transp. Eng. 139, 1133–1140. doi:10.1061/(asce)te.1943-5436.0000589
Lo, N.-W., and Yohan, A. (2020). Ble-based authentication protocol for micropayment using wearable device. Wirel. Personal. Commun. 112, 2351–2372. doi:10.1007/s11277-020-07153-0
Lohokare, J., Dani, R., Sontakke, S., and Adhao, R. (2017). “Scalable tracking system for public buses using iot technologies,” in 2017 International Conference on Emerging Trends Innovation in ICT (ICEI), 104–109. doi:10.1109/ETIICT.2017.7977019
Maddikunta, P. K. R., Hakak, S., Alazab, M., Bhattacharya, S., Gadekallu, T. R., Khan, W. Z., et al. (2021). Unmanned aerial vehicles in smart agriculture: applications, requirements, and challenges. IEEE Sensors J. 21, 17608–17619. doi:10.1109/jsen.2021.3049471
Ng, P. C., Spachos, P., and Plataniotis, K. N. (2021). Covid-19 and your smartphone: ble-based smart contact tracing. IEEE Syst. J. 15, 5367–5378. doi:10.1109/JSYST.2021.3055675
Park, S., and Choi, Y. (2021). Analysis and diagnosis of truck transport routes in underground mines using transport time data collected through bluetooth beacons and tablet computers. Appl. Sci. 11, 4525. doi:10.3390/app11104525
Phon-Amnuaisuk, S., Tan, S.-J., Khor, K.-C., Tham, M.-L., Chong, Y.-W., Omar, S., et al. (2023). “Non-gps-based eta models constructed from historical gps data and traffic contexts,” in 8th International Conference on Business and Industrial Research (ICBIR), 603–608. doi:10.1109/ICBIR57571.2023.10147536
Prinsloo, J., and Malekian, R. (2016). Accurate vehicle location system using rfid, an internet of things approach. Sensors 16, 825. doi:10.3390/s16060825
Qureshi, K. N., and Abdullah, A. H. (2013). A survey on intelligent transportation systems. Middle-East J. Sci. Res. 15, 629–642.
Song, H.-L. (1994). Automatic vehicle location in cellular communications systems. IEEE Trans. Veh. Technol. 43, 902–908. doi:10.1109/25.330153
Sridevi, K., Jeevitha, A., Kavitha, K., Sathya, K., and Narmadha, K. (2017). Smart bus tracking and management system using iot. Asian J. Appl. Sci. Technol. (AJAST) 1.
Sujatha, K., Rao, P. N., Sruthi, K., and Rao, A. A. (2014). “Design and development of android mobile based bus tracking system,” in 2014 First International Conference on Networks and Soft Computing (ICNSC2014) (IEEE), 231–235.
Tang, G., Westover, K., and Jiang, S. (2021). Contact tracing in healthcare settings during the covid-19 pandemic using bluetooth low energy and artificial intelligence—a viewpoint. Front. Artif. Intell. 4, 666599. doi:10.3389/frai.2021.666599
Taparia, A., and Brady, M. (2021). “Bus journey and arrival time prediction based on archived avl/gps data using machine learning,” in 2021 7th International Conference on Models and Technologies for Intelligent Transportation Systems (MT-ITS) (IEEE), 1–6.
Tartarisco, G., Cicceri, G., Bruschetta, R., Tonacci, A., Campisi, S., Vitabile, S., et al. (2024). An intelligent medical cyber–physical system to support heart valve disease screening and diagnosis. Expert Syst. Appl. 238, 121772. doi:10.1016/j.eswa.2023.121772
Trivedi, A., and Vasisht, D. (2020). Digital contact tracing: technologies, shortcomings, and the path forward. SIGCOMM Comput. Commun. Rev. 50, 75–81. doi:10.1145/3431832.3431841
Vinod, D., and Mohan, A. (2018). “A successful approach to bus tracking using rfid and low power wireless networks,” in TENCON 2018-2018 IEEE Region 10 Conference (IEEE), 1642–1646.
Keywords: bluetooth low energy (BLE), data analytic, estimated time of arrival (ETA), fleet tracking, internet of things (IoT), public bus transport, smart transportation
Citation: Elijah O, Keoh SL, bin Abdul Rahim SK, Seow CK, Cao Q, bin Sarijari MA, Ibrahim NF and Basuki A (2023) Transforming urban mobility with internet of things: public bus fleet tracking using proximity-based bluetooth beacons. Front. Internet. Things 2:1255995. doi: 10.3389/friot.2023.1255995
Received: 10 July 2023; Accepted: 20 November 2023;
Published: 11 December 2023.
Edited by:
Abhik Banerjee, Swinburne University of Technology, AustraliaReviewed by:
Elmer Magsino, De La Salle University, PhilippinesCopyright © 2023 Elijah, Keoh, bin Abdul Rahim, Seow, Cao, bin Sarijari, Ibrahim and Basuki. This is an open-access article distributed under the terms of the Creative Commons Attribution License (CC BY). The use, distribution or reproduction in other forums is permitted, provided the original author(s) and the copyright owner(s) are credited and that the original publication in this journal is cited, in accordance with accepted academic practice. No use, distribution or reproduction is permitted which does not comply with these terms.
*Correspondence: Olakunle Elijah, ZWxpam9sYWtAZ21haWwuY29t; Sye Loong Keoh, U3llbG9vbmcua2VvaEBnbGFzZ293LmFjLnVr
Disclaimer: All claims expressed in this article are solely those of the authors and do not necessarily represent those of their affiliated organizations, or those of the publisher, the editors and the reviewers. Any product that may be evaluated in this article or claim that may be made by its manufacturer is not guaranteed or endorsed by the publisher.
Research integrity at Frontiers
Learn more about the work of our research integrity team to safeguard the quality of each article we publish.