
94% of researchers rate our articles as excellent or good
Learn more about the work of our research integrity team to safeguard the quality of each article we publish.
Find out more
CORRECTION article
Front. Rehabil. Sci., 22 June 2023
Sec. Disability, Rehabilitation, and Inclusion
Volume 4 - 2023 | https://doi.org/10.3389/fresc.2023.1219395
This article is part of the Research TopicHow Best To Deliver Disability Care in a Cost-Effective Way: Improving Health Care Delivery and Health Outcomes for People with DisabilityView all 8 articles
 Yuko Shibata1*†
 John Noel Victorino1,†
 Tomoya Natsuyama2,†
 Naomichi Okamoto2,†
 Reiji Yoshimura2,†
 Tomohiro Shibata1,†
A Corrigendum on
Estimation of subjective quality of life in schizophrenic patients using speech features
By Shibata Y, Victorino JN, Natsuyama T, Okamoto N, Yoshimura R and Shibata T. (2023) Estimation of subjective quality of life in schizophrenic patients using speech features. Front. Rehabil. Sci. 4:1121034. doi: 10.3389/fresc.2023.1121034
In the published article, there was an error in Table 9. The Mean values were listed as 9.940, 6.433, and 11.008 from the top, but the correct values are 9.607, 4.767, and 9.508. The standard deviation values were listed as 6.584, 7.054, and 8.575 from the top, but the correct values are 6.226, 3.990, and 5.734. The Variance values were listed from the top as 36.122, 41.470, 61.277, but the correct values are 38.757, 15.924, 32.883. In Range, “Motivation and Energy” is listed as “0.140–19.060”, but the correct range is “0.140–9.060”. In Range, “Symptoms and Side-effects” is listed as “2.770–26.050”, but the correct value is “2.770–17.050”. The correct Table 9 appears below.
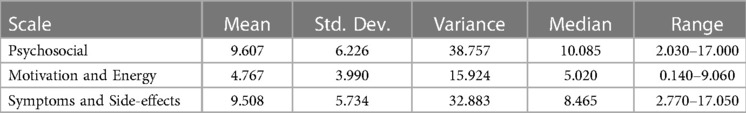
Table 9. RMSE and MAE scores for each scale on longitudinal measurements.
In the published article, there was an error in Table 10. The notations were listed as “Ground truth” and “Estimated value,” but the correct terms are “First measurement” and “Second measurement”. The second measurement score (right side) for Fold 2 was listed as 62.000, 64.000, 56.000, which is corrected to 60.000, 54.000, 47.000. The RMSE and MAE for Fold 2 were listed as “20.540”, but the correct value is “13.540”. The correct table appears below.
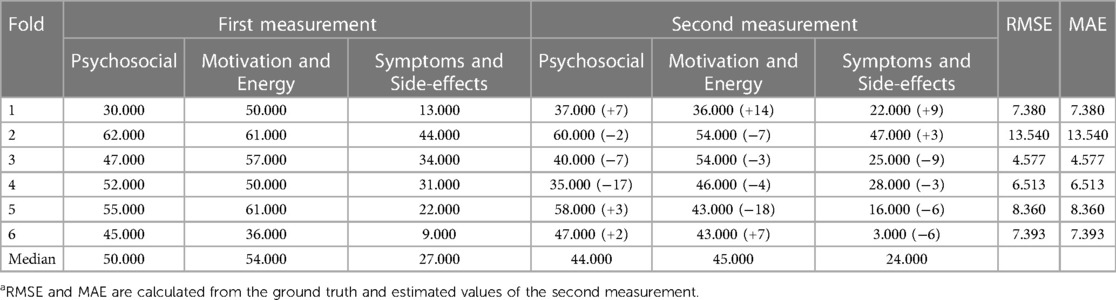
Table 10. First and second measurements (ground truth), and estimation scoresa from longitudinal measurements.
Text Correction
In the published article, there was an error.
A correction has been made to 3. Results, 3.4. Model comparison on test set for longitudinal measurement, Paragraph Number 1. This sentence previously stated:
“The RMSE and MAE for each subscale were 9.94 for the “Psychosocial” subscale, 6.433 for the “Motivation and Energy” subscale, and 11.008 for the “Symptoms and Side-effects” subscale (Table 9). The minimum and maximum values of RMSE and MAE for the “Symptoms and Side-effects” subscale were 2.770 and 26.050, respectively, which were larger than the other scales.”
The corrected sentence appears below:
“The RMSE and MAE for each subscale were 9.607 for the “Psychosocial” subscale, 4.767 for the “Motivation and Energy” subscale, and 9.508 for the “Symptoms and Side-effects” subscale (Table 9). The minimum and maximum values of RMSE and MAE for the “Psychosocial” subscale were 2.030 and 17.000, respectively, which were larger than the other scales.”
A correction has been made to 3. Results, 3.4. Model comparison on test set for longitudinal measurement, Paragraph Number 2. This sentence previously stated:
“Fold 3 had the lowest RMSE and MAE at 4.557 and fold 2 had the highest at 20.540.”
The corrected sentence appears below:
“Fold 3 had the lowest RMSE and MAE at 4.557 and fold 2 had the highest at 13.540.”
A correction has been made to 4. Discussion, 4.2. Estimation of scale scores by longitudinal measurement, Paragraph Number 1. This sentence previously stated:
“However, the RMSE and MAE for the model with longitudinal measures were less than 10 for “Psychosocial” at 9.940 and “Motivation and Energy” at 6.4334.”
The corrected sentence appears below:
“However, the RMSE and MAE for the model with longitudinal measures were less than 10 for “Psychosocial” at 9.607, “Motivation and Energy” at 4.767, and "Symptoms and Side-effects” at 9.508.”
The authors apologize for these errors and state that this does not change the scientific conclusions of the article in any way. The original article has been updated.
Keywords: quality of life, schizophrenia, speech analysis, machine learning, model development
Citation: Shibata Y, Victorino JN, Natsuyama T, Okamoto N, Yoshimura R and Shibata T (2023) Corrigendum: Estimation of subjective quality of life in schizophrenic patients using speech features. Front. Rehabil. Sci. 4:1219395. doi: 10.3389/fresc.2023.1219395
Received: 9 May 2023; Accepted: 22 May 2023;
Published: 22 June 2023.
Edited and Reviewed by: Corneliu Bolbocean, University of Oxford, United Kingdom
© 2023 Shibata, Victorino, Natsuyama, Okamoto, Yoshimura and Shibata. This is an open-access article distributed under the terms of the Creative Commons Attribution License (CC BY). The use, distribution or reproduction in other forums is permitted, provided the original author(s) and the copyright owner(s) are credited and that the original publication in this journal is cited, in accordance with accepted academic practice. No use, distribution or reproduction is permitted which does not comply with these terms.
*Correspondence: Yuko Shibata U2hpYmF0YS55dWtvOTc1QGdtYWlsLmNvbQ==
†These authors have contributed equally to this work and share first authorship
Disclaimer: All claims expressed in this article are solely those of the authors and do not necessarily represent those of their affiliated organizations, or those of the publisher, the editors and the reviewers. Any product that may be evaluated in this article or claim that may be made by its manufacturer is not guaranteed or endorsed by the publisher.
Research integrity at Frontiers
Learn more about the work of our research integrity team to safeguard the quality of each article we publish.