 Erica H. Gavel
 Melissa A. Lacroix
 Vicky L. Goosey-Tolfrey
 Heather M. Logan-Sprenger
94% of researchers rate our articles as excellent or good
Learn more about the work of our research integrity team to safeguard the quality of each article we publish.
Find out more
ORIGINAL RESEARCH article
Front. Rehabil. Sci., 29 April 2022
Sec. Disability, Rehabilitation, and Inclusion
Volume 3 - 2022 | https://doi.org/10.3389/fresc.2022.856904
This article is part of the Research TopicAdapted Sports: Wheeled-mobility, Exercise and HealthView all 16 articles
Objective: To determine the thermoregulatory responses and mobility performance of wheelchair rugby (WCR) players during international competition.
Methods: Eleven male National Team WCR players volunteered for the study. Testing occurred during a four game series against international competition (temp 24.7 ± 0.7°C, relative humidity 50.1 ± 3.6%), with movement time (MT) and gastrointestinal temperature (Tgi) recorded continuously.
Results: The mean maximal Tgi was 38.6 ± 0.6°C (37.9–39.7) and did not significantly differ among Low-Class, Mid-Class, and High-Class athletes (p > 0.05). Moreover, there was a strong and significant relationship between minutes (min) played per quarter of the game and change in Tgi (r = 0.36, p = 0.01). Athletes moved a total of 27:43 ± 9:40 min:seconds (s), spent a total of 15:02 ± 8.23 min:s in Zone 1 (53.5%), 8:19 ± 3:20 min:s in Zone 2 (31.7%), and 5:59 ± 1:51 min:s in Zone 3 (21.3%). There were no differences among classification in total movement time (p = 0.169) or for speed in Zone 1, Zone 2, or Zone 3 (p > 0.05). The relationship between peak forward speed and total movement time was strong (p = 0.021, r = 0.68).
Conclusion: This study demonstrated that the time spent in absolute movement zones is not classification dependent, the change in core temperature is related to movement time per quarter. Furthermore, peak speeds obtained on-court were linked to overall movement time which suggests athletes should warm-up before going on court.
Wheelchair rugby (WCR) is an intermittent contact sport (1) which spends most time at low speeds (<50% of mean peak speed) (2, 3). In WCR, there are a total of seven classifications ranging from, 0.5 to 3.5 in order of greatest impairment to least impaired (i.e., 0.5, cervical spinal cord injury (cSCI); 3.5, quad-amputee). During an official World Wheelchair Rugby (4) game which consists of four 8-min quarters with stopped time, the total number of points on court permitted at any time is 8.0 (n = 4 players) (4). With that, the demands of the game and activity profiles can be dependent upon classification (5, 6), e.g., Rhodes et al. (2), clearly showed that WWR Class 0.5 athletes significantly traveled less and had lower peak speeds relative to Class 3–3.5, 881 ± 137 m vs. 1153 ± 172 m and 3.0 vs. 3.8 m/s, respectively.
While WCR is competed indoors in a temperature-controlled gymnasium (18–20°C), it has been demonstrated in athletes with a cSCI (7, 8) and without a SCI, that exercising in thermoneutral environments may induce severe heat strain (9–11). For example, work by Griggs et al. (9) reported that WCR athletes with a cSCI reached a core temperature of 39.3 ± 0.5°C, whereas athletes without a SCI reached 38.8 ± 0.3°C. Moreover, in other wheelchair sports Logan-Sprenger and McNaughton (10), noted two athletes from the Canadian Senior Women's National wheelchair basketball team without a SCI were attaining (>39.3°C) which were sustained for 10–25 mins over multiple games. As such, while level of injury can influence ones' ability to regulate body temperature, people should also be mindful that athletes without SCI's may also experience heat strain.
During exercise, metabolic energy is converted to one of two forms, mechanical energy to perform external work (20–30%), or thermal energy to produce heat (70–80%) (12). That said, if heat production exceeds heat dissipation, one will experience increases in core body temperature and decrements in physiological performance (13, 14). For example, Forsyth et al. (15) found that when the metabolic heat production was similar among athletes with cSCI, paraplegia, and non-SCI, those with cSCI displayed the greatest compromised sweat response. Moreover, similar outcomes were observed in work by Griggs et al. (9) where the level of injury was correlated with changes in core temperature and heat storage.
Although sport practitioners and coaches should be mindful that the level of SCI can be correlated to heat storage and increases in core temperature, one should also consider the influence overall playing time has on heat storage and potential detriments in performance. For example, although the work by Griggs et al. (16) demonstrated that athletes with a cSCI reported higher core temperatures than non-SCI athletes, this work was conducted in a practice setting where the athletes played the entire simulated game. Extending this work but within wheelchair basketball, Logan-Sprenger and McNaughton (10) gathered data during international competitive game play to which, the will-to-win was high, providing high ecological validity. As such, the intensity of play along with coach substitutions influencing playing time may be an important difference between a simulated game and a vital game for international ranking. As of late, no study has characterized mobility performance and examined the influence these demands may have on core body temperature, thermoperception, and peak speed during international WCR competition. Thus, the purpose of this study was to (1) characterize mobility performance, (2) describe the thermoregulatory responses, and (3) evaluate the physiological and thermoperception of international level WCR players during a World Wheelchair Rugby event against an international Top 10 ranking competitor.
Eleven (n = 11; cSCI = 10, quad amputee = 1) elite WCR players volunteered to participate in the study (see Table 1). The research team tested 3–4 athletes per game with each athlete being monitored once. As such, data collection occurred over four separate games to ensure all 11 athletes were tested. All participants were male and members of the Canadian National WCR Team. Typically, the team had three athletes with a cSCI, and one quad amputee on the floor at the same time. Each player had played at the international level for 10.5 ± 6.5 yrs and trained an average of 10–15 h per week. Participants were informed of the experimental protocol before written informed consent was obtained. All procedures were approved by the Ontario Tech University Ethics Committee (file #16414) and conformed to the principles defined in the Declaration of Helsinki.
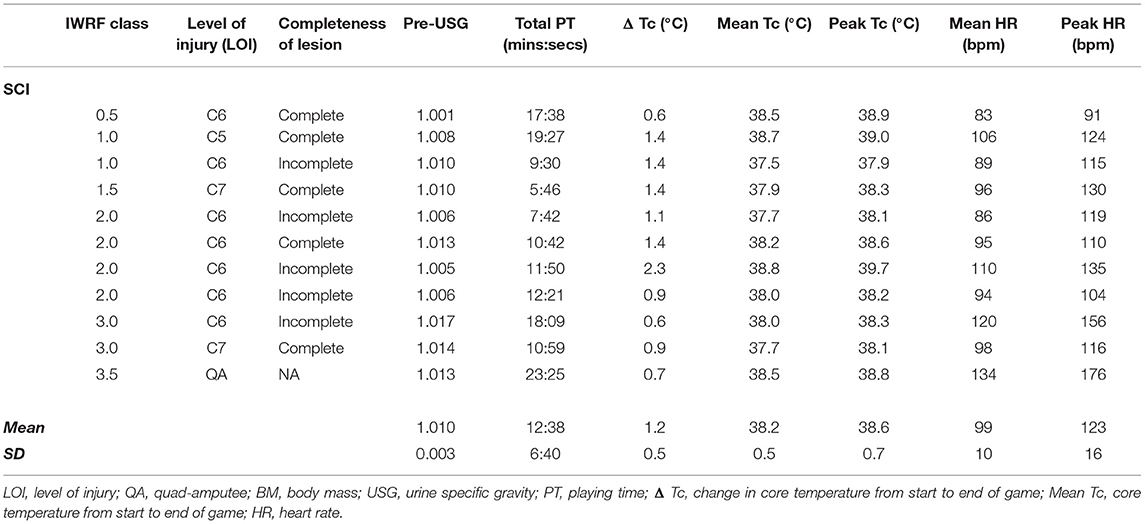
Table 1. Descriptive characteristics of the male participants (mean ± SD).
This was an observational study assessing wheelchair mobility performance, gastrointestinal temperature (Tgi), heart rate (HR), ratings of perceived exertion (RPE, Borg 6–20), thermal sensation (TS), and thermal comfort (TC) during a four game series against international competition at the 2019 Japan World Wheelchair Rugby Challenge.
Upon waking on game day athletes were asked to provide a mid-stream urine sample for measurement of urine specific gravity (USG) (17) using a handheld refractometer (Atago–PEN-PRO, Geneq, Montreal QC) (17). Additionally, athletes were instructed to swallow an ingestible thermistor (e-Celcius; Bodycap; Herouville Saint-Clair, France) a minimum of 6 h before the game to measure gastrointestinal temperature (18, 19).
Athletes arrived at the gymnasium at their usual pregame time (~2 h prior to the game); 1 game took place at 12:00 (noon) while the other 3 games started at 18:00. The athlete's water bottle(s) was labeled with the athletes' name and weighed prior to and upon completion of the game to determine total fluid intake throughout the game. Three athletes had a slushie drink following warm-up and before the start of the game and used a water spray during the match (Low-Class, n = 1; Mid-Class, n =2 ). Tgi was continuously measured and recorded throughout the game from the start of warm-up until the end of the game and downloaded intermittently. HR was collected throughout using a downloadable Polar® OH1 heart sensor (Polar, CAN). Each athlete's chair was equipped with an inertial measurement unit (IMU) (Shimmer, Cambridge MA) positioned on the axels and center of chair frame (20) to measure peak speed, real-time speed, and time spent in different speed zones which was recorded throughout the game. Speed zones were categorized as: Zone 1 = 0–1 m/s, Zone 2 = 1–2 m/s, Zone 3 = > 2 m/s. Moreover, playing time and movement time were also recorded. Playing time was characterized as time defined by the “game clock” without the inclusion of stoppages, whereas movement time was the total time the athlete was on-court. For classification and positional analysis, athletes were grouped as Low-Class to (0.5–1.5), Mid-Class (2.0–2.5), and High-Class (3.0–3.5) (4). RPE (21), TS (22), and TC (22) were collected upon substitution or at the completion of each quarter.
All data was tested for normality of distribution and displayed as the mean and standard deviation. Differences between quarters were analyzed using a one-way ANOVA, and time verses group was tested using a mixed-ANOVA, to detect singular differences, a Tukey's honestly significant difference (HSD) post-hoc was performed. A Student's paired t-test was used to compare singular parameter differences where appropriate. Categorical data was tested using the Krusal-Wallis test, to detect singular differences a Dunn's post-hoc test was performed. A Wilcoxon Signed Ranks Test was detected to test differences in singular categorical data. Statistical significance was accepted at p < 0.05. Correlations between variables were assessed using a Pearson's correlation analysis. Exact p-values, Cohen's D, and 95% confidence intervals are presented to show magnitude of effect. The magnitude of effect was classed as trivial (<0.2), small (0.2-0) moderate (0.6–1.2), large (1.2–2.0), and very large (≥2.0) (23).
The gymnasium temperature (°C) and relative humidity (RH) (%) was similar between games and remained stable within games (pre 24.6 ± 0.8°C, RH 51.4 ± 2.4%; post, 24.4 ± 0.1°C, RH 50.4 ± 3.0%, p>0.05).
All athletes were hydrated on game day (Table 1) with a mean USG of 1.010 ± 0.004 (1.005–1.015). On average, athletes consumed 1073 ± 840 milliliters (ml) (112–1,669 ml) of fluid per game.
There was large variability in playing time among athletes (2:58–23:25 min:s). On average, athletes played a total of 14:04 ± 5:49 min:s (Table 1). There were no differences in playing time among Low-Class, Mid-Class, and High-Class players (p = 0.169), and three athletes played >50% (>16 min) of the game (Low-Class: 19:27; High-Class: 18:09 min:s; High-Class: 23:25 min:s).
Excluding warm-up, athletes moved a total of 27:43 ± 9:40 min:s (12:10–43:10) over the course of the game (Table 2). On average, athletes spent a total of 15:02 ± 8.23 min:s in Zone 1 (53.5%), 8:19 ± 3:20 min:s in Zone 2 (31.7%), and 5:59 ± 1:51 min:s in Zone 3 (21.3%) (Figure 1). Movement time among Low-Class, Mid-Class, and High-Class did not significantly differ (p = 0.169) with athletes playing a mean of 31:27 ± 9:27, 25:48 ± 10:22, 25:18 ± 11:27 min:s, respectively.
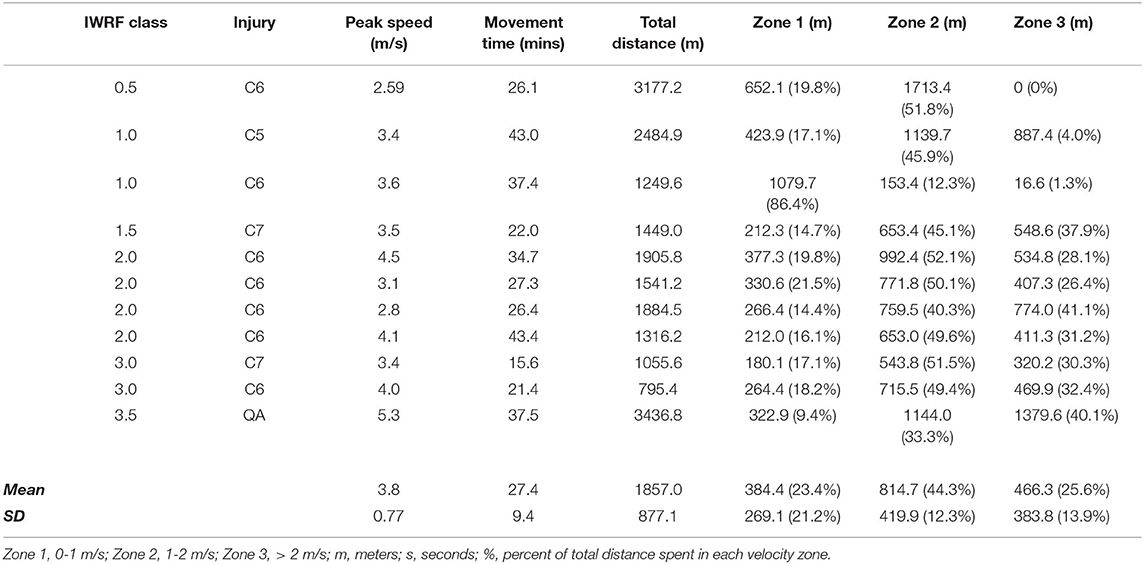
Table 2. WC kinematics throughout the WC game.

Figure 1. Mean movement time [seconds (sec)] spent in each velocity zone (zone 1–3) throughout a wheelchair rugby game. (*) denotes significance between Zone 1 and Zone 2, whereas (**) denotes significance between Zone 1 and Zone 3.
There was no difference among classification in total movement time (p = 0.169) or for Zone 1 (p = 0.601), Zone 2 (p = 0.173), or Zone 3 (p = 0.222) (Figure 2). On average, time spent in Zone 1 was significantly greater than Zone 2 (p = 0.0154, 95% CI 74.4 to 757.4, ES = 1.09) and Zone 3 (p = 0.0002, 95% CI 298.7 to 981.4, ES = 1.53), whereas Zone 2 and Zone 3 did not significantly differ (p = 0.253, 95% CI −117.2 to 565.9, ES = 0.87).

Figure 2. Mean time spent in different velocity zones (Zones 1–3) during a wheelchair rugby game and movement time for Class 1 (n = 4), 2 (n = 4), and 3 (n = 3). p > 0.05.
There was a significant difference in cumulative distance between Zone 1 and Zone 2 (Zone 1, 384.4 ± 269.1 vs. Zone 2, 814.7 ± 419.9 m, p = 0.025, 95% CI −812.2 to −48.3, ES =1.22), while Zone 1 vs. Zone 3 (Zone 1, 384.4 ± 269.1 vs. Zone 3, 466.3 ± 383.8 m, p = 0.858, 95% CI −463.8 to 300.1, ES = 0.25) and Zone 2 vs. Zone 3 did not differ (Zone 2, 814.7 ± 419.9 vs. Zone 3, 466.3 ± 383.8 m, p = 0.079, 95% CI −33.55 to 730.44, ES = 0.87) (Table 2).
Peak speed in the game did not significantly differ between classification (Low-Class, 3.24 ± 0.45 m/s; Mid-Class, 4.44 ± 1.14 m/s; High-Class, 4.22 ± 0.94 m/s; p = 0.373). The mean peak forward speed throughout games was 3.58 ± 0.9 m/s. There were no significant differences in peak speed between quarter 1, quarter 2, quarter 3, and quarter 4 (p = 0.338). Furthermore, there were no significant differences in time spent in Zone 1, Zone 2, and Zone 3 between quarters (p > 0.05).
Mean Tgi was significantly greater from the start (following warm-up) to end of game (start, 37.9 ± 0.3°C vs. finish, 38.6 ± 0.7°C, p = 0.009). Mean Tgi significantly differed between quarter 1, quarter 2, quarter 3, and quarter 4 (p < 0.05). The mean rise of Tgi was 1.2 ± 0.5°C, and there was no significant rise in Tgi between quarter 1, quarter 2, quarter 3, and quarter 4 (p = 0.766). The mean maximal Tgi was 38.6 ± 0.6°C (37.9–39.7). Tgi did not significantly differ among Low-Class, Mid-Class, and High-Class athletes throughout the game (p > 0.05, Figure 3). Furthermore, there were no significant differences between athletes with complete and incomplete SCIs (p > 0.05). Two of the 11 athletes (Low-Class; Mid-Class reached a Tgi of >39°C and at the start of quarter 4 sustained it for 14:02 ± 1:06 min:s (13:15; 14:48) with a mean movement time of 30:10 ± 4:08 min:s (27:15; 33:05) and playing time of 14:00 ± 2:59 min:s. (19:27; 11:50).

Figure 3. Mean gastrointestinal temperature among Low-Class, Mid-Class, and High-Class athletes across a WCR game.
The median TS for the game was 6 (1). TS did not significantly differ from the start to end of game [start, 6 (2) vs. end, 5 (2), p = 0.930]. The median TS did not significantly differ between quarters (p = 0.210) or between classifications (p = 0.178). As well, median TC was 2 (1). TC did not significantly differ from start to end of game [start, 2 (2) vs. end, 3 (2), p = 0.586]. TC did not significantly differ between quarters (p = 0.750) or among classification (p = 0.359). The median RPE was 15 (2). RPE significantly increased from the start to end of game [start, 13.0 (8) vs. end, 15.0 (2.5), p = 0.023]. The median RPE did not significantly differ between quarters (p = 0.875) or between classification (p = 0.951).
There was a significant relationship between total movement time and time spent in Zone 1 (p = 0.002, r = 0.85); however, the relationship between total movement time and Zone 2 (p = 0.315, r = 0.35), and Zone 3 (p = 0.51, r = 0.24) was not strong. Moreover, the relationship between peak forward speed and total movement time per quarter was strong (p = 0.021, r = 0.68, Figure 4A).

Figure 4. (A) correlation between peak speed (m/sec) and movement time, (B) correlation of mean (Δ) of gastrointestinal temperature and cumulative movement time (sec), (C) correlation of mean change (Δ) of gastrointestinal temperature (°C) and playing time per Q (mins), and (D) correlation of gastrointestinal temperature (°C) and RPE (6–20).
There was not a significant relationship between total playing time and change in Tgi (p = 0.641, r = 0.41), change in Tgi and time spent in Zone 1 (p = 0.236, r = 0.19), Zone 2 (p = 0.112, r = 0.26), and Zone 3 (p = 0.134, r = 0.24), and peak Tgi and total movement time (p = 0.245, r = 0.438, Figure 4B). However, there was a strong relationship between movement time and change in Tgi per quarter (p = 0.014, r = 0.39, Figure 4C). There was a strong relationship between Tgi and RPE (p = 0.026, r = 0.77, Figure 4D) while the relationship between Tgi and TC (p = 0.341, r = −0.15) and TS (p = 0.61, r = −0.08) was not significant.
This is the first study in WCR to demonstrate that differences in core temperature may not be related to classification or physiological function, but with movement time per quarter. Furthermore, the results of this study also exhibited, (1) the mean movement time was 28.3 ± 8.5 min and did not significantly differ among classification, (2) athletes spent most of their time at low speeds (Zone 1= 0–1 m/s) during the game, (3) there was a positive relationship between movement time and peak speed (r = 0.68, p = 0.021), (4) there were no significant differences among core body temperature and classification, and (5) TS and TC did not change over the course of the game.
The present study supported previous findings suggesting that athletes spend most time in low intensity zones; 53.5% in Zone 1, 31.7% in Zone 2, and 21.3% in Zone 3 (1, 11, 12). That said, contrary to Rhodes et al. (1), we did not display any significant differences between classification groups, which may be due to a smaller sample size and competitor discrepancies (24) (i.e., Zonal Championships vs. World Wheelchair Rugby Challenge). Across the game, we found no differences in mean peak speed between quarters which was also noted by Rhodes et al. (1). Interestingly, there was a strong correlation between movement time and peak speed, which warrants further investigation suggesting that warming-up courtside prior to being substituted into the game should be encouraged allowing athletes to achieve high wheelchair speeds when they are not the starting players. This is a topic of recent study (24) and needs to be considered alongside individual thermoregulatory responses.
Notably, the present study demonstrated a positive relationship between playing time per quarter and change in core temperature with no differences in core temperature between classification, which aligns with wheelchair basketball work done by Logan-Sprenger and McNaughton (10). In the study, the researchers demonstrated no core temperature difference between classification, instead they observed that the change in core temperature was dependant on minutes played, which is like the present study showcasing that the change in core temperature was dependent on minutes moved per quarter. Although, it is well established that sudomotor activity plays a pertinent role in thermoregulation (25), both the present study and the one by Logan-Sprenger and McNaughton (10) demonstrate that in team sports such as WC basketball and rugby, the increase in core temperature may be more dependent on playing time rather than muscular function and the inability to dissipate heat; however, more research is needed to better understand the relationship (26).
While the present study saw ~1.2°C change of core temperature over the course of the game, there were no differences among classification and only two athletes who reached >39°C and sustained it for ~14 min. This data, however, contrasts with work published by Griggs et al. (9) who demonstrated significant differences between classification. In the study by Griggs et al. (9), the authors reported that lower class players displayed an increase of 1.6°C and upper-class players showed an increase of 0.7°C. In contrast to our methodology, Griggs et al. (9) collected data during an intra-squad game where the athletes played the entire game under simulated game conditions. Given that the current study was against an international competitor at a World Wheelchair Rugby event, there was high variability in playing time (CV = 36%) as the team was playing to win. As such, it is hard to compare Tgi responses between studies given that playing time and competition level differed (27).
The current study demonstrated no correlation between core temperature and thermal sensation or comfort. Furthermore, there were no differences in thermal sensation or comfort from the start to end of the game, between quarters, or among classification groups, which is in line with work by Webborn et al. (28) and Griggs et al. (25). In the study by Webborn et al. (28), participants completed an intermittent sprint protocol with pre-cooling, per-cooling, and no cooling. In the study, there was no significant relationship between core temperature changes and thermal sensation. Furthermore, similar results were exhibited by Griggs et al. (25) who analyzed the influence relative humidity had on heat storage for athletes with a SCI. In the study, there was no significant relationship between increases in core temperature and changes in thermal perception.
Thermo-physiological models have been developed to assess the influence of environmental conditions on the human body (29, 30); however, no model has been validated with the inclusion of exercise in athletes with a SCI or an impairment. For example, work by Flouris and Cheung (31) has demonstrated that thermoperception can vary for the same stimulus of skin and core body temperature during exercise in a hot environment. Furthermore, research by Nicotra and Ellaway (32) suggests that the level and completeness of the SCI can influence heat and cold thresholds for a similar stimulus, whereas work by Griggs et al. (25) reported no difference between paraplegic and tetraplegic in similar environmental conditions. Moreover, work by Webborn et al. (28) demonstrated that thermal sensation did not correlate to changes in core temperature or total time exercising.
Although all athletes but one had a SCI, it's worth highlighting that we selected to include a player with quadruple amputation in the data analyses. Close inspection of our findings indicates that removal of the amputee would not impact the results too much as the athletes were grouped on a positional basis verses physiological function. Furthermore, their thermoregulatory responses were within 1 SD of the group responses. Secondly, given that the data was collected over a series of four separate games, one could suggest that certain games could be lower intensity than others. However, we observed no difference in RPE from one game to the next.
To our knowledge, no study has evaluated the relationship between activity profiles, thermoregulatory responses, and thermo-perception during international WCR match play. First off, this study demonstrated that the time spent in absolute movement zones is not classification dependent, the change in core temperature is related to movement time per quarter. Secondly, peak speeds obtained on-court were linked to overall movement time which suggests a mid-event warm-up could be beneficial. Finally, like previous work, thermo-perception models should be taken with caution when working with athletes with a SCI.
The original contributions presented in the study are included in the article/supplementary materials, further inquiries can be directed to the corresponding author.
The studies involving human participants were reviewed and approved by Ontario Tech University Research Ethics Board. The patients/participants provided their written informed consent to participate in this study.
All authors provided substantial contributions to the conception, study design, and the drafting of the work, or revising it critically. Final approval of the version submitted/published and consent for publication has been agreed by all authors.
EG was supported in this original investigation by funding from Mitacs and Own the Podium.
The authors declare that the research was conducted in the absence of any commercial or financial relationships that could be construed as a potential conflict of interest.
All claims expressed in this article are solely those of the authors and do not necessarily represent those of their affiliated organizations, or those of the publisher, the editors and the reviewers. Any product that may be evaluated in this article, or claim that may be made by its manufacturer, is not guaranteed or endorsed by the publisher.
The authors would like to thank the participants for their time and effort and acknowledge the Integrated Support Team and Coaches from Wheelchair Rugby Canada, and Drs. Marc Klimstra, Ming-Chang Tsai, Robert Rupf, and Matt Jensen for their assistance with data collection and the processing of IMU data.
1. Sporner ML, Grindle GG, Kelleher A, Teodorski EE, Cooper R, Cooper RA, et al. Quantification of activity during wheelchair basketball and rugby at the national veterans wheelchair games: a pilot study. Prosthet Orthot Int. (2009) 33:210–7. doi: 10.1080/03093640903051816
2. Rhodes JM, Mason BS, Perrat B, Smith MJ, Malone LA, Goosey-Tolfrey VL, et al. Activity profiles of elite wheelchair rugby players during competition. Int J Sports Physiol Perform. (2015) 10:318–24. doi: 10.1123/ijspp.2014-0203
3. Barry SM, James MR, Victoria LG-T. Validity and reliability of an inertial sensor for wheelchair court sports performance. J Appl Biomech. (2014) 30:326–31. doi: 10.1123/jab.2013-0148
5. Tachibana K, Mutsuzaki H, Shimizu Y, Doi T, Hotta K, Wadano Y. Influence of functional classification on skill tests in elite female wheelchair basketball athletes. Medicina. (2019) 55:740. doi: 10.3390/medicina55110740
6. Vanlandewijck YC, Evaggelinou C, Daly DJ, Verellen J, Van Houtte S, Aspeslagh V, et al. The relationship between functional potential and field performance in elite female wheelchair basketball players. J Sports Sci. (2004) 22:668–75. doi: 10.1080/02640410310001655750
7. Freund PR, Brengelmann GL, Rowell LB, Halar E. Attenuated skin blood flow response to hyperthermia in paraplegic men. J Appl Physiol Respir Environ Exerc Physiol. (1984) 56:1104–9. doi: 10.1152/jappl.1984.56.4.1104
8. Griggs KE, Leicht CA, Price MJ, Goosey-Tolfrey VL. Thermoregulation during intermittent exercise in athletes with a spinal-cord injury. Int J Sports Physiol Perform. (2015) 10:469–75. doi: 10.1123/ijspp.2014-0361
9. Griggs KE, Havenith G, Price MJ, Mason BS, Goosey-Tolfrey VL. Thermoregulatory responses during competitive wheelchair rugby match play. Int J Sports Med. (2017) 38:177–83. doi: 10.1055/s-0042-121263
10. Logan-Sprenger HM, Mc Naughton LR. Characterizing thermoregulatory demands of female wheelchair basketball players during competition. Res Sports Med. 2019:1–12. doi: 10.1080/15438627.2019.1627546
11. Attia M, Engel P. Thermoregulatory set point in patients with spinal cord injuries (spinal man). Paraplegia. (1983) 21:233–48. doi: 10.1038/sc.1983.37
12. Ament W, Verkerke GJ. Exercise and fatigue. Sports Med. (2009) 39:389–422. doi: 10.2165/00007256-200939050-00005
13. Nybo L. Exercise and heat stress: cerebral challenges and consequences. Prog Brain Res. (2007) 162:29–43. doi: 10.1016/S0079-6123(06)62003-7
14. Price MJ, Campbell IG. Effects of spinal cord lesion level upon thermoregulation during exercise in the heat. Med Sci Sports Exerc. (2003) 35:1100–7. doi: 10.1249/01.MSS.0000074655.76321.D7
15. Forsyth P, Miller J, Pumpa K, Thompson KG, Jay O. Independent Influence of Spinal Cord Injury Level on Thermoregulation during Exercise. Med Sci Sports Exerc. (2019) 51:1710–9. doi: 10.1249/MSS.0000000000001978
16. Griggs KE, Havenith G, Paulson TAW, J Price M, Goosey-Tolfrey VL. Effects of cooling before and during simulated match play on thermoregulatory responses of athletes with tetraplegia. J Sci Med Sport. (2017) 20:819–24. doi: 10.1016/j.jsams.2017.03.010
17. Chantraine A, Nusgens B, Lapiere CM. Biochemical analysis of heterotopic ossification in spinal cord injury patients. Paraplegia. (1995) 33:398–401. doi: 10.1038/sc.1995.89
18. Chotai SP, Mrak RE, Mutgi SA, Medhkour A. Ossification in an extra-intradural spinal meningioma-pathologic and surgical vistas. Spine J. (2013) 13:e21–6. doi: 10.1016/j.spinee.2013.06.102
19. Byrne C, Lim CL. The ingestible telemetric body core temperature sensor: a review of validity and exercise applications. Br J Sports Med. (2007) 41:126–33. doi: 10.1136/bjsm.2006.026344
20. de Witte AMH, Hoozemans MJM, Berger MAM, van der Slikke RMA, van der Woude LHV, Veeger DHEJ. Development, construct validity and test-retest reliability of a field-based wheelchair mobility performance test for wheelchair basketball. J Sports Sci. (2018) 36:23–32. doi: 10.1080/02640414.2016.1276613
21. Borg GA. Psychophysical bases of perceived exertion. Med Sci Sports Exerc. (1982) 14:377–81. doi: 10.1249/00005768-198205000-00012
22. Gagge AP, Stolwijk JAJ, Hardy JD. Comfort and thermal sensations and associated physiological responses at various ambient temperatures. Environ Res. (1967) 1:1–20. doi: 10.1016/0013-9351(67)90002-3
23. Batterham AM, Hopkins WG. Making meaningful inferences about magnitudes. Int J Sports Physiol Perform. (2006) 1:50–7. doi: 10.1123/ijspp.1.1.50
24. O'Brien TJ, Briley SJ, Mason BS, Leicht CA, Tolfrey K, Goosey-Tolfrey VL. A high-intensity warm-up increases thermal strain but does not affect repeated sprint performance in athletes with a cervical spinal cord injury. Int J Sports Physiol Perform. (2022) 17:440–9. doi: 10.1123/ijspp.2021-0073
25. Griggs KE, Havenith G, Price MJ, Goosey-Tolfrey VL. Evaporative heat loss insufficient to attain heat balance at rest in individuals with a spinal cord injury at high ambient temperature. J Appl Physiol. (2019) 127:995–1004. doi: 10.1152/japplphysiol.00893.2018
26. Cramer MN, Jay O. Explained variance in the thermoregulatory responses to exercise: the independent roles of biophysical and fitness/fatness-related factors. J Appl Physiol. (2015) 119:982–9. doi: 10.1152/japplphysiol.00281.2015
27. Taylor JB, Mellalieu SD, James N, Shearer DA. The influence of match location, quality of opposition, and match status on technical performance in professional association football. J Sports Sci. (2008) 26:885–95. doi: 10.1080/02640410701836887
28. Webborn N, Price MJ, Castle P, Goosey-Tolfrey VL. Cooling strategies improve intermittent sprint performance in the heat of athletes with tetraplegia. Br J Sports Med. (2010) 44:455–60. doi: 10.1136/bjsm.2007.043687
29. Tanabe S-I, Kobayashi K, Nakano J, Ozeki Y, Konishi M. Evaluation of thermal comfort using combined multi-node thermoregulation (65MN) and radiation models and computational fluid dynamics (CFD). Energy and Buildings. (2002) 34:637–46. doi: 10.1016/S0378-7788(02)00014-2
30. Havenith G, Fiala D. Thermal indices and thermophysiological modeling for heat stress. Compr Physiol. (2015) 6:255–302. doi: 10.1002/cphy.c140051
31. Flouris AD, Cheung SS. Human conscious response to thermal input is adjusted to changes in mean body temperature. Br J Sports Med. (2009) 43:199–203. doi: 10.1136/bjsm.2007.044552
Keywords: wheelchair rugby, thermoregulation, wheelchair mobility, Paralympic sport, performance
Citation: Gavel EH, Lacroix MA, Goosey-Tolfrey VL and Logan-Sprenger HM (2022) Characterizing the Thermal Demands and Mobility Performance During International Wheelchair Rugby Competition. Front. Rehabilit. Sci. 3:856904. doi: 10.3389/fresc.2022.856904
Received: 17 January 2022; Accepted: 06 April 2022;
Published: 29 April 2022.
Edited by:
Nachiappan Chockalingam, Staffordshire University, United KingdomReviewed by:
Paul Grimshaw, Hamad bin Khalifa University, QatarCopyright © 2022 Gavel, Lacroix, Goosey-Tolfrey and Logan-Sprenger. This is an open-access article distributed under the terms of the Creative Commons Attribution License (CC BY). The use, distribution or reproduction in other forums is permitted, provided the original author(s) and the copyright owner(s) are credited and that the original publication in this journal is cited, in accordance with accepted academic practice. No use, distribution or reproduction is permitted which does not comply with these terms.
*Correspondence: Erica H. Gavel, ZXJpY2EuZ2F2ZWxAb250YXJpb3RlY2h1LmNh
Disclaimer: All claims expressed in this article are solely those of the authors and do not necessarily represent those of their affiliated organizations, or those of the publisher, the editors and the reviewers. Any product that may be evaluated in this article or claim that may be made by its manufacturer is not guaranteed or endorsed by the publisher.
Research integrity at Frontiers
Learn more about the work of our research integrity team to safeguard the quality of each article we publish.