 Luca Feltrin
 Niklas Jaldén
 Gustav Wikström
- Ericsson Research, Stockholm, Sweden
Since the first generation of cellular networks was rolled out, the priority has been to improve the connectivity and capacity of densely populated areas, such as urban centers, whereas rural areas received less attention. The lower subscriber density of such areas makes it difficult to get a positive business case with current wireless technologies and current cost structures. Base stations are deployed more sparsely in rural areas and are typically shared by several operators and are thus not able to provide high-performance connectivity, compared to urban areas, resulting in a connectivity gap. Third Generation Partnership Project (3GPP) is currently introducing Non-Terrestrial Networks (NTN) in 5G NR scope with Release 17 for broadband services, and this development will likely continue in 6G networks. In parallel, Sparse Terrestrial Networks (STN) using high towers and large antenna arrays, are being developed to deliver very long transmission ranges. In this paper we discuss the characteristics and the expected performance of networks based on satellites or terrestrial large cell networks, in relation to the traffic density and required infrastructure, with a focus on remote and sparsely populated areas. The two solutions are found to deliver in complementary traffic and partly different use case scenarios.
Introduction
Achieving coverage for wireless services in rural areas has been a long-standing quest for cellular networks. As society becomes more depending on mobile networks the push to reach more people increases, since it is an essential enabler for digital inclusion, a key challenge in modern society. The impact of mobile voice and broadband coverage in rural and deep rural areas is two-fold–it allows local people to directly improve their lives and prospects and enterprises verticals to enable healthy businesses that indirectly help in developing societies.
For cellular networks an interesting objective then is to cover all area where people live, and enterprises operating with broadband services. In practice this can be translated into a few Mbps in UL and DL available to a high fraction of the population and/or a high fraction of the area of a region or a country. The problems with providing broadband coverage to rural and ultra-rural areas are related to the relative high cost of infrastructure per served user and often a lower expected revenue per user in these areas compared to urbanized areas. An extension of the fixed fiber or cellular network with the same site density and traffic capacity as for urban and sub-urban areas serving many high-ARPU (Average Revenue Per User) users is economically infeasible. This leads to poorly developed networks or no connectivity at all in rural areas where the urban operator-competition model breaks down to local monopolies with limited incentives to invest in telecom infrastructure (Lun et al., 2019). Consequently, rural areas and people living there are excluded from the benefits of digitalization with negative impact on the reachability of the sustainable development goals in the UN agenda 2030, (UN General Assembly, 2015), such as decent work and economic growth, reduced inequalities, quality education, no poverty, no hunger, good health and well-being, sustainable cities and communities, climate action, etc.
A more economically efficient solution is therefore needed to complement high-APRU networks available for urban and sub-urban deployment. Two main paths appear feasible to achieve such deep broadband coverage: either through a sparse grid of terrestrial base stations with long range (Sparse Terrestrial Networks, STN), or through a non-terrestrial network (NTN) of satellites with large footprints.
Several studies have been published relating to both STN and NTN networks. In Lun et al. (2019), Jaldén et al. (2020) the authors detail the techno-economic issue in providing coverage in rural areas by cellular technology and propose the use of larger site grids by (partially) reusing GSM sites and/or high TV towers in combination with massive MIMO antennas and improved terminals. It is shown that data rates in the order of 100 Mbps at the cell edge are achievable with commercially available 5G NR equipment installed in 250-meter-high towers being 65 km apart. The system capacity in those STNs is sufficient for the typical population densities in (ultra-)rural areas and interesting for low-APRU markets.
As for NTNs, the current focus of research lies on low-earth orbit (LEO) satellite systems for IoT and mobile broadband (MBB) services, (de Portillo et al., 2019; Rinaldi et al., 2020), the use of cellular features such as massive MIMO and beamforming in NTNs (Xia et al., 2019; You et al., 2020) as well as the integration of NTNs into 5G and 6G, see 3GPP (2019). Statistical modelling and simulations to determine the performance of different satellite systems, such as Starlink, OneWeb, and Telesat, or different spectral bands in terms of spectral efficiency, total system throughput, coverage areas are discussed in Vatalaro et al. (1995), Goto et al. (2018), Sedin et al. (2020). As a result, the capacity is expected to be from 1 to 10 kbps/km2 in the S-band and from 10 to 100 kbps/km2 in the Ka-band depending on the scaling of the system. In Handley (2018), the author provided a preliminary evaluation of the latency performance of Starlink and concluded that a network built with a mega-LEO constellation can provide low latency performance in wide area communication, which so far was a show-stopper for MBB services as typically provided by terrestrial networks (Maine et al., 1995).
In the current paper the potential of STN are compared with NTN in terms of achievable capacity and service coverage for rural scenarios, and in terms of required network infrastructure. Both a fixed-mount scenario of connectivity to homes and a mobile scenario will be evaluated. This will try to answer the question about technology positioning as depicted in Figure 1: to what extent can STN and NTN supply economic area capacity for rural and deep rural scenarios with limited traffic density, and thereby extend and complement the coverage of existing cellular networks, and has NTN the potential to replace terrestrial mobile communications systems in any scenario?
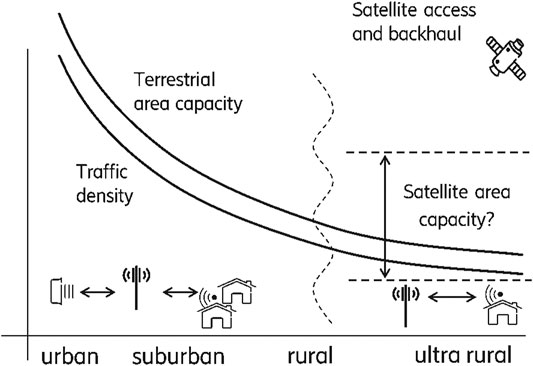
FIGURE 1. Positioning of terrestrial and satellite network technology considering different levels of capacity and traffic density.
In Rural Coverage With Sparse Terrestrial Networks and Rural Coverage With Non-Terrestrial Networks, the STN and NTN networks are presented, respectively. A chosen evaluation scenario and simulation methodology is presented in Materials and Methods, and the resulting performance is presented in Results. The comparison between the STN and NTN solutions is discussed in Discussion. Finally, conclusions based on this analysis are presented inConclusion.
Rural Coverage With Sparse Terrestrial Networks
The fundamental idea of STNs is to create large cells by using long-range links between base stations (BS) and user equipment (UE), for which available 5G technology can be used. The long range is achieved by high towers combined with large antenna arrays and efficient antenna techniques creating narrow beams with high gain with a line-of-sight (LoS) or near-LoS connection to the UE. On the UE side the signal quality needs to be improved by an enhanced antenna and/or more power using either a dedicated long-range handheld device for mobile connectivity or using a fixed-mount customer premises equipment (CPE) antenna for stationary (home) coverage.
One attractive solution for STN is to reuse existing infrastructure for e.g., TV/radio broadcast, which is typically done from high towers placed in a grid with an inter-site distance (ISD) in the range 40–80 km as compared to 1–20 km in typical urban and sub-urban deployments. The re-use of existing GSM sites in elevated positions (hills, mountains) and/or the use of existing high-masts for radio/TV broadcast boosts the achievable cell range notably, reducing roll-out and operational costs as shown in Lun et al. (2019). There are realistic simulations with actual terrain data of a 200 km × 200 km area in Northern Sweden, assuming commercially available radio equipment mounted in three existing TV towers and elevated UEs, showing close-to full-area coverage with tower-ISDs of 65 km and sufficient system capacity for the rural population. Aggregating a low-frequency carrier for control coverage and a mid-frequency carrier for capacity boosting enables good link quality. Such setups would be a cost-efficient way to provide deep rural broadband services with 5G technology, given that the tower/site infrastructure already exists with sufficient power and backhaul capacity.
Basic connectivity cases are outlined in Figure 2 by hand-held UEs, or higher-capable Very Small Aperture Terminal (VSAT) CPEs either directly accessing the STN system or by using the STN for backhauling local hotspot cells. Key parameters for an STN is the inter-site distance (ISD) between radio masts, the tower height, the UE capabilities, long with radio parameters (notably frequency band, bandwidth, antenna pattern, transmission power).
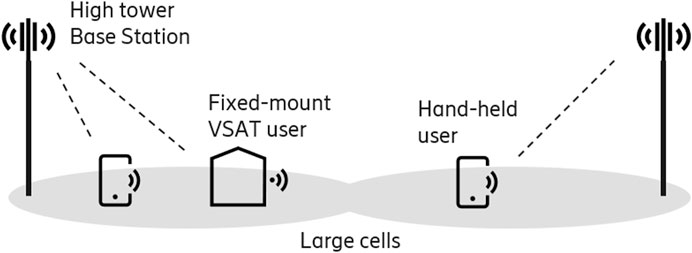
FIGURE 2. STN architecture.
Rural Coverage With Non-Terrestrial Networks
In recent years several satellite initiatives have been started, focusing on providing broadband coverage in rural areas. While proprietary systems are in development and partially already in deployment phase (de Portillo et al., 2019), global standardization efforts in connection to cellular communication technologies with focus on their integration and the importance for 5G and 6G are ongoing (3GPP, 2018).
A difference to earlier satellite networks operating in geo-stationary orbit (GEO) or medium-earth orbit (MEO) is that they all rely on low earth orbit (LEO) satellites, being non-geostationary and having an altitude in the range of 500–800 km. While MEO networks can provide close to 10 Gbps rate in 1.3 GHz bandwidth (Kourogiorgas et al., 2016) their application space is limited to broadcasting services due to the high latency, while LEO NTNs with large satellite constellations can provide low latency and capacity performance for wide area communication (Handley, 2018).
Recent advances in 5G massive MIMO technology such as improved beamforming, channel measurements, delay and Doppler compensations, once adopted in LEO satellites greatly improve latency, rate, and system capacity over what was earlier possible in terms of ICT from space (Goto et al., 2018).
With a large number of such technically sophisticated satellites orbiting the earth in carefully designed paths, it is possible to cover all populated areas with at least one satellite with LoS link at any given time. Combined with fixed satellite dish CPE antennas or enhanced handheld antennas for the UE, broadband can be delivered to homes.
In a current 3GPP effort, satellite and other NTN solutions can be integrated with 5G networks such that NTN access links can be used by 5G equipment for connection just as with terrestrial links, (3GPP, 2018; 3GPP, 2019). The standard solution enabling this is through a transparent architecture where the 5G base station is placed on Earth in a gateway (GW), from which the access link is routed over the NTN in a way transparent to the UE. The dynamically changing NTN networks serve geographically fixed terrestrial cells with steerable or fixed spot beams during the period when they are in range, and change served cells just as they change serving GW, as illustrated in Figure 3. Compared to a terrestrial cell, the latency is longer due to the delay in the access and gateway link, and the NTN is typically more power limited, but in several other aspects the systems can be seen as comparable.
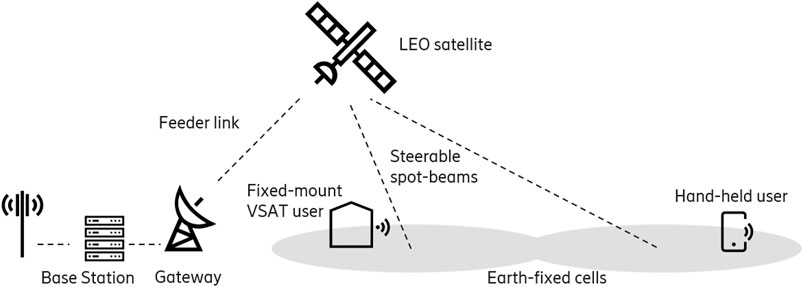
FIGURE 3. NTN transparent architecture.
The key parameter for evaluating the capacity of a satellite system is the total number of satellites, determining the served area per satellite, and the number of concurrent spot beams per satellite. Also, the footprint of the spot beams is of importance, along with the same radio parameters as for STN.
Materials and Methods
A set of STN and NTN scenarios have been evaluated and compared by using a proprietary Monte Carlo network system simulator software tool. The simulator samples many randomized user positions within specified area that each carry traffic corresponding to a pre-defined traffic density, allowing realistic modeling of actual network performance on the UE level.
Given the channel gains and the network topology, a computed received signal power and interference power from randomized UEs and BSs in surrounding cells are computed based on the utilization, giving the SINR per UE. The utilization is the fraction of resources that each UE occupies in DL and UL which is used to compute the interference by drawing random UEs as interferer with probabilities linked to the utilization. From precomputed link rate maps and offered traffic the cell utilization equilibrium point is found in an iterative fashion until both variables converge.
The simulator also assumes that power control and adaptive bandwidth features are enabled, both aiming to guarantee a minimum SNR requirement. Finally, with the resulting utilization and bandwidth assigned to each user, it is possible to compute the bitrate according to precomputed 3GPP NR link rate maps, and apply utilization-based queue models the experienced user throughput distribution as function of served traffic is achieved as the final result of the simulation.
Two main scenarios are considered for the case of deep broadband coverage:
• Mobile hand-held UE, for smartphone-like use cases anywhere.
• Fixed-mount VSAT CPE, with an external antenna mounted on a building to provide broadband in the home. Alternatively, the CPE antenna could be mounted on a vehicle.
Sparse Terrestrial Networks Simulation
Extensive simulations as reported in Jaldén et al. (2020) show that ISDs in the order of 40–80 km can be achieved when combining mid-band NR (sub 6 GHz) with low-band LTE/NR (sub 1 GHz) given sufficiently large antenna mounting height and antenna gain in combination with higher-capable UEs in terms of radiated power (EIRP) and elevation. When operated in carrier aggregation mode, the primary low-band anchor provides control channel coverage and some basic capacity layer far out while the supplementary mind-band carrier(s) boost capacity to sufficient levels supporting sparsely populated rural areas with decent traffic demands. An increase in the mounting height of the base station and UE elevation (hand-held vs. CPEs) directly translates to an increase in network capacity and thus is a key parameter in STN networks.
System parameters as listed in Table 1 represent a commercially available 3-sector high-tower mobile system configuration within typical regulatory limit, that serve as baseline in this paper. As indicated, two different spectral bands in carrier aggregation mode are assume in the simulations, i.e., B28 700 MHz in FDD mode and B41 3.5 GHz in TDD mode with typical asymmetry ratio. In low-band, regular two layers of single-user SU-MIMO with typical commercial output power and external 120 degrees sector antennas are assumed. In high-band, a multi-user MU-MIMO advanced antenna system (AAS) radio with commercially available beamforming gain ratings are assumed.
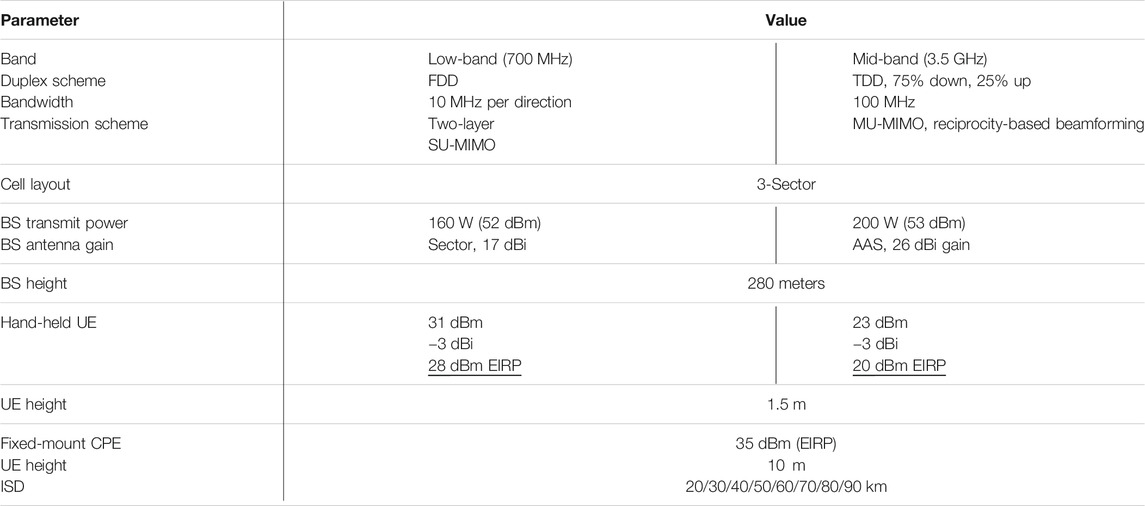
TABLE 1. STN simulation parameters.
For the hand-held case, regular smartphones (internal antenna gain of −3dBi) are assumed, whereas for the fixed-mount CPE case, the typical regulatory UE EIRP limits of 35 dBm EIRP are assumed. For the hand-held case, high-power UE as specified in 3GPP are used in low-band, and regular class-3 UEs in mid-band.
Simulations are run over different sets of inter-site distances and spectral resources on par with those in NTNs for a fair performance comparison.
Non-Terrestrial Networks Simulation
The LEO constellation is modelled as three shells, each of them characterized by an orbital inclination and an altitude. Each shell contains evenly distributed orbital planes around Earth axis, and each orbital plane contains evenly distributed satellites along the circular orbit. Various simulations are carried out with increasing total number of satellites, for a total of 6 constellation sizes. This means that the number of orbital planes and satellites per orbital planes is increasing accordingly. Table 2 summarizes the values used to define the various constellations.
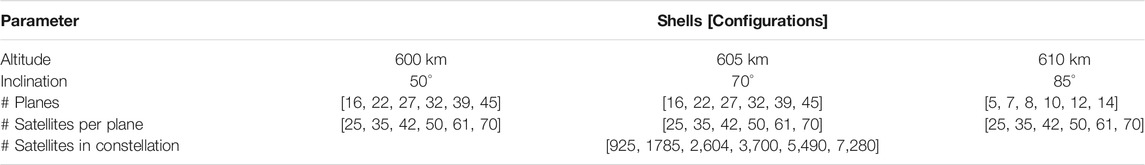
TABLE 2. Simulated satellite constellations.
The simulator used for the NTN scenario is the same used for the STN scenario, with the difference that the channel gains between each UE–cell pair are calculated separately considering a satellite constellation.
In this preparatory computation, the simulator computes the position of each satellite in the constellation around the globe over time starting from the satellite orbital elements or ephemeris. The coordinates in Earth Centered Inertial (ECI) reference system are first calculated, then in Earth-Centered Earth-Fixed (ECEF) coordinates and finally in terms of latitude, longitude, altitude. For simplicity, considering the purpose of this simulator, secondary effects such as atmospheric drag, solar winds etc. are ignored. Once a region of interest is defined in the simulator, all the satellites that never interact with devices in this region in the specified time frame are removed to speed up the simulation.
A set of users is then deployed in the region of interest and uniformly distributed in the land masses only to emulate terrestrial users. The traffic is distributed among the users so that it matches the desired traffic per area unit. Finally, the cells are deployed on the land masses, according to a hexagonal pattern with a given Inter-cell distance. Similarly, some gateways are distributed in the region of interest to guarantee that all satellites have a backhaul connection to the network. A map of the simulated area with an example constellation is shown in Figure 4. Once the ground nodes are deployed, the simulator calculates the apparent position in the sky of each satellite with respect to each ground node in terms of elevation angle, distance, and azimuth.
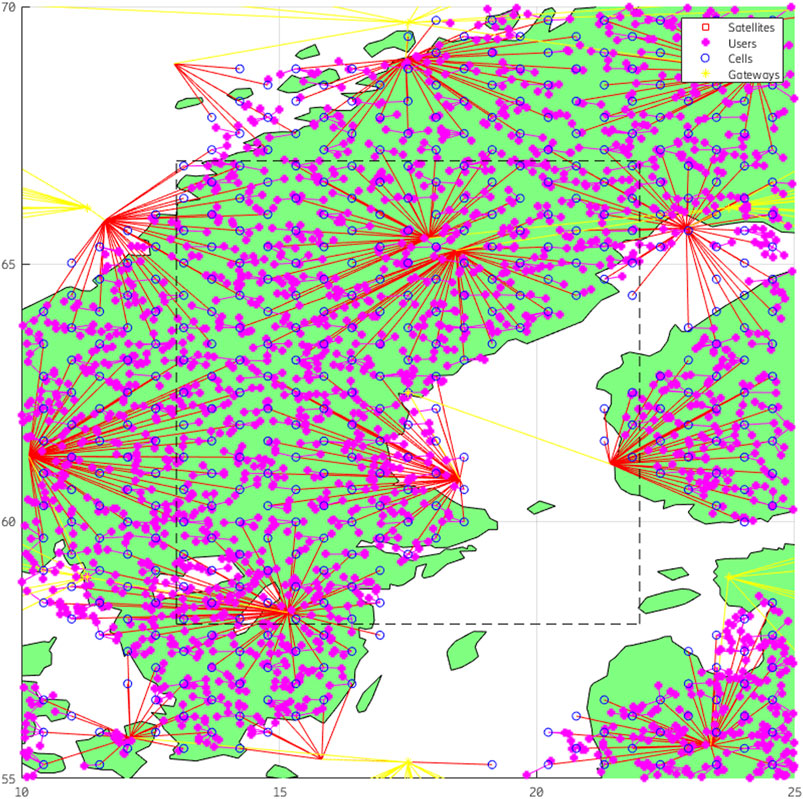
FIGURE 4. Map of NTN simulation area with a snapshot of users, cell centers, and satellite positions and area considered for post-processing.
Each satellite can support up to 32 concurrent steerable beams that serve the set of cells mapped to it. Each user is served by the closest cell, and each cell is served by the satellite with the closest projection on the ground, and if more than 32 cells are served by a satellite the cells are served in time division fashion by the beams according to the amount of traffic. Further, each cell uses one of 7 (3) channels in DL (UL) distributed in a reuse pattern.
Two cases are studied: a low-band case with hand-held UE, and a high-band case with a VSAT CPE. For the low-band case, the UE antennas are assumed to be omnidirectional with gain 0 dBi, for the high-band case the UE antennas are assumed to be satellite dish pointed towards the serving satellite. In both cases the satellite antennas are assumed to be satellite dish pointed towards the center of the served cell.
To determine the antenna gain of a satellite dish at a certain angle
The path loss is then calculated between each relevant UE-satellite link according to the 3GPP path loss model for NTN (3GPP, 2018). The path loss model assumes all UEs are deployed outdoors in rural areas, it considers the free-space path loss, LoS probability, shadowing and several additional losses typical of propagation from space through the atmosphere. By combining the path loss with the antenna gains and their orientation the overall channel gain is obtained and used for the traffic simulation. As already mentioned, the resulting channel gains are given as an input to the simulator used also for the STN scenario.
The simulation parameters are listed in Table 3 and follow the 3GPP assumptions (3GPP, 2019).
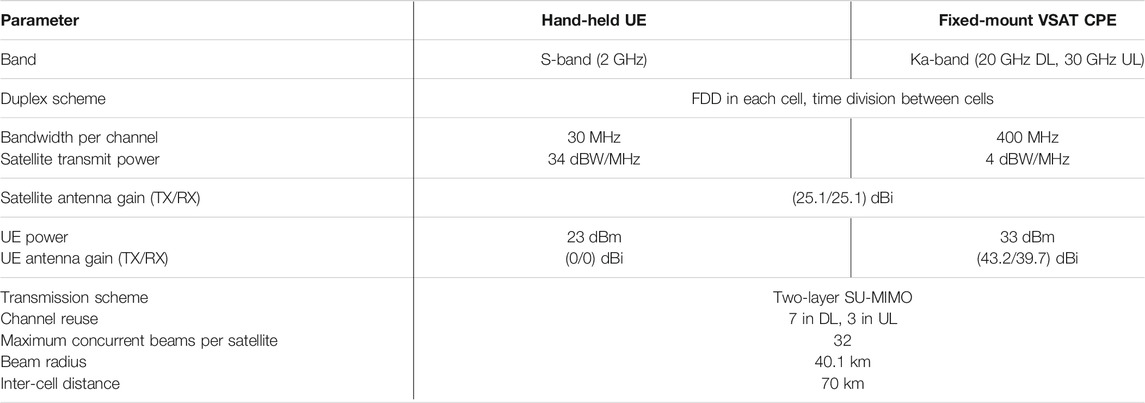
TABLE 3. NTN simulation parameters.
Traffic and Service Assumptions
For each STN and NTN scenario a set of offered traffic volumes per area unit are simulated in a rural area. UE positions are randomly sampled from a uniform distribution and associated with offered UL and DL traffic accordingly. Increasing traffic is pushed through the system, in turn increasing utilization and interference and thereby reducing experienced UE throughput. For each level of served traffic that the system can deliver, the fraction of UEs fulfilling a broadband service requirement, of 1 Mbps in UL and 5 Mbps in DL, respectively, is found. Capacity is thereby defined as the served traffic for which the fraction of users fulfilling the service requirement exceeds 95%. An assumption of user traffic volume of 1 GB/month in UL and 5 GB/month in DL per user, together with a busy hour assumption of 10 h/day allows to compute an assumed average traffic per user of 7.41 kbps in UL and 37.0 kbps in DL, respectively, and thereby allows making an approximation of the number of satisfied broadband users in the network.
Results
STN Performance
The capacity of the STN system for hand-held and fixed-mount scenarios is found from the 95th percentile of the user satisfaction given in Figure 5, as the crossing point with the UL and DL service requirement, respectively. Plotted separately per UL and DL and for the different ISDs, this traffic area capacity is given in Figure 6. As can be noted, the UL capacity is significantly lower than that of the DL, due in large part to the significantly lower transmit power in the UE.
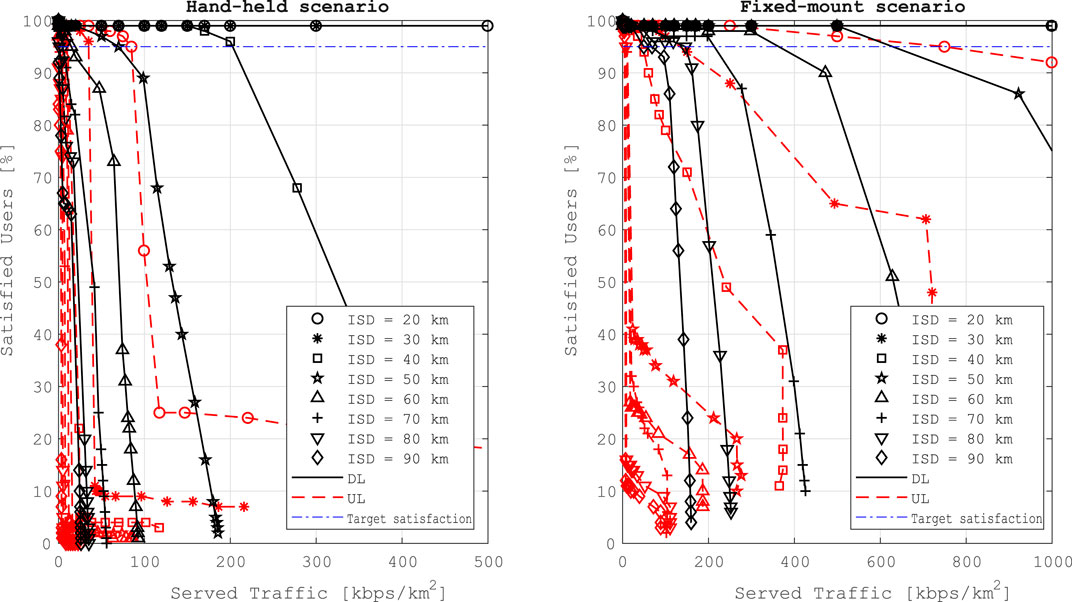
FIGURE 5. User throughput as function of served traffic per macro cell, corresponding to 95% coverage.
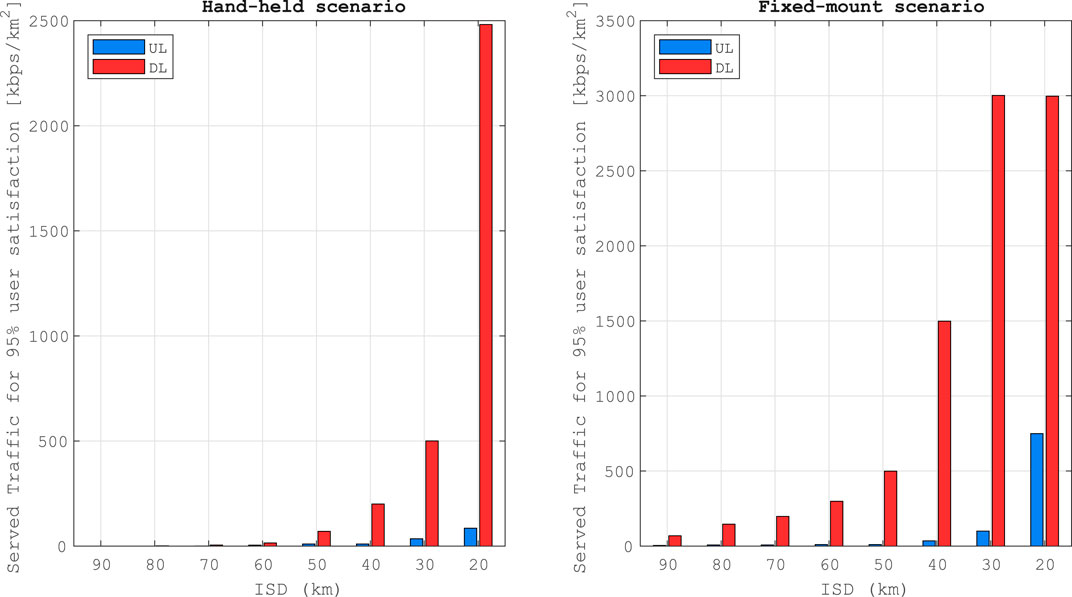
FIGURE 6. Capacity (served traffic at 95% service coverage) for different STN scenarios.
Non-Terrestrial Networks Performance
The service capacity for the simulated NTN systems as function of served traffic is shown in Figure 7 for the hand-held and fixed-mount VSAT scenario. Taking the served traffic at 95% service coverage the capacity is found as shown in Figure 8. As is clearly seen, the capacity of the VSAT CPE case is significantly higher than the hand-held UE case, owing to the better antenna and higher bandwidth. In both cases power limitation comes into play: in the handheld case the UE is power limited in the UL, and in the VSAT case the satellite is power limited in the DL. In both cases, UL and DL capacity is in the same order of magnitude, owing to the similar power levels of UE and satellite sides.
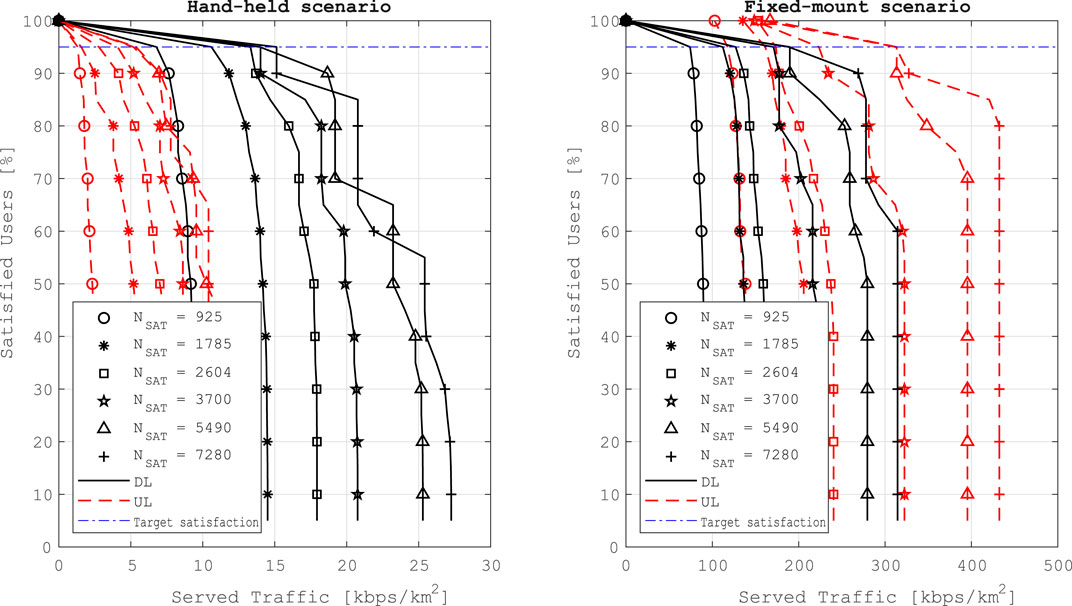
FIGURE 7. Service coverage for NTN systems as function of served traffic.
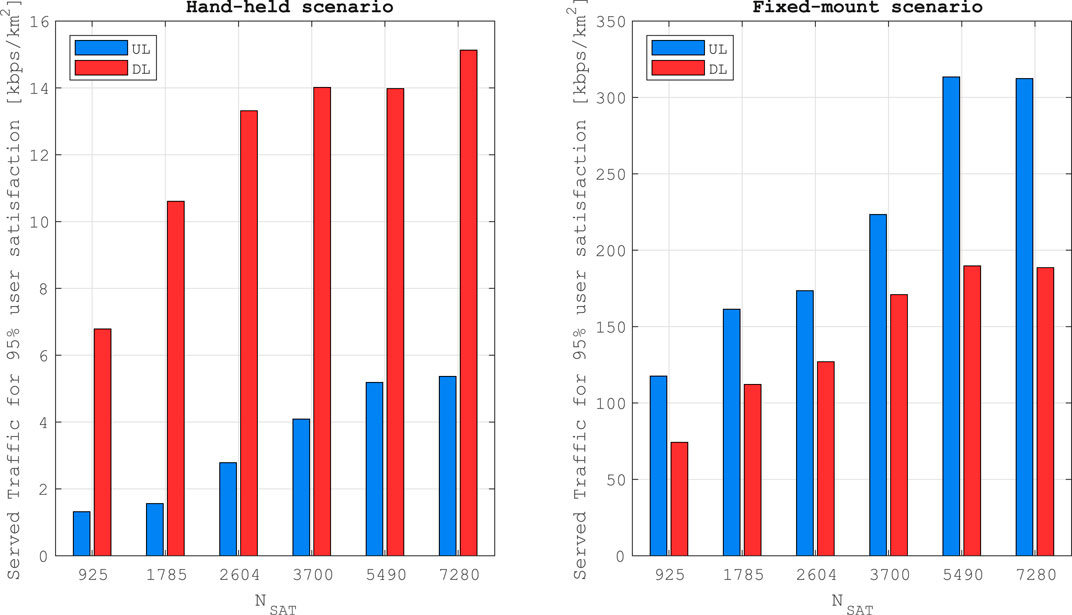
FIGURE 8. Capacity (served traffic at 95% service coverage) for different NTN scenarios.
Discussion
As can be deduced from the results in Results, both STN and NTN would be able to provide deep rural broadband with partly overlapping ranges of capacities, depending on the deployment density of the respective systems. However, even if the performance is comparable, the required infrastructure is vastly different. While a STN can largely rely on an available grid of TV-towers, alternatively a limited set of new towers to serve a certain area, a relevant NTN would entail new installation of a significant number of GWs and LEO satellites. Considering this, it is important to account for the fact that the NTN system would be able to serve a much larger area with its deployed orbits. To avoid accounting for uninhabited regions we will here focus on population densities higher than 1/km2, here referred to as populated areas. As of the year 2000, about 55% of the land area of Earth had a population density exceeding 1/km2 (Jones and O’Neill, 2016). Assuming all such land is served by the NTN system, the number of deployed satellites divided with this area can be said to represent the infrastructure that should be supported per area unit and serve the users in it.
To achieve a certain performance in terms of broadband capacity in populated areas, assuming the service definition (Traffic and Service Assumptions), we can use either an NTN or an STN system, as is shown in Table 4 where the traffic assumption per user (Traffic and Service Assumptions) is used and both UL and DL satisfaction is required. Here, the number of users per area points at the traffic density that can be supported, while the number of users per site or satellite points at the economic feasibility of the deployment. Considerably higher traffic area capacity can be achieved with STN systems, but the global distribution of NTN systems and the many cells makes it possible to support a high total number of users anyway. Increasing the STN site density improves SNR and gives a faster capacity increase yielding an increase in served users per site. With the NTN system the capacity increase from densification is slower and the achievable uptake per satellite drops. This weaker improvement with densification is due to a larger overlap of satellite beams leading to stronger interference growth with traffic.
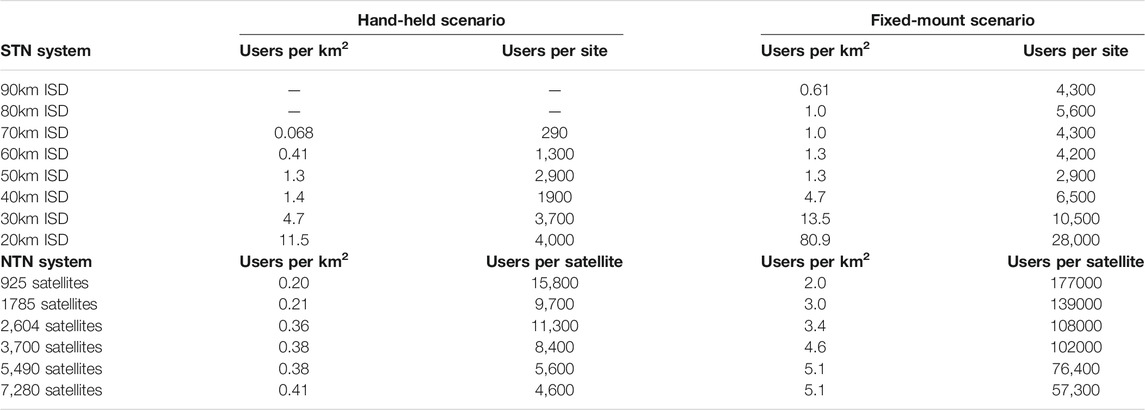
TABLE 4. Maximum served users (defined according to Traffic and Service Assumptions) per area and per site or satellite fulfilling UL and DL conditions.
Looking separately at achievable UL and DL capacity we can find the required infrastructure (STN sites or NTN satellites) to serve the cells within a populated area of 100000 km2, which is shown in Figure 9. Delivering a certain area capacity with these two systems would come with a difference in infrastructure investment, as showed in Figure 10, where only the overlapping capacity regions are compared. At the lower capacity ranges, NTN can deliver connectivity with comparatively little infrastructure owing to the consistent channel quality that does not depend strongly on deployment. But to reach higher area capacities STNs become relatively more advantageous and reach the highest levels among the simulated systems. This is especially true if more weight is given to DL performance.
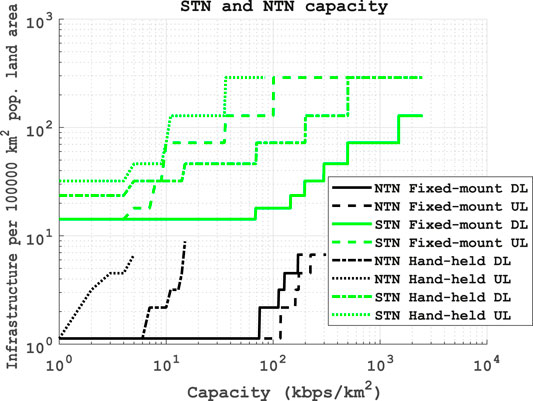
FIGURE 9. Required STN or NTN infrastructure (sites or satellites) per populated land area for 95% service coverage, as function of served traffic.
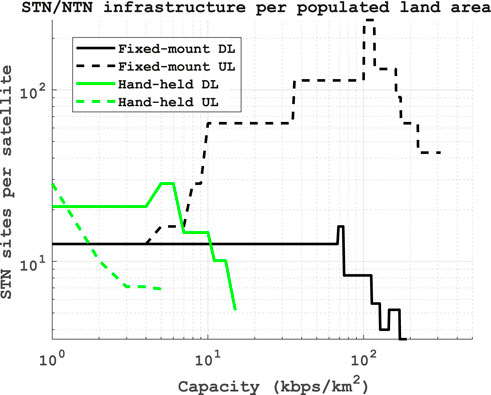
FIGURE 10. Ratio of STN sites to NTN satellites per populated land area for 95% service coverage, as function of served traffic. Note: values only for overlapping capacity regions.
Conclusion
From the results and discussion in previous sections we can conclude on the usefulness of STNs and NTNs, and answer the question summarized in Figure 1. In more urbanized areas with a higher population density and traffic well exceeding 100 kbps/km2 there is little doubt that densifying the terrestrial grid will be a more efficient method compared to deploying a high number of satellites; this depends on the difficulty to achieve a higher area capacity with satellites. However, in the other direction of sparsely populated areas and oceans, with traffic not exceeding 10 kbps/km2, the achievable satellite capacity is enough and an available NTN has an undisputed advantage of not having to rely on expensive terrestrial deployments (beyond a sparse grid of GWs). Still, serving handheld UEs is challenging with NTNs also with low traffic and this use case would therefore point at STNs even though the larger cell sizes can’t be used. In intermediate areas, say in the range 10–250 kbps/km2, with sparse population, reusing existing infrastructure such as high TV-towers for STN is likely economically efficient. Without such towers, an NTN solution presents an efficient option, especially for the VSAT scenario where more users can be supported per satellite. These conclusions on efficient choice of system in different scenarios are summarized in Table 5. It should be noted that this is a conclusion for a DL-heavy scenario. An UL-heavier scenario is more challenging for STN to deliver on due to power limitations, pointing towards an NTN advantage.
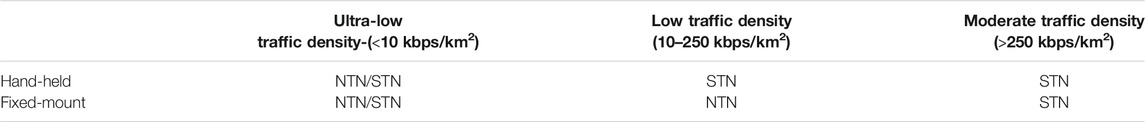
TABLE 5. Efficient choice of system for different rural scenarios considering DL traffic.
Which solution that is most economically attractive in the end depends on many factors, notably the number of satisfied users served by the network. An NTN can and need to serve users in many regions to become feasible, requiring large scale global solutions, whereas STNs only need regional support. Due to this mix of advantages and disadvantages, it is likely that we will see a combination of terrestrial and non-terrestrial components in a future 5G-and-beyond cellular network able to provide broadband everywhere.
Data Availability Statement
The datasets presented in this article are not readily available because only high level accumulated data can be shared as it comes from a simulator with commercial restrictions. Requests to access the datasets should be directed to bHVjYS5mZWx0cmluQGVyaWNzc29uLmNvbQ==.
Author Contributions
LF and GW have worked with the NTN simulations and comparison part of the paper, while NJ and ET have worked with the STN simulations.
Conflict of Interest
Authors LF, NJ, ET, and GW were employed by the company Ericsson AB.
References
3GPP (2018). Study on New Radio (NR) to support non-terrestrial networks Specification 38.811 V15.0.0.
3GPP (2019). Solutions for NR to support Non-Terrestrial Networks (NTN) Specification 38.821 V16.0.0.
de Portillo, I., Cameron, B. G., and Crawley, E. F. (2019). A Technical Comparison of Three Low Earth Orbit Satellite Constellation Systems to Provide Global Broadband. Acta Astronautica 159, 123–135. doi:10.1016/j.actaastro.2019.03.040
Goto, D., Shibayama, H., Yamashita, F., and Yamazato, T. (2018). LEO-MIMO Satellite Systems for High Capacity Transmission.” in 2018 IEEE Global Communications Conference (GLOBECOM), Abu Dhabi, United Arab Emirates, December 9–13, 2018. doi:10.1109/GLOCOM.2018.8647694
Handley, M. (2018). “Delay Is Not an Option: Low Latency Routing in Space,” in Proceedings of the 17th ACM Workshop on Hot Topics in Networks (HotNets '18) (New York, NY, USA:Association for Computing Machinery). doi:10.1145/3286062.3286075
Jaldén, N., Lun, J., Frenger, P., Furuskär, A., Venkatasubramanian, S., and Trojer, E. (2020). “Full Coverage with 3GPP Technologies: On the Feasibility of Providing Full Rural Cellular Coverage,” in 2020 IEEE 91st Vehicular Technology Conference (VTC2020-Spring), Antwerp, Belgium, May 25–June 31, 2020 (Antwerp, Belgium), 1–6. doi:10.1109/VTC2020-Spring48590.2020.9129041
Jones, B., and O’Neill, B. C. (2016). Spatially Explicit Global Population Scenarios Consistent with the Shared Socioeconomic Pathways. Environ. Res. Lett. 11, 084003. doi:10.1088/1748-9326/11/8/084003
Kourogiorgas, C., Tarchi, D., Ugolini, A., Arapoglou, P. D., Panagopoulos, A. D., Colavolpe, G., et al. (2016). “System Capacity Evaluation of DVB-S2x Based Medium Earth Orbit Satellite Network Operating at Ka Band,” in 8th Advanced Satellite Multimedia Systems Conference and the 14th Signal Processing for Space Communications Workshop (ASMS/SPSC), Palma de Mallorca, Spain, September 5–7, 2016 (Palma de Mallorca, Spain:ASMS/SPSC). doi:10.1109/ASMS-SPSC.2016.7601471
Lun, J., Frenger, P., Furuskär, A., and Trojer, E. (2019). “5G New Radio for Rural Broadband: How to Achieve Long-Range Coverage on the 3.5 GHz Band” in 2019 IEEE 90th Vehicular Technology Conference (VTC2019-Fall), Honolulu, HI, USA, September 22–25, 2019 (Honolulu, HI, USA), 1–6. doi:10.1109/VTCFall.2019.8891556
Maine, K., Devieux, C., and Swan, P. (1995). 95. Overview of IRIDIUM Satellite Networks. San Francisco, CA, USA: Proceedings of WESCON, 483. doi:10.1109/WESCON.1995.485428
Qu, Z., Zhang, G., and Xie, J. (2017). LEO Satellite Constellation for Internet of Things. IEEE Access 5, 18391–18401. doi:10.1109/ACCESS.2017.2735988
Rinaldi, F., Määttänen, H.-L., Torsner, J., Pizzi, S., Andreev, S., Iera, A., et al. (2020). Non-Terrestrial Networks in 5G & beyond: A Survey. IEEE Access 8, 165178–165200. doi:10.1109/ACCESS.2020.3022981
Sedin, J., Feltrin, L., and Lin, X. (2020). Throughput and Capacity Evaluation of 5G New Radio Non-Terrestrial Networks with LEO Satellites.” in GLOBECOM 2020 - 2020 IEEE Global Communications Conference, Taipei, Taiwan, December 7–11, 2020 (Taipei, Taiwan). doi:10.1109/GLOBECOM42002.2020.9347998
UN General Assembly (2015). Transforming the World: The 2030 Agenda for Sustainable Development, A/RES/70/1. Available at:https://www.refworld.org/docid/57b6e3e44.html
Vatalaro, F., Corazza, G. E., Caini, C., and Ferrarelli, C. (1995). Analysis of LEO, MEO, and GEO Global mobile Satellite Systems in the Presence of Interference and Fading. IEEE J. Selected Areas Commun. 13 (2), 291–300. doi:10.1109/49.345873
Xia, S., Jiang, Q., Zou, C., and Li, G. (2019). Beam Coverage Comparison of LEO Satellite Systems Based on User Diversification. IEEE Access 7, 181656–181667. doi:10.1109/ACCESS.2019.2959824
Keywords: 5G, rural coverage, NTN, large cells, wireless networks, 6G
Citation: Feltrin L, Jaldén N, Trojer E and Wikström G (2021) Potential for Deep Rural Broadband Coverage With Terrestrial and Non-Terrestrial Radio Networks. Front. Comms. Net 2:691625. doi: 10.3389/frcmn.2021.691625
Received: 06 April 2021; Accepted: 17 June 2021;
Published: 05 July 2021.
Edited by:
Luciano Leonel Mendes, National Institute of Telecommunications, BrazilReviewed by:
Lucas Bondan, National Education and Research Network, BrazilCarlos Silva, Federal University of Ceara, Brazil
Fraida Fund, New York University, United States
Copyright © 2021 Feltrin, Jaldén, Trojer and Wikström. This is an open-access article distributed under the terms of the Creative Commons Attribution License (CC BY). The use, distribution or reproduction in other forums is permitted, provided the original author(s) and the copyright owner(s) are credited and that the original publication in this journal is cited, in accordance with accepted academic practice. No use, distribution or reproduction is permitted which does not comply with these terms.
*Correspondence: Luca Feltrin, bHVjYS5mZWx0cmluQGVyaWNzc29uLmNvbQ==