- Urban Economics Chairgroup, Wageningen University, Wageningen, Netherlands
Similarity of pro-environmental behaviors is described as a moderator of behavioral spillover: when behaviors are perceived as similar positive spillover would be more likely. However, how people perceive similarity is unclear and therefore, the exact role that similarity plays in the spillover process is uncertain. In a survey (n = 1,536) we investigated how people clustered a variety of pro-environmental behaviors and why. Moreover, we explored potential spillovers between people's current and desired behaviors. People appeared to mainly cluster behaviors according to domains (such as energy, mobility) in addition to other categorization types. Furthermore, positive spillovers from actual to desired behavior occurred both within and between domains. In other words, similarity did not seem to play an important role in predicting spillover. In general, people who clustered behaviors into more different categories had a stronger overall desire to behave pro-environmentally than people who used fewer clusters.
1. Introduction
Given the current climate change situation and the accompanying challenges ahead, there is growing interest in how low-carbon, pro-environmental behavior (PEB) can be encouraged. When creating effective behavioral change strategies to reduce climate change, a narrow focus on single behaviors will however be inefficient and could lead to the creation or worsening of environmental problems outside the focus (Thøgersen, 1999). As “no behavior sits in a vacuum,” “sector-thinking” should be abandoned and changing whole lifestyles should be the aim (Dolan and Galizzi, 2015, p. 1). The focus on behavioral spillover research in recent years indicates that there is an increased notion of the need to broaden the scope (e.g., Truelove et al., 2014; Dolan and Galizzi, 2015; Van Der Werff and Steg, 2018; Maki et al., 2019; Penz et al., 2019). Behavioral spillover implies that acting in a pro-environmental way changes a person's likelihood or extent of performing other PEBs (Lanzini and Thøgersen, 2014). Behavioral spillover can be positive when the adoption of a particular first behavior (PEB1) is found to increase a person's inclination to engage in another second behavior (PEB2) (Thøgersen and Crompton, 2009). However, spillover can also be negative, in which case the reverse effect is observed: after adopting a PEB1, the probability of an individual adopting another PEB2 declines. Both kinds of spillover can be seen as either a positive or negative feedback loop that leads toward either more or less PEBs. Meadows (1999) described feedback loops as ways or “leverage points” to intervene in a system. Steering on these leverage or “social tipping” points (Otto et al., 2020) may help in bringing and speeding up overall change.
Previous studies show that both negative and positive behavioral spillovers occur, but generally spillover effects are small (Maki et al., 2019; Geiger et al., 2021). However, a number of moderators have been identified that positively or negatively affect the occurrence of behavioral spillover, implying that under certain circumstances the spillover effect may be larger (Maki et al., 2019; Carrico, 2021). These moderators include the frame of the intervention, e.g., focus on identity (Baca-Motes et al., 2013) or a monetary vs. environmental focus (Lanzini and Thøgersen, 2014; Steinhorst and Matthies, 2016), a person's political ideology (Lacasse, 2016; Truelove et al., 2016), and the perception of the PEBs; including the degree of similarity of PEBs (Thøgersen, 2004), and the perceived difficulty of PEBs (Fujii, 2006; Gneezy et al., 2012). Here we focus on the degree of similarity, as there is lack of clarity about how people perceive similarity of PEBs and researchers use various definitions of similarity when studying spillovers. The paper addresses the questions of how people perceive the similarity of PEBs, and how their perception of similarity affects potential spillovers. In addition, we consider the role of people's perception of the difficulty or effort of performing PEBs within the spillover process as this appeared to be an important factor in the relation between motivation and PEB performance (Dreijerink et al., 2022). In the theoretical framework we succinctly describe the state of art of similarity, the process of positive and negative spillovers, and definitions concerning perception and categorization of PEBs.
1.1. Theoretical framework
Studies show that people tend to be more likely to co-perform behaviors in similar categories (Gatersleben et al., 2002). In other words, when behaviors are perceived as more similar positive spillovers are more likely (Thøgersen, 2004; Margetts and Kashima, 2017). A meta-analysis by Maki et al. (2019) indeed found that PEBs that were perceived as highly similar led to more positive spillover compared with behaviors perceived as medium or low similarity. A commonly used explanation is that people act because of a preference for consistency and a desire to prevent dissonance associated with inconsistent behaviors. In line with this explanation, several studies on the foot-in-the-door effect showed that compliance with a second request was greater when the first request was similar (Nilsson et al., 2017). Moreover, it is suggested that people with a strong environmental identity and high knowledge might be more likely to engage in positive spillover simply because they recognize the behaviors as related (Truelove et al., 2014).
Studies on mental accounting may provide additional explanations of positive spillovers within categories. Mental accounting assumes that people use accounts to organize, evaluate, and keep track of their financial activities (Thaler, 1999). Expenditures are grouped into categories (for example housing, food, leisure, etc.) and spending can be constrained by implicit or explicit budgets. Moreover, similar expenses combined into one category are psychologically integrated, thus hurting less than segregating expenses (Thaler, 1980). Next to financial decision making, mental accounting has been studied in other fields, including ethical (Schütte and Gregory-Smith, 2015), food (Krishnamurthy and Prokopec, 2010), and energy consumption (Hahnel et al., 2020). Also, mental accounts have been described as categories that are organized around active goals (Paul et al., 2018). Pursuing a goal requires protecting it from competing goals, which can be accomplished by committing resources (e.g., money, attention, effort) to that goal rather than to other goals (Brendl et al., 1998). In these applications of mental accounting, financial expenses are replaced with spending attention or effort. In line with this argumentation, people would therefore be more inclined to subsequently spend these resources within the same category than in a different category.
In contrast, the mental accounting hypothesis has been challenged by several studies showing positive spillovers between categories and people engaging in dissimilar behaviors (e.g., Thøgersen and Ölander, 2003; Lanzini and Thøgersen, 2014; Xu et al., 2018). While correlations between dissimilar PEBs suggest the possibility of wider spillover effects, the reasons for consistency are however not well understood (Nash et al., 2017).
Negative spillovers have more often been found between categories, or when behaviors are dissimilar (e.g., Tiefenbeck et al., 2013; Werfel, 2017). For example, Geng et al. (2016) found that after a green purchasing task, respondents were less inclined to save water. An explanation would be that when people do not perceive behaviors as similar, they see no inconsistency in behaviors (Thøgersen, 2004). Therefore, preference for consistency and desire to prevent dissonance do not encourage them to act pro-environmentally in both instances. From the mental accounting perspective, focusing on one account and less on others would indeed be expected. However, the mental accounting hypothesis has been challenged by several studies showing or suggesting negative spillovers within categories (e.g., Weber, 1997; Truelove et al., 2014; Chatelain et al., 2018).
In the (limited) literature that explicitly focuses on spillovers and similarity most studies assess similarity by means of domains (Juhl et al., 2017; Nash et al., 2019). For example, in a qualitative study on self-reported spillovers, Nash et al. (2019) described that the most commonly reported types of spillover effects were within behavioral domains (such as waste or resource conservation) as opposed to between domains, in line with the mental accounting hypothesis. Additionally, Thøgersen and Ölander (2003) investigated the spread of PEBs both within and between consumption domains. Although there are exceptions (see Margetts and Kashima, 2017) in spillover studies similarity seems to imply that behaviors are part of specific domains.
The literature shows that (lay) people and researchers apply different ways to categorize PEBs. Most research on PEB attributes has focused on energy experts' conceptualizations about the cost, frequency of action, and environmental impact of one class of PEBs: household behaviors that contribute to greenhouse gas emissions reductions (Truelove and Gillis, 2018). Experts have most frequently proposed a simple dichotomous classification scheme: (a) low-impact, low-cost, repetitive, curtailment behaviors (such as turning down the heat or reducing appliance use); and (b) high-impact, high-cost, infrequent, efficiency behaviors (such as insulating one's home or buying energy efficient appliances) (Boudet et al., 2016).
As Truelove and Gillis (2018) describe, a second class of literature has adopted a more laypeople-driven approach to categorizing a wide set of PEBs. This approach typically involves conducting surveys of people' self-reported PEB frequencies and then factor analyzing responses to see which types of PEBs group together. Similarly, card-sorting procedures and Rasch-type modeling efforts provide insight into which PEBs people cluster as similar. Factor analyses on the frequency of performing PEBs and card-sorting procedures generally reveal clusters based on domains of behavior, such as waste-reduction, recycling, domestic energy conservation, transport, advocacy, and consumer behavior (Bratt, 1999; Gatersleben et al., 2002; Bernard et al., 2009; Whitmarsh and O'Neill, 2010). These domains could be viewed as mental accounts. Antonides et al. (2011) indeed reported that about half of their respondents indicated to reserve money for different expenses, including food, clothing, transportation, and so forth. Additionally, Zhang et al. (2020) found that roughly 60 percent of people use budgetary categories, such as food, clothing, gas, entertainment, and so forth. However, they also found clear variation in the level of detail at which people categorized their spending.
In addition to the first two approaches and different than researchers, (lay) people appear to categorize behaviors in other ways. For example, in a study on clustering domestic energy consumption behaviors, Gabe-Thomas et al. (2016) found that the degree to which participants agreed on which appliances belonged together was based on location within the home (e.g., kitchen) and on activities (e.g., entertainment). In their sorting study on 44 household water saving behaviors Kneebone et al. (2018) found that location (indoors vs. outdoors) was the primary attribute used to define behavioral similarity. The secondary attribute was behavior type: either curtailment or efficiency.
Besides the various ways of categorization, the broadness of categories and thus the number of categories people use is crucial. Within mental accounting the range of each category or how broad people “set the brackets” is identified as an important aspect (Koch and Nafziger, 2016). Brackets can be defined broadly over large sets of choices or narrowly over very small sets of choices. For example, Heath and Soll (1996) documented how people control their expenditures in narrowly bracketed mental accounts, such as entertainment, clothing, or food, but at the same time, not all accounts are narrow: people do not have a mental account for every item they buy, or for every possible consumption category. It is expected that when people cluster PEBs into one overall account this may have consequences for the occurrence of spillovers. For example, Kaiser (1998) suggested that having a holistic view of PEBs (i.e., “ecological concern”), could lead to an increase of the performance of several PEBs. Therefore, strengthening links between PEBs might lead to higher perceived similarity and possibly to more positive spillovers (Nash et al., 2017). Contrarily, mental organization that bundles different energy-consuming actions together into one broad “carbon account” may result in negative spillovers within this account (Hahnel et al., 2020). Thus, specialization into a few accounts would lead overall to more pro-environmental behavior if these accounts include similar behaviors.
1.2. Current study
In the current study we aimed to provide insight into how people perceive similarity of PEBs and how this perception affects behavioral spillovers. We first focused on the type of categorization people used, what type of categorization prevailed and why people applied a particular categorization. Based on the predominant view in the literature, we expected that the majority of people would cluster the PEBs according to domains such as housing, mobility, food, and so forth (Hypothesis 1). In a paper on perceived similarity of 44 household water saving behaviors, Kneebone et al. (2018) described a replicable procedure, using multidimensional scaling analysis (MDS) and hierarchical cluster analysis (HCA) with thematic content analysis and categorical principal components analysis (CATPCA). We followed their procedure to understand which PEBs are seen as similar and why, but we made three adjustments. First, to avoid “sector-thinking” (Dolan and Galizzi, 2015, p. 1), we applied the procedure to a broader range of PEBs rather than to a single domain. This resulted in a broad, heterogeneous set of behaviors. Second, in addition to consumer behaviors we added citizen engagement behaviors, since behaviors in the citizenship domain, including voting or participating in social movements, are important to facilitate sustainable lifestyles (Stern, 2000; Nielsen et al., 2021). Third, we conducted a quantitative (instead of a qualitative) study which enabled us to involve a large group of participants that would include a representative sample of Dutch society. We further explored the relationship between how people categorize the PEBs and potential positive and negative spillovers between the PEBs that they perform currently and the PEBs they desire to perform in the future.
2. Method
2.1. Respondents
This study was an addition to a study on social support for climate policy. The latter study used a sample from the IandO Research panel that was representative for Dutch society. Participants were recruited at the end of November 2019. 1,536 People participated, including 54% males and 46% females. Educational levels varied from 24% lower (primary education up to and including incomplete secondary education), 35% medium (secondary education, vocational education, up to and including first year higher vocational education) to 41% higher educated (higher vocational education up to and including university degree). Age varied from 14% in the category 18–39 years, 39% in the category 40–64 years, and 47% were 65 years or older.
2.2. Materials and procedure
As this study was added to an online questionnaire on support for climate policy, parts of the questionnaire are not relevant for this study and are therefore not described. The relevant part of the questionnaire is included in the Supplement. Our study was preregistered at as.predicted (#31213). In this preregistration we described several research questions: the present one on categorization, but also on other topics not described here. The online questionnaire included questions on the following topics.
2.2.1. Pro-environmental behaviors
Performance of PEBs was measured using items inspired by the General Ecological Behavior (GEB) scale items (Arnold et al., 2018). We included items from specific (consumption) domains, namely curtailing in-home energy use, efficient in-home energy use, mobility, food, buying goods, and green citizenship (see Table 1). Furthermore, we added variation with regard to the environmental impact of behaviors: some having a low estimated impact (low carbon emission) versus others having higher impact (higher carbon emission). Impact estimations were based on the Dutch website of Milieu Centraal (2019) that provides thorough information on environmental impacts based on lifecycle assessments (LCA). The goal of these emission estimations was to add variation in the selection of PEBs and not to quantify the exact impact of each behavior. To limit the questionnaire length, we selected 13 items from the 74 GEB items. Some items were adjusted to the Dutch situation. For example, prior interviews (see Dreijerink et al., 2021) showed that riding a bicycle or taking public transportation to go to work or school were perceived as very different and should therefore not be combined into one item (we have included three mobility items, i.e., 7, 8, and 9 in Table 1). In addition, items were shortened for clarity. Finally, we added four items to have a sufficient number of items per domain (item numbers 2, 14, 16, 17 in Table 1).
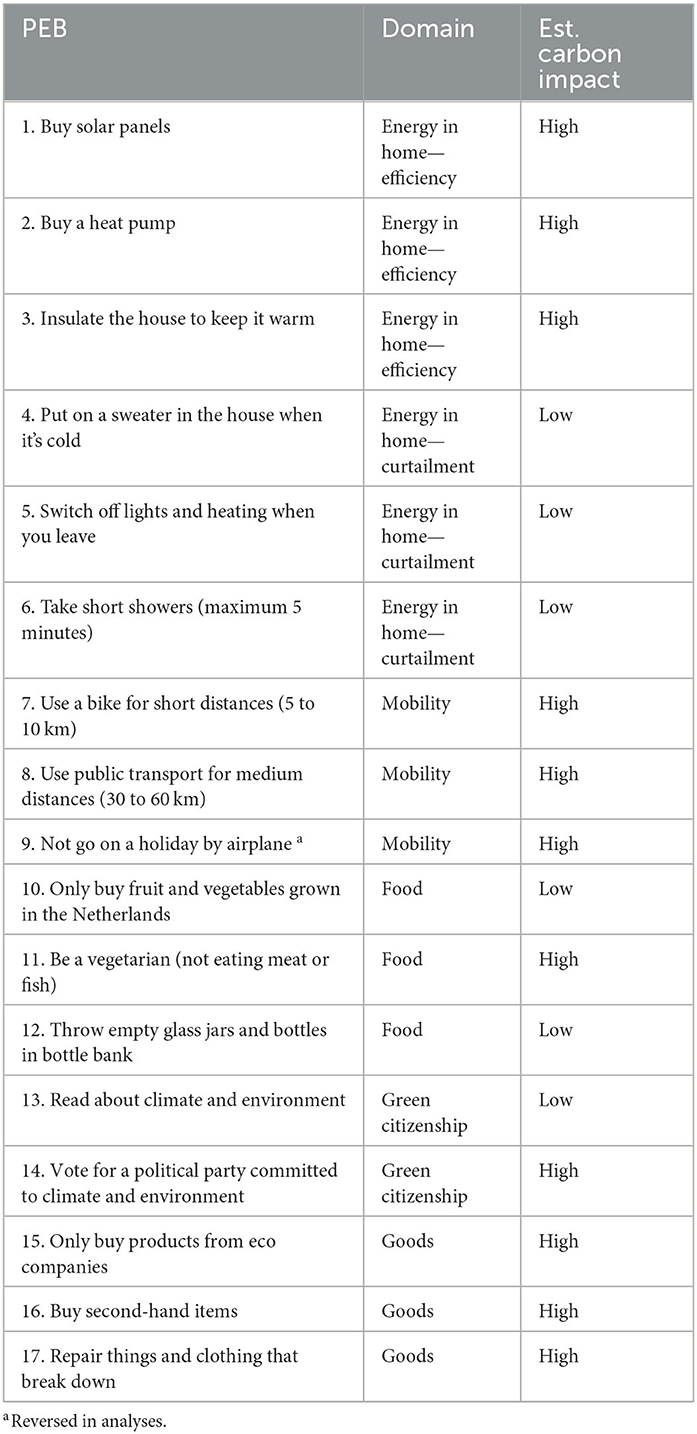
Table 1. 17 PEBs categorized in six domains, with their estimated carbon emission impact (low/high).
2.2.1.1. Clustering task
Following a procedure used by Gabe-Thomas et al. (2016), but adjusted to our quantitative study setting, respondents were asked to cluster the 17 PEBs into groups depending on how they felt behaviors naturally “went together,” and to provide a name for each cluster. Respondents were instructed that they could cluster the cards in any manner they wished provided they made a minimum of one and a maximum of eight groups. On average respondents defined six clusters in the studies by Gabe-Thomas et al. (2016) and by Kneebone et al. (2018). Since we included fewer behaviors than previous studies, we expected that a maximum of eight would suffice.
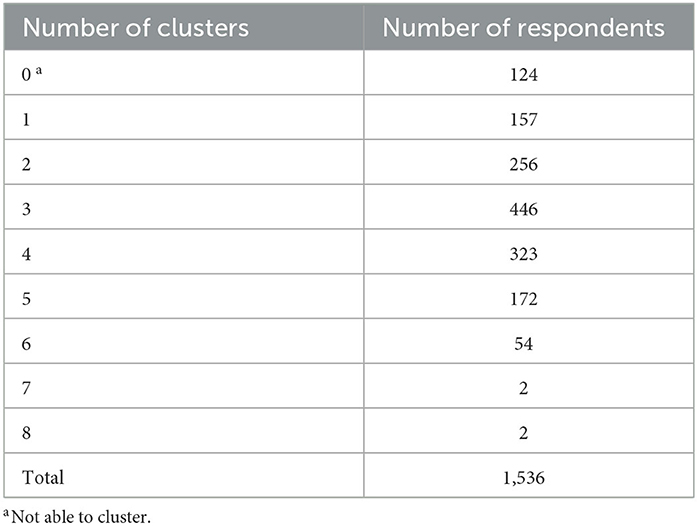
After forming each cluster, respondents were asked to provide names to describe its contents. 124 (8%) of the respondents indicated they were not able to cluster the behaviors and were excluded from the analyses (see Table 2). The modal number of groups the remaining 1,412 respondents clustered the 17 PEBs into was 3 (M = 3.2, SD = 1.3). Not all respondents provided relevant names, for instance they filled in “no,” or “group 1,” or a similar name that was not explaining their clustering choice. However, since this group of 97 respondents (6%) stated to be able to cluster the behaviors, we included them in our analysis.
2.2.1.2. Performing the PEBs
Next, respondents were asked whether they performed the behaviors, on a 5-point scale from 1 (never), 2 (seldom), 3 (occasionally), 4 (often) to 5 (always). In addition, respondents could indicate they did not know. For four items, including having solar panels installed, having a heat pump installed, having their home insulated, or being a vegetarian, respondents were asked to indicate whether or not they performed this behavior, or that it was not applicable to them.
2.2.1.3. Desire to perform the PEBs
In addition, respondents were asked for each of the 17 PEBs to what extent they would desire to perform them on a 10-point scale ranging from 1 (would not like to do this at all) to 10 (would like to do this very much). If respondents had indicated on the four previous items on performance that they already had installed solar panels, a heat pump or insulation, or if they were vegetarian, the questions on their desire to perform these behaviors were skipped. For the other 13 PEBs, desire was measured, but in the analyses, we only included the desire of respondents who did never, seldomly, or only occasionally perform these PEBs.
2.2.1.4. Perceived effort of PEBs
Finally, perceived effort of each of the 17 PEBs was measured using a 10-point scale, from 1 (very much effort) to 10 (very little effort). The scale was reversed during analysis.
2.3. Analysis
A three-step combination of (a) multidimensional scaling analysis (MDS) and hierarchical cluster analysis (HCA) with (b) thematic content analysis and (c) categorical principal components analysis (CATPCA) was applied to investigate which behaviors were seen as similar and why they were seen as similar (see Kneebone et al., 2018). In addition to the confirmatory analysis, we explored the relation between how respondents cluster the PEBs and their (spillover) behavior, by means of regression analyses.
3. Results
3.1. Categorization
3.1.1. Clustering the behaviors
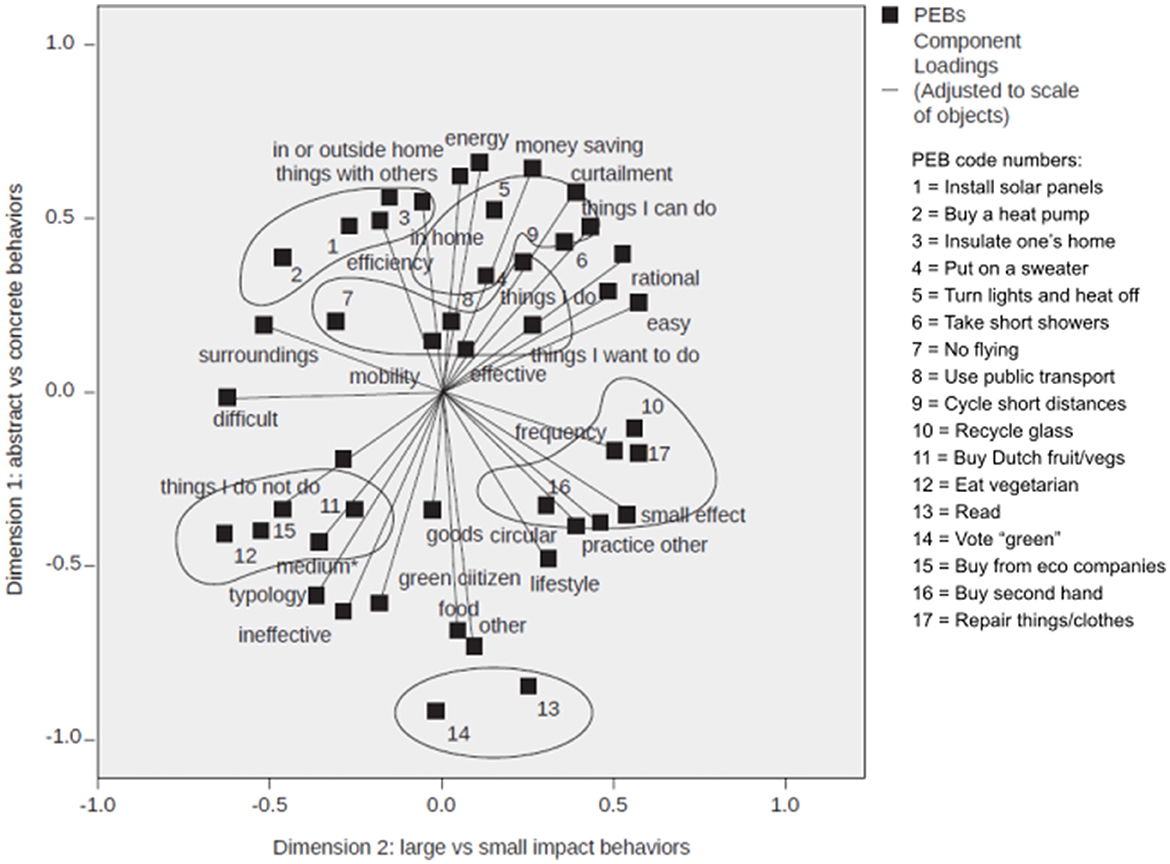
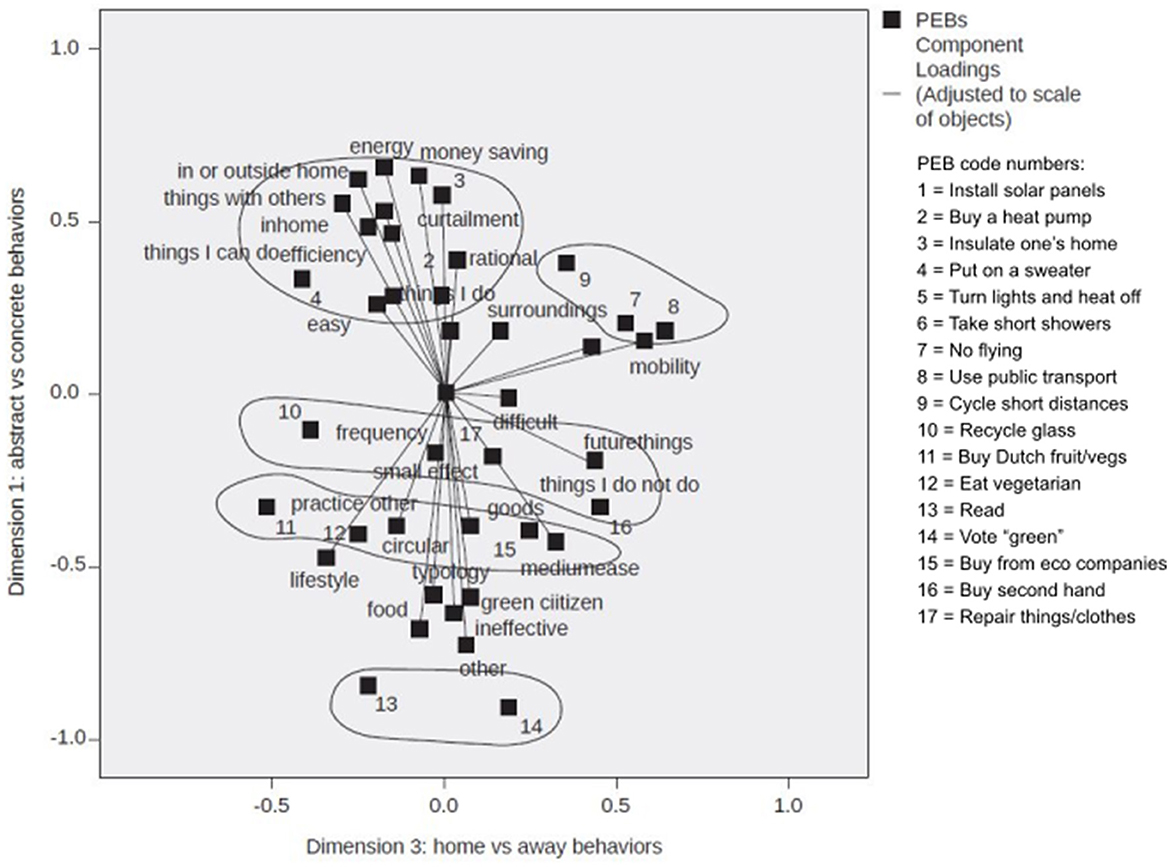
MDS can be used to find a structure in a set of distance measures between objects or cases. As we wanted to identify similar behaviors, MDS was performed on the 17 PEBs of the 1,412 respondents, based on a 17 × 17 co-occurrence matrix. The MDS analysis was carried out using the PROXSCAL option (Euclidean model) in SPSS (version 24). We tested multiple dimension options (1 to 5 dimensions) to assess the most interpretable solution, where stress-values were minimized. The results suggested a 3-dimensional orthogonal solution was optimal, with a “fair” S-stress value of 0.09 (Kruskal, 1964). A larger number of dimensions led to better stress-levels, but the accompanying scree plot showed an optimum (“elbow”) at three dimensions. The first dimension appeared to distinguish between behaviors that are known to be pro-environmental and that are quite concrete (such as insulating one's home, turning lights and heat off when you leave) and more unknown behaviors that may be perceived as more abstract (for example, voting for a “green” political party, and reading about climate and the environment). The second dimension seemed to distinguish between large impact behaviors (such as eating vegetarian food, buying products from ecological companies, buying a heat pump) and small impact behaviors (for example repair clothes and things that break, and take short showers). Finally, the third dimension seemed to distinguish between actions close to home (such as buying Dutch fruits and vegetables, putting a sweater on) and behaviors that are about going away from home (including use of public transport for 30–60 km distances, not flying when going on holiday). An overview of the loadings per dimension is added in the Supplementary Table S1.
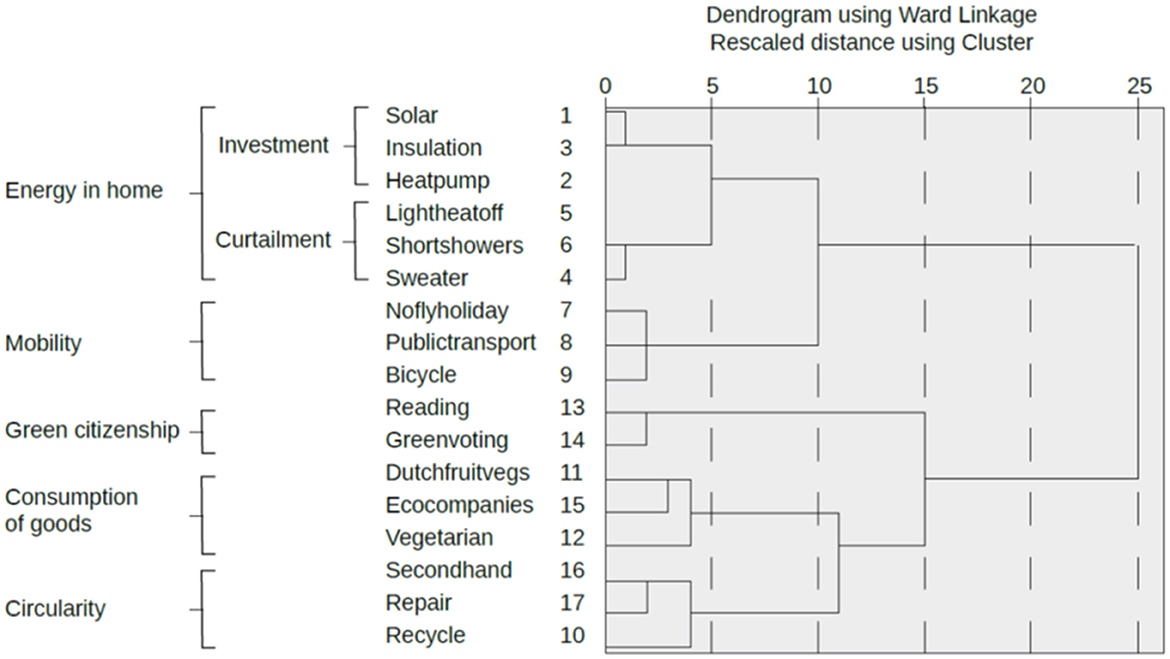
In addition to the MDS analysis aimed at finding an underlying structure of the PEBs, we used an agglomerative HCA of the co-occurrence matrix to investigate which behaviors respondents most frequently grouped together. Ward's solution provided the clearest outcome in terms of interpretability, with the shortest branches. The HCA and accompanying scree plot indicated the best result at five main clusters, of which the first could be subdivided into two sub-clusters (see Figure 1). Results showed a distinction between five main clusters (energy in home, mobility, green citizenship, consumption of goods, and circularity), and two sub-clusters (energy investment and energy curtailment). The clusters are plotted on the MDS dimensions in biplots (Figures 2, 3).
3.1.2. Naming the clusters
In addition to clustering, we analyzed the names respondents assigned to the groups they clustered, to explore why particular behaviors were placed together. We summarized names they provided into themes and constructs, by using a combination of a priori constructs from behavior categorization literature, for example, consumption domain or location, and inductively defined constructs. In total the respondents clustered and named 4,228 groups. Our thematic content analysis summarized this list into 30 descriptive constructs, arranged into 11 themes. The frequency of use of each construct was recorded in a contingency table (Table 3), showing that “Consumption domains” themed constructs made up 43% of responses. Within this theme, especially the construct of “energy” and the related constructs of “curtailment” and “efficiency” (15%), and “mobility” (10%) stand out as often applied constructs. Additionally, the constructs of “personal practice” (10%), “effectiveness” (10%), “difficulty of behavior” (10%), “lifestyle” (8%), “location” (7%), “typology” (5%), “rationality” (1%), “money savers” (1%), and “frequency of the behavior” (1%) were used. Around 5% of the descriptions (“other”) did not fall within any one of these themes.
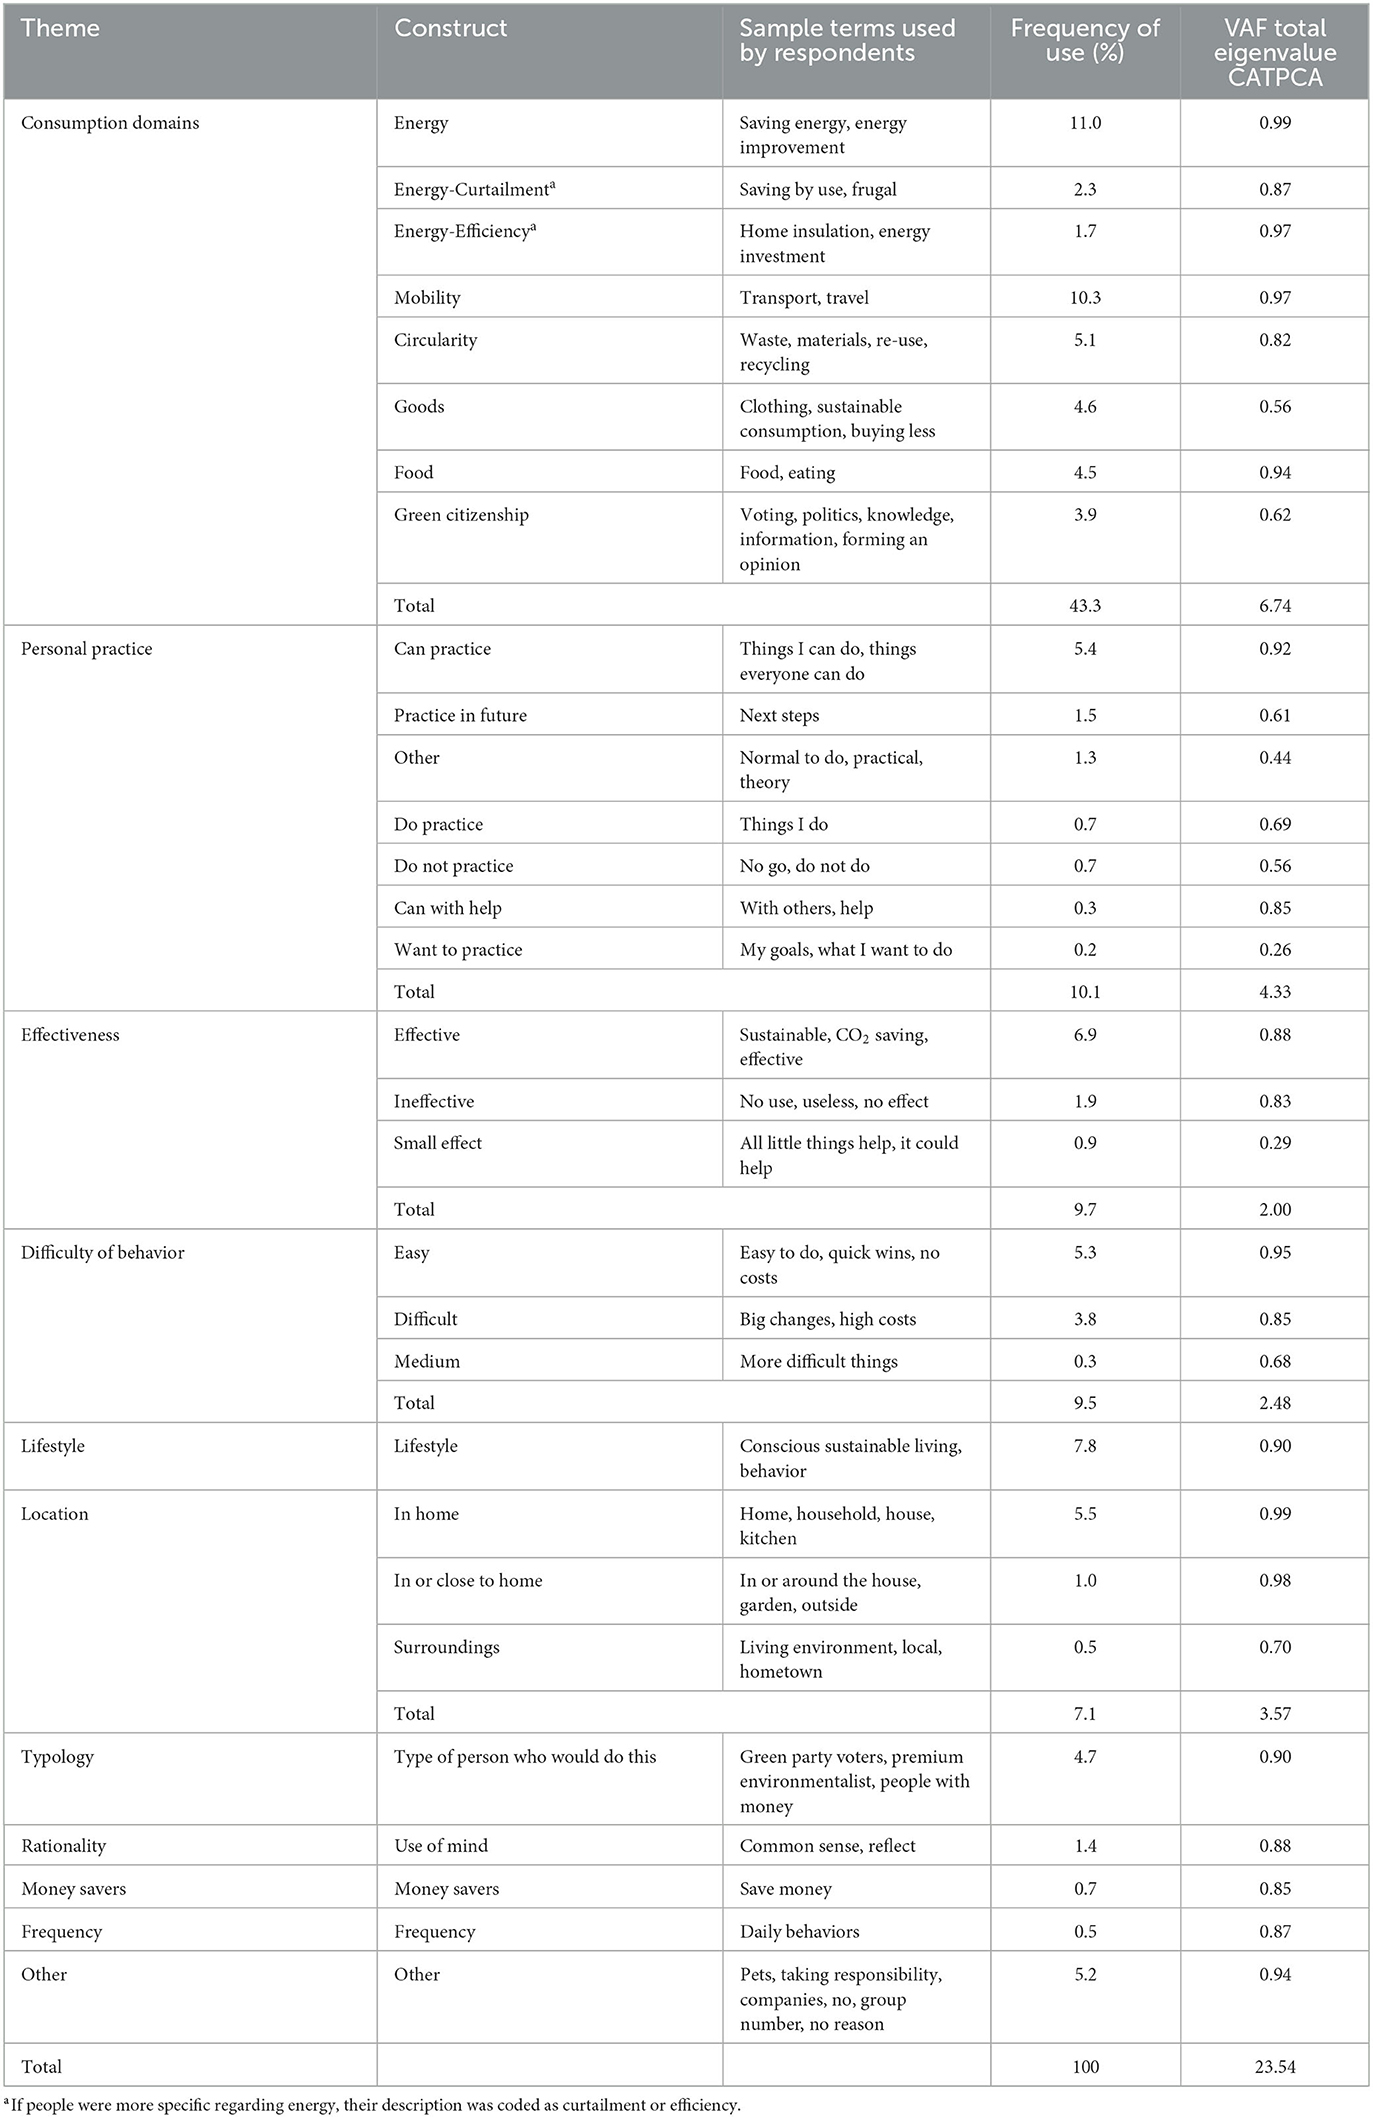
Table 3. Contingency table of proportional frequency of constructs used by respondents when describing clusters of similar behaviors, with Variance Accounted For (VAF) in CATPCA in the final column.
Finally, the analysis showed that although consumption domains were used most often, respondents largely used a mix of clustering themes. For instance, some respondents (n = 127) used only consumption domains to describe their clusters, while a larger group (n = 693) used both domain themes and other themes.
3.1.3. Combining clustering and naming
In the final step, we combined the results on the clustering task with the names respondents provided for each of the clusters. The results from MDS and HCA, with the thematic content analysis, were linked using CATPCA. Similar to standard PCA, CATPCA reduces data dimensions into “principal components” accounting for as much of the variance in the data as possible. SPSS allows incorporation of the behavior location coordinates from the MDS analysis as a fixed configuration (Dobbie, 2013; Kneebone et al., 2018). In other words, the coordinates of PEBs obtained during the MDS analysis were used in the CATPCA. CATPCA was performed with optimal scaling and variable principal normalization, on 17 × 0 matrices containing the number of times a construct was mentioned in relation to each of the 17 PEBs. This way we could analyze why respondents grouped the PEBs, with the use of what constructs.
After testing the CATPCA on one to five dimensions, we selected a 3-dimensional solution as the most meaningful with high internal consistencies of the three factors (Cronbach's αs of, respectively 0.94, 0.92, and 0.71) accounting for 79% of variance, and 24% of eigenvalue variance (VAF). All constructs had variance larger than 0.1 and were therefore all included (see the VAF column in Table 3). PEB coordinates on the three dimensions obtained from MDS were used in the CATPCA by means of a fixed configuration.
The 30 constructs were plotted in Figures 4, 5 over the MDS dimensions and HCA clusters (displayed in Figures 2, 3). Each construct is illustrated as a vector. Vector length indicates the relative frequency of construct use (the higher the frequency, the longer the vector) and vector direction is determined by the location of the PEBs the construct was used to describe. The biplots therefore combine data illustrating which PEBs are seen as similar and why they are seen as similar. The biplots show, for example, that on the abstract/concrete dimension (dimension 1), the abstract side is related to the constructs of “ineffective,” “typology,” “other,” “food,” “green citizen,” and “lifestyle” (see Figures 4, 5). On this side we see PEBs related to goods and green citizenship. On the concrete side of the dimension the constructs of “energy,” “money saving,” “in or outside the house,” “curtailment,” “things I can do,” and “things with others” appeared. On this side PEBs were related to energy and mobility. These categories may be considered as based on activities (Kneebone et al., 2018).
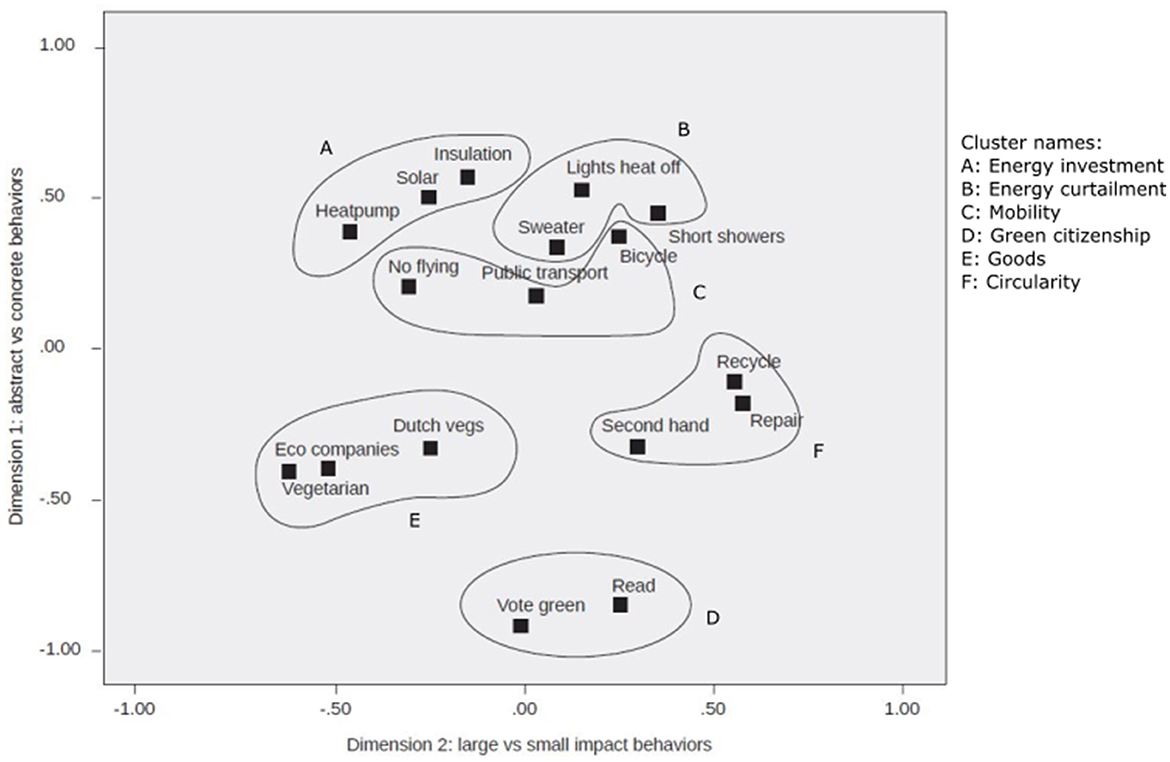
Figure 4. CATPCA biplot of constructs defining behavioral similarity, superimposed on the MDS dimensions 1 (abstract/concrete) and 2 (large/small impact), including the HCA clusters.
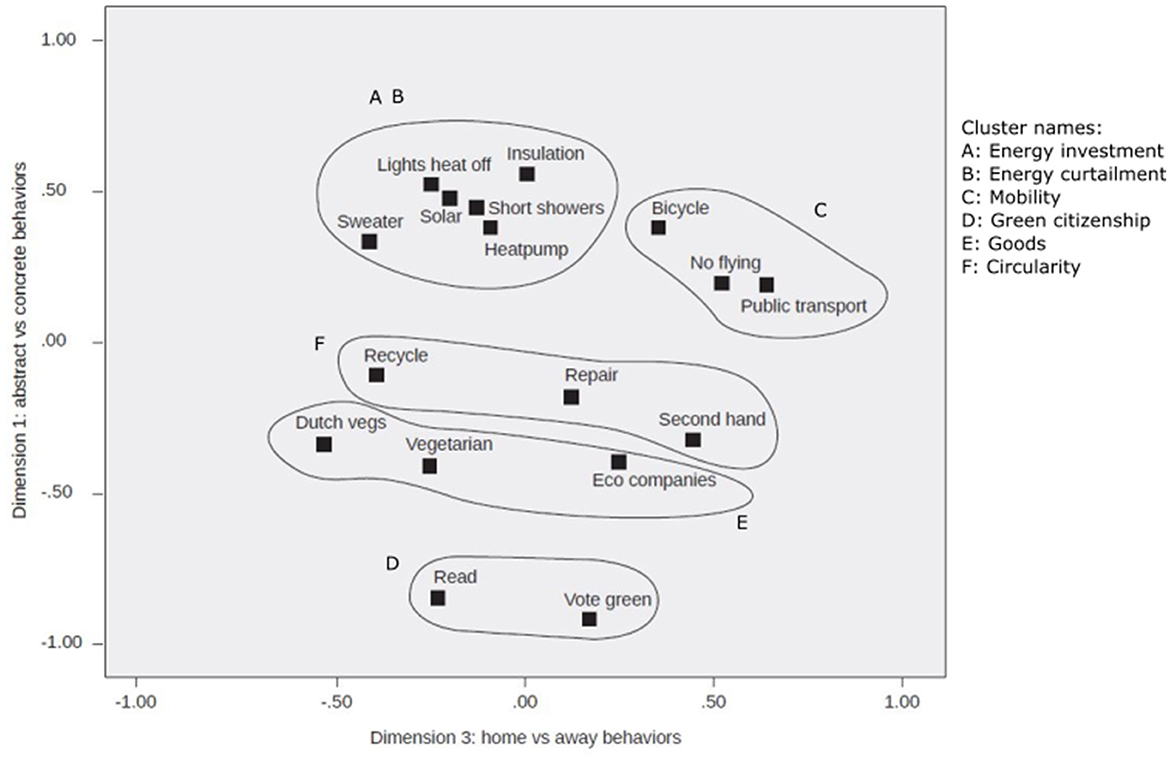
Figure 5. CATPCA biplot of constructs defining behavioral similarity, superimposed on the MDS dimensions 1 (abstract/concrete) and 3 (home/away), including the HCA clusters.
In sum, next to the consumption domain descriptions, the respondents added various constructs to the clusters. Generally speaking, the behaviors within the energy curtailment cluster were labeled as easy concrete things related to energy people can do within the home that have small effects. The behaviors within the energy investment cluster were labeled as difficult concrete things related to energy people can do, but do not do within the home. Mobility behaviors were labeled as concrete effective things related to mobility that people want to do in the future. The citizen engagement behaviors were labeled as abstract ineffective things related to food and the other category. The goods cluster behaviors were labeled as abstract difficult food and goods behaviors that are related to lifestyle. Finally, the behaviors in the circular cluster were labeled as easy, rational things that have a small impact.
Table 4 summarizes both the clustering and the naming for each of the six consumption domains. Overall, the CATPCA shows that the perception of the behaviors and clusters is richer than just naming the consumption domains. Still, the consumption domains prevail within respondents' perception.
3.2. Behavior-to-desire spillover
With insights on how respondents clustered the PEBs, we could explore the effect of clustering on positive or negative behavior-to-desire spillover within and between clusters.
3.2.1. Within-cluster spillover
Potential within- and between-cluster spillovers related to the six HCA clusters were explored. We conducted linear regression for each cluster separately to predict a respondent i's mean desire (MDij) to perform behaviors within cluster j from respondent i's total performance (TPij) of all PEBs within that same cluster (see Supplementary Table S2, Model 1). We used TP of PEBs in clusters that were already performed to predict MD of PEBs in clusters that were not yet performed. Following previous dichotomization of the same 5-point scale for the purpose of Rasch analyses (e.g., Kaiser and Lange, 2021; Dreijerink et al., 2022), we defined the item categories never, seldom, and occasionally as not performing a PEB, and often and always as performing a PEB. Per respondent TP per cluster was calculated of PEBs that were already performed and MD per cluster was calculated for PEBs that were not performed. Results showed that, except for the energy investment cluster, for all other clusters MD was significantly affected by TP. For most clusters, performing behaviors within this cluster increased respondents' desire to perform PEBs in the same cluster; this implies a potential for within-cluster spillovers. Only for the goods cluster this was not the case: the negative coefficient indicates that the more respondents already bought from eco companies, bought second-hand, or repaired things, the less they desired to act more in this way. Possibly the low desire to become a vegetarian explains this result (see Supplementary Table S3).
3.2.2. Between-cluster spillover
To investigate between-cluster effects we conducted linear regression (Equation 1) for each of the six clusters separately to predict respondents' MD to perform behaviors within the cluster from the TP of PEBs in all six clusters, with coefficients b0j (constant) and bj, with J = 6, and error term εij. Again, we used MD for PEBs that were not performed and TP for PEBs that were performed.
Results showed again within-cluster effects, but only for the mobility and goods clusters, and unlike Model 1, a significant, negative effect for the energy investment cluster (see Supplementary Table S2, Model 2). In addition, we found several effects between clusters. Figure 6A displays the significant between-cluster effects (plotted on MDS Figure 2 for recognizability). Positive (negative) coefficients in Supplementary Table S2 indicate positive (negative) spillover effects. All significant between-cluster coefficients were positive, except for the relation between the goods and circularity cluster. The green citizenship cluster appeared to be the strongest significant predictor for energy investment and the mobility clusters, and a significant predictor of the goods and circularity clusters. This result implies that when respondents read on environmental issues and vote for a political party committed to the environment, they are more inclined to perform PEBs in other clusters. The coefficients for within-cluster effects appeared not to be stronger than the coefficients for between-cluster effects; only for the goods cluster the coefficient was the strongest within its cluster. This result indicates that positive spillover effects within clusters are not necessarily stronger than between clusters. Furthermore, TP of some clusters (including energy curtailment and mobility) affected the MD to perform PEBs in other clusters (such as goods) while there were no reverse effects. This result implies that some spillover directions are more fruitful than others. For example, performing behaviors in the mobility cluster may be a steppingstone to also perform goods related behaviors. Finally, we found one negative relation: the goods cluster TP was related to a somewhat lower MD for PEBs in the circularity cluster.
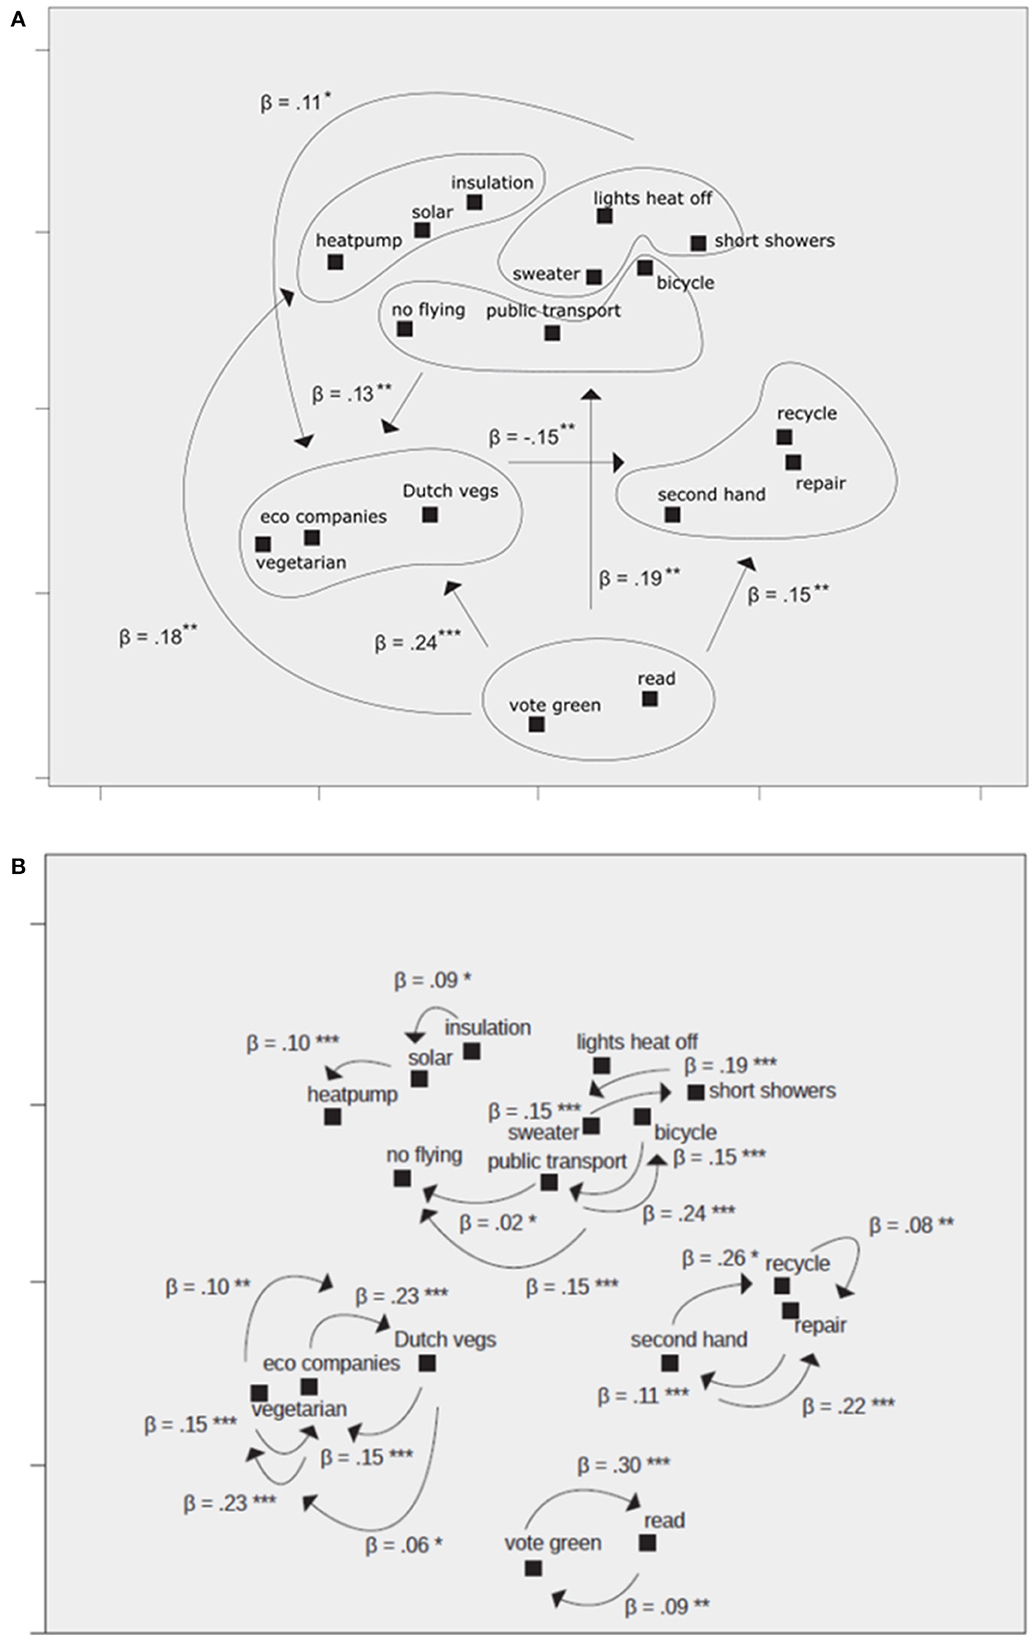
Figure 6. Significant coefficients of regression Models 2 and 3 on Desire to perform (clusters of) PEBs. (A) Between clusters. (B) Within clusters. Non-significant relations are not included but can be found in Supplementary Table S2. *p < .05. **p < .01. ***p < .001.
To gain more insight into why the energy investment cluster deviated in Model 1 we analyzed the within-cluster effects for the separate PEBs. We conducted linear regression (Equation 2) for each cluster separately to predict a respondent's desire (Dij) to perform behaviors within cluster j from the performance (Pijk) of each of the k PEBs within this cluster, with coefficients b0j (constant) and bjk, and error term εij. Only respondents who had not performed the desired behavior were included.
Within clusters, D appeared for almost all PEBs to be affected by one or more Ps (see Figure 6B). For the energy investment PEBs it was found that having solar panels increased respondents' desire to also install a heat pump and having insulated one's home increased respondents' desire to install solar panels. As the mean D for the most difficult energy behavior (only 54 respondents had installed a heat pump) was quite low (see Supplementary Table S3), this could indeed explain the negative coefficient reported in Supplementary Table S2. Overall, the results imply that performing a specific PEB within a cluster can increase desire within that cluster and may therefore lead to behavioral spillover. Moreover, the results show possible steppingstones, as performing one PEB increased desire to do another. For example, using public transport affected the desire to use one's bicycle more often and to refrain from flying. Coefficients were not significantly negative, and we thus did not find indications of potential negative spillovers within clusters.
3.2.3. Effect of the number of clusters on spillover
Finally, we explored if the number of clusters (NCLUSTER) respondents created would make a difference for the behavior-to-desire spillover. We expected that for respondents who created more clusters, and therefore might use more specific mental accounts, within-cluster and between-cluster effects would be stronger than respondents we created fewer clusters. We investigated the potential role of the number of clusters in three ways. First, we compared the variance of the error terms of respondents creating two or fewer clusters versus those creating four or more clusters by means of the Goldfeld-Quandt test (thereby leaving out the middle group of those creating 3 clusters). Two separate linear regressions (Equation 3) were conducted for each behavior, one for NCLUSTER<3 and one for NCLUSTER>3, to predict a respondent's desire (Di) to perform a behavior from the average performance (Pi1) within the relevant cluster, the average performance (Pi2) outside the relevant cluster, and perceived effort (PE) of the behavior, with coefficients b0 (constant), b1, b2 and error term εi. Only respondents who had not performed the desired behavior were included.
Since a smaller error term would be associated with a better fit of reported desires with the actual performance, we expected the residual sum of squares (RSS) to be smaller when respondents created more clusters. This appeared to be the case for eight PEBs. However, overall, corresponding F-values were small, implying that variances in both groups were similar, thus not indicating a different degree of fit. At the α = .05 level we found significant differences for three PEBs: wearing a sweater (F = 1.30), turning off lights and heating (F = 1.73), and green voting (F = 1.25). However, only for turning off lights and heating the effect was in the expected direction; that is, more clusters leading to less variance.
Second, we investigated by means of ANOVA per PEB if the absolute error terms differed depending on NCLUSTER. Absolute error terms were calculated by means of linear regression (Equation 3), only for respondents who had not performed the desired behavior. We found no significant differences, again not indicating a different degree of fit.
Third, to check if a higher number of clusters would influence the relation of performance with desires more than a smaller number of clusters, we analyzed the main effect of NCLUSTER and interaction effects of NCLUSTER and performance of all behaviors within a cluster (NCLUSTER × Pi1) and all behaviors that fell outside the cluster (NCLUSTER × Pi2). Linear regressions per PEB (Equation 3 added with the two interaction terms) showed a main effect of NCLUSTER for 12 of the 17 PEBs, implying that, as coefficients were positive, respondents who created more clusters had a higher desire to perform PEBs in the future (see Table 5). In addition, we found a significant interaction of NCLUSTER × performance within the cluster only for repairing (β = −0.126, p = 0.025), thus not indicating a strong effect of the number of clusters on the performance–desire relationship; see Table 5. The interaction between NCLUSTER × performance outside the cluster appeared significant for five of the 17 PEBs, namely install solar panels, insulate, buy from eco companies, buy Dutch fruit and vegetables, and read about environmental issues (see Table 5). In addition, average performance of PEBs outside the cluster was a significant predictor of desire for all PEBs. By combining behavior performance on multiple clusters this factor appears to be a general indicator of pro-environmental behavior.
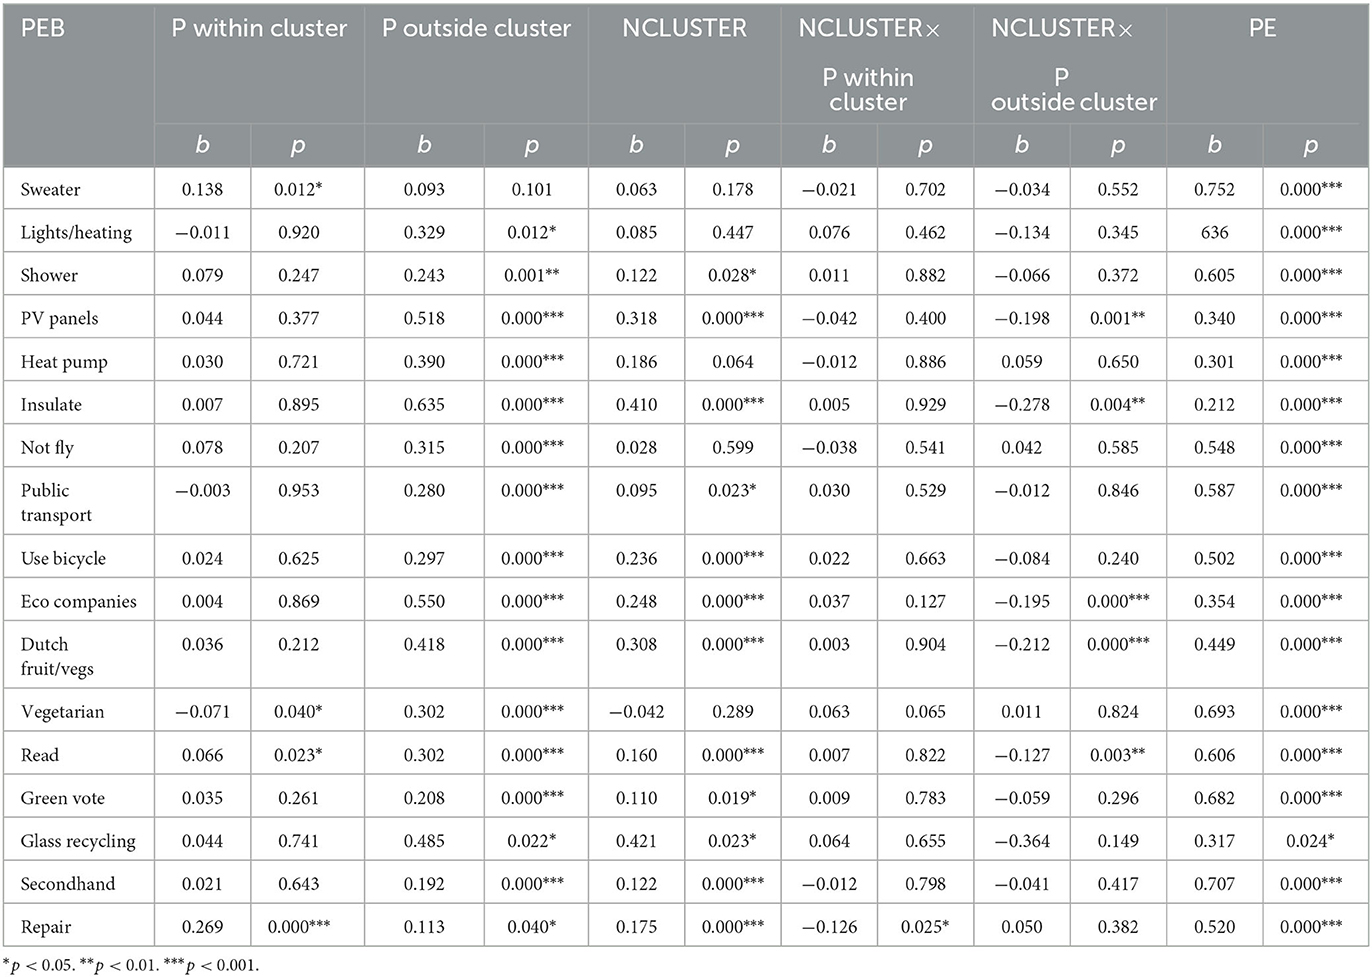
Table 5. Linear regression coefficients (standardized) of the factors Performance within a cluster, Performance outside a cluster, NCLUSTER, interactions between within and outside performance and NCLUSTER, and Perceived Effort (PE) predicting desire for each of the 17 PEBs (Model 5).
In sum, when combining the three ways of our investigation we find limited evidence that within-cluster and between-cluster effects would be stronger for respondents who defined a larger number of clusters compared to respondents who created fewer clusters.
4. Discussion
As expected, people predominantly based the similarity of PEBs on underlying (consumption) domains, but they applied several other approaches and did not exclusively follow one approach. As Thøgersen (2004) described, the degree to which two behaviors are similar in one person's mind indeed differs from the way they are perceived as similar in another's mind. Truelove and Gillis (2018) also found that people's perceptions of individual PEBs are complex and include unexpected dimensions. Although we focused our spillover analyses on similarity as domain-related, these analyses could be repeated using different definitions of similarity (such as effectiveness or practice). Here we decided to investigate the dominant way of clustering to keep our story focused. We leave the investigation of less-dominant dimensions for future research. To construct a unifying categorization model of behaviors could be of interest but will be a challenge. Regarding mental accounting, Zhang et al. (2020) described that, to construct a theoretical model of budgeting behaviors, it not only needs to be general enough to capture the widespread use of various categories but also be flexible enough to allow for differences in how broadly or narrowly people categorize.
Nevertheless, categorization into (consumption) domains prevailed, in line with our Hypothesis 1. Our findings differ from studies that point to curtailment versus efficiency behaviors as the most common distinction. People used this distinction, but it proved less important. We could, however, have included a better distinction on the curtailment/efficiency division on the other domains (such as mobility). Moreover, our findings differ from studies that identified location as an important categorization factor or that suggested that energy consumption is not an important factor in people's categorizations. PEB selection is probably an explanation for these differences: we included a broad set of PEBs incorporating various domains, while other studies focused on specific domains resulting in more detailed categorizations.
The perception of similarity of PEBs is important as it is expected that people are more inclined to act consistently pro-environmentally when behaviors are perceived as similar (and to be less inclined when behaviors are perceived as dissimilar). Our study indeed shows that when people perform behaviors within a category their desire to perform more behaviors with this category increases. However, we also identified positive spillovers between categories. Furthermore, our study showed a limited number of negative relations both within and between clusters. We therefore found no clear support for the mental accounting hypothesis of positive spillover within categories and negative spillover between categories. However, it appeared that positive behavior–desire spillovers between certain categories were more likely to occur than between others. The most promising starting point for the design of an intervention on encouraging positive spillover should therefore focus on similarity with regard to consumption domains, as many studies on spillover have indeed presumed. For some domains the strongest effects could be expected if PEB1 and PEB2 are part of the same domain, but effects could also occur between domains. Specific combinations of behaviors seem most fruitful, where one behavior can be a stepping stone that may lead to the uptake of another. We should note here that the domain of green citizenship behaviors appeared to have a stronger relation with the other domains than these other domains among themselves. Possibly voting for a political party with a green agenda, and reading about environmental issues is a stronger expression of one's pro-environmental attitude than the other consumption behaviors we included.
Finally, when people used more clusters, they had a stronger desire to perform the individual PEBs and to perform PEBs in several clusters. Creating more clusters might also have been an indication of how important people thought the subject was; that is, an expression of their pro-environmental attitude. However, the number of clusters that people used did not affect the robustness of the behavior-to-desire spillovers.
The main limitation of our study was the relatively small selection of PEBs, due to questionnaire length. We therefore did not vary all PEB domains on curtailment and efficiency, except for energy. For example, regarding the mobility domain we could have additionally included efficiency behaviors such as buying an electric car or an electric bicycle. Moreover, the number of citizen engagement behaviors we included was limited. By presenting a limited selection of PEBs the clustering of behaviors might also have been limited. In addition, we found that the majority of respondents created three clusters or less, while our categorization analysis resulted in five clusters. This difference may have affected our results on spillovers and mental accounting, as the five clusters we used as a starting point might have deviated from reality. Also, we used the average clustering performed by the respondents as representative for each respondent's idiosyncratic clustering, possibly leading to incorrect estimation of the expected spillover relationships.
Moreover, behavioral spillovers are commonly studied regarding behavior, intentions, and policy support (e.g., Maki et al., 2019). In our study we measured to what extent people desired to perform PEBs, which is different from intentions. People can for, example, want to buy from eco-companies, but not intend to because they lack the money, or they can have a desire to install solar panels, but not intend to because they rent their place. In other words, desire can be seen as something one wants without considering the practical obstacles. The relationship between desire and behavior is thus even weaker than between intentions and behavior. It is important to note that, overall, positive spillover appears to occur from PEB1s to behavioral intentions, and negative or no spillover appears to occur between PEB1s and behaviors (Maki et al., 2019; Geiger et al., 2021). Our results on behavior–desire spillover seem in line with these findings but raise the question how similarity and mental accounting would play a role or affect spillover between actual behaviors.
Finally, by focusing our investigation on perceived similarity we left out other relevant psychological phenomena related to behavioral spillover. The literature describes several other moderators, including the frame of an intervention, people's political ideology or the perceived difficulty of the PEBs. In addition, positive spillover is commonly explained by people's desire to be consistent (e.g., Festinger, 1962) and to act in line with their identity (e.g., Van Der Werff et al., 2012), while negative spillover is explained by moral licensing, that is, people feeling allowed to act immorally after an initial moral act (Miller and Effron, 2010). The interconnections between these different psychological phenomena require more investigation. For example, how people's pro-environmental identity is related to how they perceive similarity or apply mental accounting, and whether these factors would play a similar role in behavior–intention spillover compared to behavior–behavior spillover. Potentially, other factors such as perceived difficulty or motivation are more important in the behavior–behavior spillover process than in behavior–intention spillovers. These interconnections between factors were out of scope of this study but are highly relevant and need more investigation.
5. Conclusion
Many people assess the similarity of PEBs based on their belonging to specific (consumption) domains. Other ways of categorization are also applied but to a lesser extent. It is important to know how people assess the similarity of PEBs as it is expected that similarity would lead to more positive spillovers. Our study indeed shows that when people perform a behavior within a specific domain their desire to do more within this domain increases. However, in addition, we see that people who perform a behavior in a specific domain also have a higher desire to perform behaviors in other domains. Similarity, therefore, does not appear to be such an important moderator of the spillover process. Although similarity plays a role it does not constrain people to performing PEBs within one domain. Performing PEBs could thus lead to various positive feedback loops. Moreover, when people use more categories to cluster PEBs they desire to perform PEBs to a greater extent. This implies that having multiple accounts is associated with more pro-environmental desires and possibly behaviors. However, using several categories does not make people more susceptible to spillover. Future interventions can be based on these insights.
Data availability statement
The datasets presented in this study can be found in online repositories. The names of the repository/repositories and accession number(s) can be found below: https://osf.io/qxg6j/?view_only=8f2971e51e9444e6b421b7f5c78221a3.
Ethics statement
Ethical approval was not required for the studies involving humans because of our institutes' guidelines that state that no specific approval by the Ethical Committee is needed when the general procedure is carefully followed. The studies were conducted in accordance with the local legislation and institutional requirements. The participants provided their written informed consent to participate in this study.
Author contributions
LD, MH, and GA contributed to conception and design of the study. LD organized the data collection. Statistical analysis was performed by LD in collaboration with MH and GA. A first draft of the manuscript was written by LD. All authors contributed to manuscript revisions and read and approved the submitted version.
Acknowledgments
At the time of data collection LD was employed as a researcher at the Netherlands Organization for applied scientific research (TNO). We would like to thank TNO for providing the opportunity to include this study in an ongoing survey.
Conflict of interest
LD was employed as a researcher at TNO at the time of data collection.
The remaining authors declare that the research was conducted in the absence of any commercial or financial relationships that could be construed as a potential conflict of interest.
Publisher's note
All claims expressed in this article are solely those of the authors and do not necessarily represent those of their affiliated organizations, or those of the publisher, the editors and the reviewers. Any product that may be evaluated in this article, or claim that may be made by its manufacturer, is not guaranteed or endorsed by the publisher.
Supplementary material
The Supplementary Material for this article can be found online at: https://www.frontiersin.org/articles/10.3389/frbhe.2023.1226590/full#supplementary-material
References
Antonides, G., Groot, D. e., and Van Raaij, I. M. (2011). Mental budgeting and the management of household finance. J. Econ. Psychol. 32, 546–555. doi: 10.1016/j.joep.04001
Arnold, O., Kibbe, A., Hartig, T., and Kaiser, F. G. (2018). Capturing the environmental impact of individual lifestyles: evidence of the criterion validity of the general ecological behaviour scale. Environ. Behav. 50, 350–372. doi: 10.1177/0013916517701796
Baca-Motes, K., Brown, A., Gneezy, A., Keenan, E. A., and Nelson, L. D. (2013). Commitment and behavior change: evidence from the field. J. Cons. Res. 39, 1070–84. doi: 10.1086./667226
Bernard, H. R., Ryan, G. W., and Borgatti, S. P. (2009). “Green cognition and behaviour: a cultural domain analysis,” in Networks, Resources and Economic Action, eds C. Greiner and W. Kokot. (Berlin: Dietrich Reimer Verlag), 189–215.
Boudet, H. S., Flora, J. A., and Armel, K. C. (2016). Clustering household energy-saving behaviours by behavioural attribute. Energy Policy 92, 444–454. doi: 10.1016/j.enpol.02033
Bratt, C. (1999). The impact of norms and assumed consequences on recycling behaviour. Environ. Behav. 31, 630–656. doi: 10.1177/00139169921972272
Brendl, M. C., Markman, A. B., and Higgins, E. T. (1998). Mental accounting as self-regulation: representativeness to goal-derived categories. Zeitschrift für Sozial Psychol. 29, 89–104.
Carrico, A. R. (2021). Climate change, behavior, and the possibility of spillover effects: recent advances and future directions. Curr. Opin. Behav. Sci. 42, 76–82. doi: 10.1016/j.cobeha.03.025.
Chatelain, G., Hille, S. L., Sander, D., Patel, M., Hahnel, U. J. J., Brosch, T., et al. (2018). Feel good, stay green: positive affect promotes pro-environmental behaviours and mitigates compensatory “mental bookkeeping” effects. J. Environ. Psychol. 56, 3–11. doi: 10.1016/j.jenvp.02, 002.
Dobbie, M. F. (2013). Public aesthetic preferences to inform sustainable wetland management in Victoria, Australia. Landscape and Urban Plann. 120, 178–189. doi: 10.1016/j.landurbplan.08018
Dolan, P., and Galizzi, M. M. (2015). Like ripples on a pond: behavioural spillovers and their implications for research and policy. J. Econ. Psychol. 47, 1–16. doi: 10.1016/j.joep.12003
Dreijerink, L., Handgraaf, M., and Antonides, G. (2021). Rationalizing inconsistent consumer behavior. Understanding pathways that lead to negative spillover of pro-environmental behaviors in daily Life. Front. Psychol. 12, 583596. doi: 10.3389/fpsyg.2021.583596
Dreijerink, L., Handgraaf, M., and Antonides, G. (2022). The impact of personal motivation on perceived effort and performance of pro-environmental behaviors. Front. Psychol. 13, 7471. doi: 10.3389./fpsyg.2022.977471
Fujii, S. (2006). Environmental concern, attitude toward frugality, and ease of behaviour as determinants of pro-environmental behaviour intentions. J. Environ. Psychol. 26, 262–268. doi: 10.1016/j.jenvp.2006.09.003
Gabe-Thomas, E., Walker, I., Verplanken, B., and Shaddick, G. (2016). Householders' mental models of domestic energy consumption: using a sort-and-cluster method to identify shared concepts of appliance similarity. PLoS ONE 11, e0158949. doi: 10.1371/journal.pone.0158949
Gatersleben, B., Steg, L., and Vlek, C. (2002). Measurement and determinants of environmentally significant consumer behaviour. Environ. Behav. 34, 335–362. doi: 10.1177/0013916502034003004
Geiger, S. J., Brick, C., Nalborczyk, L., Bosshard, A., and Jostmann, N. B. (2021). More green than gray? Toward a sustainable overview of environmental spillover effects: a Bayesian meta-analysis. J. Environ. Psychol. 78, 1694. doi: 10.1016./j.jenvp.2021.101694
Geng, L., Cheng, X., Tang, Z., Zhou, K., and Ye, L. (2016). Can previous pro-environmental behaviours influence subsequent environmental behaviours? The licensing effect of pro-environmental behaviours. J. Pacific Rim Psychol. 10, 6. doi: 10.1017./prp.2016.6
Gneezy, A., Imas, A., Brown, A., Nelson, L. D., and Norton, M. I. (2012). Paying to be nice: consistency and costly prosocial behavior. Manag. Sci. 58, 179–187. doi: 10.1287/mnsc.1110.1437
Hahnel, U. J., Chatelain, G., Conte, B., Piana, V., and Brosch, T. (2020). Mental accounting mechanisms in energy decision-making and behaviour. Nat. Energy 5, 952–958. doi: 10.1038/s41560-020-00704-6
Heath, C., and Soll, J. B. (1996). Mental budgeting and consumer decisions. J. Cons. Res. 23, 40–52. doi: 10.1086/209465
Juhl, H. J., Fenger, M. H., and Thøgersen, J. (2017). Will the consistent organic food consumer step forward? An empirical analysis. J. Consumer Res. 44, 519–535. doi: 10.1093/jcr/ucx052
Kaiser, F. G. (1998). A general measure of ecological behaviour. J. Appl. Soc.Psychol. 28, 395–422. doi: 10.1111/j.1559-1998tb01712.x
Kaiser, F. G., and Lange, F. (2021). Offsetting behavioral costs with personal attitude: identifying the psychological essence of an environmental attitude measure. J. Environ. Psychol. 75, 101619. doi: 10.1016/j.jenvp.2021.101619
Kneebone, S., Fielding, K., and Smith, L. (2018). It's what you do and where you do it: Perceived similarity in household water saving behaviours. J. Environ. Psychol. 55, 1–10. doi: 10.1016/j.jenvp.10007
Koch, A. K., and Nafziger, J. (2016). Goals and bracketing under mental accounting. J. Econ. Theory 162, 305–351. doi: 10.1016/j.jet.01001
Krishnamurthy, P., and Prokopec, S. (2010). Resisting that triple-chocolate cake: mental budgets and self-control. J. Consumer Res. 37, 68–79. doi: 10.1086/649650
Kruskal, J. B. (1964). Multidimensional scaling by optimizing goodness of fit to a non-metric hypothesis. Psychometrika 29, 1–23. doi: 10.1007/BF02289565
Lacasse, K. (2016). Don't be satisfified, identify! Strengthening positive spillover by connectingpro-environmental behaviors to an “environmentalist” label. J. Environ. Psychol. 48, 149–158. doi: 10.1016/j.jenvp.2016.09.006
Lanzini, P., and Thøgersen, J. (2014). Behavioural spillover in the environmental domain: an intervention study. J. Environ. Psychol. 40, 381–390. doi: 10.1016/j.jenvp.2014.09.006
Maki, A., Carrico, A. R., Raimi, K. T., Truelove, H. B., Araujo, B., Yeung, K. L., et al. (2019). Meta-analysis of pro-environmental behaviour spillover. Nat. Sustain. 2, 307–315. doi: 10.1038/s41893-019-0263-9
Margetts, E. A., and Kashima, Y. (2017). Spillover between pro-environmental behaviours: the role of resources and perceived similarity. J. Environ. Psychol. 49, 30–42. doi: 10.1016/j.jenvp.07005
Meadows, D. H. (1999). Leverage Points: Places to Intervene in a System. Hartland, VT: The Sustainability Institute.
Milieu Centraal (2019). Information on Environmental Impact of Energy Saving, Mobility Choices, Food Consumption. Available online at: www.milieucentraal.nl (accessed July 12, 2019).
Miller, D. T., and Effron, D. A. (2010). Psychological license: when it is needed and how it functions. Adv. Exp. Soc. Psychol. 43, 115–155. doi: 10.1016/S0065-2601(10)43003-8
Nash, N., Whitmarsh, L., Capstick, S., Hargreaves, T., Poortinga, W., Thomas, G., et al. (2017). Climate-relevant behavioural spillover and the potential contribution of social practice theory. WIREs Clim. Change 8, e481. doi: 10.1002/wcc.481
Nash, N., Whitmarsh, L., Capstick, S., Thøgersen, J., Gouveia, V., Carvalho Rodrigues Araújo, d. e. X, et al. (2019). Reflecting on behavioural spillover in context: How do behavioural motivations and awareness catalyse other environmentally responsible actions in Brazil, China, and Denmark? Front. Psychol. 10, 788. doi: 10.3389/fpsyg.2019.00788
Nielsen, K. S., Nicholas, K. A., Creutzig, F., Dietz, T., and Stern, P. C. (2021). The role of high- socioeconomic-status people in locking in or rapidly reducing energy-driven greenhouse gas emissions. Nat. Energy 6, 1011–1016. doi: 10.1038/s41560-021-00900-y
Nilsson, A., Bergquist, M., and Schultz, W. P. (2017). Spillover effects in environmental behaviours, across time and context: a review and research agenda. Environ. Edu. Res. 23, 573–589. doi: 10.1080/13504622.2016.1250148
Otto, I. M., Donges, J. F., Cremades, R., Bhowmik, A., Hewitt, R. J., Lucht, W., et al. (2020). Social tipping dynamics for stabilizing Earth's climate by 2050. Proceed. Nat. Acad. Sci. 117, 2354–2365. doi: 10.1073/pnas.1900577117
Paul, I., Parker, J., and Loughran Dommer, S. (2018). “Don't forget the accountant: role-integration increases the fungibility of mentally accounted resources,” in Advances in Consumer Research Volume, eds A. Gershoff, R. Kozinets and T.White (Duluth, MN: Association for Consumer Research), 46, 237–241.
Penz, E., Hartl, B., and Hofmann, E. (2019). Explaining consumer choice of low carbon footprint goods using the behavioural spillover effect in German-speaking countries. J. Clean. Prod. 214, 429–439. doi: 10.1016/j.jclepro.12270
Schütte, L., and Gregory-Smith, D. (2015). Neutralisation and mental accounting in ethical consumption: the case of sustainable holidays. Sustainability 7, 7959–7972. doi: 10.3390/su7067959
Steinhorst, J., and Matthies, E. (2016). Monetary or environmental appeals for saving electricity? Potentials for spillover on low carbon policy acceptability. Energy Policy 93, 335–344. doi: 10.1016/j.enpol.03020
Stern, P. (2000). Toward a coherent theory of environmentally significant behavior. J. Soc. Iss. 56, 407–424. doi: 10.1111/0022-4537.00175
Thaler, R. H. (1980). Toward a positive theory of consumer choice. J. Econ. Behav. Org. 1, 39–60. doi: 10.1016/0167-2681(80)90051-7
Thaler, R. H. (1999). Mental accounting matters. J. Behav. Dec. Mak. 12, 183–206. doi: 10.1002/(SICI)1099-0771(199909)12:3<183::AID-BDM318>3.0.CO;2-F
Thøgersen, J. (1999). Spillover processes in the development of a sustainable consumption pattern. J. Econ. Psychol. 20, 53–81. doi: 10.1016/S0167-4870(98)00043-9
Thøgersen, J. (2004). A cognitive dissonance interpretation of consistencies and inconsistencies in environmentally responsible behaviour. J. Environ. Psychol. 24, 93–103. doi: 10.1016/S0272-4944(03)00039-2
Thøgersen, J., and Crompton, T. (2009). Simple and painless? The limitations of spillover in environmental campaigning. J. Consumer Policy 32, 141–163. doi: 10.1007/s10603-009-9101-1
Thøgersen, J., and Ölander, F. (2003). Spillover of environment-friendly consumer behaviour. J. Environ. Psychol. 23, 225–236. doi: 10.1016/S0274944(03)00018-5
Tiefenbeck, V., Staake, T., Roth, K., and Sachs, O. (2013). For better or for worse? Empirical evidence of moral licensing in a behavioural energy conservation campaign. Energy Policy 57, 160–171. doi: 10.1016/j.enpol.01.021.
Truelove, H. B., Carrico, A. R., Weber, E. U., Raimi, K. T., and Vandenbergh, M. P. (2014). Positive and negative spillover of pro-environmental behaviour: an integrative review and theoretical framework. Global Environ. Change 29, 127–138. doi: 10.1016/j.gloenvcha.09004
Truelove, H. B., and Gillis, A. J. (2018). Perception of pro-environmental behaviour. Global Environ. Change 49, 175–185. doi: 10.1016/j.gloenvcha.02009
Truelove, H. B., Yeung, K. Y., Carrico, A. R., Gillis, A. J., and Raimi, K. T. (2016). From plastic bottle recycling to policy support: An experimental test of pro-environmental spillover. Journal of Environ. Psychol. 46, 55–66. doi: 10.1016/j.jenvp.03004
Van Der Werff, E., and Steg, L. (2018). Spillover benefits: emphasizing different benefits of environmental behaviour and its effects on spillover. Front. Psychol. 9, 2347. doi: 10.3389/fpsyg.2018.02347
Van Der Werff, E., Steg, L., and Keizer, K. (2012). The value of environmental self-identity: the relationship between biospheric values, environmental self-identity and environmental preferences, intentions and behaviour. J. Environ. Psychol. 34, 55–63. doi: 10.1016/j.jenvp.12006
Weber, E. U. (1997). “Perception and expectation of climate change: precondition for economic and technological adaptation,” in Psychological Perspectives to Environmental and Ethical Issues in Management, eds M. Bazerman, D. Messick, A. Tenbrunsel and K.Wade-Benzoni (San Francisco, CA: Jossey-Bass), 314–341.
Werfel, S. H. (2017). Household behaviour crowds out support for climate change policy when sufficient progress is perceived. Nat. Clim. Change 7, 512–515. doi: 10.1038/nclimate3316
Whitmarsh, L., and O'Neill, S. (2010). Green identity, green living? The role of pro-environmental self-identity in determining consistency across diverse pro-environmental behaviours. J. Environ. Psychol. 30, 305–314. doi: 10.1016/j.jenvp.01003
Xu, L., Zhang, X., and Ling, M. (2018). Spillover effects of household waste separation policy on electricity consumption: evidence from Hangzhou, China. Res. Conserv. Recycl. 129, 219–231. doi: 10.1016/j.resconrec.1028
Keywords: perceived similarity, mental accounting, behavior-to-desire spillovers, MDS, hierarchical cluster analysis, thematic content analysis, CATPCA
Citation: Dreijerink L, Handgraaf M and Antonides G (2023) Does perceived similarity of pro-environmental behaviors lead to behavioral spillover? Front. Behav. Econ. 2:1226590. doi: 10.3389/frbhe.2023.1226590
Received: 21 May 2023; Accepted: 08 September 2023;
Published: 29 September 2023.
Edited by:
Ximeng Fang, University of Oxford, United KingdomReviewed by:
Raisa Sherif, Max Planck Institute for Tax Law and Public Finance, GermanyFilippos Exadaktylos, Loyola Andalusia University, Spain
Copyright © 2023 Dreijerink, Handgraaf and Antonides. This is an open-access article distributed under the terms of the Creative Commons Attribution License (CC BY). The use, distribution or reproduction in other forums is permitted, provided the original author(s) and the copyright owner(s) are credited and that the original publication in this journal is cited, in accordance with accepted academic practice. No use, distribution or reproduction is permitted which does not comply with these terms.
*Correspondence: Lieke Dreijerink, bGlla2VkcmVpamVyaW5rQGdtYWlsLmNvbQ==
 Lieke Dreijerink
 Michel Handgraaf
 Gerrit Antonides