 Benjamin Prissé1,2*
- 1LoyolaBehLab, Universidad Loyola Andalucía, Sevilla, Spain
- 2Singapore University of Technology and Design, Singapore, Singapore
We introduce the Visual Continuous Time Preferences (VCTP) task, a new tool for measuring time preferences that synthesizes the simplicity of Multiple Price List (MPL) and the precision of Convex Time Budget (CTB) tasks thanks to the use of a simple visualization. We evaluate VCTP in a lab experiment by comparing it to MPL using the same experimental design. Results suggest that VCTP effectively measures time preferences and enhances their precision without increasing task time or decreasing subject consistency. We also find that the BRIS payment scheme has an impact on outcomes, compared to hypothetical and real payments. We conclude that visual experiments can effectively measure economic preferences.
Classification codes: C91, C93, D15.
1. Introduction
Human decision-making often involves inter-temporal outcomes, encompassing choices ranging from daily actions like consumption or saving to long-term decisions with significant consequences, such as buying a house or raising a family. The economic literature consistently associates higher levels of patience with improved decision-making. Numerous studies have demonstrated that patient individuals tend to achieve better educational outcomes (Duckworth and Seligman, 2005; Kirby et al., 2005; Golsteyn et al., 2014; Non and Tempelaar, 2016; Castillo et al., 2019), make sounder financial decisions (Ashraf et al., 2006; Meier and Sprenger, 2010, 2013; Tanaka et al., 2010; Epper et al., 2020), and exhibit higher cognitive abilities (Frederick, 2005; Burks et al., 2009; Dohmen et al., 2010; Bosch-Domènech et al., 2014). In contrast, impatient individuals tend to make poorer health decisions (Kirby et al., 1999; Borghans and Golsteyn, 2006; Chabris et al., 2008; Sutter et al., 2013) and exhibit greater impatience when it comes to primary rewards (McClure et al., 2004, 2007; Reuben et al., 2010). The time preferences of individuals lie at the heart of these decision-making processes, making it crucial for economists and policymakers to estimate them accurately. Two primary methods have been commonly employed to elicit time preferences: the Multiple Price List (MPL) developed by Coller and Williams (1999) and the Convex Time Budget (CTB) introduced by Andreoni and Sprenger (2012). However, these studies primarily focus on selecting between monetary numerical amounts and omit the crucial visual aspect inherent in decision-making. This paper aims to bridge this gap in the literature by introducing the Visual Continuous Time Preferences (VCTP) task. In this task, subjects do not choose between monetary numerical amounts but instead select visual representations of these amounts.
Coller and Williams (1999) created the Multiple Price List (MPL) task as the first measurement tool for time preferences. In this task, participants are presented with 15 choices between a fixed amount of money at an earlier date and a progressively larger amount of money at a later date. Subjects should initially choose money at the early date and then transition to the later date, which provides a range of values for their discount rate. The estimated annual interest rates ranging from 17.5% to 20% were found to align with market borrowing rates, establishing the MPL task as the gold standard for measuring time preferences. Harrison et al. (2002) further demonstrated the utility of the MPL tool. The first study showcased the robustness of the task outside of the laboratory by examining field populations. Subjects answered four Multiple Price List (MPL) tasks, each comprising of 20 choices across various time intervals (6, 12, 24, and 36 months). The overall discount rate was estimated to be 28.1%. Andersen et al. (2006) shed light on the limitations of the MPL methodology. First, it estimates an interval of potential value and not a point valuation. Second, subjects can switch back to the present after switching to the future. Subjects exhibiting this behavior would be considered inconsistent because choosing to wait for future money at one interest rate implies that one should also wait for future money at all higher interest rates. Third, subjects might exhibit a bias toward selecting options in the middle range. To address these concerns, the researchers proposed a two-part mechanism known as the iterative MPL (iMPL). The first part, called the switching MPL (sMPL), enforces consistency by allowing subjects to indicate at which choice they switch to future choices. The second part asks subjects to play another MPL with interest rates between their last present choice and their first future choice. The results indicated that the iMPL estimates similar discount rates while enhancing measurement precision by reducing the estimated interval size. This finding suggests the utilization of measurement tools that offer increased precision with minimal additional costs.
Andreoni and Sprenger (2012) (AS thereafter) attracted much attention by creating the Convex Time Budget (CTB) in this philosophy. Subjects respond to budget choices involving three different delays before early payment (0, 7, and 35 days) and three waiting times between the early payment date and the later payment date (35, 70, and 98 days). Consequently, we have a total of nine temporal combinations, with participants answering five budget choices within each combination, resulting in a comprehensive total of 45 budget choices. In each choice, subjects are provided with 100 tokens and must decide whether to allocate each token to the later date at a value of $0.20 or to the early date at a lower value ranging from $0.13 to $0.19. These value options correspond to interest rates ranging from 20.5 to 1,300% over a one-year period. The results established the validity of CTB by estimating that subjects exhibit a discount rate of 30% over a one-year period. In a subsequent study, Andreoni et al. (2015) suggested that CTB is a better elicitation method than MPL. They conducted a comparison between a simplified version of CTB and the Double MPL introduced by Andersen et al. (2008), which corrects time preferences with risk preferences. The findings indicated that both methods demonstrated good predictive accuracy for their respective results. However, when it came to predicting the results of the other method, CTB outperformed the Double MPL with an 86% accuracy compared to 16%. This further supports the idea that measurement tools providing enhanced precision at minimal additional costs are desirable.
However, the enhanced precision offered by CTB comes with associated costs, including the need for a computer-equipped laboratory and a considerable amount of time to complete the measurement. Prissé and Jorrat (2022) found that laboratory participants took an average of 2.3 min to complete the MPL task, while the CTB task required 18.5 min. Furthermore, when applying the same consistency criteria as MPL, only 30% of subjects demonstrated consistency, with the majority consistently allocating all tokens to either the early or late payment date. This indicates that subjects struggle to use the additional precision of CTB effectively. Field experiments addressed these limitations by simplifying CTB with visual tools. Delays were visually represented through colored backgrounds, payoffs were visualized using coins, bank notes, or pie charts, and allocations were determined by methods such as placing beans into bowls or using a slider (Carvalho et al., 2016; Aycinena and Rentschler, 2018; Giné et al., 2018; Balakrishnan et al., 2020; Bartoš et al., 2021). Angerer et al. (2015) were the first to use a fully visual design to adapt MPL and CTB to children. MPL used colors to represent waiting times and coin symbols for payoffs, while CTB asked subjects to draw tokens inside boxes representing present and future periods. Both measures yielded similar results, suggesting the methodological pertinence of visual experiment with teenagers. Recently, Alfonso et al. (2023) provided additional evidence that visual experiments increase the quality of results, particularly in terms of consistency in the risk preferences task. These findings warrant further investigation into the validity of visual experiments with adult populations.
The purpose of this paper is precisely to validate the use of visual experiments with adults. We do this by creating a new task integrating the small amount of time and high consistency of MPL with the precision of CTB thanks to a simple visual representation. We therefore call our task Visual Continuous Time Preferences (VCTP). The aim of this paper is to validate this tool in the lab. The VCTP successfully passed the test, since subjects used the additional precision of interior solutions without increasing response time or decreasing the consistency of answers. We interpret these results as validating the use of the visual methodology.
The rest of the paper is organized as follows: Section 2 presents the experimental design, Section 3 describes the methods used in this paper, including the experimental design, the questions to be addressed and the econometric approach. Section 4 examines the balance between samples of subjects, Section 5 presents the results and Section 6 provides the conclusion.
2. Methods
2.1. Experimental design
The key feature of our design is the use of a visual representation with ten coins instead of a list. We use two experimental treatments that are identical except for one key difference:
• MPL: subjects are forced to allocate all the coins either to the present or to the future.
• VCTP: subjects are allowed to allocate each coin to the present or to the future.
The first treatment uses the MPL mechanism adapted to our experimental design. The second treatment is similar to the first one but with the additional rule of allowing subjects to allocate to both the present and the future, which corresponds to the CTB mechanism (interior allocations). Hence, letting subjects make interior allocations is the treatment.1
It is important to mention that subjects completed both treatments. Half of the subjects answered MPL before VCTP in the MPL treatment, while the other half answered VCTP before MPL in the VCTP treatment. We only take into account the first task answered by subjects in the analysis, resulting in a between-subject design.
Visual representation: In AS, subjects have 100 tokens and allocate each of them to the present or the future for each budget decision. In our experiment, we reduced the task to a 10-choice space for the sake of concision. Figure 1 displays an example of such decision space. Each choice space comprises a solid line circle representing one euro in the present, and a dotted circle representing the monetary bonus associated with waiting one week at the current interest rate. The cross inside the circle is used by subjects to indicate their choice by marking it in blue for present or in red for future. The circles are arranged in the most homogeneous way possible to avoid any disposal effects.
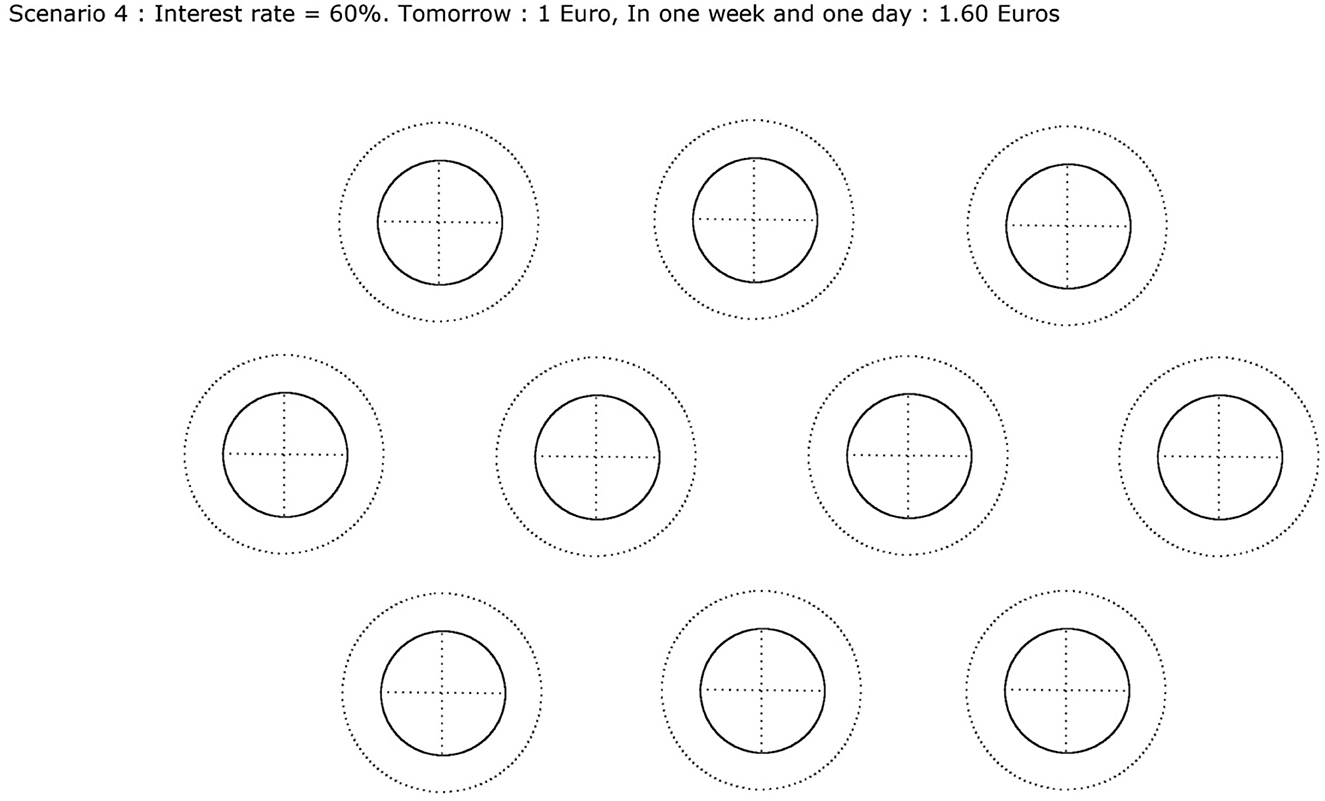
Figure 1. Example of one decision task in the experiment. It is decision 4 with an interest rate of 60%. Each ball is worth 1 Euro in 1 day (plain circle) and 1.60 Euros in 8 days (dotted circle). Subjects color the dotted cross in blue to take the money tomorrow and in red to take the money in one week and one day.
Number of scenarios: Subjects are invited to perform the decision task six times with increasing interest rates: 0, 20, 40, 60, 80 and 100%. We chose these values as a compromise between obtaining precise data and not requiring too much time or effort from the subjects. The order of the decisions remains the same for all participants. Figure 2 displays the choice spaces for each interest rate in ascending order.
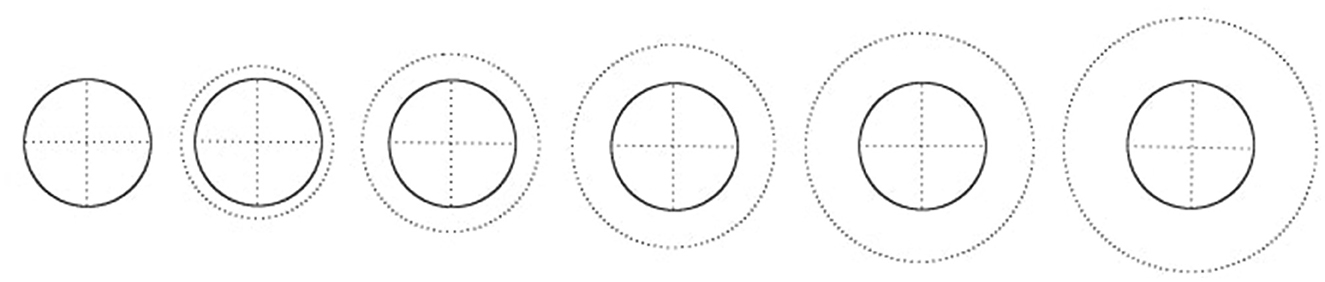
Figure 2. From left to right, the decision space expands as the interest rate increases. The plain circle always represents a value of 1 Euro, while the dotted circle represents values of 1 Euro (0%), 1.2 Euros (20%), 1.4 Euros (40%), 1.6 Euros (60%), 1.8 Euros (80%), and 2 Euros (100%).
Time Frame: The early payment date is tomorrow. This 1-day FED avoids the present bias associated with obtaining the reward immediately. The later payment date is one week and one day. We chose a one-week delay because it seemed long enough to be perceived as a future payment by the subjects, and short enough to not be perceived as a distant future.
Measurements: We use four basic measurements to compare MPL and VCTP:
(i) Time (Time) is the number of seconds subjects take to complete the task. It is defined as the time interval between starting to answer the first scenario and completing the last one. It therefore includes both the time needed to reflect on the answer and the time needed to indicate the answer.
(ii) Consistency (Cons) identifies subjects who correctly perform the task. Subjects are consistent if their number of future choices always remains the same or increases when the interest rate increases. This criterion is harder to satisfy in VCTP because allocating X coins in the future at one interest rate means that you should also allocate at least these X coins in the future when their value increases.
(iii) Allocations to the future (NumFut) refers to the total number of coins allocated to the future in all decision tasks. Subjects indicate their budget choices by allocating X coins to the future, with X ∈ {0, 10} in MPL and X ∈ {0, 1, 2, ..., 10} in VCTP.
(iv) Allocations to interior solutions (FreqInt) refers to the total number of coins allocated to the future by using interior solutions of VCTP, that is, the sum of allocations in which X ∈ {1, 2, ..., 9}, divided by the maximum number of coins allowable to interior solutions.2 We obtain a frequency index that captures the effective utilization of interior solutions, reflecting the extent to which the additional precision enabled by VCTP is utilized.
The experimental design allows us to show that visualization alone is sufficient to obtain informative data. The instructions and tasks are provided as Supplementary material and are accessible in the Mendeley data repository along with the data analysis.3 Section A.1 presents and discusses the limitations of the experimental design for the interested reader.
Ethical committee and pre-registration: The experiment was approved by the Ethics Committee of Universidad Loyola Andalucía on 28 April 2019. The study was pre-registered.4
2.2. Questions to be addressed
The goal of our experiment is to compare MPL and VCTP mechanisms. We wanted to test whether the introduction of VCTP would alter the manner in which subjects transitioned to future preferences compared to MPL. We hypothesized that subjects would utilize the increased precision offered by VCTP and perceive it as equivalent to their optimal choice. Indeed, opting for salient corner solutions with easily calculable monetary values requires less cognitive effort compared to selecting interior solutions. However, when confronted with numerous options, decision-making is often perceived as more complex (Schwartz and Schwartz, 2004; Frey and Stutzer, 2007), leading individuals to frequently favor black-and-white thinking over considering the array of intermediate options available (Dawkins, 2011). Consequently, the use of additional precision may entail costs in terms of both time and consistency. Reflecting about the use of interior solutions could potentially result in longer response times for subjects. Achieving consistency is more challenging due to the increased potential for subjects to make mistakes. The question is therefore whether subjects can use the additional precision of VCTP without any negative effects on time and consistency. Additionally, we had the secondary objective of studying the potential effect of payment schemes by comparing hypothetical, BRIS5 and real payments (see Brañas-Garza et al., 2022).
2.3. Procedures
The experiment was conducted at the School of Economics and Business of the Universidad de Sevilla in late May 2019 with a population of western university students. A sample of n = 151 subjects completed the experiment. They all signed an informed consent form and completed both tasks in random order: nV = 74 performed VCTP first and nM = 77 performed MPL first.6 All subjects received a €5 show-up fee. Those selected for payment received €14.45 on average. To control for transaction costs, all payments were made in cash on the university premises on the selected date. Power calculations in Appendix A.2 show that we have sufficient power to detect experimental effects. It should be noted that Banerjee (2020) demonstrated that in cases where control groups do not identify any differences between conditions, it is possible to reduce the sample size without relying on assumptions about the underlying distribution of outcome variables.
2.4. Econometric approach
Throughout our analysis, we employ the following regression model to estimate and identify the causal effect of the VCTP mechanism on various outcome variables:
Where yi is the outcome variable for each individual; VCTPi is a dummy variable that takes the value of 1 when subjects are assigned to the VCTP treatment and 0 if they are assigned to the MPL treatment; Xie is the vector of explanatory variables; Xic is the vector of control variables and ϵi is the error term.
We have four outcome variables, as detailed in Section 2: Time measures the response time in seconds required to complete the task, Cons is a binary variable taking the value of 1 if subjects are consistent and 0 otherwise, NumFut measures the total amount of coins allocated to the future in the task and FreqInt represents the frequency of interior allocations made by subjects. To assess the effect of VCTP on these outcomes, we will employ different regression models: ordinary least squares regressions for Time, probit regressions for Cons to account for its binary nature, tobit regressions for NumFut to address left and right censoring, and fractional probit regressions for FreqInt to account for its fractional nature.
We use as explanatory variables the dummy variables Hypothetical and OneTenth respectively taking value 1 when the payment scheme is hypothetical or BRIS, and 0 otherwise. We use the control variables Age representing the age of subjects in years, the dummy variable Gender taking value 1 for female subjects and 0 otherwise, and CRTScore indicating the percentage of correct answers on the Cognitive Reflection Test (CRT).
3. Questionnaire
Participants completed a questionnaire to measure the control variables, which allow us to verify the meaningfulness of comparing the two treatments. We conduct a difference of means test between the groups to assess the balance in different control variables. Additionally, we perform the same analysis based on the payment scheme to determine if comparing the MPL and VCTP conditions within each payment scheme is meaningful. Table 1 presents the results of these tests, including Romano-Wolf adjusted p-values for multiple testing in the last column. We observe that the two groups exhibit comparable characteristics (p ≥ 0.105), which enables us to estimate the causal effect of the VCTP treatment on the outcomes. We conclude that the two groups are comparable regardless of payment scheme and that the experiment measures the causal effect of the experimental conditions. Section A.3 further extends the analysis to compare the characteristics of subjects under different payment schemes and finds that subjects with hypothetical payoffs have higher CRT scores, but the different groups are otherwise comparable.
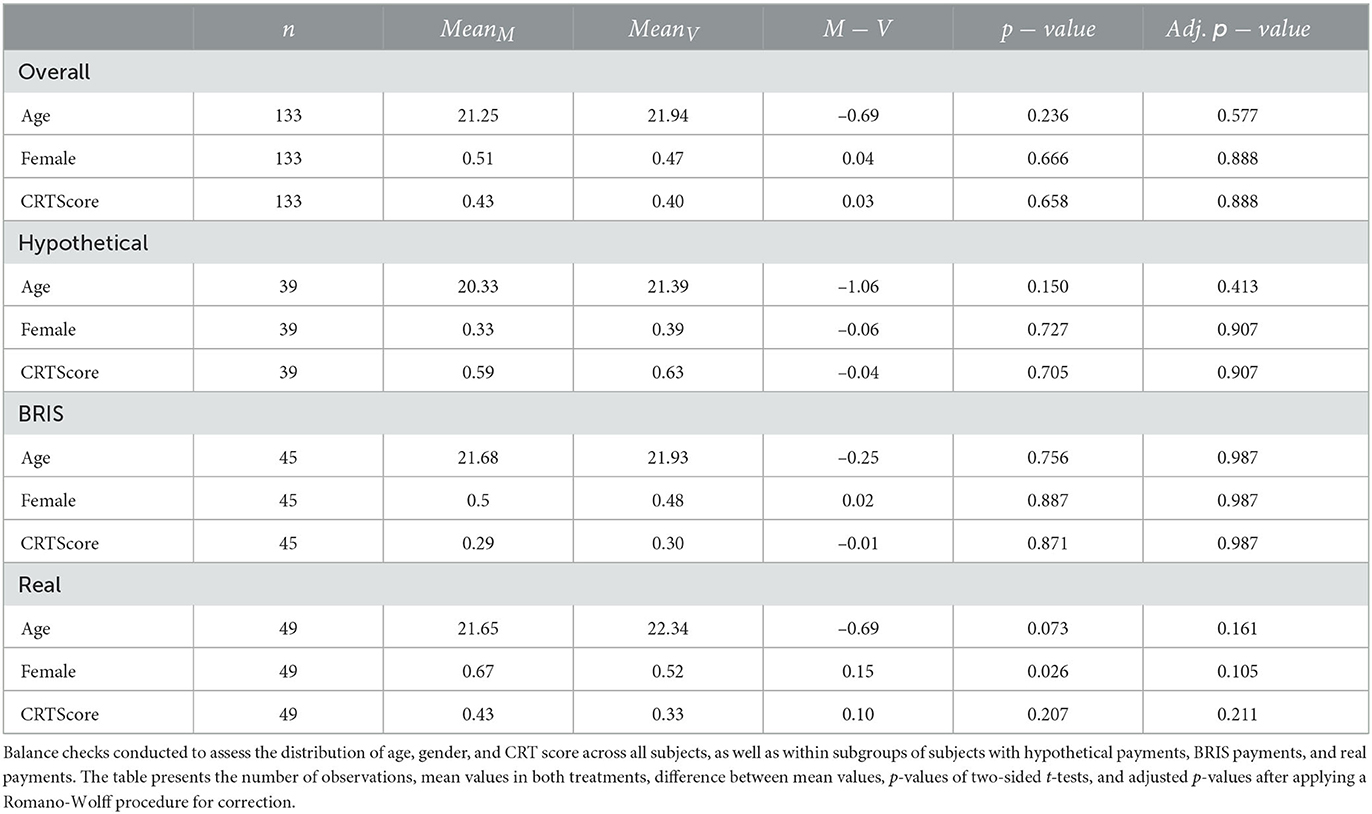
Table 1. Balance check by treatment.
4. Results
Table 2 displays the summary statistics of the variables used in our analysis. On average, On average, subjects answered the MPL task in 413.23 seconds (6.89 min) and the VCTP task in 389.07 t-test not rejecting the equality between conditions (p = 0.436). The level of consistency is 91.89% in MPL and 88.31% in VCTP, with a t-test not rejecting the equality between conditions (p = 0.464). Subjects allocate on average 37.89 coins to the future in MPL and 36.52 coins to the future in VCTP, with a t-test not rejecting the equality between conditions (p = 0.487). The proportion of interior solutions used in VCTP is 28.43%, with a statistically significant difference compared to not using interior solutions according to a t-test (p < 0.001). We also see that our experimental subjects were 21.59 years old on average (21 years and 7 months), 48.87% of them were females and they answered correctly 41.85% of the questions in the CRT task on average (1.26 correct answers).
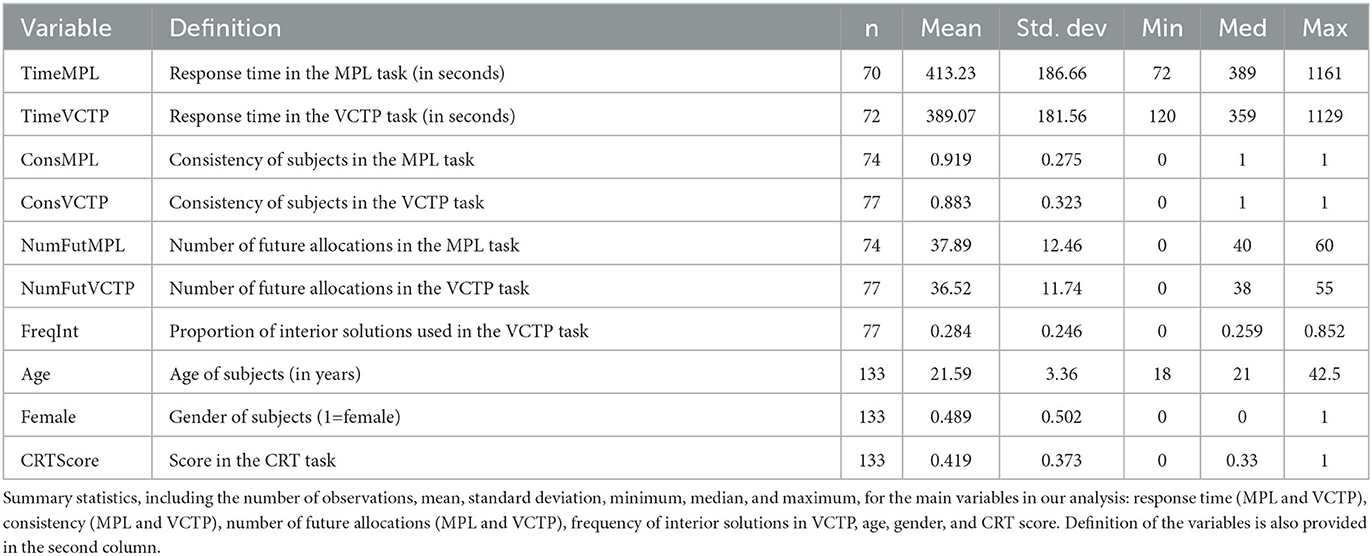
Table 2. Summary statistics for the main variables used in our analysis.
Table 3 presents the results of the regression analysis for the four measurements of interest. Results indicate that VCTP has no significant effects on time, consistency, and the number of future allocations. It suggests that there are no costs associated with adding interior solutions and that they do not alter the revealed time preferences of subjects.7 Columns (7) and (8) show that subjects used the additional precision of VCTP and that this result remains after adding controls. Importantly, only 20 out of 77 subjects (25.97%) never used internal solutions; hence, the majority of participants used non-corner solutions at least once.
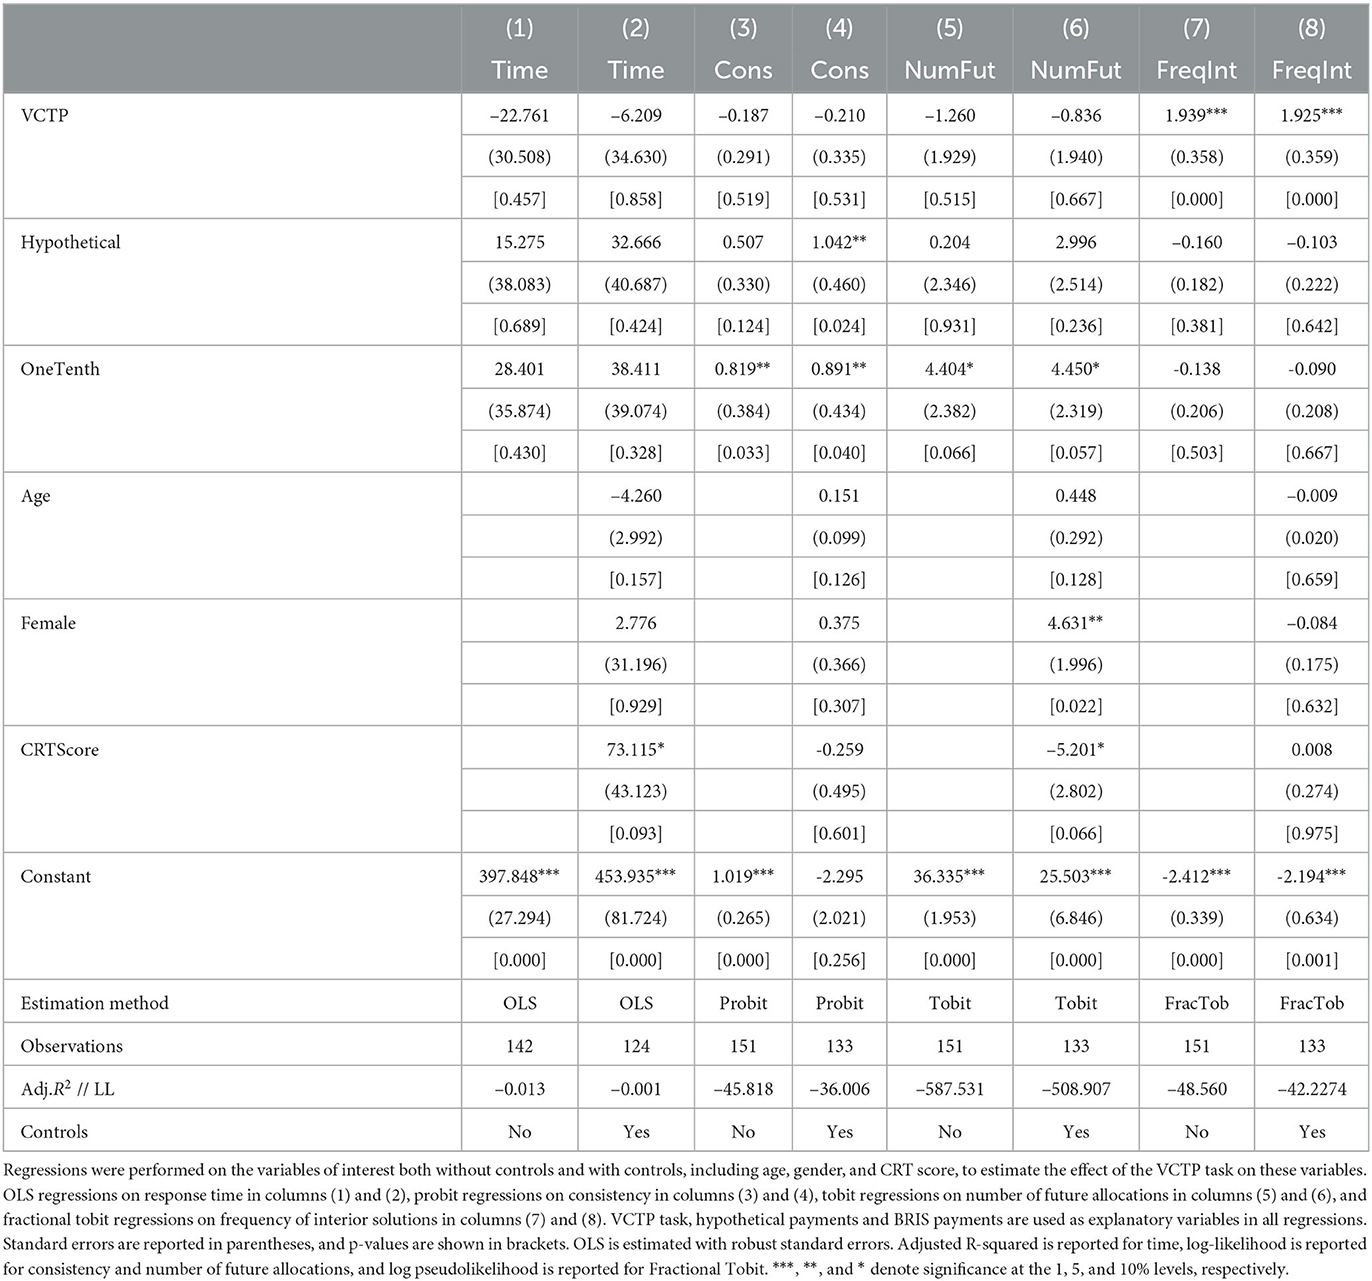
Table 3. Estimations of the impact of the VCTP mechanism on time, consistency, allocations to the future and interior solutions.
Column (4) shows that hypothetical payments have a positive and significant impact on consistency when adding controls (p = 0.024). Furthermore, columns (3) and (4) show that BRIS payments enhance consistency, both without controls (p = 0.033) and with controls (p = 0.040), while columns (5) and (6) indicate that BRIS payments have a positive and marginally significant effect on the number of future allocations, both without controls (p = 0.066) and with controls (p = 0.057). Additionally, we find that higher CRT score increases response time (p = 0.093) and decreases the number of future allocations (p = 0.066) with marginal significance, while female allocate more to future solutions (p = 0.022).
Table A3 in Section A.4 presents the regressions with round fixed effects. The results provide marginal evidence that VCTP is associated with a decrease in response time and consistency. Additionally, we find evidence that hypothetical and BRIS payments are associated with an increase in response time, consistency, and the number of future allocations. Furthermore, the table demonstrates that the control variables significantly impact the outcome variables.
Overall, we conclude that VCTP lets us measure time preferences as quickly, consistently and in a similar way to MPL. Hence, VCTP is an improvement over MPL as it provides additional information without additional costs. We now investigate whether subjects use interior solutions meaningfully.
Figure 3 displays the multi-histograms of allocations to the future in MPL and VCTP for each scenario by increasing interest rates. Overall, we see that subjects made interior allocations quite often, but that corner solutions were more frequently used in the extreme cases of 0% (top left) and 100% (bottom right) interest rate, with 85.71 and 75.32% of subjects choosing either all or nothing, respectively. We also see that the subjects used all possible values of interior solutions and that the modal distribution also moved as the interest rate increased. The multi-histograms therefore suggest that subjects take advantage of interior solutions to allocate closer to their preferences.
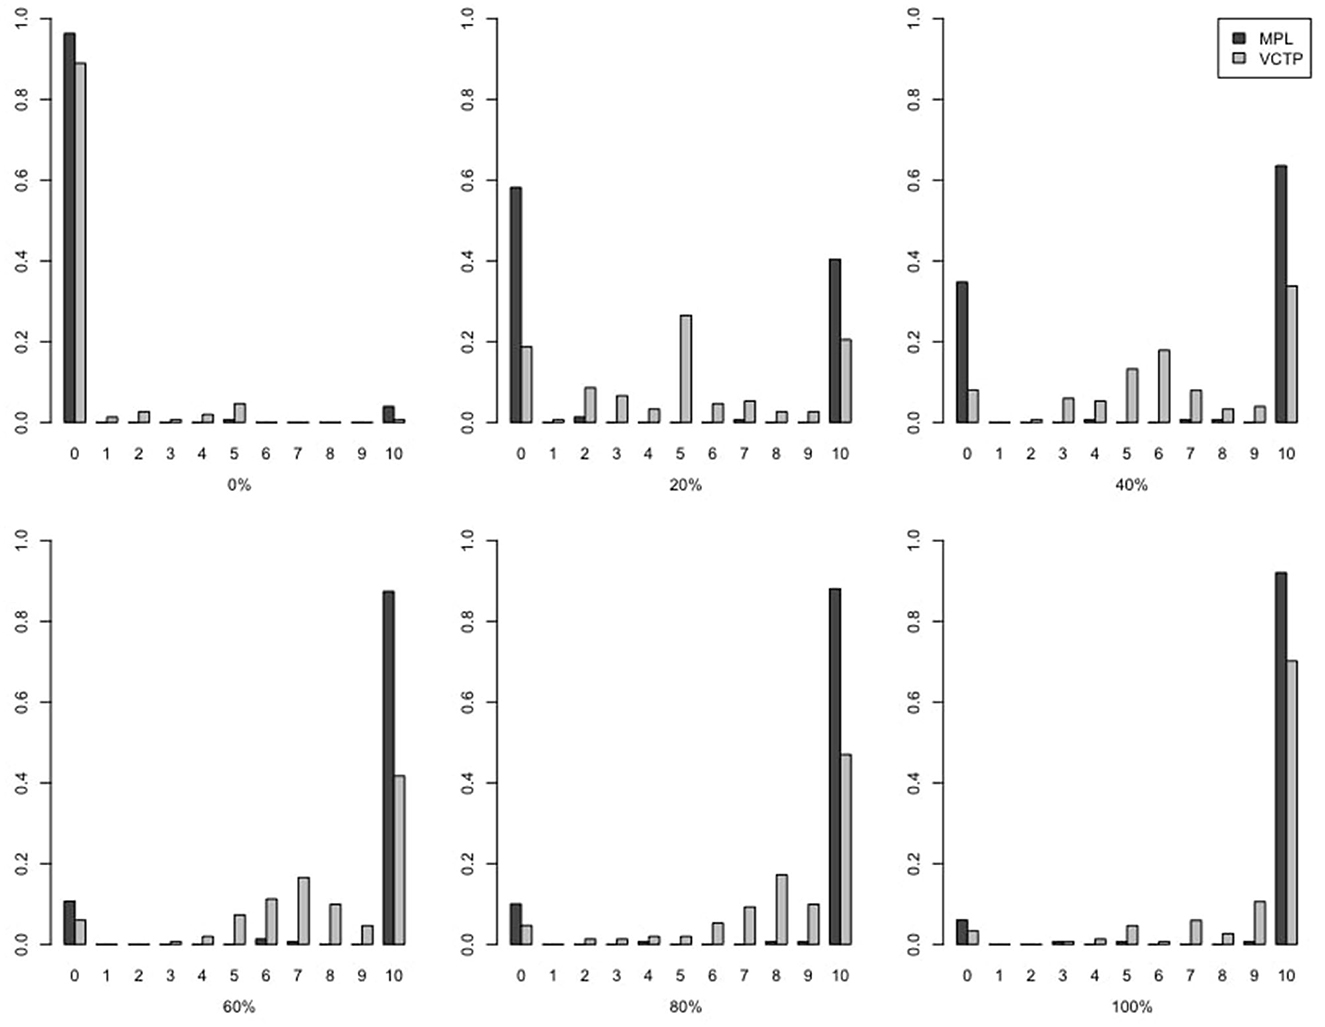
Figure 3. Multi-histograms of allocations to the future by task. The figure illustrates how tokens were allocated to the future by subjects in the MPL and VCTP tasks, presented from top left to bottom right at interest rates of 0, 20, 40, 60, 80, and 100%.
Additional evidence of the meaningful use of interior solutions is provided by subjects who switched to future preferences in MPL at 20% (n = 48), 40% (n = 32), and 60% (n = 31). We took advantage of having the MPL and VCTP choices of all the subjects (within-subjects) and tested whether they took advantage of the flexible structure of VCTP to allocate closer to their preferences. Figure 4 displays the box-plots of the number of allocations to the future in VCTP for these subjects compared with their same choices in MPL indicated by the red line. It shows that subjects switching at 20% in MPL (left graph)—then allocating 50 coins to the future—allocate less in VCTP as shown by the 75th quartile. On the contrary, subjects switching at 60% in MPL (right graph)—then allocating 30 to the future—make a larger number of future allocations in VCTP since the 25th quartile in VCTP is at 30 coins. The results therefore show that the subjects susceptible to using the additional precision of VCTP are in fact doing so. We therefore conclude that the subjects use interior solutions meaningfully.
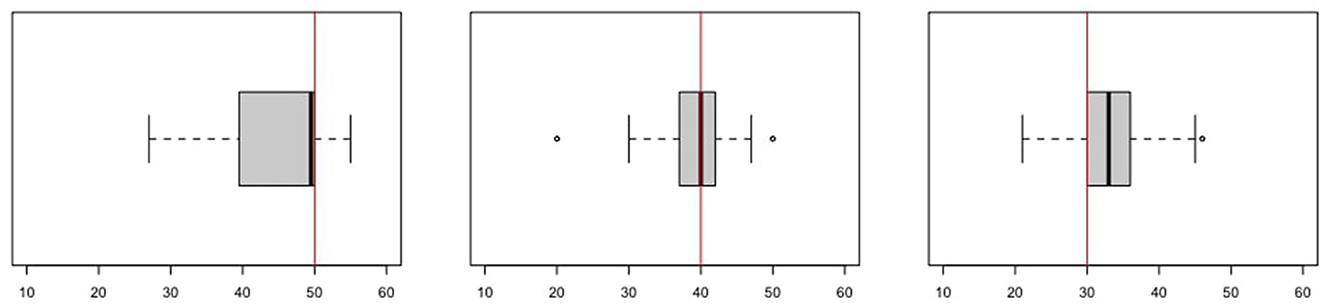
Figure 4. The figure illustrates the total number of coins allocated to the future in the VCTP task based on the switching point in the MPL task. The left figure depicts the VCTP allocations of subjects who switched to the future at 20% in MPL, the middle figure shows allocations for subjects who switched at 40% in MPL, and the right figure represents allocations for subjects who switched at 60% in MPL.
As noted before, our secondary goal was to explore the effect of monetary incentives. Table 4 shows that hypothetical payments marginally increase consistency after adding controls in column (4) (p = 0.081). We observe in column (3) that BRIS payments also marginally increases consistency (p = 0.062) and column (4) shows that this result remains after adding controls (p = 0.062). Additionally, column (5) shows that BRIS payments marginally increases the number of future allocations and column (6) shows that this result remains after adding controls (p = 0.051). Section A.5 extends this analysis to the MPL task and shows that hypothetical payments marginally increase the number of future allocations after adding controls. Figure A3 illustrates a potential explanation for the observed phenomenon with BRIS payments: subjects may strategically allocate all tokens to the future earlier to maximize their potential earnings in case they receive payment. This behavior has the potential to enhance consistency by reducing errors associated with using interior solutions. We conclude that BRIS payments might have an influence on the outcomes of VCTP.
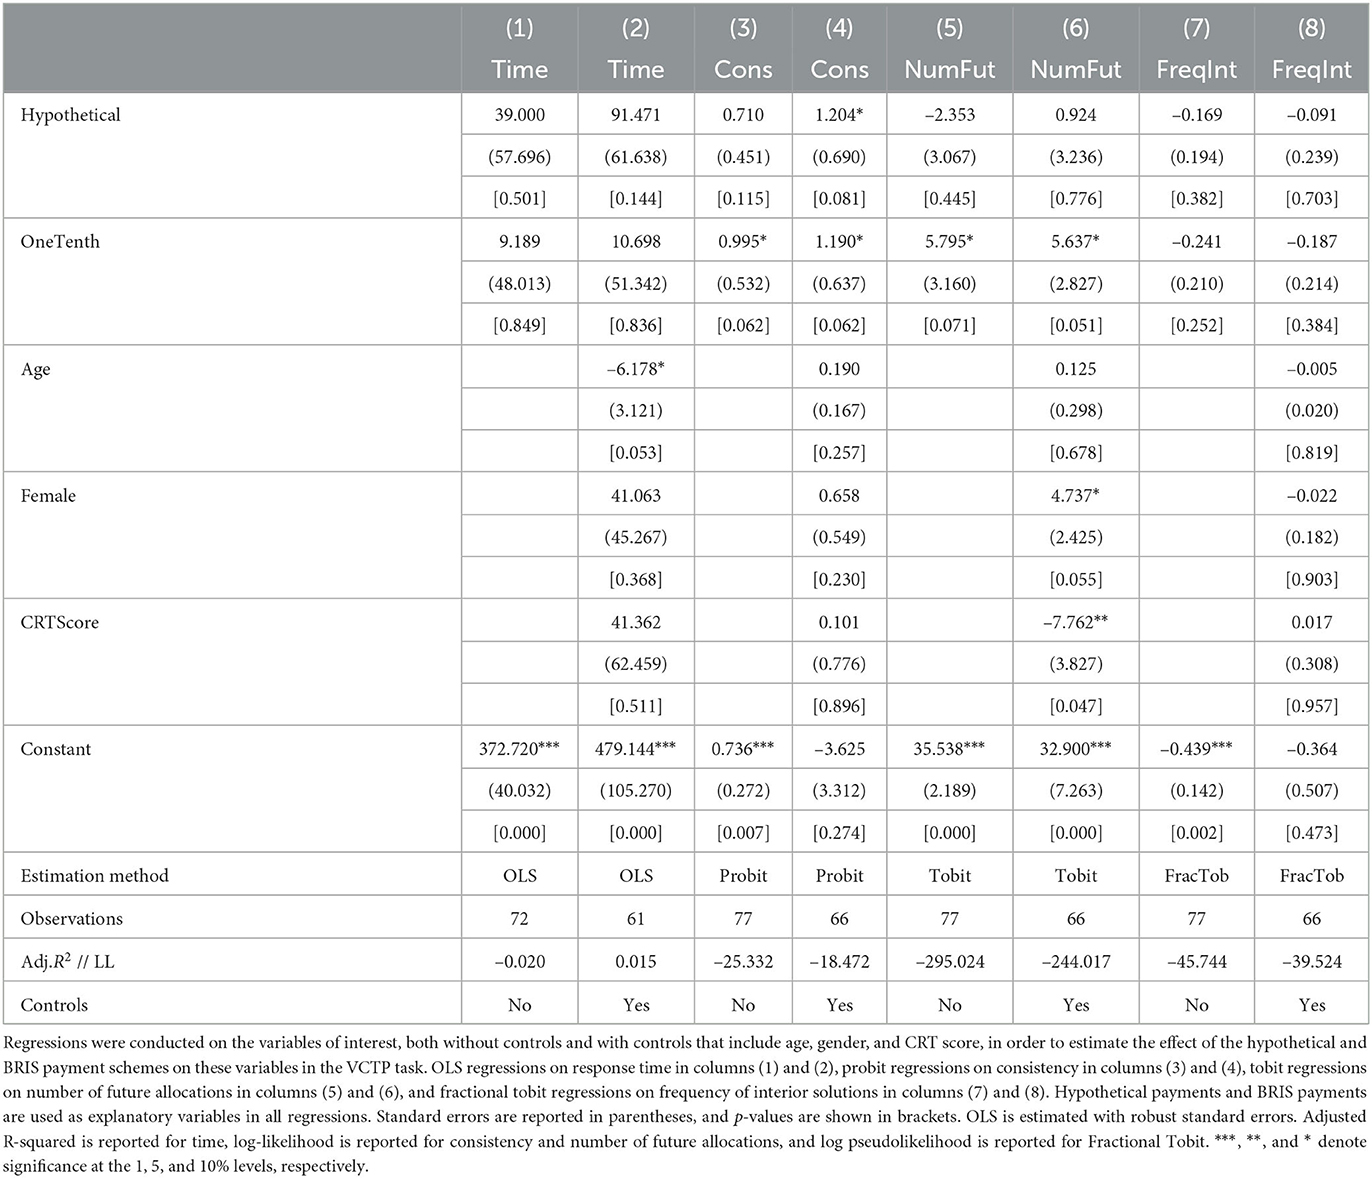
Table 4. Estimations of the impact of financial incentives on response time, consistency, allocations to future and use of interior solutions in the VCTP task.
5. Discussion
We developed a new tool called Visual Continuous Time Preferences (VCTP) to measure time preferences by combining the Multiple Price Lists (MPL) and Convex Time Budget (CTB) methodologies. From MPL, we kept the idea of minimizing the complexity of answers and the number of trials to perform. From CTB, we kept the idea of allocating tokens both to the present and the future. We evaluated VCTP by comparing it to the MPL mechanism using the same experimental design. The goal was to demonstrate that VCTP requires a similar amount of time and has a similar consistency to MPL but reveals time preferences more precisely. We find that the VCTP provides similar results to MPL in terms of response time, task consistency and number of allocations to the future. The meaningful utilization of the additional precision of interior solutions by subjects suggests that VCTP is an improvement over the MPL mechanism. We overall conclude that VCTP successfully measures time preferences. As we have observed that the BRIS payment scheme may potentially influence outcomes, further investigation of this phenomenon is warranted in future research. Other avenues to explore include extending the visualization method to other types of economic preferences and examining its robustness across diverse populations.
Data availability statement
The datasets presented in this study can be found in online repositories. The names of the repository/repositories and accession number(s) can be found at: https://data.mendeley.com/datasets/ms63y77fcf.
Ethics statement
The studies involving human participants were reviewed and approved by the Ethics Committee of Universidad Loyola Andalucía. Written informed consent to participate in this study was provided by the participants' legal guardian/next of kin.
Author contributions
The author confirms being the sole contributor of this work and has approved it for publication.
Funding
Financial support from MCI-FEDER (PID2021-126892NB-I00) and Excelencia-Andalucia (PY18-FR-0007) is gratefully acknowledged.
Acknowledgments
Special thanks to Pablo Brañas-Garza, Iñigo Iturbe, Diego Jorrat and Glenn Harrison for their comments and support and Charlie Sprenger for sharing code and time. We also thank Antonio Cabrales, Antonio Espín, John Smith and the audience at ESA 2019, SABE 2020 and ESA 2020 for their helpful comments. Almudena Amoros, Ernesto Mesa, Alvaro Nuñez, and Juan F. Ferrero ran the experiments.
Conflict of interest
The author declares that the research was conducted in the absence of any commercial or financial relationships that could be construed as a potential conflict of interest.
Publisher's note
All claims expressed in this article are solely those of the authors and do not necessarily represent those of their affiliated organizations, or those of the publisher, the editors and the reviewers. Any product that may be evaluated in this article, or claim that may be made by its manufacturer, is not guaranteed or endorsed by the publisher.
Supplementary material
The Supplementary Material for this article can be found online at: https://www.frontiersin.org/articles/10.3389/frbhe.2023.1206679/full#supplementary-material
Footnotes
1. ^It should be noted that 1.35% of subjects chose to use interior solutions in MPL despite not being allowed to do so.
2. ^54 coins with the 10-coin version, 24 coins with the 5-coin version.
3. ^https://data.mendeley.com/datasets/ms63y77fcf/5
4. ^https://aspredicted.org/yd6pt.pdf
5. ^Between-Subject Random Incentives System, in which 1 subject over 10 is paid.
6. ^The distribution of subjects by payment schemes was as follows: nH = 52 for the hypothetical payment, nB = 49 for the BRIS payment and nR = 50 for the real payment. The precise number were nM,H = 25, nM,B = 25, nM,R = 24 when subjects answered the MPL first and nV,H = 27, nV,B = 24, nV,R = 26 when subjects answered the VCTP first.
7. ^Additional regressions including time as a predictor of consistency show that response time has no effect on consistency.
References
Alfonso, A., Brañas-Garza, P., Jorrat, D., Lomas, P., Prissé, B., Vasco, M., et al. (2023). The adventure of running experiments with teenagers. J. Behav. Exper. Econom. 106, 102048. doi: 10.1016/j.socec.2023.102048
Andersen, S., Harrison, G. W., Lau, M. I., and Rutström, E. E. (2006). Elicitation using multiple price list formats. Exper. Econ. 9, 383–405. doi: 10.1007/s10683-006-7055-6
Andersen, S., Harrison, G. W., Lau, M. I., and Rutström, E. E. (2008). Eliciting risk and time preferences. Econometrica 76, 583–618. doi: 10.1111/j.1468-0262.2008.00848.x
Andreoni, J., Kuhn, M. A., and Sprenger, C. (2015). Measuring time preferences: A comparison of experimental methods. J. Econ. Behav. Organ. 116, 451–464. doi: 10.1016/j.jebo.2015.05.018
Andreoni, J., and Sprenger, C. (2012). Estimating time preferences from convex budgets. Am. Econ. Rev. 102, 3333–56. doi: 10.1257/aer.102.7.3333
Angerer, S., Lergetporer, P., Glätzle-Rützler, D., and Sutter, M. (2015). How to measure time preferences in children: a comparison of two methods. J. Econ. Sci. Assoc. 1, 158–169. doi: 10.1007/s40881-015-0016-0
Ashraf, N., Karlan, D., and Yin, W. (2006). Tying Odysseus to the mast: Evidence from a commitment savings product in the Philippines. Quart. J. Econ. 121, 635–672. doi: 10.1162/qjec.2006.121.2.635
Aycinena, D., and Rentschler, L. (2018). Discounting and digit ratio: Low 2D: 4D predicts patience for a sample of females. Front. Behav. Neurosci. 121, 257. doi: 10.3389/fnbeh.2017.00257
Balakrishnan, U., Haushofer, J., and Jakiela, P. (2020). How soon is now? Evidence of present bias from convex time budget experiments. Exper. Econ. 23, 294–321. doi: 10.1007/s10683-019-09617-y
Banerjee, S. (2020). Sample sizes in experimental games. Res. Econ. 74, 221–227. doi: 10.1016/j.rie.2020.07.002
Bartoš, V., Bauer, M., Chytilová, J., and Levely, I. (2021). Psychological effects of poverty on time preferences. Econ. J. 131, 2357–2382. doi: 10.1093/ej/ueab007
Borghans, L., and Golsteyn, B. H. (2006). Time discounting and the body mass index: Evidence from the Netherlands. Econ. Hum. Biol. 4, 39–61. doi: 10.1016/j.ehb.2005.10.001
Bosch-Domènech, A., Branas-Garza, P., and Espín, A. M. (2014). Can exposure to prenatal sex hormones (2D: 4D) predict cognitive reflection? Psychoneuroendocrinology 43, 1–10. doi: 10.1016/j.psyneuen.2014.01.023
Brañas-Garza, P., Jorrat, D., Espín, A. M., and Sánchez, A. (2022). Paid and hypothetical time preferences are the same: Lab, field and online evidence. Exper. Econ. 26, 412–434. doi: 10.1007/s10683-022-09776-5
Burks, S. V., Carpenter, J. P., Goette, L., and Rustichini, A. (2009). Cognitive skills affect economic preferences, strategic behavior, and job attachment. Proc. Nat. Acad. Sci. 106, 7745–7750. doi: 10.1073/pnas.0812360106
Carvalho, L. S., Prina, S., and Sydnor, J. (2016). The effect of saving on risk attitudes and intertemporal choices. J. Dev. Econ. 120, 41–52. doi: 10.1016/j.jdeveco.2016.01.001
Castillo, M., Jordan, J. L., and Petrie, R. (2019). Discount rates of children and high school graduation. Econ. J. 129, 1153–1181. doi: 10.1111/ecoj.12574
Chabris, C. F., Laibson, D., Morris, C. L., Schuldt, J. P., and Taubinsky, D. (2008). Individual laboratory-measured discount rates predict field behavior. J. Risk Uncert. 37, 237. doi: 10.1007/s11166-008-9053-x
Coller, M., and Williams, M. B. (1999). Eliciting individual discount rates. Exper. Econ. 2, 107–127. doi: 10.1023/A:1009986005690
Dohmen, T., Falk, A., Huffman, D., and Sunde, U. (2010). Are risk aversion and impatience related to cognitive ability? Am. Econ. Rev. 100, 1238–60. doi: 10.1257/aer.100.3.1238
Duckworth, A. L., and Seligman, M. E. (2005). Self-discipline outdoes IQ in predicting academic performance of adolescents. Psychol. Sci. 16, 939–944. doi: 10.1111/j.1467-9280.2005.01641.x
Epper, T., Fehr, E., Fehr-Duda, H., Kreiner, C. T., Lassen, D. D., Leth-Petersen, S., et al. (2020). Time discounting and wealth inequality. Am. Econ. Rev. 110, 1177–1205. doi: 10.1257/aer.20181096
Frederick, S. (2005). Cognitive reflection and decision making. J. Econ. Perspect. 19, 25–42. doi: 10.1257/089533005775196732
Frey, B. S., and Stutzer, A. (2007). Economics and Psychology: A Promising New Cross-Disciplinary Field. Cambridge and London: MIT Press. doi: 10.7551/mitpress/2604.001.0001
Giné, X., Goldberg, J., Silverman, D., and Yang, D. (2018). Revising commitments: Field evidence on the adjustment of prior choices. Econ. J. 128, 159–188. doi: 10.1111/ecoj.12378
Golsteyn, B. H., Grönqvist, H., and Lindahl, L. (2014). Adolescent time preferences predict lifetime outcomes. Econ. J. 124, F739–F761. doi: 10.1111/ecoj.12095
Harrison, G. W., Lau, M. I., and Williams, M. B. (2002). Estimating individual discount rates in Denmark: A field experiment. Am. Econ. Rev. 92, 1606–1617. doi: 10.1257/000282802762024674
Kirby, K. N., Petry, N. M., and Bickel, W. K. (1999). Heroin addicts have higher discount rates for delayed rewards than non-drug-using controls. J. Exper. Psychol. 128, 78. doi: 10.1037/0096-3445.128.1.78
Kirby, K. N., Winston, G. C., and Santiesteban, M. (2005). Impatience and grades: Delay-discount rates correlate negatively with college GPA. Learn. Indiv. Differ. 15, 213–222. doi: 10.1016/j.lindif.2005.01.003
McClure, S. M., Ericson, K. M., Laibson, D. I., Loewenstein, G., and Cohen, J. D. (2007). Time discounting for primary rewards. J. Neurosci. 27, 5796–5804. doi: 10.1523/JNEUROSCI.4246-06.2007
McClure, S. M., Laibson, D. I., Loewenstein, G., and Cohen, J. D. (2004). Separate neural systems value immediate and delayed monetary rewards. Science 306, 503–507. doi: 10.1126/science.1100907
Meier, S., and Sprenger, C. (2010). Present-biased preferences and credit card borrowing. Am. Econ. J. Appl. Econ. 2, 193–210. doi: 10.1257/app.2.1.193
Meier, S., and Sprenger, C. D. (2013). Discounting financial literacy: Time preferences and participation in financial education programs. J. Econ. Behav. Organ. 95, 159–174. doi: 10.1016/j.jebo.2012.02.024
Non, A., and Tempelaar, D. (2016). Time preferences, study effort, and academic performance. Econ. Educ. Rev. 54, 36–61. doi: 10.1016/j.econedurev.2016.06.003
Prissé, B., and Jorrat, D. (2022). Lab vs. online experiments: no differences. J. Behav. Exper. Econ. 100, 101910. doi: 10.1016/j.socec.2022.101910
Reuben, E., Sapienza, P., and Zingales, L. (2010). Time discounting for primary and monetary rewards. Econ. Lett 106, 125–127. doi: 10.1016/j.econlet.2009.10.020
Sutter, M., Kocher, M. G., Glätzle-Rützler, D., and Trautmann, S. T. (2013). Impatience and uncertainty: Experimental decisions predict adolescents' field behavior. Am. Econ. Rev. 103, 510–31. doi: 10.1257/aer.103.1.510
Keywords: time preference, MPL, CTB, visual experiment, lab experiment
Citation: Prissé B (2023) Visual continuous time preferences. Front. Behav. Econ. 2:1206679. doi: 10.3389/frbhe.2023.1206679
Received: 16 April 2023; Accepted: 20 June 2023;
Published: 12 July 2023.
Edited by:
Ritwik Banerjee, Indian Institute of Management Bangalore, IndiaReviewed by:
Subrato Banerjee, Indian Institute of Technology Bombay, IndiaRobert Gillanders, Dublin City University, Ireland
Copyright © 2023 Prissé. This is an open-access article distributed under the terms of the Creative Commons Attribution License (CC BY). The use, distribution or reproduction in other forums is permitted, provided the original author(s) and the copyright owner(s) are credited and that the original publication in this journal is cited, in accordance with accepted academic practice. No use, distribution or reproduction is permitted which does not comply with these terms.
*Correspondence: Benjamin Prissé, YmVuamFtaW5fcHJpc3NlQHN1dGQuZWR1LnNn