 Gerald Kastberger
 Martin Ebner
 Thomas Hötzl
94% of researchers rate our articles as excellent or good
Learn more about the work of our research integrity team to safeguard the quality of each article we publish.
Find out more
ORIGINAL RESEARCH article
Front. Bee Sci., 30 January 2025
Sec. Bee Physiology
Volume 2 - 2024 | https://doi.org/10.3389/frbee.2024.1411720
This article is part of the Research TopicBiology of Giant HoneybeesView all 7 articles
This case study investigates the social behavior of the giant honeybee (Apis dorsata) during mass flight activity (MFA), a critical aspect of colony functioning. This evolutionarily ancient species builds its nests on trees, cliffs, or man-made structures. A colony periodically transitions from a semi-quiescent state to MFA mode, typically up to four times a day for 5–10 min. During MFA, the colony undergoes a profound reorganization of roles, and its defense capabilities are temporarily lost as the top layer of the bee curtain peels off, making the colony less responsive to external threats. This period is thought to result in a temporary “blindness” to disturbances, increasing vulnerability. To investigate this, the study analyzes three episodes from a larger data set, each consisting of over 60,000 video frames and 4,000 infrared images, with a focus on the MFA phase. The colony was exposed to a wasp dummy designed to simulate a real threat, triggering shimmering waves when the bees were in a quiescent state. This setup allowed the study to assess how the colony's defensive readiness fluctuates during MFA. Each episode included up to 20 experimental sessions, in which the colony's responses to the wasp stimulus and the unstimulated situation were examined. Data were collected from five 11 × 11 cm quadrants on the nest surface. Thermal data were analyzed in conjunction with motion activity data from previous studies to understand the temporal and spatial dynamics of motion–heat coupling during MFA. Results show that the mouth zone of the nest acts as a command center for coordinating MFAs. Despite its temporary vulnerability during MFA, the colony can still detect and respond to external threats, although with reduced defense capabilities. This case study highlights the complex behavioral and physiological processes involved in MFA in A. dorsata and sheds light on the extent to which the colony maintains some level of defense capability despite the agitation that occurs during nest restructuring. Only for a short period of approximately 1 min is it virtually paralyzed by the external stimulation, showing signs of social thanatosis.
With an age of more than 10 million years, the giant honeybees of the clade Megapis are among the oldest honeybee species in evolutionary terms. To date, two species have been recognized: the giant honeybee Apis dorsata (Fabricius, 1793), which is distributed in several ecotypes from Pakistan in the west to the Philippines in the east and from Sri Lanka to the foothills of the Himalayas (Roepke, 1930; Morse and Laigo, 1969; Dyer, 1985; Punchihewa et al., 1985; Dyer and Seeley, 1994; Kastberger, 1999; Neumann et al., 2000; Paar et al., 2002; Wattanachaiyingcharoen et al., 2003; Tan, 2007; Hepburn and Radloff, 2011; Kastberger et al., 2011b; Thapa and Wongsiri, 2011; Robinson, 2012), and Apis laboriosa (Smith, 1871) (Roubik et al., 1985; Underwood, 1990; Batra, 1996; Ahmad et al., 2003; Hepburn and Hepburn, 2007; Cao et al., 2012; Woyke et al., 2016; Gogoi et al., 2019; Kitnya et al., 2020; Kitnya et al., 2022), which in its distribution area from Pakistan to northern Vietnam occurs preferentially in the Himalayas from the valley bottoms to an altitude of more than 3,200 m.
Both species (Hepburn and Hepburn, 2007; Hepburn and Radloff, 2011) are extremely migratory [dorsata: (Dyer and Seeley, 1994; Paar et al., 2000; Paar et al., 2002; Robinson, 2012; Robinson, 2021); laboriosa (Underwood, 1990; Woykeinsta et al., 2001)] and change from a potentially singularized status (Robinson, 2014; Makinson et al., 2016; Vijayan and Somanathan, 2023), in which individual colonies disperse in forests and usually create bivouacs as non-stationary nests, to a reproductive status (Wattanachaiyingcharoen et al., 2003; Robinson, 2012), in which they form colony aggregations with comb-right nests at traditional roosting sites (Kastberger, 1999; Neumann et al., 2000; Paar et al., 2000; Paar et al., 2002). To this end, they have developed the ability of reorientation to return to ancestral reproductive sites every year after their migration from the “wintering” grounds (Neumann et al., 2000; Paar et al., 2000; Makinson et al., 2016). Their life includes the ability to exploit niches of food sources that may even be spurned by other flower-visiting species, and they have evolved the skill to anticipate their migration cycles and adapt to the seasonal supply of local agriculture (Sulzer et al., 2010; Sihag, 2014; Rojeet et al., 2016; Thangjam et al., 2016). This allows them to be characterized as “synanthropic” species.
Giant honeybees build their nests outdoors, attaching them to rocky outcrops, horizontal branches of a tree, or suitable anthropogenic structures such as window ledges of houses, the undersides of reservoirs of water towers, or bridge structures (Morse and Laigo, 1969; Kastberger, 1999; Paar et al., 2000; Kastberger et al., 2001; Kastberger et al., 2011b). A nest consists of a central honeycomb covered on both sides with several layers (Hepburn et al., 2014), which is occupied only by workers for most of the year and forms the so-called bee curtain (Kastberger, 1999; Kastberger et al., 2011b; Bhagavan et al., 2016; Kastberger et al., 2016; Koeniger et al., 2017). It is seen as a self-assemblage formation (Cully and Seeley, 2004; Hemelrijk, 2005; Kastberger et al., 2011b; Camazine et al., 2020) and includes a roof tile-like arrangement of the nest surface, which protects the nest interior with its resources from heat, cold, rain, and wind (Kastberger, 1999; Kastberger et al., 2001; Kastberger et al., 2011b). The bees on the nest surface are also able to warn their nestmates on both sides of the comb (Kastberger et al., 2013) of threats, in particular of predators, and initiate defense measures if necessary (Kastberger et al., 1998; Kastberger, 1999; Kastberger et al., 2001; Kastberger et al., 2008; Kastberger et al., 2011b; Kastberger et al., 2012; Kastberger et al., 2014a; Kastberger et al., 2014b).
An A. dorsata nest is normally in a semi-quiescent state (Kastberger et al., 2001; Kastberger et al., 2008; Kastberger et al., 2010; Kastberger et al., 2011b; Kastberger et al., 2012; Kastberger et al., 2024) unless it is put on alert by predators. In a semi-quiescent state, the bees typically form a mouth zone (Schmelzer and Kastberger, 2009; Kastberger et al., 2012; Weihmann et al., 2012; Kastberger et al., 2024) on the nest where the sun is more likely to shine during the day. It is the interface between the inner nest area with the reproductive and storage cells and the outer nest zone, which comprises the nest surface and the adjacent flight space. The mouth zone has a specific, more intensive motion profile (Kastberger et al., 2024); here, the foragers leave the nest or return from visited nectar and pollen sources, the bees show dancing behavior (Koeniger and Koeniger, 1980; Dyer, 1985; Kirchner and Dreller, 1993; Makinson et al., 2016; Kohl et al., 2023) and trophallaxis (Koeniger and Muzaffar, 1988; Crailsheim, 1990; Crailsheim, 1992; Camazine et al., 1998; Crailsheim, 1998; Tan et al., 2015), and if they are loaded with nectar or pollen, the foragers also find here their way into the nest; lastly, bees in guard mode (Seeley et al., 1982; Kastberger and Sharma, 2000; Kastberger et al., 2001; Weihmann et al., 2014) provide special protection against intruders here. In the “peripheral” nest areas, which are distant from the mouth zone, the nest members usually behave quiescent, i.e., they hang almost motionless in the bee curtain and fix themselves with their extremities to the nestmates of the layer below, while they are orientated with their head upward and the metasoma downward (Kastberger, 1999; Kastberger et al., 2011b; Kastberger et al., 2011a; Kastberger et al., 2012).
Bees on the nest surface in particular can be disturbed by visual or mechanical cues and put into an alarm state. They can communicate this arousal to the other members of the nest by swinging their metasoma upward (Kastberger et al., 2010; Kastberger et al., 2011b; Kastberger et al., 2011a; Kastberger et al., 2012; Kastberger et al., 2013; Kastberger et al., 2014a; Kastberger et al., 2014b). Such abdominal flinging motions of the bees on the nest surface can also be performed spontaneously as single, individual actions side by side, without any claim to synchronization (Weihmann et al., 2012). However, they are usually triggered by external visual stimuli, and then such social, collectively organized excitation on the nest surface can even effectively drive predatory wasps away from the nest area (Kastberger et al., 2001; Kastberger et al., 2008; Kastberger et al., 2010; Kastberger et al., 2011b; Kastberger et al., 2012; Kastberger et al., 2014a; Kastberger et al., 2014b). The special group dynamic of being able to pass on such excitations to the nearest neighbors on the nest surface is associated with time delays in the millisecond range due to the stimulus-excitation processes involved. An outside observer can therefore visually perceive such collective excitations as a wave-like shimmering pattern [for a larger perspective, see (Gagliardi et al., 2023)].
Such a semi-quiescent (Kastberger et al., 2024) state of the bee curtain, which remains undisturbed most of the time, can be interrupted by behaviors that usually occur as forms of swarming. These include a) the absconding behavior (Winston et al., 1979; Hepburn, 2006; Hepburn, 2010), when the colony or part of it forms a reproductive or migratory swarm (Kastberger, 1999; Woyke et al., 2012; Makinson et al., 2016); b) drone flights, which usually take place at dusk at certain times of the year to minimize predation pressure, especially from birds or even bats (Koeniger and Wijayagunasekera, 1976; Biswas, 2007); and c) defensive swarms, consisting of guard or “soldier” bees ready to sting, released to drive away external troublemakers when danger is imminent (Kastberger, 1999).
Finally d), there is a form of swarming that usually takes place once or twice a day and as many as six times on hot days; this is known as periodic mass flight activity (MFA) (Kastberger et al., 1996; Kastberger, 1999; Woyke et al., 2003; Woyke et al., 2005; Kastberger et al., 2024). The MFA is regularly started by the colony, and it comprehensively changes the functional organization of the nest. Many nest members begin to move away from their original position on both sides of the bee curtain; eventually, many of them fly up and form a swarm cloud around the nest for a few minutes (see Supplementary Videos in (Kastberger et al., 2024); Supplementary Videos S1–S3). During this restructuring process, the top layer of the bee curtain can literally peel off, thus ending the services of the bees on the outer front of the bee curtain; they can now turn to foraging and defecating (Kastberger et al., 1996; Kastberger et al., 2024) and are eventually entrusted with other tasks in the community (Lindauer, 1952; Seeley, 1986; Seeley and Kolmes, 1991; Seeley, 2009). Image analysis can be used to quantify motion activity in video images (Kastberger et al., 2012; Kastberger et al., 2024), and infrared thermography (Kastberger et al., 2016) can be used to observe how individual bees enter new states of arousal or how newly hatched bees come from inside the nest through the net of the curtain to the nest surface and then leave the nest for a short time for their first orientation flight. After the end of the MFA, a covering layer forms again (Kastberger et al., 1996; Kastberger et al., 2024), in which nest members assume their newly assigned social tasks (Lindauer, 1952; Seeley, 1986) for the protection and defense of the colony.
This particular swarming behavior of MFA in giant honeybees can also be considered homologous to the midday play and cleansing flight behavior of the Western honeybee Apis mellifera in front of the beehive (Sparks et al., 2010; Dussaubat et al., 2013; Drummond, 2022). Strangely enough, in the early 1980s, MFA was also the subject of fierce political disputes between the powers of the Cold War (Haig, 1982; Harris, 1987; Tucker, 2001). The Americans assumed that the Russians had used a new chemical weapon after the Americans themselves had used the defoliant Agent Orange. However, the “Yellow Rain” was soon identified as the droppings of the swarming giant honeybees (Seeley et al., 1985; Mardan and Kevan, 1989).
We have now observed mass flight episodes in colonies of A. dorsata (Kastberger et al., 1996; Kastberger, 1999; Paar et al., 2000; Paar et al., 2002; Kastberger, 2014; Kastberger et al., 2024) and A. laboriosa (Paar et al., 2004) hundreds of times. Our suspicion has been increasingly strengthened that during MFA, the collective defense capability of the colony must be weakened for at least 5–10 min. It can therefore be expected that a colony in this state can hardly defend itself. There is also reasonable suspicion that there is a tension between the willingness to defend and the need to restructure the nest in mass flight mode in giant honeybees, i.e., when bees are then mainly concerned with rebuilding the functional nest architecture and could hardly worry about external threats (Kastberger et al., 1996; Woyke et al., 2003; Woyke et al., 2004; Kastberger et al., 2024). This would be another classic example of a trade-off relationship (Campbell and Kelly, 1994; Lienhard et al., 2010; Philipson et al., 2014; Palomo et al., 2019).
From an evolutionary perspective, such a state of reduced defense capability appears doubly dangerous for the colony. In a proximate aspect (Francis, 1990; Dewsbury, 1999), nest predators have free and unhindered access to resources in the nest in the short term. The ultimate (Francis, 1990; Dewsbury, 1999) aspect, however, seems far more important: such inability to defend oneself during the MFA would not only play a role for the affected colony because such a risky situation may even be repeated several times a day, but it is also an inseparable characteristic of every colony, and thus, this behavioral trait is of crucial importance for the entire population, indeed for the entire species. This is because it should not be made easy for potential predators to plunder the resources of the nests by waiting for such, for the raptors, low-risk moments of MFA. A colony that has to periodically and frequently put itself in such a highly vulnerable position should therefore make every effort to ensure that just such a long-term adaptation of nest predators to potentially favorable opportunities such as the MFA cannot take place; this aspect not only is important across colonies (Kastberger et al., 2024) but also is fundamentally crucial for the fitness of the two giant honeybee species.
In this paper, we investigate whether and how a giant honeybee colony in MFA mode can maintain its defense capabilities while reshaping its internal organization. Are nestmates in MFA mode able to detect potential threats, warn their nestmates, and initiate appropriate defense measures? How long would such a scenario of collective incapacity to defend, which is dangerous for the colony itself, last in MFA mode? Are there perhaps also nest-topologically modulated settings so that the entire nest is not suddenly and completely restricted in its readiness to defend itself? Within what time frame is the colony's ability to defend itself restored? This also raises the question of how and from where the MFA mode is controlled in the nest.
This study continues and intensifies the investigation of the previous paper (Kastberger et al., 2024) to measure the defense readiness of an experimental colony during several MFA episodes. In cyclically recurring, normative arousal sessions, in which a dummy wasp was presented (in contrast to those sessions in between, without the presentation of a dummy wasp), an attempt was made to elicit shimmering behavior on the nest surface. Behavioral responses were recorded in five topologically differentiated functional areas on the nest, using time profiles and spectra of motion activity (Kastberger et al., 2024). An essential methodological aspect is that this study presented here uses heat data from infrared image sequences that were recorded in the same time frame as the videos. Such infrared measurements (Stabentheiner et al., 2003; Stabentheiner et al., 2004; Stabentheiner and Kovac, 2014; Kastberger et al., 2016) can further clarify a variety of behavioral implications because they can also depict motivational states in honeybees without them having to show motion patterns at the same time. They can thus significantly expand the level of interpretation of pure motion analyses (Kastberger et al., 2012; Kastberger et al., 2014b; Kastberger et al., 2024) and thus deepen the understanding of how collectively self-organized (Hemelrijk, 2005; Kastberger et al., 2011b; Camazine et al., 2020), decision-promoting traits come about in MFA episodes.
Arguments are collected as to whether external threats can be perceived collectively by the colony in MFA mode, even if the colony itself is not able to show externally recognizable defensive behaviors. To this end, benchmarks are derived to reveal the extent to which external threats promote or inhibit motion activity, or increase or decrease the thermogenic reaction on the surface of giant honeybee nests in MFA. Based on the measurement of heat production on the nest surface of an A. dorsata nest during MFA episodes, a good handful of verified features can be presented that prove that bees also notice visual hazards during MFA and that the mouth zone plays an important role in controlling such logistically demanding phases for the colony.
From 28 October to 18 November 2010, dozens of episodes of MFA were observed, some of which were recorded on video. Our experience with such actually observed but unrecorded MFA episodes in dozens of nests during this time (and during previous visits) was important in that it gave us a good idea of the expected timing and intensity of such episodes, thus enabling us to optimize the use of the technical equipment for the limited time we could devote to these aspects. Three episodes (mfa1–3) of a comb-right nest (Figure 1) at Eden Lodge in Sauraha (27°34′28.4 N, 84°30′01.4 E) were selected for this study. The selection criteria were purely random and based solely on measurement and logistics criteria. a) Our entire team of six was deployed for the complex experiments, and we had to consider which questions were to be answered with the corresponding experiments; mass flight recording was only one of several. b) The sophisticated configuration of the data recording [high-resolution video for motion analysis, infrared (IR) recording, and various sensory equipment] had to lead to satisfactory recording quality. c) The behavior of the experimental colony had to be documented not only during the MFA phase but also in full, including the periods immediately before and after the MFA phase. d) In addition, the weather had to play along because no MFA episodes occurred when it was too cold.

Figure 1. The giant honeybee nest with the experimental setup (documented during the mass flight episode mfa1). On the unsecured balcony platform of the Eden Resort in Sauraha (27°34′28.4″N, 84°30′1.4″E), the necessary technical equipment was arranged around the nest (nest) with a width of 66 cm and a height of 47 cm using bamboo struts and suspensions. At the time of recording this image, the colony was in a state of mass flight activity (MFA) during episode mfa1, which was analyzed in this study. The experimental setup is seen here from the south: video camera (cam); a computer-controlled device that moves a dummy wasp (dw) back and forth in front of the nest; an infrared camera (ir) and a vibrometer (vibr) (not addressed in this paper; see (Kastberger et al., 2013); (linen), a wasp nest had been relocated behind this curtain of linen cloth to allow regular wasp flights near the nest (not discussed in this article, but see (Kastberger et al., 2014b); (ladder), the makeshift ladder was used to ensure the construction of the facility and its regular maintenance and to carry out the necessary manipulations on the nest (the unfinished balcony on the first floor of the hotel was not equipped with railings).
The experimental nest was attached to a concrete overlap of a balcony, allowing the measuring equipment to be placed in front of the nest. The meteorological data were recorded using two HOBO U12 data loggers at the observation site. The weather was sunny throughout the experiments, with daily temperatures from 19°C in the morning (and even colder at night time) and 30°C at midday and a relative humidity of 67%–78%.
The experimental giant honeybee nest was monitored using a Panasonic HVX-200 high-definition camera (Figure 1). The “720 p/50” mode enabled recordings with a spatial resolution of 1,280 × 720 pixels at 50 frames per second. This allows motion activities on the nest such as flickering (Weihmann et al., 2012), shimmering (Kastberger et al., 2011b; Kastberger et al., 2012; Kastberger et al., 2013), dancing behavior (Kohl et al., 2023; Koeniger and Koeniger, 1980; Punchihewa et al., 1985; Kirchner and Dreller, 1993), or locomotion (Kastberger et al., 1996) to be appropriately differentiated and documented over time. The dimensions of the experimental nest (66 × 47 cm) correspond to the pixel representation of the nest itself in the image with 580 × 410 px (width × height), which results in a conversion factor of 8.8 px/cm.
Behavioral observation initially begins in semi-quiescence (Kastberger et al., 2024), preferably for at least 0.5 hours before MFA actually begins in the nest. Under field conditions, we were able to predict the onset of an MFA with a margin of 0.5 hours, using environmental and general weather conditions as well as our own experience with the selected nest to make this decision. After the MFA had subsided, the experimental colony was observed (but not necessarily recorded) for at least another hour.
For each of the three episodes selected for this work, episodes (mfa1–3), the collective motion activities (Kastberger et al., 2024), and the heat development (Figures 2, 3) were evaluated in seven surveillance zones (sz1–7) on the nest surface (Figure 4). These represent five topographical areas on the nest in which certain social functions are assigned to the bees positioned there (Seeley, 1986) and two areas outside the nest; they were defined in the image as square areas with a side length of 100 px each (corresponding to an area of ≈130 cm2).
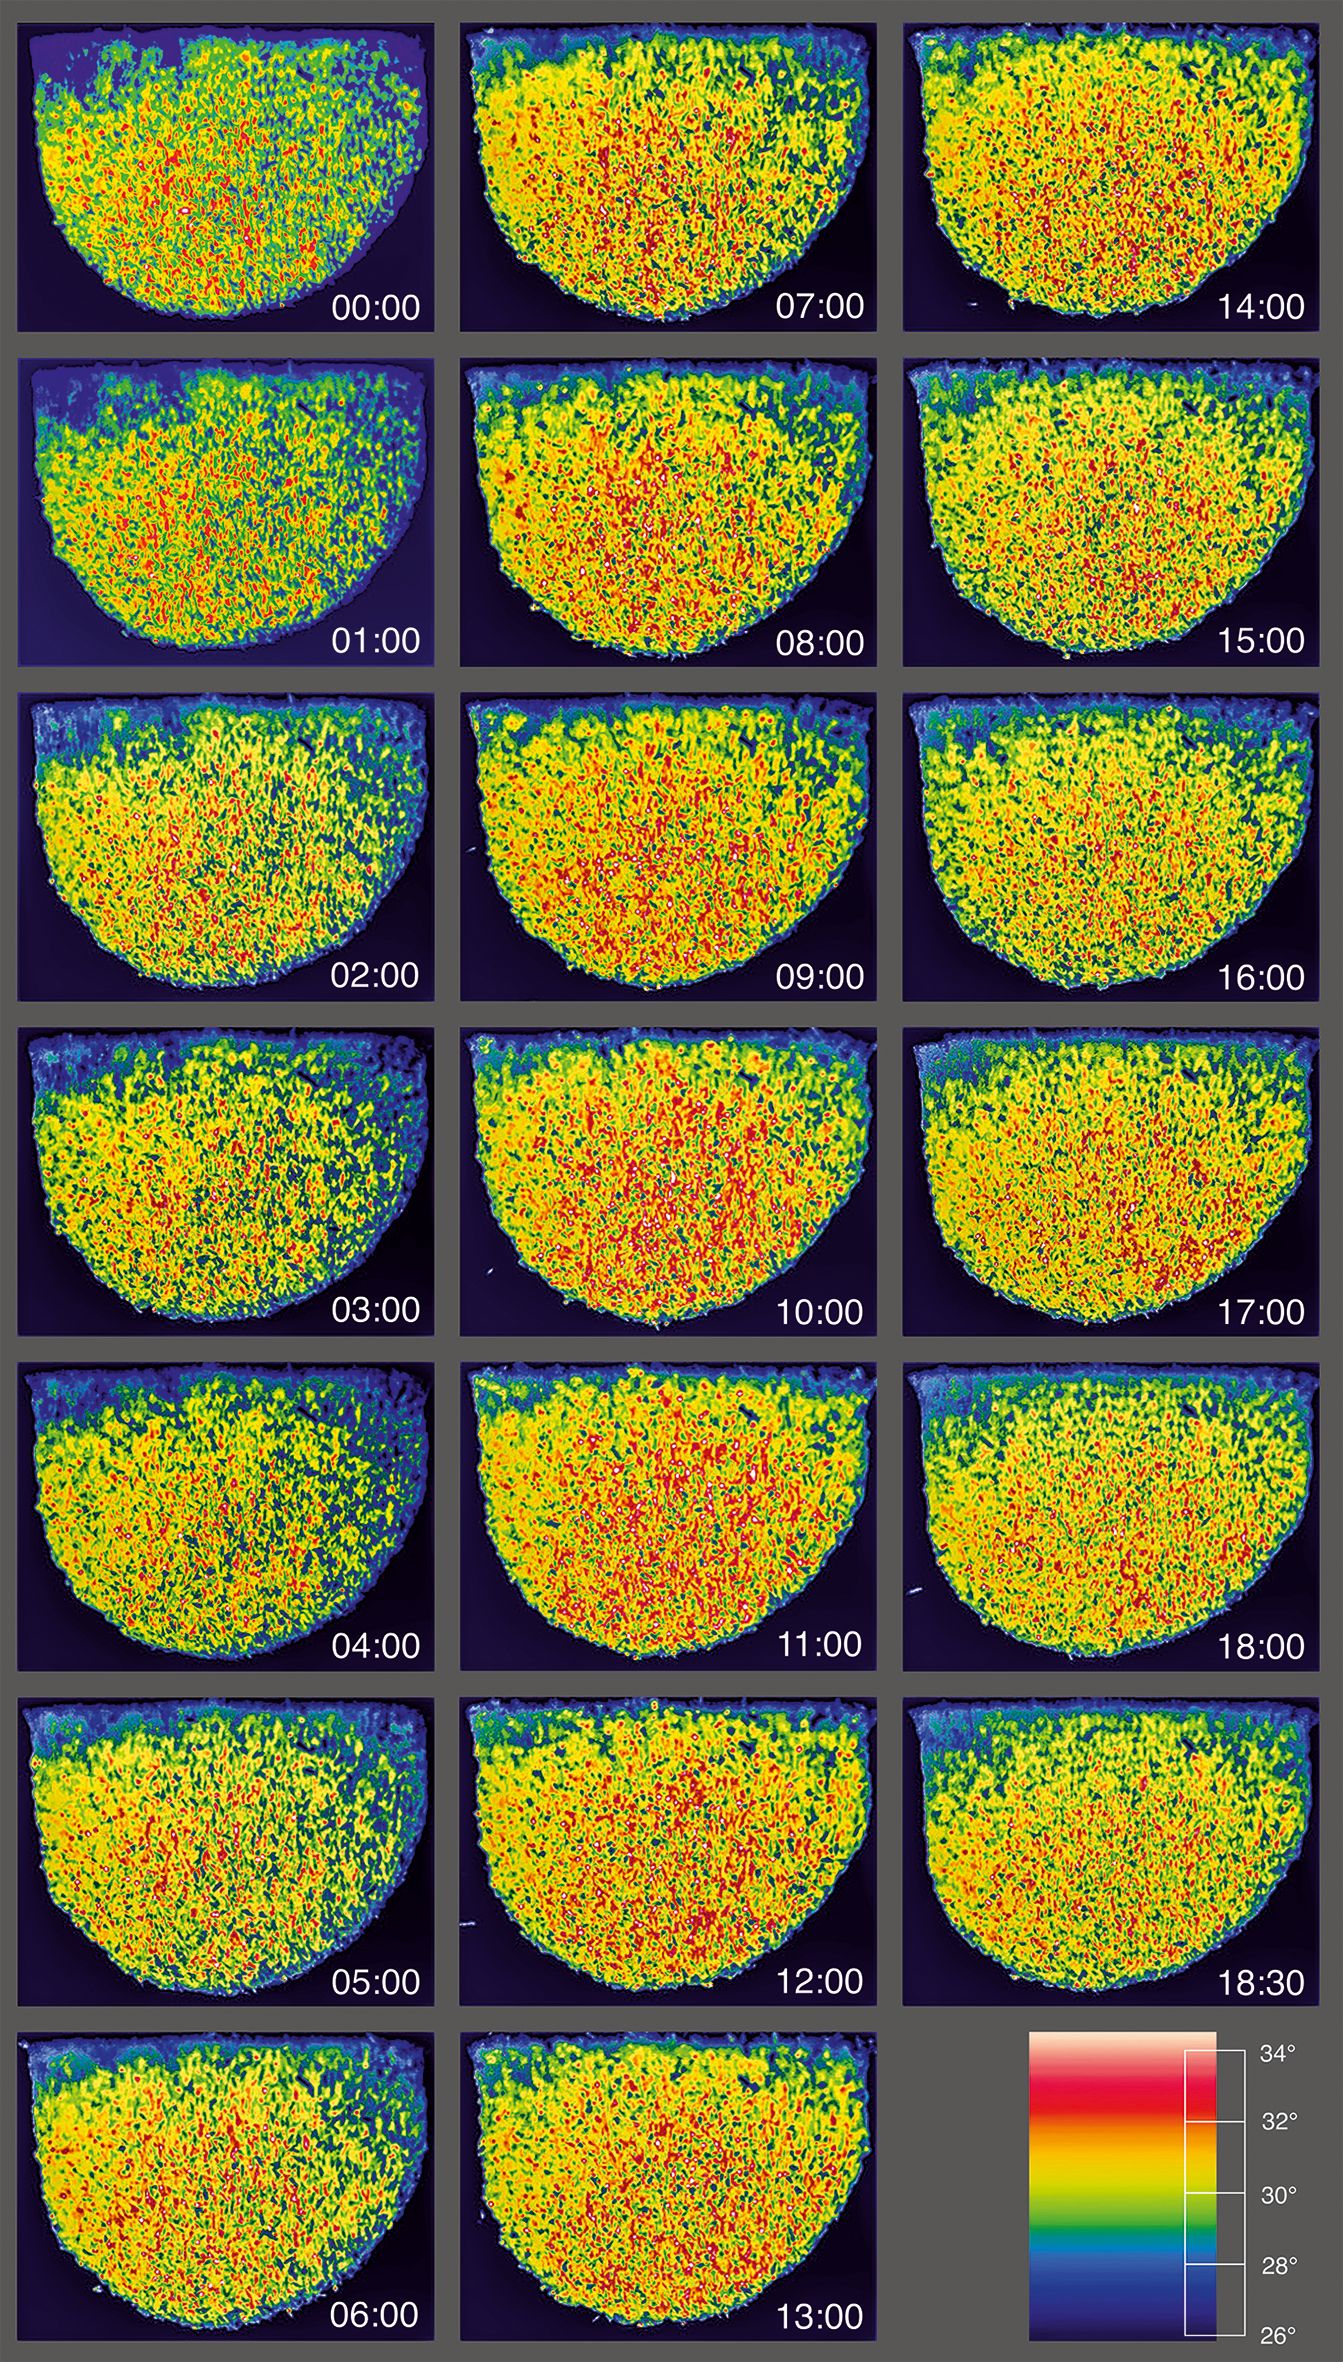
Figure 2. Heat production on the surface of the experimental Apis dorsata nest during mass flight activity mfa1. The sequence of panels shown here refers to a series of >4,000 infrared (IR) frames, which are lined up here in minute intervals from the beginning of the recording to the end of the recording. The numbers in the IR images indicate the relative experimental time in the format (min:ss). The graph at the bottom right shows the entire temperature range from 26°C to >34°C as rainbow scale 900. The color black indicates the temperature range is below 26°C, and white means above 34°C. The small white dots in the IR images refer to bees on the nest surface, whose thoraces were heated to more than 40°C, while their abdomens were equilibrated to the environment. This is an attribute for an excited state, in which they are about to take off for flight or are in guard status. The images and recording times are congruent with the plots of thermal and motion activity in episode mfa1 (see Figures 3A, B). At this time, however, the IR images show an initial peak, at least for sz1 and sz4 (compare Figures 3A1,4, 4), but the heat development continues in these nest regions and reaches its overall peak only after 8–10 min experimental time, as is also the case in other nest regions.
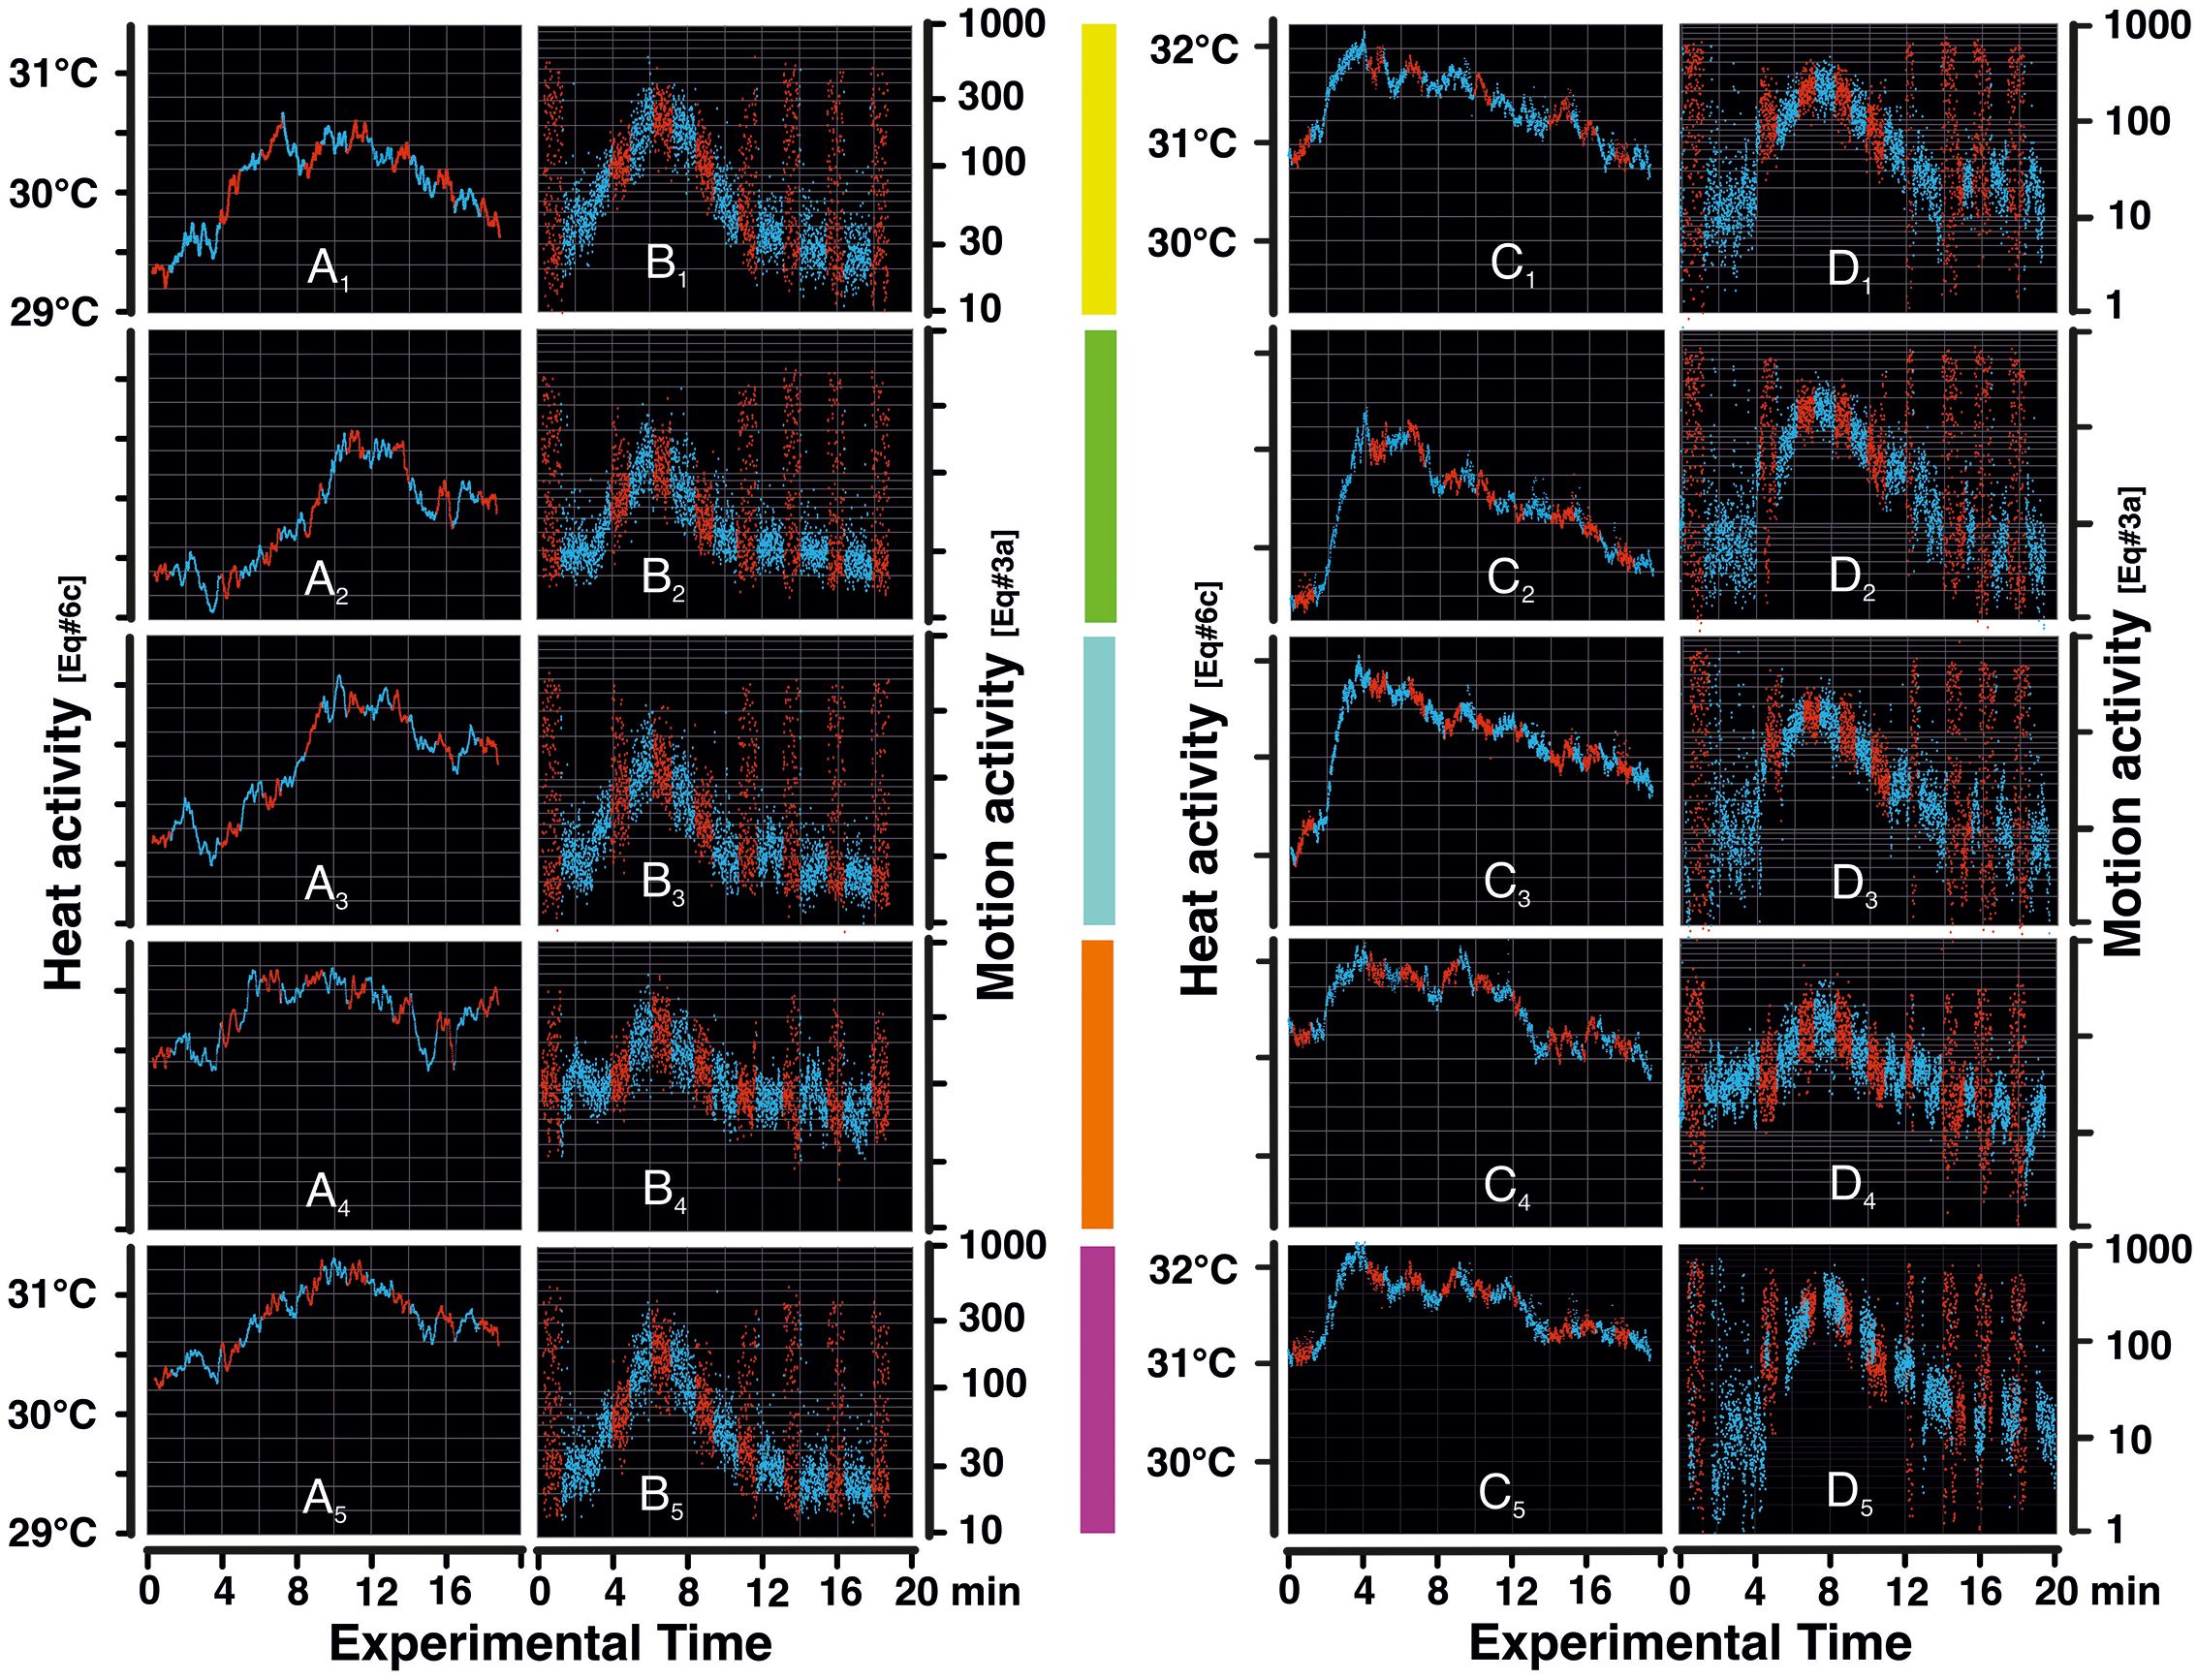
Figure 3. Heat and motion activities in episodes mfa1,2. Panel (A) refers to the heat activity plots of episode mfa1; the dots represent thermogenic data (according to Supplementary Equation 6C) in the temperature range of 29.0°C–31.5°C, plotted in time steps of ≈0.3 s. Panels (A1–5) display the data of the five surveillance zones (sz1–5) as defined in Figure 4; the vertical color bars in the middle of the figure between the left and right columns of the panels represent these five surveillance zones. Panel (B) displays the motion activity plots of episode mfa1, which range from 10 to 1,000 motion-active pixels per surveillance area and frame (Supplementary Equation 3A). The individual pixels represent motion data at time intervals of 0.3 s which were averaged from a >15 times higher original frame rate at 50 Hz, to match the infrared (IR) camera's frame rate of ≈3 ff/s. Panels (C, D) display the thermal and motion activity plots of episode mfa2. In the graphs, the blue dots refer to nPd sessions without the presentation of the dummy wasp, and the red dots refer to Pd sessions with the presentation of the dummy wasp. The mass flight activity (MFA) phase in episode mfa1 lasted ≈2–10 min experimental time so that additional 2 min was documented in the pre-MFA phase and 8 min in the post-MFA phase. Episode mfa2 gives similar data, at least in respect of motion activity to classify the duration of the MFA phase. The white arrows in panels (A, B) indicate the initial peak of the pre-MFA pulse in heat and motion domains in episode mfa1.

Figure 4. Surveillance zones in episodes mfa1–3. For each of the three episodes (mfa1–3) selected for this paper, the collective motion activities (Kastberger et al., 2024) and heat development (Figures 2, 3) were observed and measured in five surveillance zones (sz1–5) on the nest surface, each defined in the image as a square area of 10,000 px with a side length of 100 px. Converted to the real world, each surveillance square corresponded to an area of 129.05 cm2 with a side length of 11.36 cm. Surveillance zones (sz1–5) represent five topographical areas of the nest in which different social functions are assigned to the bees involved. In particular, (sz4) (bottom left) refers to the mouth zone, while the other four zones (sz1,3–5) were representative of nest regions in different directions from the mouth zone. Additionally, the two surveillance zones (sz6,7) were defined to assess ambient temperature conditions. Surveillance zone (sz6) was defined on the background concrete above the nest attachment zone, and surveillance zone (sz7) was selected on the lower left side, outside the outline of the nest partly in the ambient air. This position provides the data on the temperature in the environment (for further information on the ambient temperature at position (sz7), see Supplementary Figure S1).
Surveillance zone sz1 (top left) was located just above the mouth area (Morse and Laigo, 1969; Kastberger et al., 2011b; Kastberger, 2014) of the nest and faced preferably the sun in the afternoon. Zone sz2 (top-right) was located in the upper-right area of the nest, and it was farthest from the mouth zone and close to the attachment to the concrete. Here, the comb cells under the bee curtain were used for storing honey and pollen rather than for rearing brood. In zone sz3 (bottom right), which was located in the lower-right nest region and thus also far distal to the mouth zone, new honeycomb cells are built at the edge, and thus, the nest is continuously expanded; centrally, this zone extends into the actual reproductive area of the nest. Zone sz4 (bottom left) concerned the mouth zone, which is the interface between the inside and the outside of the bee curtain. This is where most of the motion activities and social contacts that govern the collective life of the colony take place continuously during the day; these are the departure and the arrival of the foragers, dancing (Robinson, 2021), trophallaxis (Crailsheim, 1990; Farina and Núñez, 1991; Camazine et al., 1998; Crailsheim, 1998), and guarding (Moore et al., 1987; Breed et al., 1990; Weihmann et al., 2014). Finally, surveillance zone sz5 (mid), located in the center between the upper attachment zone and the lower nest rim, represents the main reproductive area of the colony. In addition, two surveillance zones (sz6 and sz7) were defined in the IR images to assess ambient temperature conditions. The surveillance sz6 was defined on the concrete to the left and above the nest in the image (Figure 4) and is to be considered a reference point only for the nestmates that adhere to this substrate. During the day, the concrete warms up in the sun and cools down during the night with a delay. For the majority of nest members, the temperature values of the open air (as can be seen in zone sz7 on the lower left side of the image, outside the edge of the nest in the image) represent a more useful reference and were selected for further analysis of the ambience (Supplementary Figure S1).
In order to prove the defense capability under normative conditions, the test colony was subjected to disturbance by the presentation of a dummy wasp in a specific cycle for 1 min or more at a time (Figure 3). For this purpose, a computer-controlled device was installed in front of the nest (dw in Figure 1). The wasp dummy consisted of a 5-cm-long cylinder with yellow and black stripes, which was attached to a pulley with a thread so that it could wobble back and forth in a horizontal direction during movement. It was driven at a constant horizontal speed of 10 cm/s for at least 30 s at intervals of at least 1 min, passing parallel to the nest at a distance of 30 cm. The intensity of the disturbance selected for the experiments ensured that successive shimmering waves (Kastberger et al., 2011b; Kastberger et al., 2012; Weihmann et al., 2012; Kastberger et al., 2014b) were triggered in the semi-quiescent state. For the selected MFA episodes (mfa1–3), the arousal regime (Figure 5, panel 0; Figure 6A) was designed so that sessions without presentation of the dummy wasp (nPd) alternated regularly with sessions in which the dummy wasp was presented (Pd) for at least 30 s. For instance, in episode mfa1 (Figures 3A, B), the Pd sessions lasted approximately 1 min (δt [Pd] = 1.018 ± 0.059 min; nsess = 8), while the nPd sessions had a duration of approximately 2 min (δt [nPd] = 2.166 ± 0.209 min; nsess = 8).
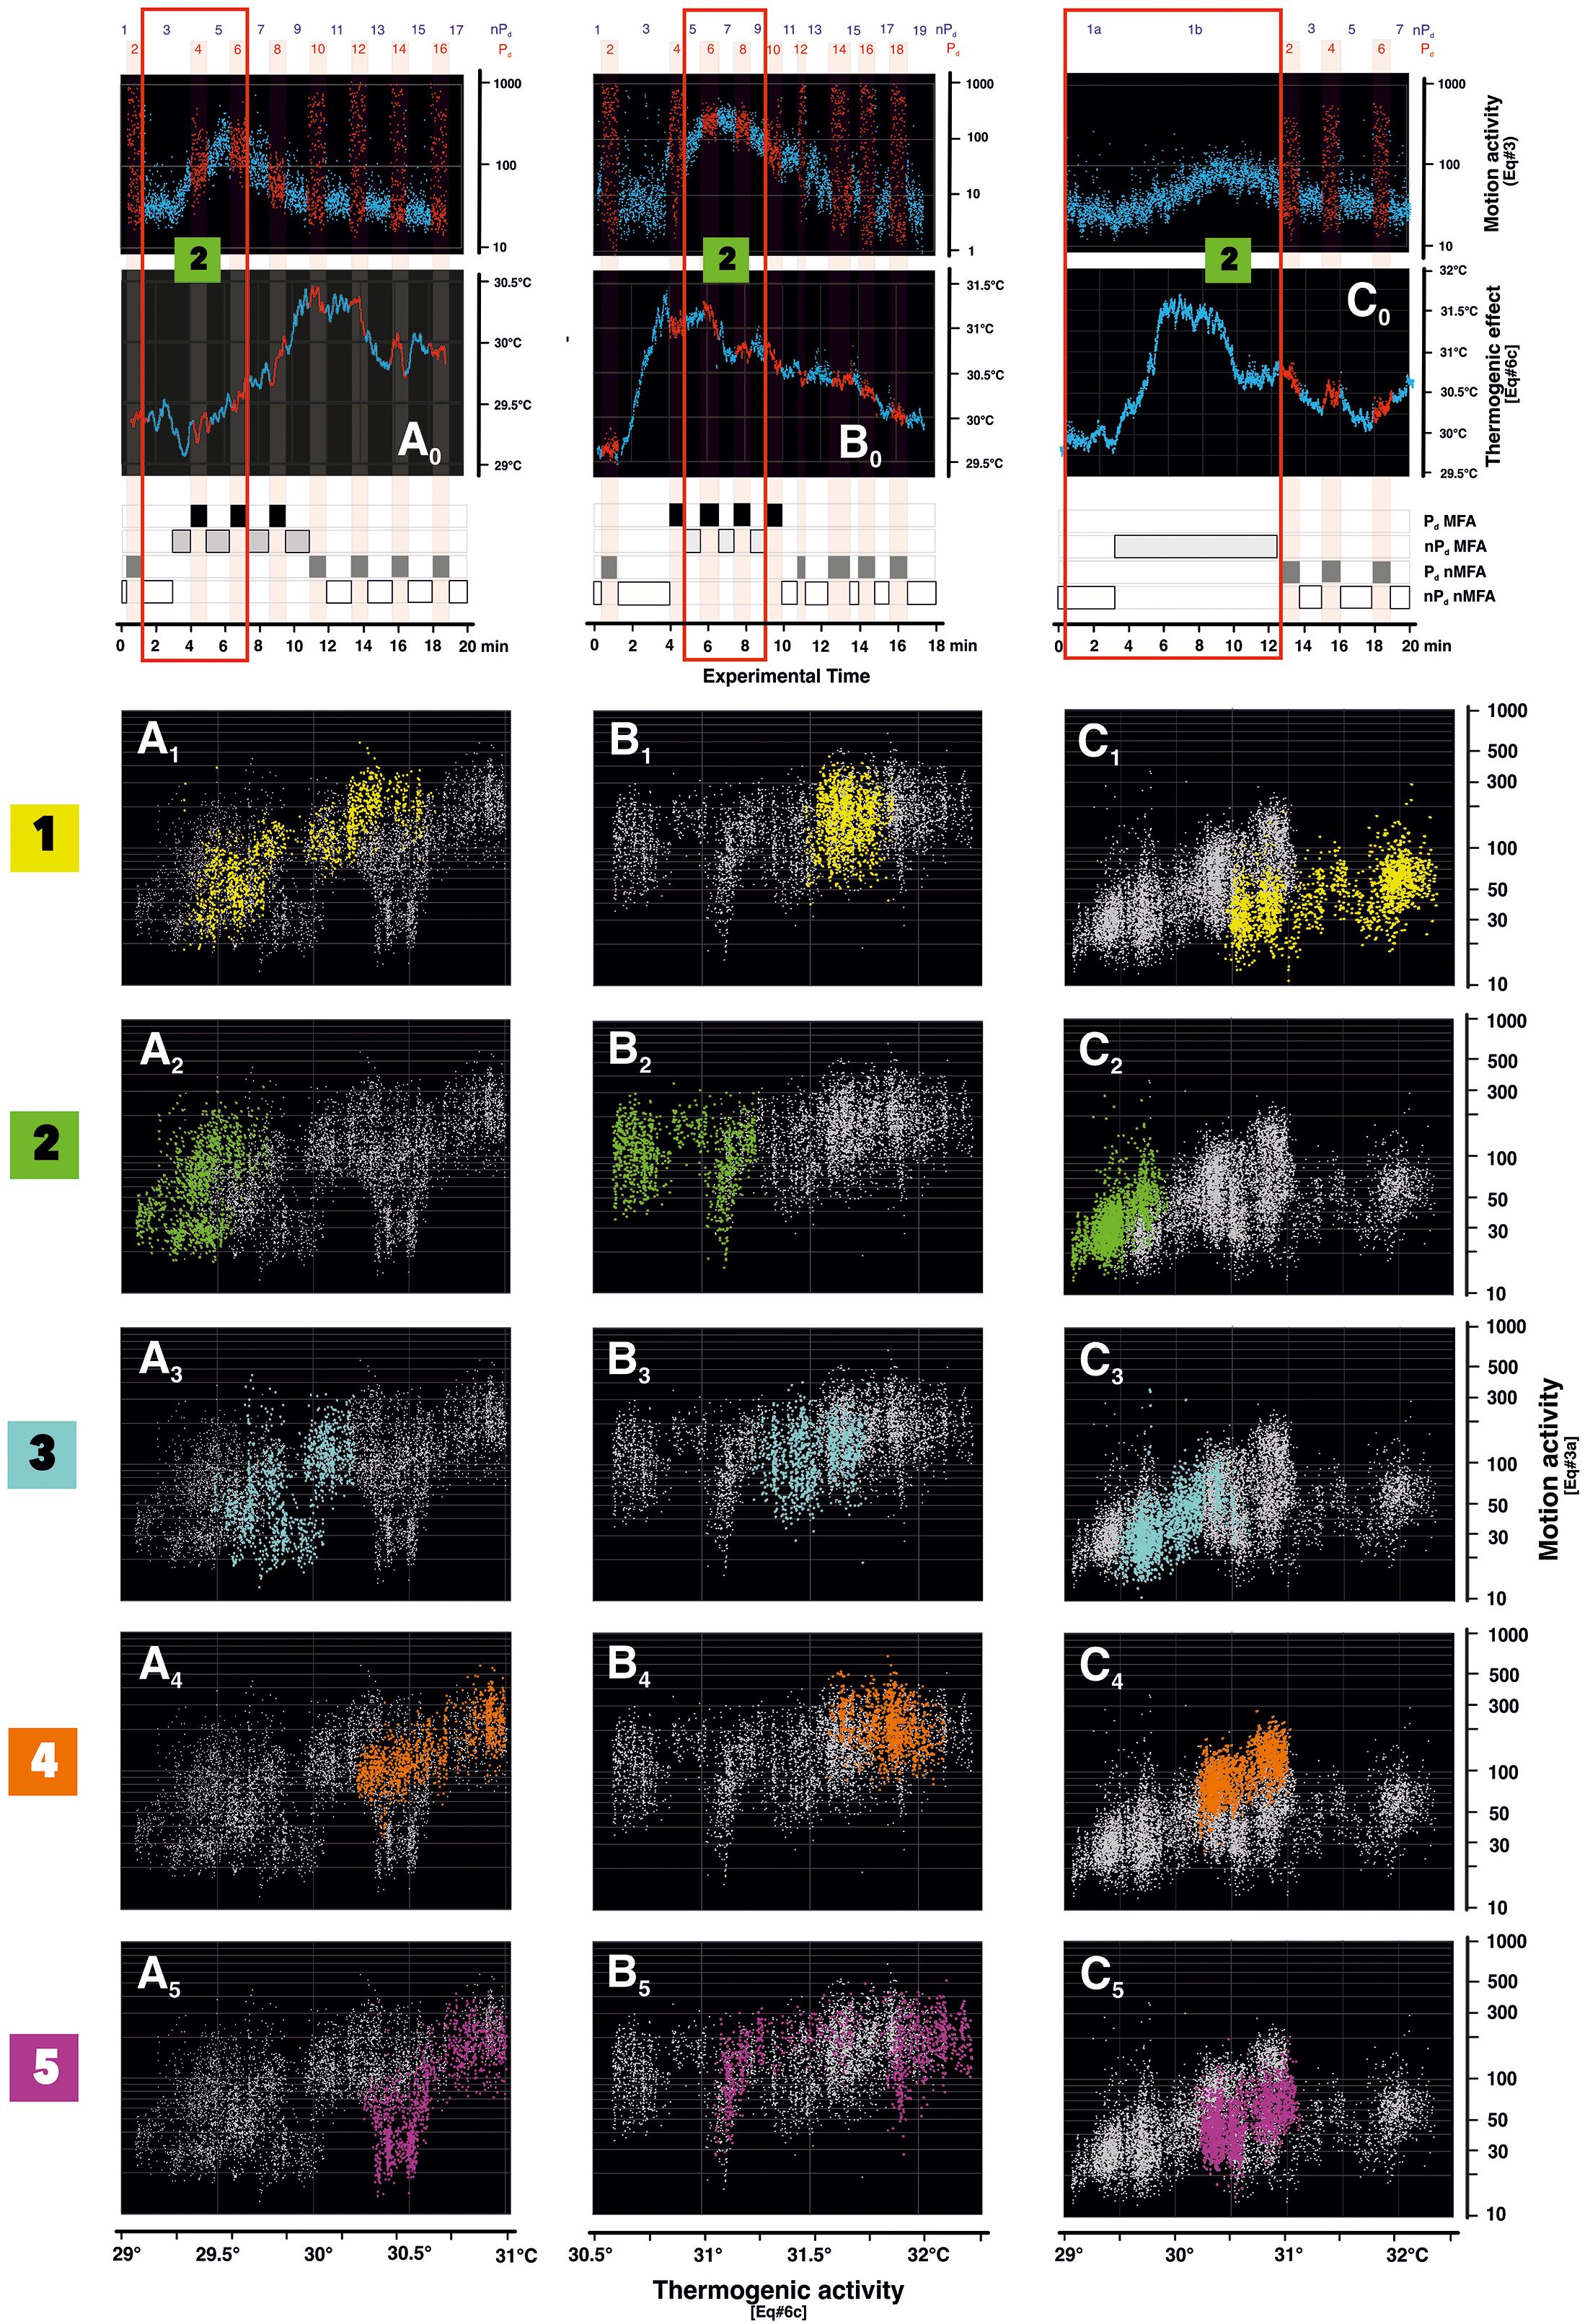
Figure 5. Correlation between thermogenicity and motion activity in the ascent and peak branch of mass flight activity (MFA) phases in episodes mfa1–3. Panels (A–C) refer to the three episodes mfa1–3 analyzed in this paper; panel 0 gives the respective example plots of motion activity (Supplementary Equation 3A) and heat data (Supplementary Equation 6C) of surveillance zone (sz2) (as also shown in Figure 3), the data points of the nPd phases are shown in blue, and those of the Pd phases are in red. The red open rectangles indicate the frames around the experimental sessions referred to in the lower plots panels (A–C). The four categories of excitation states ([Pd, MFA], [nPd, MFA], [Pd, taken within the same second. In the three episodes analyzed, the data selections (nMFA], and [nPd, nMFA]) are noted as block diagrams along the abscissas of panel 0; for more information on the motion activity data, see (Kastberger et al., 2024). The correlation diagrams (A1–5… C1–5) refer to the five surveillance zones (sz1–5) (according to panels 1–5) with the same color coding of the surveillance zones, as defined in Figure 4. The abscissas show the heat values (Supplementary Equation 6C), and the ordinates display the values of the motion activity. Each point in the diagrams refers to a single data pair from an infrared (IR) image and the video image see open red rectangles in panel 0) only refer to the ascent and peak sections of the MFA phases, in which there was hardly any shimmering activity in the Pd sessions. This is because such defense responses would strongly distort the general trend of the correlation between the two data strands. The data of mfa1 stretch from the experimental session Pd3 to nPd5 (1,175 frames, summing up to 5,875 data because of the five surveillance zones); mfa2, from nPd5 to nPd9 (ff 1,025; 5,125 data); and mfa3, from nPd1a to nPd1b (ff 1,749; 8,745 data). The important information in this figure is the arrangement of the differently colored data blocks in the correlation diagrams, which refer to topographically and functionally different nest zones.
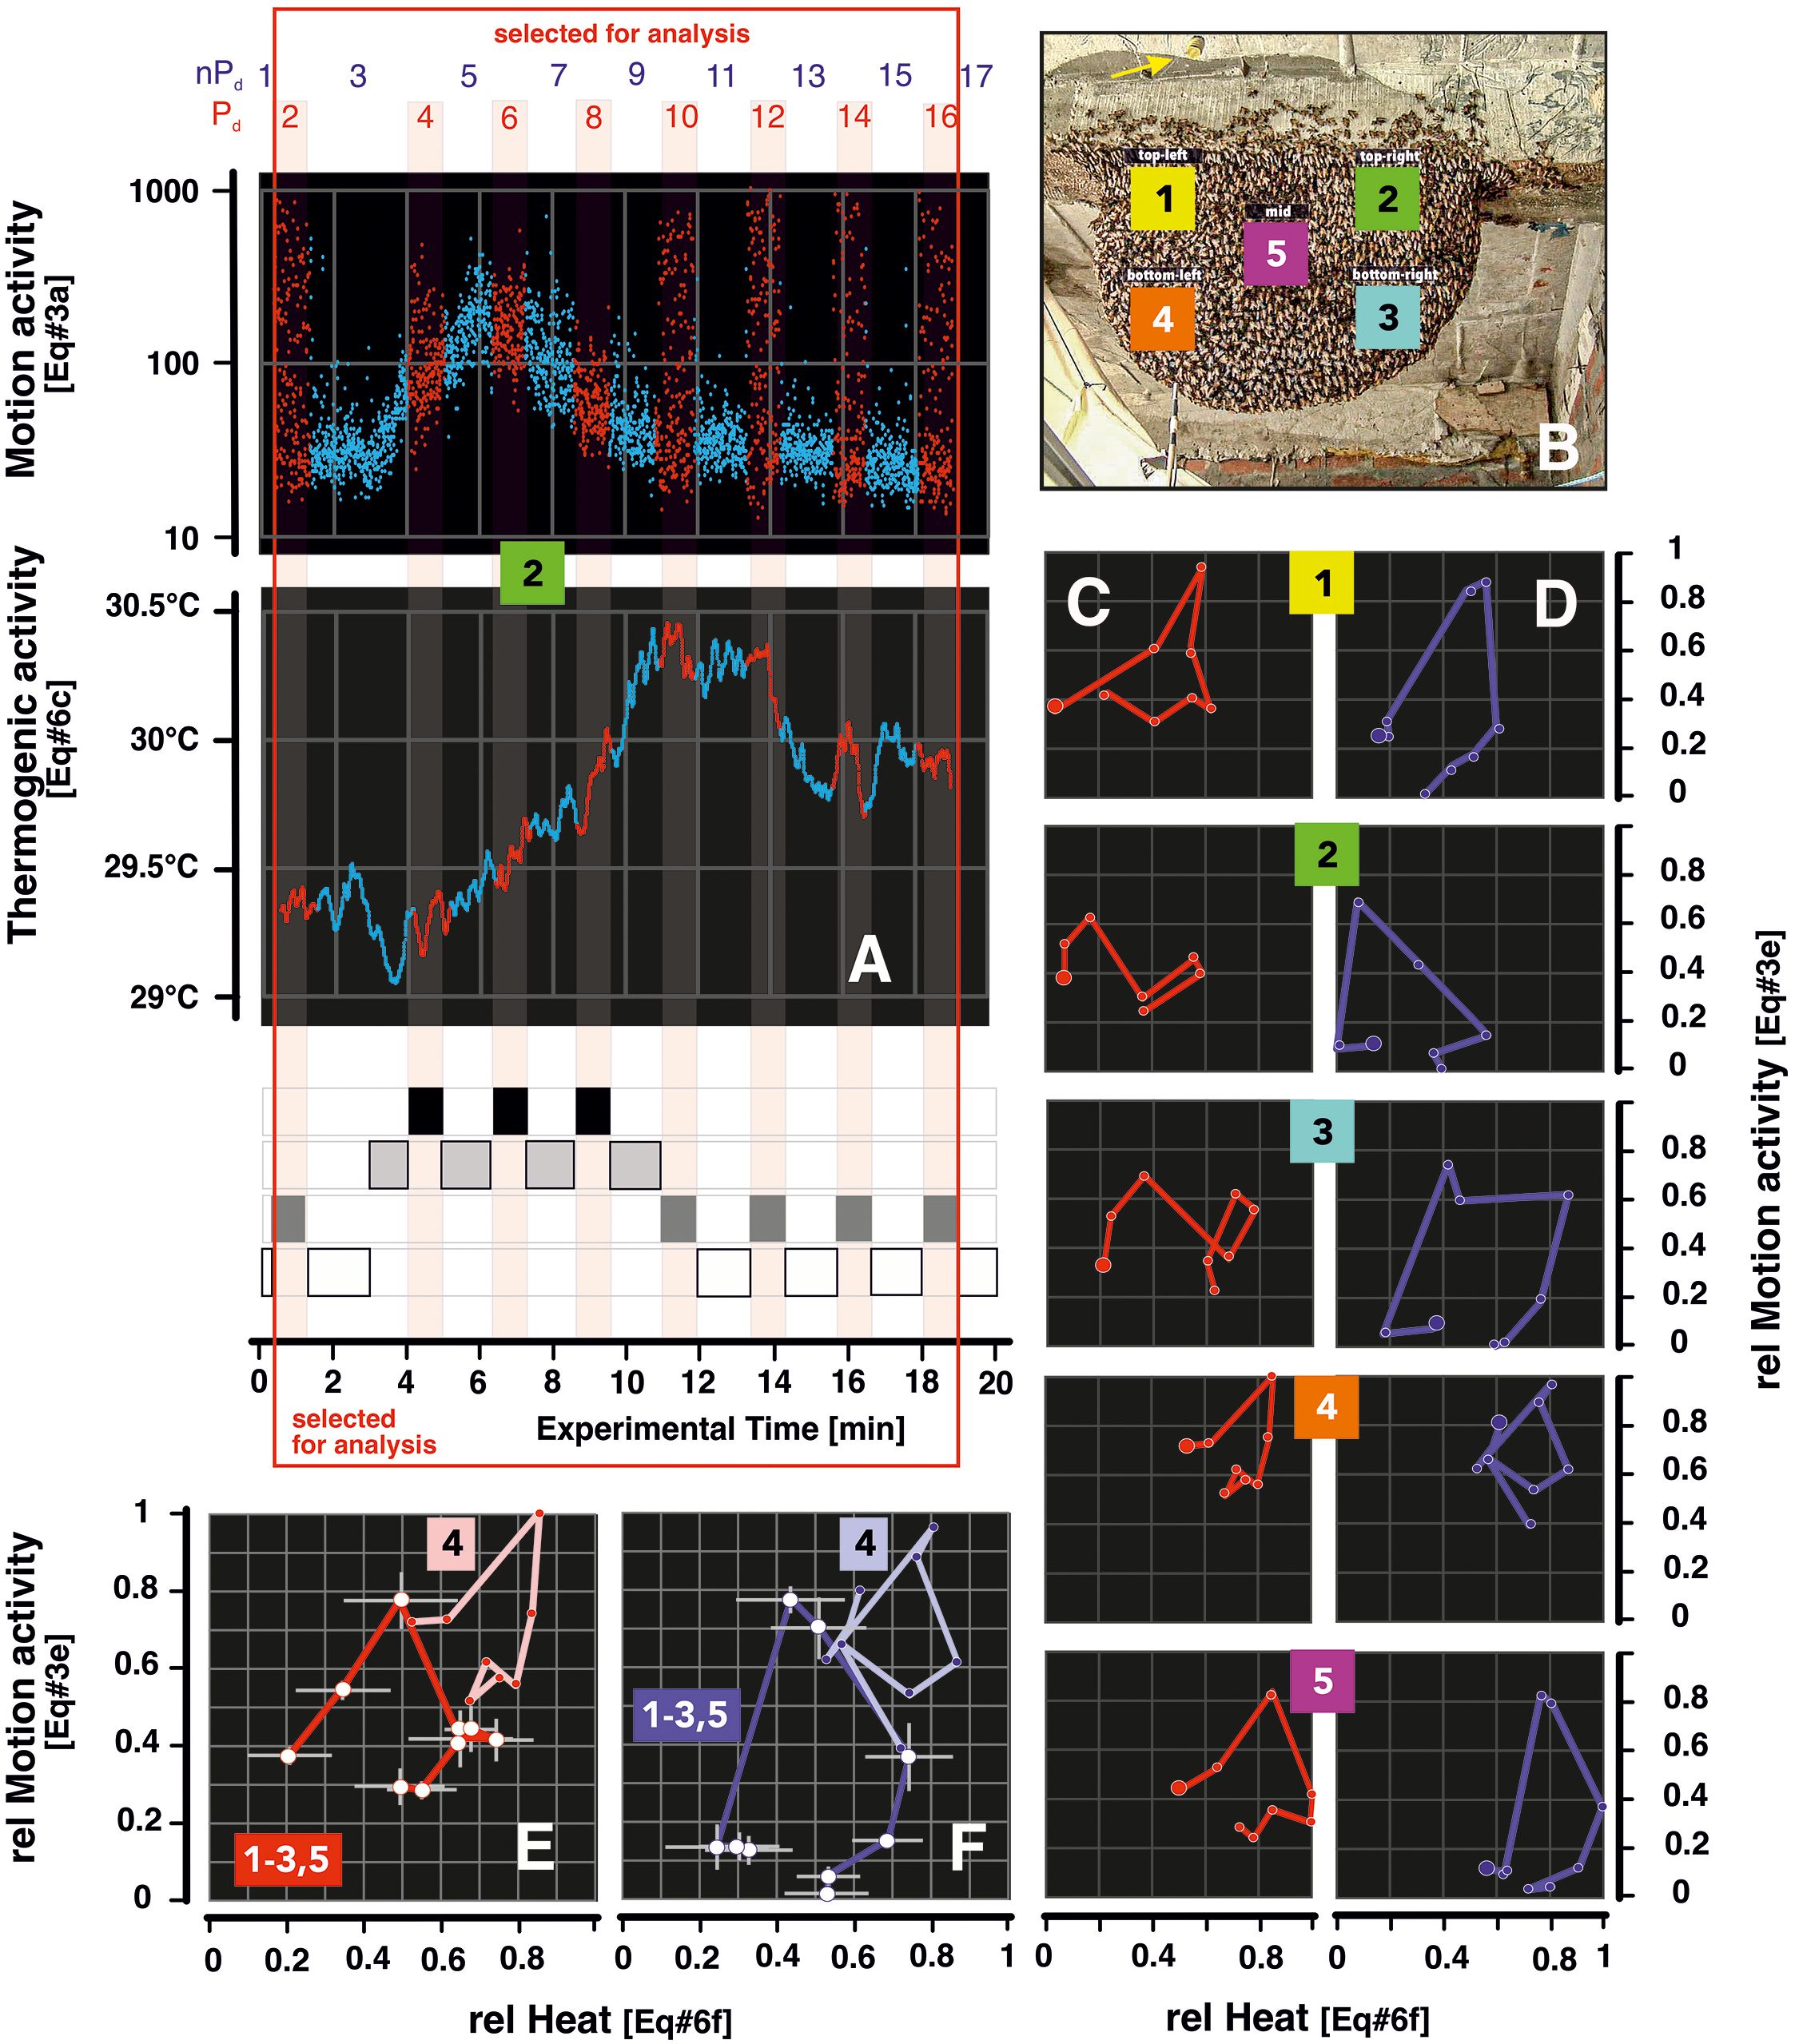
Figure 6. Cycling heat and motion from pre-MFA to post-MFA in episode mfa1. Panel (A) gives sample plots sz1; mfa1 for motion (top graph; Supplementary Equation 3A) and heat (bottom graph; Supplementary Equation 6C). The red dots refer to Pd sessions, and the blue dots to nPd sessions, as explained in the four block diagrams of excitation phases below (for definition, see also Figure 5, panel 0). The red open rectangle frames the experimental sessions that were considered in the evaluation plots in panels (C–F). Panel (B) gives the survey of the surveillance zones of the experimental nest (as already shown in Figure 4). Panels (C, D) display the circular correlation graphs with the ordinate the arithmetical mean values of motion (Supplementary Equation 3E; the respective mean errors resulting from the number of frames per experimental session are neglected here due to the small magnitudes), and on the abscissa, the arithmetical means of heat (Supplementary Equation 6D), for the even-numbered sessions Pd2–16 (red-colored codes) and the odd-numbered nPd3-15 (blue), see panel (A). Panel groups 1–5 refer to the data sets of the five surveillance zones (sz1–5) (see numbers in the center of the pair of panels). Both motion and heat values are normalized between 0 and 1, where the value 1 refers to the maximum singular value of the respective motion or heat values, namely, for all Pd and nPd sessions; the value 0 stands for the minimum singular value of the respective data sets. The bigger full circles at one end of the circular graphs signify the start points, which are Pd2 for red and nPd3 for blue curves. Panels (E, F) refer to the summarization of the data of panels (C, D) with mean values (white points) and mean errors (vertical and horizontal bars) for the four non-mouth zones (sz1–3,5), indicated by “1–3, 5”) and for the singular values for the mouth zone (sz4), indicated by “4”). The values of both parameters were selected on the basis of a pcc criterion (Pearson's correlation coefficient); for this purpose, the pairs of values at the lag condition (theat < tmotion) between 0 and 50 frames with the highest value of the pcc value (according to Supplementary Equations 8C, E) were selected. The motion and heat values are also normalized between 1 and 0 (Supplementary Equations 3E, 6D), and again, the color red indicates Pd sessions and blue nPd sessions.
These experimental conditions made it possible to observe and measure the test group under four excitation conditions (Figure 5, panel 0; Figure 6A): a) the state of semi-quiescence (Kastberger et al., 2024) without excitation by the dummy presentation before or after the MFA phase (nPd, nMFA); the term “semi-” is used here because most of the nest is at quiescence, while motion, at least in parts of the bees' bodies, or even locomotion of individual bees in the mouth zone is still ongoing at most times of the day; b) the state of semi-quiescence with the excitation by the dummy presentation before or after the MFA phase (Pd, nMFA); c) the state of mass flight without excitation by the dummy presentation (nPd, MFA); and d) the state of mass flight with dummy presentation (Pd, MFA).
Therefore, in the example of episode mfa1 (Figures 3A, B), the status of quiescence can be assigned for non-mouth-area surveillance zones sz1–3,5 for the sessions nPd1 and 3, before MFA started, and also for the sessions after the termination of MFA (nPd 9–17) with odd counts (Figures 3A, B). The status of the mouth zone (sz4; Figures 3A4, B4) is non-quiescent due to the locomotor activities as long the mouth zone exists during the day. Non-quiescence in surveillance zones sz1–3,5, which are peripheral to the mouth zone, is formally characterized by two criteria: first, by the occurrence of shimmering behavior (Kastberger et al., 2012; Kastberger et al., 2014b) in response to the presentation of the dummy wasp, which happens in the Pd sessions predominantly in nMFA state; second, by the colony-specific disorder of the nest structure during MFA, which affects all zones and layers of the bee curtain, even on both sides of the nest. The explanations given here for episode mfa1 can similarly be applied to episodes mfa2,3. However, episode mfa3 differs from the other two episodes (mfa1,2) in that the cyclic presentation of the wasp dummy only began after the “MFA” phase had already ended several minutes earlier.
Motions on the surface of giant honeybee nests were quantified using image analysis [Image-Pro®, Flir; Fiji (Schindelin et al., 2012)] by determining differences in luminance values pixel by pixel between two consecutive images (Supplementary Equation 1; see Supplementary Material for equations). Changes in ambient light (Supplementary Figure S1) hardly affect the motion monitoring at the nest surface, which is based on luminance (Kastberger et al., 2024), because such changes occur over much longer periods of time and then only gradually. Therefore, it can be assumed that any change in luminance that can be detected in a single pixel area between two consecutive images in the documented sequences was caused by either noise or motion. Noise occurs stochastically, while motion leads to non-stochastic changes in luminance. Motion can be actively generated by the focus individual itself and can then affect individual body parts such as wings, abdomen, thorax, caput, or extremities, or it can occur passively, with neighbors moving the affected bee as a whole in a certain direction in the bee curtain through an impulse of a single or collectively through a number of bees. The high resolution of differential luminance at the pixel level in 24-bit RGB format enables the detection of motions of extremely small magnitudes, even if they only occur on certain parts of a honeybee’s body. From two consecutive images (at the times ti−1 and ti), a difference image is assigned to the time ti (Supplementary Equation 1), segmented (Schindelin et al., 2012) into motion-active and motionless pixel states (Supplementary Equation 2), and refined by digital erosion and dilation processes (Kastberger et al., 2024) to minimize ambient noise.
The motion activity of the colony at time ti can be quantified using the motA measure (Supplementary Equation 3A), which is the sum of the motion-active pixels in a given region of the nest, as shown for the five surveillance zones sz1–5 in episodes mfa1–2 (Figures 3B, D). In the last step, the motA values were normalized (Supplementary Equation 3G) to ensure comparability of the motion strength across different experimental conditions. For this purpose, the maximum motion activity was determined for each MFA episode (mfa1–3), taking into account all surveillance zones over the entire time range of the recording.
Motion data were analyzed comprehensively in this paper in two ways: a) motion profiles, such as the plots in Figure 3B, represent the temporal sequence of the sum of the motion-active pixels (according to Supplementary Equation 3A) in a frame-to-frame sequence, which refers to the respective surveillance zone (sz1–5). b) Histogram-based motion spectra represent distributions of motion data (Supplementary Equation 3A) recorded in a specific time range (e.g., experimental phases such as Pd or nPd sessions) in a selected surveillance zone (sz1–5); here, the numbers of cases per size class are plotted on the ordinate against the category of the size class on the abscissa. The logarithmic scaling of the motion strength (Supplementary Equation 4A) gives the motion spectra an approximately Gaussian distribution shape. This is modified by various influences, such as shimmering or the MFA. The extent of this modulation can be described by the skewness (Supplementary Equation 5G) of this probability distribution (Kastberger et al., 2024).
An IR camera (Flir A320 (Flir, 2005); resolution: 320 × 240 px at a maximum rate of 7–8 Hz) was used to monitor the heat development on the entire test nest during mfa1–3 episodes with a frame rate of ≈3 Hz. Surveillance zones sz1–5 as defined for the video frames were placed in the IR image at the same topographical position as in the motion analysis [(Kastberger et al., 2024), Supplementary Videos S1–S3). Due to the lower resolution of the IR imagery, these zones accounted for only approximately one-quarter of the number of pixels compared to the video images used for motion analysis, with the same relative size in relation to the nest extent (selected sizes in IR images: sz1, 2,399 px; sz2, 2,399 px; sz3, 2,549 px; sz4, 2,861 px; sz5, 2,549 px). Two additional zones (sz6, 1,055 px; sz7, 1,295 px) were defined in the IR image (Figure 4), which were taken for comparison with the ambient temperature. The influence of the ambient temperature on the nest surface can be estimated by directly comparing the measured values from different regions of the same IR image (Supplementary Figure S1B), which was only one-tenth of the increase during MFA. It can be seen that the IR data in the nest area were not distorted in polarity by the recording conditions (IR lens, sensors, and environment) in a range of ±0.04°C (Supplementary Figures S1D, E). By focusing on differential measurements, also in comparison with ambience, and incorporating a large amount of data, the accuracy of temperature data interpretation can be improved to a threshold of <0.01°C.
The average of these IR pixel values per surveillance zone was taken as the measure, but it was further smoothed over the time sequence, using an x19 running average method that considered the values over ±9 time steps of IR frames before and after the selected time point (Supplementary Equation 6C). These heat data were linked to the motion data determined from the video images with the same time stamp. In episode mfa1, the motion analysis referred to 60,707 frames, which, for an average frame rate of 50 Hz, corresponds to a recording duration of 20.1 min of the experiment. The IR images for mfa1 were only acquired over 18.8 min, which results in 3,693 images with an image duration of ≈0.3 s (see Supplementary Videos S1–S3). In the mfa2 episode, the original number of motion analysis frames was 63,339 with an IR image sequence of 4,197 frames; in the mfa3 episode, there were 68,315 motion frames and 4,655 IR images.
Reactivity to external stimuli in the domain heat or motion can be expected in a bee collective on the nest surface within a latency period of seconds or minutes (Kastberger et al., 2024). Methodological difficulties arise particularly in the heat domain, as there are a number of intrinsic processes [such as transformation processes during MFA (Kastberger et al., 1996; Kastberger et al., 2024) or the collective background ventilation of the bee curtain (Kastberger et al., 2016)] that can partially mask reaction-induced local changes of the heat pattern. To cope with this kind of complexity, the relationship between collective thermicity and motion after the onset of a new arousal phase was analyzed using a cascade of Pearson's correlation analysis (Supplementary Figure S3; Supplementary Equation 8). For this, a big data basis exemplified as a case study for episode mfa1 from parallel recorded IR (with >20,000 heat data) and video images (with >300,000 motion data) was considered. This quantifies heat–motion coupling on the nest surface in different behavioral contexts, relating to the five topographically and functionally distinct surveillance zones and also to the two arousal paradigms (Pd and nPd), which were offered alternately over a sequence of 17 experimental sessions. These complex event-driven variables serve to filter out collective reactions to external disturbances that are overlaid or masked by processes of a different genesis.
The derivation of this benchmark is explained in detail in Supplementary Figure S3 for the experimental session Pd12 of episode mfa1. It initially includes the coupling of the behavioral parameters heat and motion, which is determined by cross-correlation using Pearson's correlation coefficient (PCC) over a period of 30 s. In the case of Pd12 (Supplementary Figure S3), the start of this comparison by cross-correlation occurs 30 s after the transition from an nPd session (here in Supplementary Figure S3: nPd11) to a subsequent Pd session (here: Pd12).
There are two basic lag conditions to be distinguished: the heat–motion coupling with the lag mode (theat < tmotion) (Supplementary Equations 8B, C) considers the heat data as leading; the pcc values in the selected time range are plotted from lag (motion) = 0 s to +14.7 s (Supplementary Figure S3C, right-side scale). The reverse assignment is considered by the motion–heat coupling (lag mode: [theat > tmotion]; Supplementary Equations 8D, E; see Supplementary Figure S3C, left-side scale; for a more detailed description, see caption of Supplementary Figure S3).
In these cross-correlations, the motion range was frozen for all partial correlations with the heat data sets, but in the following steps, these cross-correlations were repeated with motion ranges, which are varied across the range of ff 100–150 (these special definitions are explained in detail in Supplementary Equations 8B–E). This makes it possible to check how robust the correlation curves are in their dependence on the lag parameter, i.e., over which period of time the coupling properties remain unchanged, even if the heat data set shifts forward by a few seconds and thus the motion data set shifts backward, which means that the distance between the onset of heat and the onset of motion increases as a result (Supplementary Figure S3C). For this purpose, these correlation results were averaged over two time intervals (I1,2), over which this reference of the motion data was shifted (I1 = ff 100–110; I2 = ff 110–125; Supplementary Figure S3D; Supplementary Equations 8H, I). In the next steps, the results were cumulated (cum pcc; Supplementary Equations 8J, K) and normalized in the range of ±1 (rel cum pcc; Supplementary Figure S3E; Supplementary Equations 8L, M) to allow comparability between different behavioral states; e.g., these normalized values can be used to compare the behavioral aspects of the two classes of arousal phases (nPd and Pd) across the changing states of the mass flight (pre-MFA, MFA, and post-MFA) throughout the course of an mfa episode. In the last step, benchmarks were then formed from these cumulative data at four points in time (Supplementary Equations 8N–P), separately for the five selected surveillance zones sz1–5 (see vertical arrows in Supplementary Figure S3E). The derivation of these four values in the time steps of 4 s makes it possible to actually consider them as independent since in such time steps, different processes could be active in both the heat and motion domains. If this were the case, it would also be less possible to make a statement about the correlation between heat and motion.
The interpretation of these data can be based on two aspects: first, such a cumulative analysis with delays of up to 8 s (this applies to the four discrete time points in Supplementary Figure S3D, right panel) enables a statistical analysis of the robustness of the heat–motion coupling. Second, a response to an external perturbation stimulus can be demonstrated by the difference in these benchmarks of heat–motion coupling that is observed between a selected session of dummy presentation (Pd [i]) and the two nPd sessions that immediately precede and follow it (nPd [i − 1], nPd [i + 1]; for definition, see Supplementary Figures S3A, B). These differences can be verified by their significance status (p < 0.01; t-test), whereby the number of data here is determined by the number of selected lag points (which are normative defined by four lag points (of +3-s, +6-s, +9-s, and +12-s delays) in two constellations (I1 = ff 100–110; I2 = ff 110–125; Supplementary Equation 8I) and by the number of surveillance zones selected.
In the time course of the heat–motion correlation (Figure 7), it is also decisive whether the corresponding mean values of the respective Pd or nPd sessions deviate from the zero line and themselves represent a positive or negative correlation. It is important to realize that these data are ambiguous because, for example, a positive correlation can mean that more heat development is temporally linked to more motor activity or, conversely, that less heat development is linked to less motion. Similarly, a negative correlation is defined if more heat development correlates temporally with less motion, but also if less heat correlates with more motion. Therefore, the additional observations from the previous work (Kastberger et al., 2024) must be used to give the correlation results of Figure 7 a clear definition, in particular, from the motion side.
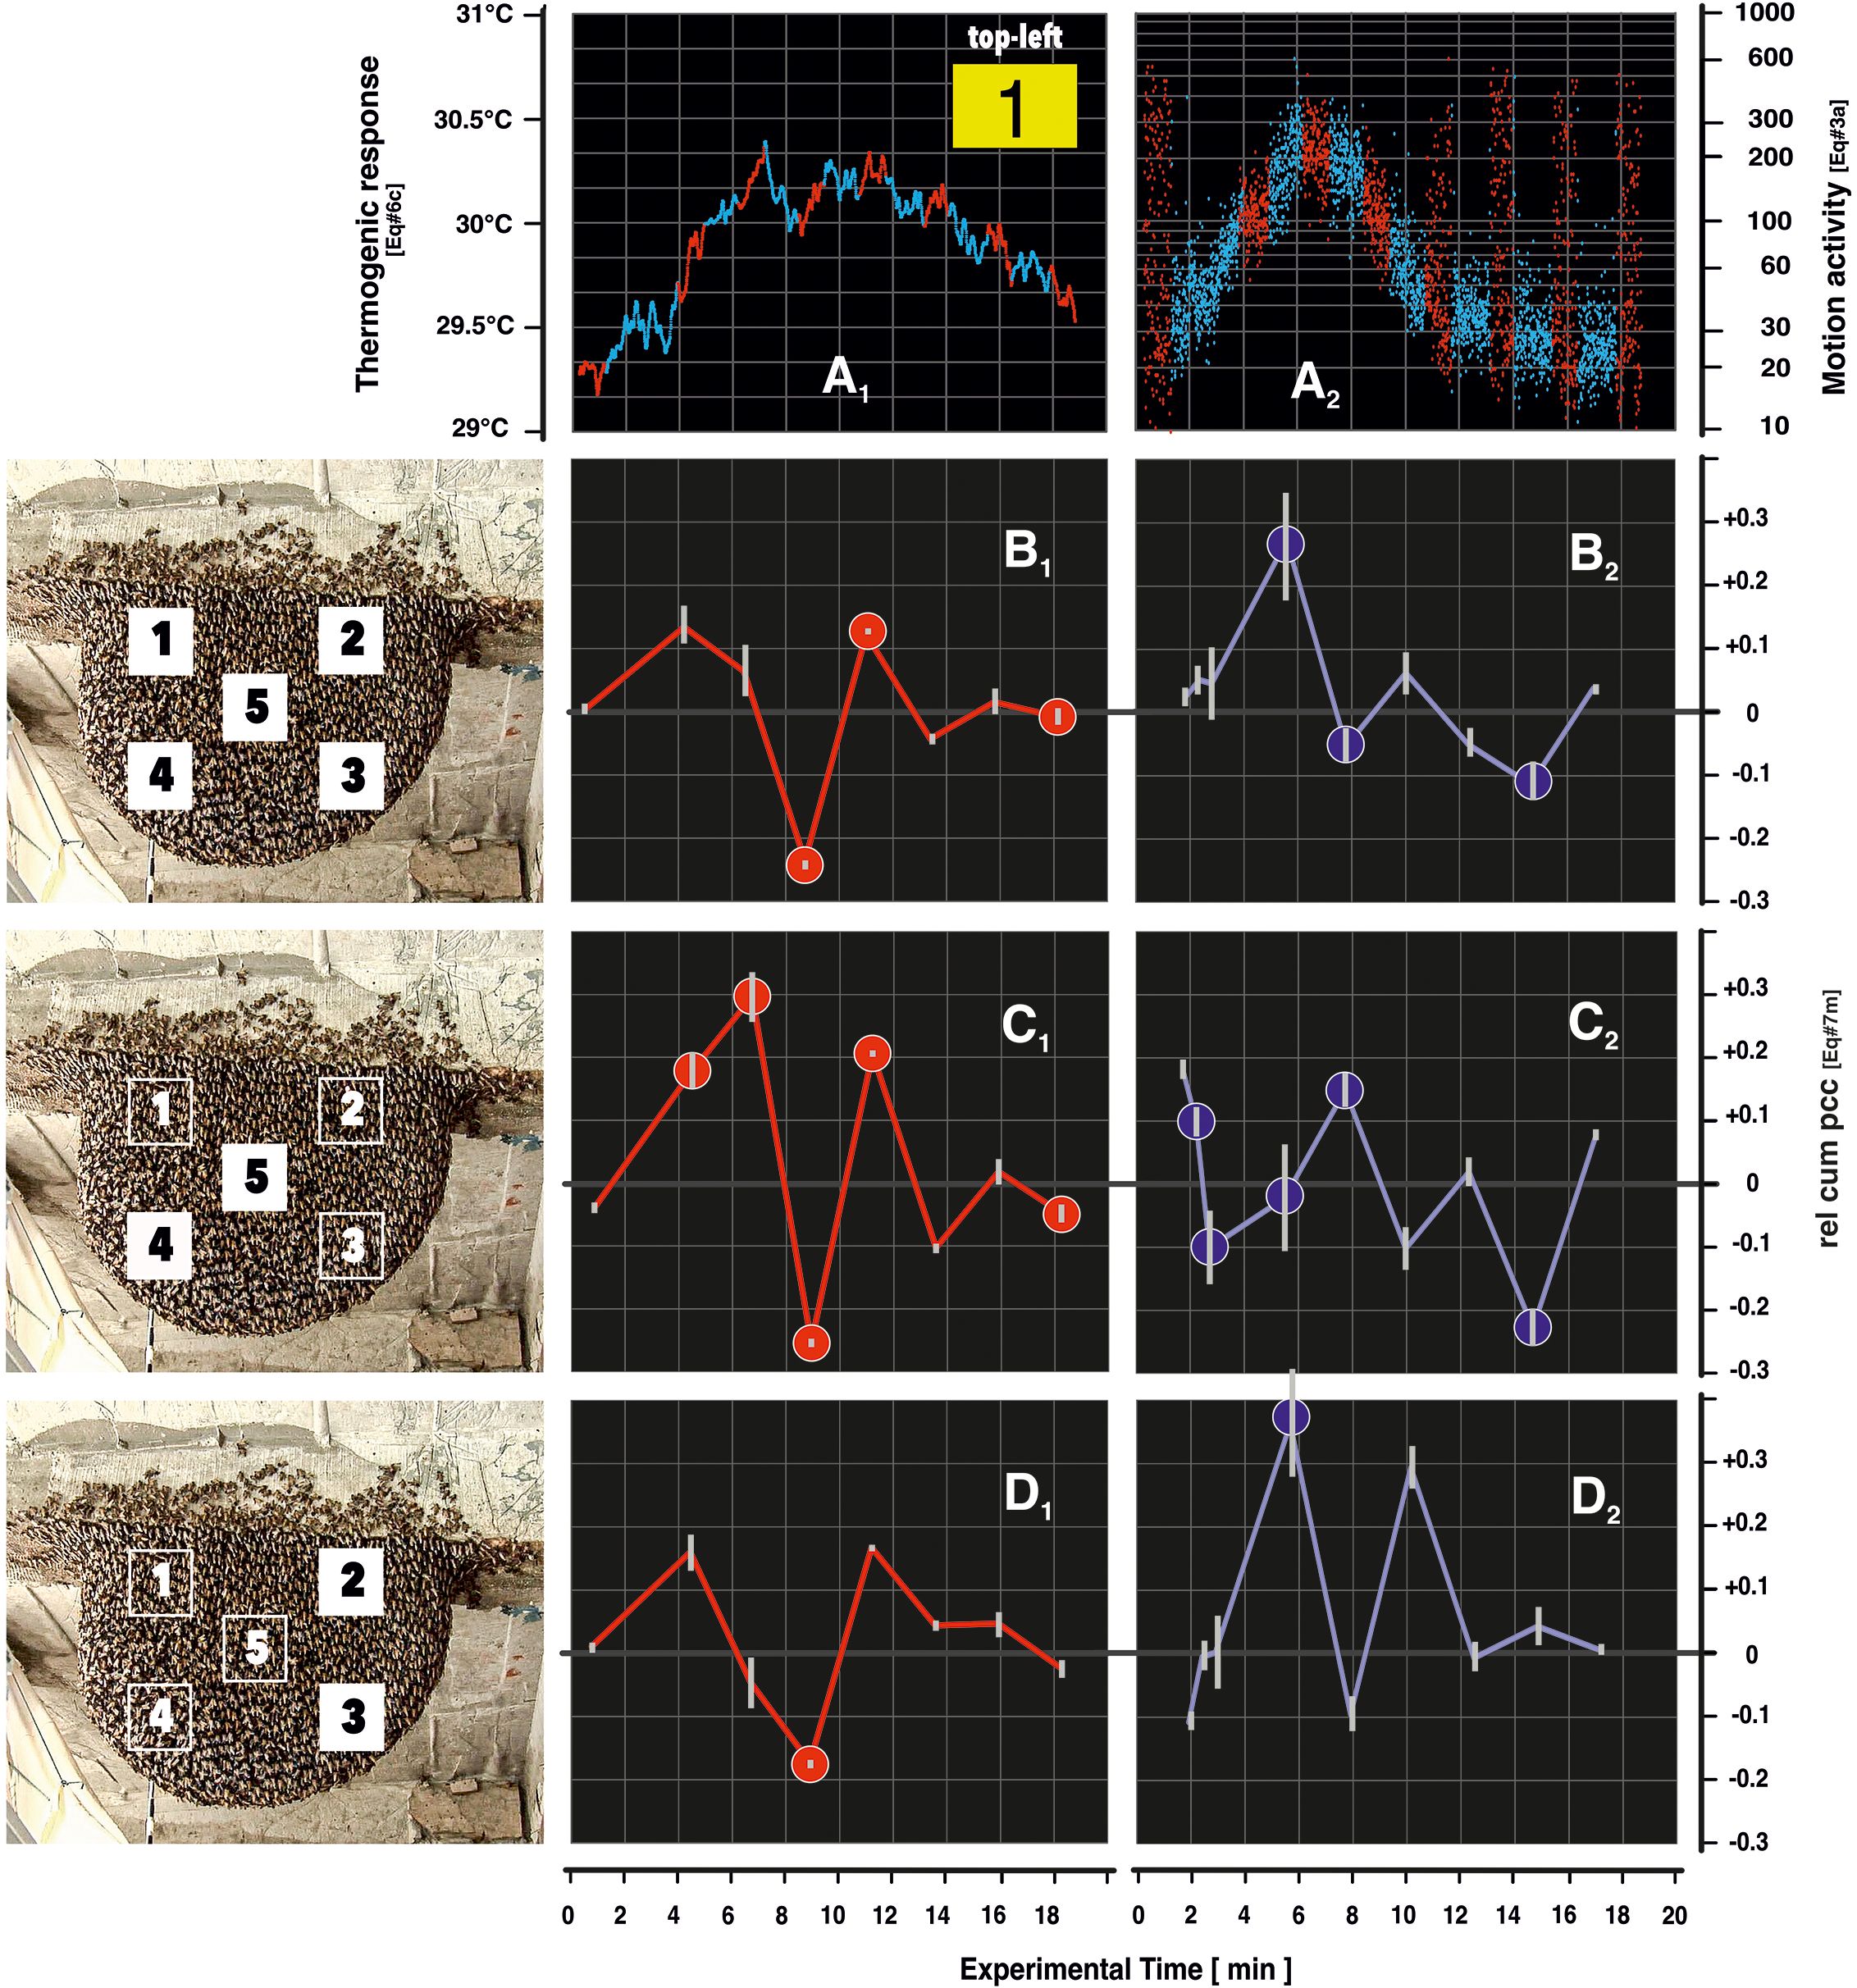
Figure 7. Coupling of heat and motion in Pd and nPd phases in episode mfa1. Panel (A) gives example recordings from surveillance zone (sz1; A1), heat development (Supplementary Equation 6C), (A2), motion activity (Supplementary Equation A in the course of episode mfa1 (see also Figure 4); blue dots refer to nPd sessions and red dots to Pd sessions. Panel (B) summarizes the change of heat–motion coupling under the condition (theat < tmotion) (according to Supplementary Equation 8C) over the experimental time for episode mfa1. The values of the discrete points give the mean values of coupling (parameter rel cum pcc: Supplementary Equations 8M–P) for all five surveillance zones (sz1–5; B1) explains the coupling for the Pd sessions and panel (B2) for the nPd sessions (for more global details, see the algorithm detailed in Supplementary Equation 8 and its graphical explanation in Supplementary Figure S3). The solid circles (red in panel B1 and blue in panel B2) show significant (p < 0.01, t-test) differences between the respective Pd and nPd sessions. The white vertical lines at each measuring point represent the mean errors relating to the eight different constellations with two image sequences (I1 = ff 100–110; I2 = ff 110–125; Supplementary Equation 8) and four lag points (+3, +6, +9, and +12 s; see Supplementary Figure S3E; Supplementary Equations 8N–P); the similar small mean errors resulting from the polling of the five surveillance zones are neglected in the calculation of the overall mean error values for reasons of simplification. In panel (C), the graphs relate to similar data constellations for the two near-mouth zones (sz4,5) and in panel (D) for the two zones in the right periphery of the nest (sz2,3) as explained in the left-side panels. It should be noted that three dates were calculated for this episode mfa1 regarding the nPd3 phase because this session spanned a period longer than the others, and it was during this session that the mass flight activity (MFA) state began. This can be easily inferred from the data of the motion domain (see Figure 3B (Kastberger et al., 2024).
The present study is limited to a single experimental nest and refers to three episodes (mfa1–3) of MFA as a case study. All recorded episodes start with the semi-quiescent (Kastberger et al., 2024) pre-MFA state of the colony, including the ascent, summit, and descent phases of the MFA, and continue for a further 8 min in the post-MFA semi-quiescence. With two simultaneously assessed physical variables, heat (Figures 3A, C; Supplementary Equation 6C) and motion [Figures 2, 3B, D; Supplementary Equation 3A; (Kastberger et al., 2024)], temporal and spatial patterns of behavioral nest conditions were displayed. The formal duration of the MFA, which is used as a time value in further analysis, was derived from the motion data (Figures 3B, D).
IR imaging distinguishes in the rainbow 900 color scale format warm areas of the nest surface with red and cooler areas with blue (Figure 2). The coolest zones in pre-MFA semi-quiescence were located in the upper nest zones, which attach the nest directly over a layer of insulating empty cells to the concrete of the hotel's terrace ceiling; also, the nest area on the right edge of the image, which faced away from the sun and toward the outer wall of the hotel terrace, was cooler than others.
The temperature configuration of the nest of the experimental colony shows a clear temperature gradient, which was due to the way it was built: one edge of the nest (the one on the left in the image) was facing more toward the daylight; this half of the nest also received the sun in the afternoon hours. In this nest region, the so-called mouth zone (Morse and Laigo, 1969; Kastberger et al., 2010; Kastberger et al., 2011b) regularly develops anew in the early morning and eventually expands toward the nest center and can be distinguished by the motion and heat profiles (Figure 2; Supplementary Videos S1–S3) (Kastberger et al., 2011b; Kastberger et al., 2024). As it is the interface between the interior of the nest and its external environment, there was a particularly high density of bees with actively or passively heated body parts, such as forager bees that have just returned from their foraging flight with their flight muscles already warm or that are heating up their thoracic muscles (Stabentheiner et al., 2003; Stabentheiner et al., 2004; Stabentheiner, 2005; Stabentheiner and Kovac, 2014) so that they can take off; or the guard bees with their heated thoraces that constantly patrol the entrance to the nest interior; or also those nestmates that have just come out of the nest and thus carry the warmth of the nest interior at a temperature of approximately 36°C (Stabentheiner et al., 2003; Seeley, 2009) with all parts of their bodies to the outside. Astonishingly, foraging activity at the nest was only slightly restricted by MFA and continued almost normally (see Movies in (Kastberger et al., 2024) and Supplementary Videos S1–S3).
During the MFA, however, many bees simply emerged from the inner layers of the nest through the net of the bee curtain, which happened across the entire nest (Supplementary Videos S1–S3). These are mainly young bees that hatched earlier from the comb cells below. They followed the general excitement in the nest and came out to defecate for the first time. At the peak of the MFA, many nestmates flew away from the nest (Kastberger et al., 1996), made a few rounds in the vicinity of the nest, and returned to the nest after a few minutes. This literally removed the cooler surface layer of the bee curtain, which was leveled with the ambient temperature, and thus exposed the next deeper layer, which was then somewhat warmer because it was closer to the nest's interior temperature.
At the end of the MFA, general locomotor activity decreased under nPd conditions, and the readiness to produce shimmering was restored, but heat production was still significantly increased in most nest areas compared to pre-MFA conditions (Figure 2).
The initial level of heat radiation before the onset of the MFA phase was significantly higher in the regions near the estuary (sz4,5) than in the peripheral regions (sz2,3), and this applied to all episodes (mfa1,2: Figures 3A, C; mfa3: Figure 5C). Surveillance zone sz1, which lay above the mouth zone, is an interesting exception here, as the semi-quiescent thermogenic activity in the mfa2 episode was higher than that in the mfa1 episode. This can be explained by the fact that the sz1 zone can be considered a “peripheral” zone in the mfa1 episode, whereas in the mfa2 episode, it was more of a functional “near-mouth” zone.
A slow pulse of a few minutes duration, correspondingly developed in both thermogenic and motion domains [e.g., Figure 3B; see also (Kastberger et al., 2024)], can be regarded as the first sign that an incipient MFA process terminates the semi-quiescent nest state. This conclusion was drawn from the analysis of the main features of this incident involving heat and motion: in episode mfa1, this heat pulse showed a bipolar time course (which essentially took place in the experimental session nPd3; Figure 3A) and can be observed in all five surveillance zones (sz1–5) with similarly long time courses but with staggered start times (Supplementary Figure S2; for the algorithm, see Supplementary Equation 8). The MFA phase began here with a slight delay and rose much more slowly than in the mfa2 episode (Figures 3C, D), which is why these more pronounced pre-MFA heat pulses could be analyzed well in episode mfa1 across the entire nest. They formed after a slight rise to a short plateau, which was followed by a steep pulse of 0.2°C (Supplementary Figure S2A). This led to the development of a clear peak, which immediately dropped to a level that was even lower than that at the beginning of session nPd3 in all five nest regions observed. Only afterward, but still in session nPd3, did the heat rise rapidly and strongly, which apparently corresponds to the first proper part of the MFA in episode mfa1.
The time values of this conspicuous first rose of this pre-MFA pulse (Supplementary Figure S2B; Supplementary Equation 7I), but also its heat maximum (Supplementary Figure S2C; Supplementary Equations 7C, D), can be regarded as the main characteristics of this pulse. This shows that this pulse spread as a wave across the nest, both thermally and through motion (Figure 3) (Kastberger et al., 2024). It began in the mouth area (Supplementary Figures S2B, C) and then reached the upper-left nest area (sz1) and the lower-right nest area (sz3), and finally, it could be detected in the upper-right area (sz2) and the mid nest area (sz5). This pulse, which itself had a duration of 1–2 min in the heat domain, took a total of 18 s from the mouth zone to the furthest edge of the nest. This impulse was more pronounced in the mfa1 episode in the domain of warmth than in the domain of movement, and, in addition, it was most noticeable in the mouth zone [see Figure 3B4 and (Kastberger et al., 2024)].
As documented for episode mfa1, after the pre-MFA impulse in both domains passed over the entire nest and also subsided again, the main thermogenic activity characteristic of the MFA set in and also spread over the entire nest within a few minutes in an also topographically defined sequence. The first peaks of this massive heat increase in the nest were measured in the mouth zone (sz4) and the zone above (sz1) at 5–6 min experimental time (Figures 2, 3A1,4). In the peripheral zones (Figure 3A2,3), the heat developed much more slowly and reached its peak after 10–12 min experimental time, 2–4 min later than the maximum motion activity (Figure 3B2,3). Episode mfa2 provides a different picture (Figure 3C1–5) in that the heat in the entire nest reached its peak almost simultaneously and after only 4 min of the experiment. Despite these obvious differences, in both episodes mfa1 and mfa2, the temporal course of heat activity in the mouth zone (sz4) differs greatly from that in the “marginal zones” at the right edge of the nest. The heat wave begins at an already high level in the mouth zone, jumps to an even higher level, and forms a heat plateau at the peak phase of the MFA (Figures 3A4, D4). The thermogenic activity in the MFA lasts longer in the mouth zone than in other nest areas and then also remains above the semi-quiescent level of the other nest areas.
The findings of the two episodes (mfa1,2) show that the way in which the MFA spreads can be quite different between episodes even in the same nest (episode mfa3 is not considered in Figure 3 because it differs from mfa1,2 in the stimulation regime; see Figure 5). The common feature, however, is that the initial peaks in thermal and motor activity originate in the mouth zone, and the shimmering ability is also initially suppressed in the mouth zone as the MFA mode increases (Figures 3B4, D4). This confirms that the MFA propagates away from the mouth zone as a transformation wave in both the heat (Figure 3A) and motion domains [Figure 3B; (Kastberger et al., 2024)]. This is also confirmed by the time values of the mid-region (sz5; Figure 3A5), which reaches its heat peak, e.g., in mfa1 at 9.5 min observation time, i.e., 4 min later than it started in the mouth zone and also slightly earlier than it arrived at the lower-right nest edge (sz3; Figure 3A3).
The thermogenic activity in the mfa1 episode shows that the heat values in all five observation zones, however differently they peak, only fall to approximately one-half of the value between the initial value in the pre-MFA phase and the maximum value reached in the MFA phase within the observation window of 20 min. The reason for this is that the transformation processes triggered by the MFA have obviously not yet been completed across the entire nest. During the mfa2 episode, the heat wave developed quickly and evenly within a few minutes, and at the end of the observation phase, the heat values returned to the original pre-MFA values, at least in the zones close to the mouth (sz1,4,5). In contrast, the heat values in the peripheral zones (sz2,3) showed a flat downward trend after reaching the peak but did not yet reach the moderate pre-MFA level by the end of the observation phase.
A gross comparison of the time profiles in the two episodes mfa1,2 (Figure 3) suggests that thermogenic activity does not correlate directly with collective motion on the nest surface. Rather, both parameters seem to develop fairly independently of each other but are clearly episode-specific; if at all, the heat development is delayed in time compared to the motion activity (sz1–5). For a more in-depth analysis, which was even carried out here by all three episodes (mfa1–3), the correlation attempt between heat and motion was limited to the ascent and peak phases of heat development in the respective MFA (see Figure 5, panels A0–C0). This makes it easier to estimate the general trend of the progression of heat and motion because no shimmering actions (except on Pd5 in mfa1) must have been taken into account, which would still occur significantly in the increasing MFA phase under the proper stimulus regime, especially in peripheral nest regions (Figures 5A–C, panels 1–5).
These diagrams contain some important cross-episode aspects: a) each of the five surveillance zones was assigned a specific position in the correlation diagram, which can be clearly understood as functional differentiation. b) The mouth zone (sz4; color code orange in Figure 5, panel 4) achieved the highest motion activity levels in all three episodes; the heat development in mfa1,2 lay on higher scale values of the correlation diagram. c) The latently higher temperature in the mouth area can be explained by the fact that the individuals gathered here also had higher thorax temperatures due to the motor activity or their level of arousal associated with their social functions (Seeley, 1986; Stabentheiner and Kovac, 2014) and that heat was also constantly carried out of the nest interior here. d) In the mfa3 episode, the heat values in the mouth zone were in the mid-range compared to the other two episodes. e) Similarly, locomotor activity was also reduced in the mfa3 episode compared to mfa1,2 episodes [see also (Kastberger et al., 2024)] but still remained the most active region of the nest in terms of motion activity. Both behavioral aspects are related to the episode-specific history of mfa3 in which the nest remained undisturbed by the wasp dummy until after the MFA phase (see Figure 5C0). f) Lateral zone sz2 (green in Figure 5, panel 2) showed the lowest values of heat development and motion in all three episodes, and therefore, the corresponding scatter plot appears in the lower left of the correlation plot. This nest area was accordingly not only the furthest from the mouth area in terms of topography but also the most functionally distinct from it. g) Although the side zone sz3 (turquoise in Figure 5, panel 3) bordered the lower-right edge of the nest, in all three episodes, its data in the correlation plot were docked to those of the mouth zone (Figures 5A–C, panel 3). This means that surveillance zone sz3, in contrast to sz2, was more closely linked to the mouth zone in terms of the behavioral parameters heat and motion. (h) The heat and motion activities of zone sz1 (yellow in Figure 5, panel 1) began in the data distribution of episode mfa1, where that of sz2 ended, and extended with their data into the point cloud of sz4. In episode mfa2, the heat range of sz1 was much smaller than in mfa1 and was largely co-located with sz4. With mfa3, the heat range extended far beyond that of the mouth zone, albeit with a significantly lower level of motion. Thus, in all three episodes, zone sz1 was even more connected to the mouth zone than sz3 with regard to the characteristics of heat and motion activities, which was apparently related to its topographical proximity to the mouth zone. i) Finally, the mid-nest surveillance zone sz5 (pink in Figure 5, panel 5) had similarly high heat values in mfa1 as the mouth area, but the motion plot extended with greater dynamics. With mfa2, the heat range of sz5 was much larger than that of sz4 and even exceeded that of sz4. In episode mfa3, the heat range of sz5 corresponded to that of the mouth zone, but at a lower motion level.
The summary diagrams in Figure 6 show the same data as in Figure 5 but offer multipolar correlations with a more holistic approach. They focus on the example of episode mfa1 and cover its entire course. They consider heat and motion as behavioral parameters for each experimental session of episode mfa1 and compare the relationships between the arousal states (nPd and Pd sessions), the three MFA-relevant phases (pre-MFA, MFA, and post-MFA), and the monitored nest areas (sz1–5). These correlations are separated for the arousal (Pd: Figure 6E) and non-arousal sessions (nPd: Figure 6F). Both show (semi-) circular shapes of the plots, and both are also characteristically arranged for the “peripheral” non-mouth zones (sz1–3,5; white dots) and those for the mouth zone (sz4; small full dots). The graphs are almost closed in the non-mouth zones under nPd conditions, where the horizontal lines of the mean errors of the heat data between pre-MFA and post-MFA nearly touch, whereas the cycle in the mouth zone is completely closed (Figure 6F).
The normalized heat–motion graphs (Figures 6E, F) are arranged in the same x–y configuration with respect to the nest regions as the point correlations in Figure 5, including a) that the cyclicity of the sequence during mfa1 is counterclockwise and b) that the arrangement of the surveillance zones for the nPd and Pd states (Figure 6) is quite similar. These cyclic hysteresis curves express a particular property for the heat–motion correlation: in terms of heat generation, this constellation is essentially independent of excitation by the periodically administered Pd condition, and a higher level of motion is pronounced in the nMFA state due to the readiness to shimmering. This also emphasizes that the shimmering response of the individual bees themselves has no influence on thoracic heat development. The prominent positioning of the mouth zone in the upper-right area of the correlation graphs, which documents both higher heat values and higher motion activity, makes it reasonable (at least for the sample of the mfa1 episode) to merge the data of the non-mouth zone (sz1–3.5) in order to compare them with those of the mouth zone (Figures 6E, F).
Some features of the heat and motion time profiles (Figure 3) and the heat–motion correlations (Figures 5, 6), especially those comparing episode mfa3 with the other two episodes (mfa1,2), support the assumption that the bees on the nest surface are influenced by external stimuli during the MFA. These findings can only describe the “static” principle given by the comparison of mean values during any experimental arousal (nPd and Pd) session. From this, no further and more differentiated conclusions can be drawn about the extent to which bees can recognize external threats during the MFA and take action against them.
The simultaneous recording of motion and heat data offers the possibility of a “dynamic” analysis, in which the temporal behavioral patterns are clearly displayed and in which time period reactions are present in these areas, which may well be hidden and subliminal. Such a stronger analytical approach to the reactivity to an external threat, as triggered by the presentation of a dummy wasp, can be achieved by analyzing the heat–motion coupling. It is reasonable to expect that such correlation effects can be measured in bees on the nest surface under nMFA conditions, possibly only within 1 min of switching from one arousal paradigm to the next. Proof that such a finding is indeed present in the MFA phase is provided by the following analysis step.
For that, the parameter rel cum pcc (Supplementary Equation 8M) was used to document the heat–motion coupling both in terms of their temporal changes and their nest-topological patterns, again considering only the example of the mfa1 episode. The curve in Figure 7B1 takes into account the heat–motion coupling data of the entire nest during the complete episode mfa1. It shows a clear negative drop after 9 min of the experiment, i.e., in session Pd8, which, if one takes the development of motion activity (see Figures 3A,B) as a benchmark, occurs at the end of the MFA phase, before the colony has switched to active defense mode. Additionally, before and after this negative dip, positive coupling was observed.
Remarkably, the nPd paradigm also showed a significant positive peak in the corresponding time sequence of episode mfa1 (Figure 7B2), namely, in the experimental phase nPd5, which also lay in the rise or even peak phase of the MFA. This nPd curve then dropped significantly (p < 0.01; t-test) at the nPd7 session, but not as sharply as the curve of the Pd state in a similar time range. These results show two things: first, the heat–motion coupling (of the mfa1 episode) changes at the end of the MFA phase in the same sense for the Pd and the nPd binding. This is important because it means that there was only one process behind the heat–motion coupling, which was modulated by a change in the arousal state. Second, external visual threats can cause disruptive effects, leading to significant (p < 0.01; t-test) differences in heat–motion coupling between Pd and nPd phases. Third, this strong, highly significant drop in the heat–motion coupling into the negative range, as it occurred in the Pd state during nest-wide data acquisition, can also be demonstrated when analyzing the mouth zone (Figure 7C1: sz4,5) or the right-sided nest periphery (Figure 7D1: sz2,3) separately. This means that the behavioral effect in the heat–motion coupling caused by the dummy wasp at the end of the MFA phase is an all-nest property. At this time of the episode, it was obviously not possible to trigger any effective defense reaction, as can be seen in the motion diagram of episode mfa1 (Figure 3B), in which no shimmering action could be evidenced. Although these results only refer to the single case analysis of episode mfa1; the documented coupling conditions between heat and motion constitute a reliable statement about the ability to perceive the collective of surface bees at the end of the MFA phase (see Materials and Methods).
On the surface of an A. dorsata nest, heat patterns (Figure 2) with associated motion profiles formed during an MFA episode in a temporal–spatial context (Figures 3, 4). Right at the beginning of each MFA phase examined, a heat–motion impulse was visible (Figures 3; Supplementary Figure S2), which was generated from the mouth area and can be associated with the control of the MFA state. In general, the behavioral patterns observed throughout the nest during MFA phases in terms of thermogenesis and motor activity are not only dominated by internal colony dynamics but also driven by external threats. The cyclicity of the correlation of thermal and motor data (Figures 5, 6) underlines the specific supervisory function of the mouth zone during MFA and highlights its prominent role in controlling social life in the colony. Analysis of the phasic responses in the heat–motion relationships, which are detectable within 10 s of the transition from one experimentally induced state of arousal to another (Figures 7, 8), opens up a new approach that offers unexpected insights into how a colony is able to perceive external threats, particularly during the periodic upheavals of the MFA.
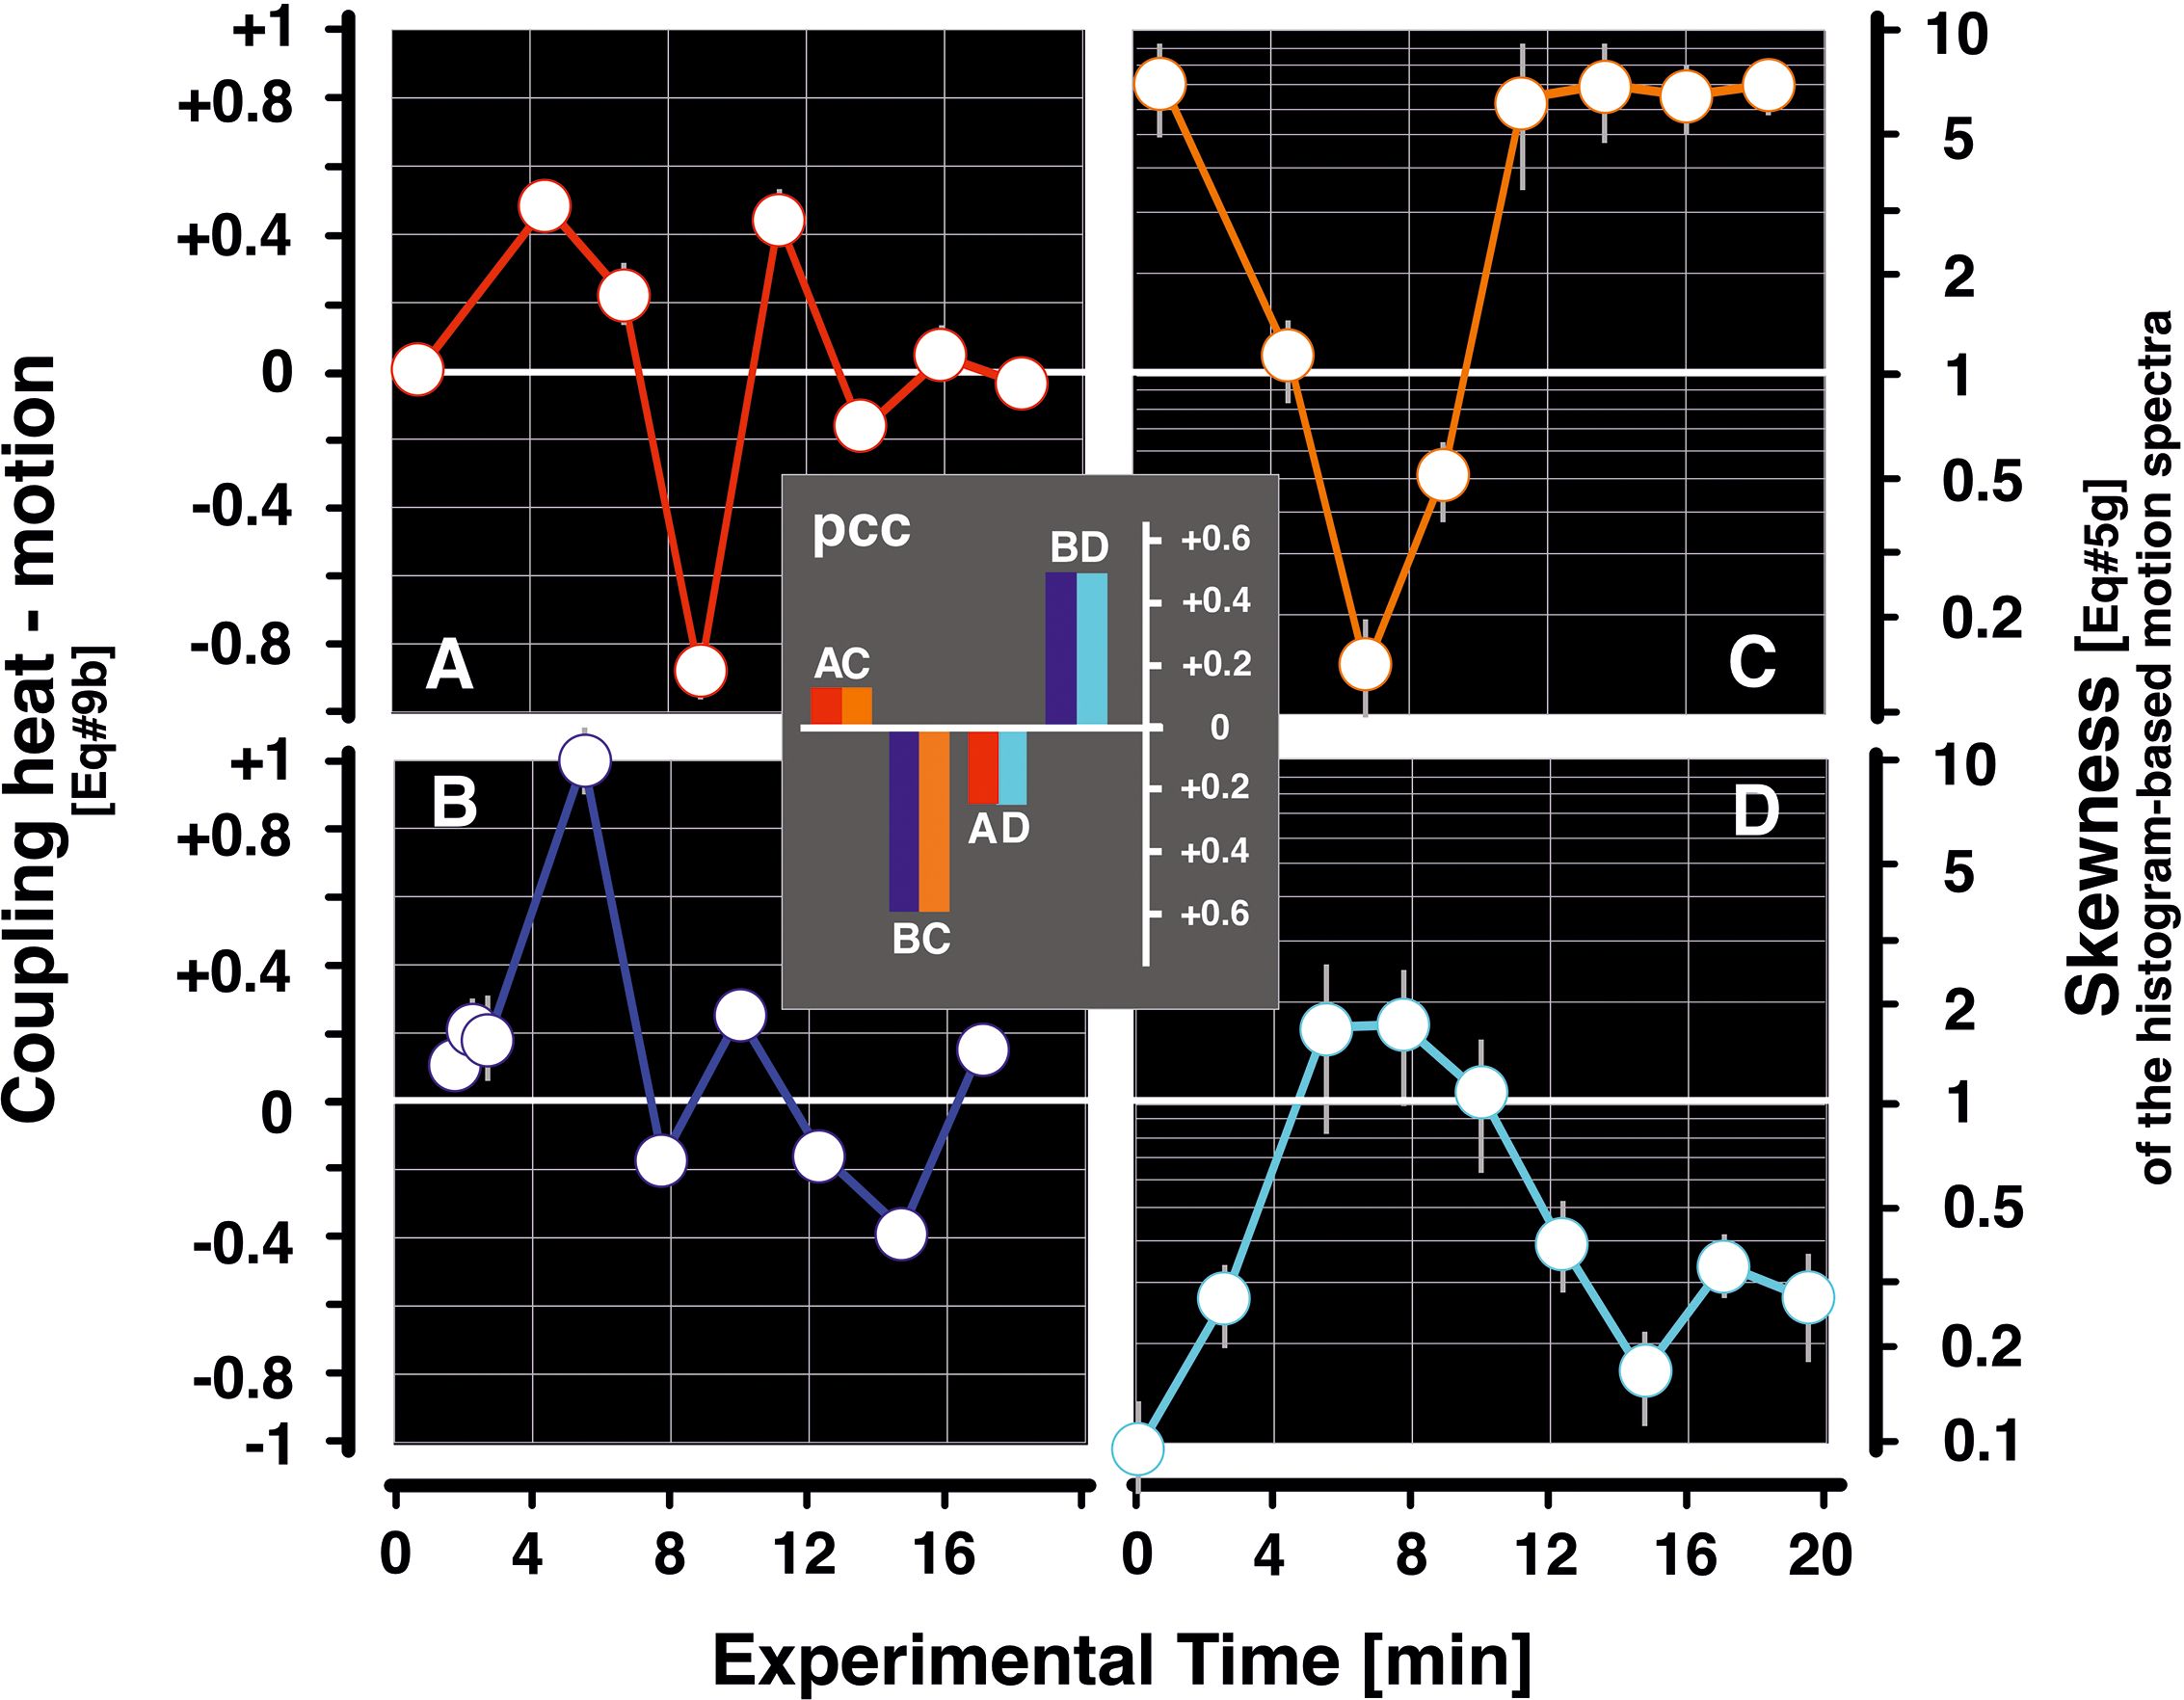
Figure 8. Clarification of the ambiguity of pcc data with regard to heat–motion coupling in episode mfa1. The data of the heat–motion coupling for the lag condition (theat < tmotion) (Figure 7) leave the true relationship between the two parameters open, e.g., whether a pcc value (Supplementary Equation 8H) is negative due to decreasing heat and increasing motion or vice versa. Therefore, if one of the two values can be fixed at the critical time of the event with regard to its polarity [e.g., as in the case of the coupling value of Figure 7 at the end of the mass flight activity (MFA) phase], the actual circumstances of the coupling can be defined, e.g., that the pcc value is negative because the motion activity has decreased and the heat must have increased as a result, and not the other way round. Panels (A, B) give the coupling for Pd and nPd sessions, as already displayed in Figure 7B1,2. Panels (C, D) contribute the relevant motion activity data of the skewness of the histogram-based spectra for episode mfa1 (Kastberger et al., 2024), which is defined by the tail area quotient qs (Supplementary Equation 5G) over the experiment time in min (abscissa); panel (C) stands for the Pd conditions and panel (D) for the nPd conditions. A skewness of qs = 1.0 means a spectrum of logarithmically scaled motion strength values that can be regarded as symmetrical with regard to the size of the left and right tails (Kastberger et al., 2024). For skewness values of qs < 1.0, the left-sided tail area is larger, indicating that the motion spectrum is more pronounced at smaller motion magnitudes; values of qs > 1.0 denote a larger right-sided tail area, showing motion activity with asymmetric extension to the larger magnitudes, typically concerning shimmering-active colonies. The inserted diagram shows the coincidence scores (pcc) for the four combinations of data diagrams (A–D). The data indicate that the relationships between the heat–motion coupling and the skewness of the motion spectrum in the Pd and nPd paradigms are more closely related (that are the panel pairings “AC” and “BD”) in contrast to the pairings “BC” and “AD” with negative scores. This rating with the motion data in (Kastberger et al., 2024) allows the following assignments: a) the positive coupling of the heat–motion values at the beginning and end of the MFA phase means that under Pd conditions, there is an increase in motion activity, and this is also coupled with an increase in heat; in the case of nPd conditions, this is just the opposite, in that there is a decrease in motion activity, which is also accompanied by a decrease in heat development. b) The drop with the negative scores of heat–motion coupling at the end of the MFA phase (here, panel (A), corresponds to Figure 7B1) can now be clearly interpreted that under Pd conditions panel (C), motion activity descended, and because of the negative coupling, a simultaneous increase in heat must be postulated (and not the other way around). Under nPd conditions panel (B), this decrease in the heat–motion coupling value is quite noticeable, but it does not reach significantly negative levels.
In the context of the MFA state (Kastberger et al., 1996; Kastberger, 1999; Woyke et al., 2003; Woyke et al., 2005; Woyke et al., 2007; Kastberger et al., 2024), several processes (a–e) lead to an increase in heat, which is shown in a topologically differentiated pattern on the nest surface (Figures 2, 3; Supplementary Videos S1–S3). a) Heat production in honeybees is mainly related to the activation of the thoracic muscles (Southwick and Heldmaier, 1987; Stabentheiner et al., 2003; Stabentheiner et al., 2004; Stabentheiner, 2005; Stabentheiner and Kovac, 2014). These muscles remain at ambient temperature when the bees are at rest on the surface of the nest (Kastberger et al., 2011b; Kastberger et al., 2016). b) Bees are in a higher state of arousal with warmed chest muscles, which is apparently crucial to switch to wakefulness (Stabentheiner, 2005), which typically occurs in the mouth area in the nMFA state, or when a wasp touches the bee curtain because it wants to grab a bee, the bees pull it into the curtain in a collective action, heating it to over 45°C and causing the wasps to heat collapse [see summary in (Ken et al., 2005)]. This has been experimentally demonstrated by us in A. dorsata (unpublished). c) Heat can also be transported from inside the nest to the surface, e.g., when nestmates emerge from the inner layers and expose their bodies, which have been equilibrated to the inner nest temperature of 36°C–37°C (Stabentheiner et al., 2003; Seeley, 2009). This occurs regularly in the mouth zone (Morse and Laigo, 1969; Schmelzer and Kastberger, 2009; Kastberger et al., 2011b) when potential nectar or pollen foragers emerge from the nest interior to begin their collecting flight. In this context, it is also astonishing that foraging activity at the nest continues throughout MFA and is only slightly restricted by this state (see (Kastberger et al., 2024) and Supplementary Videos S1–S3). During the MFA, many bees emerge from the inner layers of the nest through the net of the bee curtain, which happens across the entire nest (Supplementary Videos S1–S3). These are mainly young bees that hatched only hours before from the honeycomb cells below [and are easily spotted by their light-colored abdomens (Woyke et al., 2000; Lerchbacher, 2011)]. They follow the general excitement in the nest and come out to defecate for the first time. d) In this phase, many bees that have gathered on the nest surface fly away from here (Kastberger et al., 1996), make a few rounds in the vicinity, and return after a few minutes. This literally peels off the cooler surface layer of the bee curtain, which is adapted to the ambient temperature, and exposes the next deeper layer, which is slightly warmer because it is also closer to the temperature inside the nest. e) Another possibility to warm the nest surface is the sun. However, such processes lead to heat patterns that usually last much longer, over 10 min or more, and often larger nest areas are affected evenly.
Social homeostasis in honeybees (Southwick and Heldmaier, 1987) requires not only mechanisms that can keep the temperature inside the nest high at low ambient temperatures but also those that protect the brood regions from overheating at high temperatures. There are a number of processes that can contribute to a drop in nest temperature. In general, water evaporation is used to cool the bee nest by spreading small drops of water throughout the hive or by keeping a thin film of water on the proboscis of a fanning bee (Lindauer, 1954). In A. mellifera colonies with relatively large nest entrances, the fanning bees form groups that separate the continuous inflow and outflow (Peters et al., 2019).
On the nest surface of giant honeybees, the bees passively cool down when they descend from an individually or collectively triggered state of higher arousal. This is the case when they switch off their flight readiness or guard mode or calm down from a general wave of excitement. Such bees then acclimatize their body temperature to the environment within a few minutes.
In giant honeybees, a massive, nest-wide effect of temperature reduction has been confirmed when the interior of the nest is collectively ventilated with outside air by the rhythmic ventilation movements of the bee curtain (Kastberger et al., 2016). This usually happens when the ambient temperature is above 30°C, and these effects are particularly noticeable at those parts of the bee curtain where special convection holes are formed. Finally, the outside temperature can also cause such a drop in temperature at the nest surface, but here too, it is usually a longer-lasting decline in temperature affecting the entire nest evenly.
In the time profile of episode mfa1 (Figure 3A; Supplementary Videos S1–S3), a bipolar heat pulse occurs shortly before the heat and motion activities increase uniformly in the “ascent” phase of the MFA. There are some arguments (a–e) that this behavioral trait can be causally linked to the appearance of MFA. a) This (pre-MFA) impulse arises immediately before the general excitation in the colony increases due to the MFA and b) can be observed in the mfa1 episode in both domains, heat and motion, and all five surveillance zones (sz1–5) (Supplementary Figure S2; see also (Kastberger et al., 2024) for the detailed analysis in the motion domain). Due to the methodological constraints, motion signals were analyzed with a temporal resolution more than 16 times higher than the IR images. With regard to the sequential timing of its occurrence, but also due to the consistently similar course in the monitored nest regions, this pulse can be ascribed to a single wave-like process that spreads across the entire nest. c) In the other two episodes (mfa2,3), such slow pulses were also observed at the beginning of the MFA in all five selected surveillance zones, but these were only analyzed in the motion domain (Kastberger et al., 2024). This general occurrence in independent episodes identifies this impulse as a behavioral characteristic that presages or initiates the forthcoming profound structural change in the MFA. d) In all three episodes studied, this pre-MFA pulse is first detectable in the mouth zone and then spreads from here like a slow wave over the entire nest [Supplementary Figure S2; (Kastberger et al., 2024)]. The topographical correspondence of this pulse in both domains, heat and motion, suggests that it is a colony-internal signal that controls the MFA phase with a kind of start command. This also defines the mouth zone as the command center for this kind of logistical restructuring of the nest during the MFA.
Even in the same colony, each mass flight episode, even consecutive ones, is certainly different in terms of timing, when it starts during the day and how long and how pronounced the process of transitioning is. This variability can be associated with many factors, especially since the reproductive state of the colony is related to waiting for the expected flowering of crops in agricultural areas (Sulzer et al., 2010) or, conversely, to the state of preparation for migration and absconding (Morse and Laigo, 1969; Oldroyd and Wongsiri, 2009). How is the colony's reproductive performance (Underwood, 1991)? How many reproductive cells have just been created, and how many young bees have hatched in the time since the last mass flight episode? How many food resources are stored in the nest, and how abundant are the current food sources (Sulzer et al., 2010), or have the potential agricultural food sources already been harvested on site? How large is the nest in terms of the central comb, and is this still being diligently expanded? How thick has the bee curtain become? Have queen cells already been set up, and have young queens perhaps hatched already? Have drones developed (Koeniger and Wijayagunasekera, 1976), and is the nest preparing to form reproductive swarms? Has the entire colony reached the point of preparing for flight and migration? Finally, what are the current weather conditions like?
Despite such expected variability, the analyzed mass flight episodes showed some similarities that can be interpreted in a plausible and consistent way: the heat–motion correlation diagrams showing the three investigated episodes mfa1–3 around their MFA peak (Figures 5A–C) and those showing this correlation for the entire episode mfa1 (Figure 6) reveal a clear topological organization of the five surveillance zones sz1–5. This illustrates that these nest zones represent five different functional areas of the social infrastructure. The scenarios described below show that the two behavioral patterns, heat and motion, are controlled by the bees on the nest surface in the monitored episodes by multiple causes.
The data cloud of the heat–motion correlation (Figures 5A–C) shows striking differences in the three episodes analyzed: in mfa3, the motion activity is significantly lower than in the other two episodes (mfa1,2), and the position of the heat data of the mouth zone (sz4) in the correlation plot is strikingly in a mid-position and not at the right edge at the maximum values. The heat development in the mouth zone is therefore significantly lower here than even in surveillance zone sz1. The only reason that can account for this peculiarity is the different stimulus history of mfa3 because in this episode, the presentation of the wasp dummy began only after the “MFA” phase had already been over for several minutes.
The following principles can be derived from this, which determine collective behavior during the MFA: a) an external visual threat, especially one that remains pointed at the entire nest, increases the overall excitability of the colony, even during the MFA. This is clearly reflected in the mouth area regarding motion activity (Kastberger et al., 2024) and heat development (Figure 5); both are lower in mfa3 than in the other episodes (mfa1,2). b) This underlines that the mouth zone undergoes no restructuring or only a much smaller restructuring during MFA. It fulfills its role as a hub, as an interface between the interior of the nest and the outside world, even during the MFA phase. It also controls, at least, the beginning of the MFA phase, which can be plausibly shown with the pre-MFA impulses [(Kastberger et al., 2024), Supplementary Figure S2] and the topographically staggered start times of the MFA. c) Lastly, this finding is also clear evidence that the colony is quite capable of perceiving external visual stimuli even during the transformation phase of the MFA.
The correlation of simultaneously measured heat and motion values leads to clockwise semi-cyclical correlations (Figures 5, 6). In the mfa1 episode, this correlation arc is closed only in the case of the mouth zone under nPd conditions; otherwise, it remains more or less open. This indicates that the observation period in this episode could not fully capture the decaying thermal behavior (Figures 3A, C) in the post-MFA due to its limitation to 19 min. It also shows that the lack of closure of most cycles is a characteristic of the heat paradigm, but not a factor of the motion activity because the motion data alone would have actually indicated the end of the MFA phase in all three monitored episodes. This decaying heat curve (Figures 3A, C) cannot simply be seen as a matter of thermal inertia, that the nest would slowly cool down after the MFA phase and adapt to the ambient temperature. Any heat effect on the nest surface depends on the bees positioned there, whose thoraces, but not their abdomens, remain heated. This proves that the measurand heat is able to describe the MFA state more comprehensively than the motion domain, in particular with the decaying fringe of heat development.
The points of the cyclic heat–motion curves (Figures 6C, D; mfa1) are located at coordinate positions comparable to the point correlations in Figure 5A. The mean motion values in the nMFA phases, in which shimmering responses occur, are naturally higher than in neighboring nPd sessions. During the MFA phase, however, the correlation values of the experimental sessions of both excitation states (nPd, Pd; Figures 6C–F) assume similar coordinate positions. Second, the mouth region here follows a specific pathway (Figures 6E, F) that is distinctly different from that of the non-mouth regions. This means that the influence of external threats on the bees at the nest surface cannot be significantly detected with these “static” heat–motion relationships (this requires analyzing the “dynamic”, i.e., phasic responses that can be detected within 10 s after the transition to a new excitation state; see Figures 7, 8).
This finding is consistent with the results of the earlier work [(Kastberger et al., 2024) on mfa1,2], according to which the mouth region also follows a different path than the peripheral nest regions in the trade-off between nest defense and organization of the MFA. Obviously, the mouth region is neither strongly involved in direct collective defense actions nor directly in the restructuring of the nest in the MFA state. The reason for this is that, as mentioned above, the oral region must retain its function as a hub for food supply and guarding the nest during normal daily activity. It also functions as a command center that signals changes in the state of arousal and, for example, controls the beginning and end of MFA (Figures 3; Supplementary Figure S2). Theoretically, but rather improbably (because this has never been observed or tested by us), the mouth zone could also trigger the deployment of rapid responders against predators (Kastberger and Sharma, 2000; Kastberger et al., 2011b) during MFA.
From the time profiles in Figure 3, a rough statistical correlation between heat and movement can be seen; however, this does not reveal any strong interdependence. Still, by comparing the two behavioral parameters heat and movement in the frame-based point clouds (Figure 5), the nest areas sz1–5 can be distinguished in their functional profiles. Indeed, there is a hysteresis relationship between the two parameters over the course of the MFA episode, which can be interpreted in a site-specific manner (Figure 6).
However, the question of possible interdependence or even independence between the two behavioral variables of heat and motion can be reduced to a question of temporal resolution in the approach. Compared to the results in Figures 3, 5, 6, the situation is quite different if one considers the simultaneous changes in the two parameters over the much shorter time horizon of seconds (Stabentheiner et al., 2003; Stabentheiner et al., 2004; Stabentheiner, 2005; Stabentheiner and Kovac, 2014). It then turns out that effects that can be detected locally on the nest surface with the IR camera within 10 s also play a role in further analysis. a) For example, bees warm up their chest muscles in such a short time to switch to guard mode (Moore et al., 1987; Weihmann et al., 2014) or b) from a purely technical point of view to prepare for departure on a collecting flight, c) or in another case, bees inside the nest, which thus keep their entire body at brood temperature (Mardan and Kevan, 2002), can reach the outside of the nest in a matter of seconds by slipping through the mesh of the bee curtain.
In MFA mode, this happens everywhere on the bee curtain, but in nMFA mode, this happens under semi-quiescent conditions only in the mouth zone. However, the bees can join a general wave of excitement within a few tens of milliseconds as part of the spread of a collective shimmering action and react with an abdominal thrust. This also leads to temperature changes, which, however, are only displayed in the IR image in the sub-degree range. Muscle warming does not play a role in shimmering; rather, such metasomal upswings can locally reveal the nest-warm areas of deeper layers. Conversely, the collective rapid actions of shimmering together with short wing beats can even mean a slight adiabatic cooling due to a wind-chill effect (Kastberger et al., 2001; Kastberger et al., 2011b; Kastberger et al., 2012). Another example of a complex change in the thermogenic environment of the bee nest is collective ventilation, in which the bee curtain moves away from the honeycomb millimeter by millimeter through collective abduction of the inner bees, allowing cooler ambient air to be drawn into the nest through intermediate convection holes. In the next step, the bee curtain is moved back toward the honeycomb by social contraction, causing nest-warm air to flow out through the mesh of the bee curtain (Kastberger et al., 2016). These examples illustrate how the two parameters of heat and motion can be coupled over a period of just a few seconds on the nest surface of giant honeybees. This is caused by individual or collective behavior that leads to changes in the posture of the body or body parts or to changes in the position of a bunch of bees (Kastberger et al., 1996; Kastberger et al., 2012).
It can be shown that even during the MFA, every time the wasp dummy suddenly appears in the experiment, a heat reaction of 10–20 s can be measured within a few seconds (unpublished). This could have been triggered by a particularly rapid increase in body temperature in individual bees, but much more likely in this context is the effect that rapid changes in the position of the bees in the upper layer of the bee grid create gaps that allow a view of the lower, warmer layers. It is therefore also anticipated that the measure of the heat–motion coupling can be used to detect corresponding collective responses in the time frame of approximately 30 s after any change of the stimulus paradigm. There are striking significant (p < 0.01, t-test) contrasts between Pd (Figure 7, panel 1) and nPd conditions (Figure 7, panel 2), with a change in the time course for the Pd state from positive to negative coupling at the end of the MFA phase. This happens at a time in the documented episodes when the colony is not yet able to generate defense reactions in the form of shimmering waves, although it has almost returned to normal operation, at least in terms of motion activity.
These results constitute a reliable statement about the ability to perceive the collective of surface bees at the end of the MFA phase, although they only are represented by the single case analysis of episode mfa1. In this study, the underlying data refer to >4,000 IR frames for thermogenic information and >60,000 simultaneously recorded video frames for motion activity; they also refer to five nest-topographically and functionally different nest regions (sz1–5) and were analyzed alternately in the two arousal paradigms (Pd and nPd) over a sequence of 17 sessions. Furthermore, these coupling properties can also be significantly detected at delays of up to 8 s and therefore prove to be robust in their interpretability over this period.
It is a fact that Pearson's correlation coefficients (pcc) provide no information about the direction of the tested relationships (see Materials and Methods). Therefore, for a full evaluation of the results in the paradigm of heat–motion coupling, the ambiguity of the correlation data must be resolved, and the polarity of the responses must be specified. In the mfa1 episode analyzed here as an example, the peaks in the pcc diagrams of both directions can actually be assigned to the valid polarity because they also refer to the analyses detailed in the earlier work (Kastberger et al., 2024). Under Pd conditions, the histogram-based motion spectra in the same time range as those heat data at the end of the MFA phase, which resulted in a negative value of the heat–motion coupling, showed a dip in the skewness value (Supplementary Equation 5G), well below symmetry (see Figures 8C, D for definition). This indicates a significant decrease in motor activity under Pd conditions in this time range.
This data situation allows the following two interpretations for the heat–motion coupling in episode mfa1 (Figure 7, panels 1 and 2): first, the significantly positive values that occur before and after the MFA state, and thus also in the nPd9 session at the end of the MFA phase, are associated with an increase in motion activity after an increase in heat. This means that in the corresponding protection mode, phasic (<10 s) heat surges occur after switching on the dummy wasp presentation, which then also leads to the triggering of shimmering waves. Second, the significant and clear drop in the heat–motion coupling curve (Figures 7B–D) can therefore be associated with a heat surge of the affected bees at this time point at the end of the MFA phase with a simultaneous decrease in motion activity. This indicates that the visual stimulus of the wasp dummy collectively excites the affected bees, which is reflected in a phasic response of an increase in thermal activity, while their reactivity in the motion domain is reduced.
This dip in heat–motion coupling that occurred in the mfa1 episode during the MFA phase can therefore be interpreted as an active inhibitory response, which is known in the literature in two forms, as freeze response (Roelofs et al., 2010) and as thanatosis (Rogers and Simpson, 2014). Both phenomena are considered to be responses to potentially threatening stimuli, which most commonly occur in prey animals. They are associated with a sudden reduction in motor activity in which the animals appear temporarily paralyzed and do not respond to external stimuli. Thanatosis in particular has also been well studied in invertebrates, from crickets (Nishino, 2004) and arachnids (Jones et al., 2011; Lira et al., 2020) to Hymenoptera such as fire ants (Nishino, 2004; Humphreys and Ruxton, 2018), wasps (Steiner, 1981; King and Leaich, 2006; Amemiya and Sasakawa, 2021), and even honeybees (Butler and Free, 1952; Morse and Gary, 1961; Dinges et al., 2017; Kuwabara et al., 2023).
The present case of active immobilization in giant honeybees cannot be clearly assigned to either of these two behaviors, especially since it is a collective trait. It is probably due to a conflict situation, however, because the collective of nestmates on the nest surface can perceive a threat in the form of the wasp dummy but is not yet capable of a joint defense action in this phase of mass flight activity. This finding was demonstrated here in a single MFA episode and can be regarded as a case report. It is the first time that it has been described in this quantitative form in bees and also the first time that such an effect has been described simultaneously in a collective of individuals and here even across an entire nest. This effect is well supported with >300,000 individual data and can be plausibly interpreted for episode mfa1 of the experimental nest. It is therefore to be expected that other colonies also develop such an active inhibition during the MFA phase in their mass flight episodes.
Shimmering is one of many possible defense reactions in a giant honeybee colony. In this work, it is taken as a proxy for the fundamental collective defense ability as a whole. This is essentially for two reasons: first, shimmering can be understood as the lowest-threshold reaction that occurs in the context of defense (Kastberger et al., 2001; Kastberger et al., 2011b; Kastberger et al., 2014b). It even occurs when the collectors return from their collecting flight and land abruptly on the nest surface, triggering a defense reaction (Kastberger et al., 2008). Second, all the other defense reactions that a colony is capable of {such as 1) the hissing reaction, in which the colony puffs up and enlarges when, for example, large mammals pass by the affected and a threat is imminent, and soldier bees have not yet been recruited (Kastberger, 1999; Kastberger et al., 2011b); 2) heat balling of wasps (Ken et al., 2005); and 3) the recruitment and release of a squad of soldier bees as a rapid response force (Kastberger et al., 2001)} are all reactions that require significantly more energy or expose the individuals involved to greater risks. Our personal experience is that if you approach a nest in MFA mode with your face uncovered, not a single guard bee will come to sting you. When the nest enters MFA mode and is just beginning to develop this MFA from the mouth zone, the peripheral regions are still able to defend themselves and trigger shimmering waves (see Supplementary Figure S2). However, it is also obvious, based on our experience, that no visible defense reaction is possible during the MFA peak. This means that if predatory birds were to approach the nest [which, interestingly, we have never observed at nests in MFA mode; see also our line of arguments in (Kastberger et al., 2024)] and catch their prey from the cloud of scanning bees around the nest, the colony would not be able to launch a coordinated counterattack. What we were able to observe in this regard, however, was how a late mass flight episode of bats was attacked at dusk (Biswas, 2007), capturing flying bees with their wings and eating them in flight. A simultaneous inspection of this mass flight episode confirmed the suspicion that it was mainly a group flight of drones. In this context, we did not observe any defensive reaction on the part of the colony.
Comprehensive data from an experimental nest in three evaluated MFA episodes show in three evaluated MFA episodes, based on heat and motion data, that the mouth zone of an A. dorsata nest is the central hub of the colony that controls social life and thus also in the periodically occurring MFA phases. This is documented first by an impulse that originates from the mouth zone in the initial phase of the MFA phase and spreads from here to all nest regions within a few minutes (Figures 3; Supplementary Figure S2). Second, the correlation diagrams of heat and motion in the five experimentally defined nest regions show that the mouth zone follows an independent functional course during the MFA episode (Figures 5, 6). Finally, the heat–motion data reveal two indications that external threats influence the extent and progression of MFA, demonstrating that the colony can maintain the ability to perceive external threats: first, a persistent external threat during the MFA increases heat and motion production, in contrast to when the colony is not disturbed by external stimuli during the upheaval of MFA [Figure 5; (Kastberger et al., 2024)]. Second, at the end of the MFA phase, but before the colony regains the ability to respond to threats with shimmering, a polarity drop in the phasic response of heat–motion coupling was observed (Figure 7). This is evidence of tonic immobilization (Figure 8), which occurs during MFA in an experimentally induced threat scenario. Such behavior is known in the literature as freeze effect (Roelofs et al., 2010) or as thanatosis (Rogers and Simpson, 2014) and was thus observed here for the first time as collective behavior, notably in bees.
The original contributions presented in the study are included in the article/Supplementary Material. Further inquiries can be directed to the corresponding author.
The manuscript presents research on animals that do not require ethical approval for their study.
GK: Conceptualization, Data curation, Funding acquisition, Investigation, Methodology, Project administration, Resources, Software, Supervision, Validation, Visualization, Writing – original draft, Writing – review & editing. ME: Data curation, Methodology, Software, Writing – original draft, Writing – review & editing. TH: Data curation, Investigation, Methodology, Software, Writing – original draft, Writing – review & editing.
The author(s) declare financial support was received for the research, authorship, and/or publication of this article. This work was supported at the time by the Austrian Science Foundation (FWF Project P 20515-B16), URL https://www.fwf.ac.at/en/. The funders had no role in the study design, data collection and analysis, decision to publish, or preparation of the manuscript. The authors did not receive any special funding for the publication.
My collaborators on site were as follows: my Master’s student at the time, Dominique Waddoup, and my PhD student at the time, Frank Weihmann, helped set up the experimental facility and collect data at the locations in Chitwan (Nepal). We thank Dr. Madhu Singh, Dr. S.M. Man, Dr. R. Thapa, and Dr. M. B. Gewali from Tribhuvan University, Kathmandu, Nepal, for their support regarding logistics and Reinhold Stachl (NPN electronics) for providing infrared cameras for several expeditions to India and Nepal.
The authors declare that the research was conducted in the absence of any commercial or financial relationships that could be construed as a potential conflict of interest.
The author(s) declared that they were an editorial board member of Frontiers, at the time of submission. This had no impact on the peer review process and the final decision.
All claims expressed in this article are solely those of the authors and do not necessarily represent those of their affiliated organizations, or those of the publisher, the editors and the reviewers. Any product that may be evaluated in this article, or claim that may be made by its manufacturer, is not guaranteed or endorsed by the publisher.
The Supplementary Material for this article can be found online at: https://www.frontiersin.org/articles/10.3389/frbee.2024.1411720/full#supplementary-material
Supplementary Figure 1 | Measurement characteristics of heat and motion on the surface of the giant honeybee nest (episode mfa1).
Supplementary Figure 2 | Properties of the pre-MFA impulse during the experimental session nPd3 at the beginning of ‘MFA’ phase in episode mfa1.
Supplementary Figure 3 | Short-term of heat-motion coupling in giant honeybees at the nest surface: explanation of the selected benchmarks.
Supplementary Video S1 | The ascent phase of MFA from nPd3 to nPd5 (from 1.2975 to 6.2025 min experimental time).
Supplementary Video S2 | The ascent phase of MFA from Pd6 to Pd10 (from 6.2025 to 11.7375 min experimental time).
Supplementary Video S3 | The descent phase of MFA from nPd11 to Pd16 (from 11.7375 to 18.7275 min experimental time).
Ahmad F., Joshi S. R., Gurung M. B. (2003). The Himalayan cliff bee Apis laboriosa Smith and the honey hunters of Kaski: Indigenous Honeybees of the Himalayas (Vol. 1). International Centre for Integrated Mountain Development (ICIMOD), Kathmandu, Nepal. doi: 10.53055/ICIMOD.411
Amemiya M., Sasakawa K. (2021). Factors affecting thanatosis in the braconid parasitoid wasp Heterospilus prosopidis. Insects 12, 48. doi: 10.3390/insects12010048
Batra S. W. (1996). Biology of Apis laboriosa Smith, a pollinator of apples at high altitude in the great Himalaya range of Garhwal, India,(Hymenoptera: Apidae). J. Kansas Entomological Society., 177–181. https://digitalcommons.usu.edu/bee_lab_ba/176.
Bhagavan H., Muthmann O., Brockmann A. (2016). Structural and temporal dynamics of the bee curtain in the open-nesting honey bee species, Apis florea. Apidologie 47, 749–758. doi: 10.1007/s13592-016-0428-8
Biswas S. (2007). A prey predator link between the rock bee apis dorsata and the false vampire bat megaderma lyra geoffroy based on their circadian rhythms. J. Bombay Natural History Soc. 104, 365–366.
Breed M. D., Robinson G. E., Page R. E. (1990). Division of labor during honey bee colony defense. Behav. Ecol. Sociobiology. 27, 395–401. doi: 10.1007/BF00164065
Butler C. G., Free J. B. (1952). The behaviour of worker honeybees at the hive entrance. Behaviour. 4 (4), 262–292.
Camazine S., Crailsheim K., Hrassnigg N., Robinson G. E., Leonhard B., Kropiunigg H. (1998). Protein trophallaxis and the regulation of pollen foraging by honey bees (Apis mellifera L.). Apidologie. 29, 113–126. doi: 10.1051/apido:19980107
Camazine S., Deneubourg J.-L., Franks N. R., Sneyd J., Theraula G., Bonabeau E. (2020). “Self-organization in biological systems,” in Self-organization in biological systems (Princeton and Oxford: Princeton university press).
Cao L.-F., Zheng H.-Q., Chen X., Niu D.-F., Hu F.-L., Hepburn H. R. (2012). Multivariate morphometric analyses of the giant honey bees, Apis dorsata F. and Apis laboriosa F. @ in China. J. Apic Res. 51, 245–251. doi: 10.3896/IBRA.1.51.3.05
Crailsheim K. (1990). Protein synthesis in the honeybee (Apis mellifera L.) and trophallactic distribution of jelly among imagos in laboratory experiments. Zoologische Jahrbucher Allgemeine Zoologie und Physiologie der Tiere 94, 303–312.
Crailsheim K. (1992). The flow of jelly within a honeybee colony. J. Comp. Physiol. B. 162, 681–689. doi: 10.1007/BF00301617
Crailsheim K. (1998). Trophallactic interactions in the adult honeybee (Apis mellifera L.). Apidologie. 29, 97–112. doi: 10.1051/apido:19980106
Cully S., Seeley T. (2004). Self-assemblage formation in a social insect: the protective curtain of a honey bee swarm. Insectes sociaux. 51, 317–324. doi: 10.1007/s00040-004-0743-3
Dewsbury D. A. (1999). The proximate and the ultimate: past, present, and future. Behav. processes. 46, 189–199. doi: 10.1016/S0376-6357(99)00035-2
Dinges C. W., Varnon C. A., Cota L. D., Slykerman S., Abramson C. I. (2017). Studies of learned helplessness in honey bees (Apis mellifera ligustica). J. Exp. Psychology: Anim. Learn. Cognition. 43, 147. doi: 10.1037/xan0000133
Drummond F. (2022). Honey bee cleansing flights … just cleansing? J. Kansas Entomological Soc. 94, 158–162. doi: 10.2317/0022-8567-94.2.158
Dussaubat C., Maisonnasse A., Crauser D., Beslay D., Costagliola G., Soubeyrand S., et al. (2013). Flight behavior and pheromone changes associated to Nosema ceranae infection of honey bee workers (Apis mellifera) in field conditions. J. invertebrate pathology. 113, 42–51. doi: 10.1016/j.jip.2013.01.002
Dyer F., Seeley T. D. (1994). Colony migration in the tropical honey bee Apis dorsata F.(Hymenoptera: Apidae). Insectes Sociaux 41, 129–140. doi: 10.1007/BF01240473
Dyer F. C. (1985). Nocturnal orientation by the Asian honey bee, Apis dorsata. Anim. Behav. 33, 769–774. doi: 10.1016/S0003-3472(85)80009-9
Farina W. M., Núñez J. A. (1991). Trophallaxis in the honeybee, Apis mellifera (L.) as related to the profitability of food sources. Anim. Behav. 42, 389–394. doi: 10.1016/S0003-3472(05)80037-5
Flir (2005). Manual IR camera flir A320. doi: http://www.nbn.at/fileadmin/user_upload/Vertretungen/FLIR/A320/A320-Tempscreen-DS-US-2004-nbn.pdf
Francis R. C. (1990). Causes, proximate and ultimate. Biol. Philosophy. 5, 401–415. doi: 10.1007/BF02207379
Gagliardi P. A., Grädel B., Jacques M.-A., Hinderling L., Ender P., Cohen A. R., et al. (2023). Automatic detection of spatio-temporal signaling patterns in cell collectives. J. Cell Biol. 222, 1–17. doi: 10.1083/jcb.202207048
Gogoi H., Tayeng M., Taba M. (2019). Pan-Himalayan high altitude endemic cliff bee, Apis laborisa smith (hymenoptera: apidae): a review. Proc. Zoological Soc. 72, 3–12. doi: 10.1007/s12595-017-0234-y
Haig A. M. Jr. (1982). Chemical warfare in southeast asia and Afghanistan (Cambridge: The MIT Press).
Harris E. D. (1987). Sverdlovsk and yellow rain: Two cases of Soviet noncompliance? Int. Secur. 11, 41–95. doi: 10.2307/2538837
Hemelrijk C. (2005). Self-organisation and evolution of biological and social systems (Cambridge University Press).
Hepburn H. (2006). Absconding, migration and swarming in honeybees: an ecological and evolutionary perspective. Life cycles Soc. insects: behaviour Ecol. evolution. (St. Petersburg University Press), 121–135.
Hepburn H. (2010). Absconding, migration and swarming. Honeybees Asia: Springer; p, 133–158. doi: 10.1007/978-3-642-16422-4_7
Hepburn H. R., Hepburn C. (2007). Bibliography of the giant honeybees, Apis dorsata Fabriciu) and Apis laboriosa F. Smit). Apidologie. 38, 219–220. doi: 10.1051/apido:2007010
Hepburn H., Pirk C., Duangphakdee O. (2014). Honeybee nests. Composition structure Funct. Springer. 978, 642–648. doi: 10.1007/978-3-642-54328-9
Hepburn H. R., Radloff S. E. (2011). “Biogeography,” in Honeybees of asia. Eds. Hepburn H. R., Radloff S. E. (Springer Berlin Heidelberg, Berlin, Heidelberg), 51–67.
Humphreys R. K., Ruxton G. D. (2018). A review of thanatosis (death feigning) as an anti-predator behaviour. Behav. Ecol. sociobiology. 72, 1–16. doi: 10.1007/s00265-017-2436-8
Jones T. C., Akoury T. S., Hauser C. K., Neblett M. F., Linville B. J., Edge A. A., et al. (2011). Octopamine and serotonin have opposite effects on antipredator behavior in the orb-weaving spider, Larinioides cornutus. J. Comp. Physiol. A 197, 819–825. doi: 10.1007/s00359-011-0644-7
Kastberger G. (1999). The Magic Trees of Assam [Documentary film]. Available online at: http://www.epofilm.com.
Kastberger G. (2014). How Giant honeybees and Assam came to Graz. Asian J. Conserv. Biol. 3, 101–105.
Kastberger G., Ebner M., Hötzl T. (2024). Giant honeybees (Apis dorsata) trade off defensiveness against periodic mass flight activity. PloS One 19, e0298467. doi: 10.1371/journal.pone.0298467
Kastberger G., Hoetzl T., Maurer M., Kranner I., Weiss S., Weihmann F. (2014a). Speeding up social waves. Propagation mechanisms of shimmering in giant honeybees. PloS One 9, e86315. doi: 10.1371/journal.pone.0086315
Kastberger G., Maurer M., Weihmann F., Ruether M., Hoetzl T., Kranner I., et al. (2011a). Stereoscopic motion analysis in densely packed clusters: 3D analysis of the shimmering behaviour in Giant honey bees. Front. Zoology. 8, 1–18. doi: 10.1186/1742-9994-8-3
Kastberger G. W., Otmar S., Klaus T. (2001). Defence strategies in the Giant honeybee Apis dorsata. Verhandlungen der Deutschen Zoolgischen Gesellschaft Osnabrück. 94.
Kastberger G., Raspotnig G., Biswas S., Winder O. (1998). Evidence of Nasonov scenting in colony defence of the Giant honeybee Apis dorsata. Ethology 104, 27–37. doi: 10.1111/j.1439-0310.1998.tb00027.x
Kastberger G., Schmelzer E., Kranner I. (2008). Social waves in giant honeybees repel hornets. PloS One 3, e3141. doi: 10.1371/journal.pone.0003141
Kastberger G., Sharma D. (2000). The predator-prey interaction between blue-bearded bee eaters (Nyctyornis athertoni Jardine and Selby 1830) and giant honeybees (Apis dorsata Fabricius 1798). Apidologie. 31, 727–736. doi: 10.1051/apido:2000157
Kastberger G., Waddoup D., Weihmann F., Hoetzl T. (2016). Evidence for Ventilation through Collective Respiratory Movements in Giant Honeybee (Apis dorsata) Nests. PloS One 11, e0157882. doi: 10.1371/journal.pone.0157882
Kastberger G., Weihmann F., Hoetzl T. (2010). Complex social waves of giant honeybees provoked by a dummy wasp support the special-agent hypothesis. Communicative Integr. Biol. 3, 179–180. doi: 10.4161/cib.3.2.10809
Kastberger G., Weihmann F., Hoetzl T. (2011b). “Self-assembly processes in honeybees: the phenomenon of shimmering,” in Honeybees of asia. Eds. Hepburn H. R., Radloff S. E. (Springer Berlin Heidelberg, Berlin, Heidelberg), 397–443.
Kastberger G., Weihmann F., Hoetzl T. (2013). Social waves in giant honeybees (Apis dorsata) elicit nest vibrations. Naturwissenschaften. 100, 595–609. doi: 10.1007/s00114-013-1056-z
Kastberger G., Weihmann F., Hoetzl T., Weiss S. E., Maurer M., Kranner I. (2012). How to join a wave: decision-making processes in shimmering behavior of giant honeybees (Apis dorsata). PloS One 7, e36736. doi: 10.1371/journal.pone.0036736
Kastberger G., Weihmann F., Zierler M., Hötzl T. (2014b). Giant honeybees (Apis dorsata) mob wasps away from the nest by directed visual patterns. Naturwissenschaften. 101, 861–873. doi: 10.1007/s00114-014-1220-0
Kastberger G., Winder O., Hoetzl T., Raspotnig G. (1996). Behavioural features of a periodic form of massed flight activity in the Giant honeybee Apis dorsata. Apidologie 27, 381–395. doi: 10.1051/apido:19960506
Ken T., Hepburn H., Radloff S., Yusheng Y., Yiqiu L., Danyin Z., et al. (2005). Heat-balling wasps by honeybees. Naturwissenschaften. 92, 492–495. doi: 10.1007/s00114-005-0026-5
King B., Leaich H. (2006). Variation in propensity to exhibit thanatosis in Nasonia vitripennis (Hymenoptera: Pteromalidae). J. Insect Behavior. 19, 241–249. doi: 10.1007/s10905-006-9022-7
Kirchner W. H., Dreller C. (1993). Acoustical signals in the dance language of the giant honeybee, Apis dorsata. Behav. Ecol. sociobiology 33, 67–72. doi: 10.1007/BF00171657
Kitnya N., Otis G. W., Chakravorty J., Smith D. R., Brockmann A. (2022). Apis laboriosa confirmed by morphometric and genetic analyses of giant honey bees (Hymenoptera, Apidae) from sites of sympatry in Arunachal Pradesh, North East India. Apidologie. 53, 47. doi: 10.1007/s13592-022-00956-z
Kitnya N., Prabhudev M. V., Bhatta C. P., Pham T. H., Nidup T., Megu K., et al. (2020). Geographical distribution of the giant honey bee Apis laboriosa Smit(Hymenoptera, Apidae). Zookeys. 951), 67–81. doi: 10.3897/zookeys.951.49855
Koeniger N., Koeniger G. (1980). Observations and experiments on migration and dance communication of Apis dorsata in Sri Lanka. J. Apicultural Res. 19, 21–34. doi: 10.1080/00218839.1980.11099994
Koeniger N., Kurze C., Phiancharoen M., Koeniger G. (2017). Up” or “down” that makes the difference. How giant honeybees (Apis dorsata) see the world. PloS One 12, e0185325. doi: 10.1371/journal.pone.0185325
Koeniger N., Muzaffar N. (1988). Lifespan of the parasitic honeybee mite, Tropilaelaps clareae, on Apis cerana, dorsata and mellifera. J. Apicultural Res. 27, 207–212. doi: 10.1080/00218839.1988.11100804
Koeniger N., Wijayagunasekera H. (1976). Time of drone flight in the three Asiatic honeybee species (Apis cerana, Apis florea, Apis dorsata). J. Apicultural Res. 15, 67–71.
Kohl P. L., Rutschmann B., Brockmann A. (2023). Dance communication of giant honeybees in Role of giant honeybees in natural and agricultural systems (CRC Press), 104–122. doi: 10.1201/9781003294078-8
Kuwabara T., Kohno H., Hatakeyama M., Kubo T. (2023). Evolutionary dynamics of mushroom body Kenyon cell types in hymenopteran brains from multifunctional type to functionally specialized types. Sci. Advances. 9, eadd4201. doi: 10.1126/sciadv.add4201
Lerchbacher J. (2011). Age indexing Giant honeybees (Apis dorsata): nest topology characterised by functional age cohorts. Masterarbeit, University Graz, Austria. urn:nbn:at:at-ubg:1-33123
Lienhard A., Mirwald L., Hötzl T., Kranner I., Kastberger G. (2010). Trade-off between foraging activity and infestation by nest parasites in the primitively eusocial bee Halictus scabiosae. Psyche. 2010, 1–13. doi: 10.1155/2010/707501
Lindauer M. (1952). Ein Beitrag zur Frage der Arbeitsteilung im Bienenstaat. Z. für vergleichende Physiologie. 34, 299–345. doi: 10.1007/BF00298048
Lindauer M. (1954). Temperaturregulierung und Wasserhaushalt im Bienenstaat. Z. für vergleichende Physiologie. 36, 391–432. doi: 10.1007/BF00345028
Lira A. F., Almeida F. M., Albuquerque C. M. (2020). Reaction under the risk of predation: effects of age and sexual plasticity on defensive behavior in scorpion Tityus pusillus (Scorpiones: Buthidae). J. ethology. 38, 13–19. doi: 10.1007/s10164-019-00615-4
Makinson J. C., Schaerf T. M., Rattanawannee A., Oldroyd B. P., Beekman M. (2016). How does a swarm of the giant Asian honeybee Apis dorsata reach consensus? A study of the individual behaviour of scout bees. Insectes sociaux. 63, 395–406. doi: 10.1007/s00040-016-0482-2
Mardan M., Kevan P. G. (2002). Critical temperatures for survival of brood and adult workers of the giant honeybee, Apis dorsata (Hymenoptera: Apidae). Apidologie. 33, 295–301. doi: 10.1051/apido:2002017
Moore A. J., Breed M. D., Moor M. J. (1987). The guard honey bee: ontogeny and behavioural variability of workers performing a specialized task. Anim. Behaviour. 35, 1159–1167. doi: 10.1016/S0003-3472(87)80172-0
Morse R. A., Gary N. E. (1961). Colony response to worker bees confined with queens (Apis mellifera L. ). Bee World 42, 197–199.
Morse R., Laigo F. (1969). Apis dorsata in the Philippines (Laguna: Philippine Association of Entomologists Inc).
Neumann P., Koeniger N., Koeniger G., Tingek S., Kryger P., Moritz R. F. (2000). Home-site fidelity in migratory honeybees. Nature. 406, 474–475. doi: 10.1038/35020193
Nishino H. (2004). Motor output characterizing thanatosis in the cricket Gryllus bimaculatus. J. Exp. Biol. 207, 3899–3915. doi: 10.1242/jeb.01220
Oldroyd B. P., Wongsiri S. (2009). Asian honey bees: biology, conservation, and human interactions (Harvard University Press).
Paar J., Oldroyd B. P., Huettinger E., Kastberger G. (2002). Drifting of workers in nest aggregations of the giant honeybee Apis dorsata. Apidologie 33, 553–561. doi: 10.1051/apido:2002040
Paar J., Oldroyd B., Huettinger E., Kastberger G. (2004). Levels of polyandry in Apis laboriosa Smith from Nepal. Insectes sociaux. 51, 212–214. doi: 10.1007/s00040-003-0729-6
Paar J., Oldroyd B., Kastberger G. (2000). Giant honeybees return to their nest sites. Nature. 406, 475 doi: 10.1038/35020196
Palomo I., Dujardin Y., Midler E., Robin M., Sanz M. J., Pascual U. (2019). Modeling trade-offs across carbon sequestration, biodiversity conservation, and equity in the distribution of global REDD+ funds. Proc. Natl. Acad. Sci. 116, 22645–22650. doi: 10.1073/pnas.1908683116
Peters J. M., Peleg O., Mahadevan L. (2019). Collective ventilation in honeybee nests. J. R. Soc. Interface. 16, 20180561. doi: 10.1098/rsif.2018.0561
Philipson C. D., Dent D. H., O'Brien M. J., Chamagne J., Dzulkifli D., Nilus R., et al. (2014). A trait-based trade-off between growth and mortality: Evidence from 15 tropical tree species using size-specific relative growth rates. Ecol. Evolution. 4, 3675–3688. doi: 10.1002/ece3.2014.4.issue-18
Punchihewa R., Koeniger N., Kevan P., Gadawski R. (1985). Observations on the dance communication and natural foraging ranges of Apis cerana, Apis dorsata and Apis florea in Sri Lanka. J. Apicultural Res. 24, 168–175. doi: 10.1080/00218839.1985.11100667
Robinson W. S. (2012). Migrating giant honey bees (Apis dorsata.) congregate annually at stopover site in Thailand. PLoS ONE 7 (9), e44976. doi: 10.1371/journal.pone.0044976
Robinson W. (2014). Migratory stopover sites of giant honeybees: A plea for conservation. Conference paper. 7th Congress of the International Union for the Study of Social Insects (IUSSI), Cairns, Australia, 13 - 18 July 2014. http://hdl.handle.net/2123/11175.
Robinson W. S. (2021). Surfing the sweet wave: migrating giant honey bees (Hymenoptera: apidae: apis dorsata) display spatial and temporal fidelity to annual stopover site in Thailand. J. Insect Science. 21, 1. doi: 10.1093/jisesa/ieab037
Roelofs K., Hagenaars M. A., Stins J. (2010). Facing freeze: social threat induces bodily freeze in humans. psychol. science. 21, 1575–1581. doi: 10.1177/0956797610384746
Roepke W. (1930). Beobachtungen an Indischen Honigbienen insbesondere an Apis dorsata F. Veenman & Zonen - Wageningen. 1–23.
Rogers S. M., Simpson S. J. (2014). Thanatosis. Curr. Biol. 24, R1031–R10R3. doi: 10.1016/j.cub.2014.08.051
Rojeet T., Deka M., Borah R., Singh H., Priyakshi B. (2016). Diversity of insect pollinators and foraging behaviour of honey bee, Apis dorsata on rapeseed crop. Ann. Plant Prot. Sci. 24, 83–85.
Roubik D. W., Sakagami S. F., Kudo I. (1985). A note on distribution and nesting of the Himalayan honey bee Apis laboriosa Smith (Hymenoptera: Apidae). J. Kansas Entomological Soc. 58 (4), 746–749.
Schindelin J., Arganda-Carreras I., Frise E., Kaynig V., Longair M., Pietzsch T., et al. (2012). Fiji: an open-source platform for biological-image analysis. Nat. Methods 9, 676–682. doi: 10.1038/nmeth.2019
Schmelzer E., Kastberger G. (2009). [amp]]lsquo;Special agents’ trigger social waves in giant honeybees (Apis dorsata). Naturwissenschaften. 96, 1431–1441. doi: 10.1007/s00114-009-0605-y
Seeley T. D. (1986). Division of labour among worker honeybees. Ethology 71, 249–251. doi: 10.1111/j.1439-0310.1986.tb00588.xvv
Seeley T. D. (2009). The wisdom of the hive: the social physiology of honey bee colonies (Harvard University Press).
Seeley T. D., Kolmes S. A. (1991). Age polyethism for hive duties in honey bees—illusion or reality. Ethology 87, 284–297. doi: 10.1111/j.1439-0310.1991.tb00253.x
Seeley T. D., Nowicke J. W., Meselson M., Guillemin J., Akratanakul P. (1985). Yellow rain. Sci. American. 253, 128–137. doi: 10.1038/scientificamerican0985-128
Seeley T. D., Seeley R. H., Akratanakul P. (1982). Colony defense strategies of the honeybees in Thailand. Ecol. monographs. 52, 43–63. doi: 10.2307/2937344
Sihag R. C. (2014). Phenology of migration and decline in colony numbers and crop hosts of giant honeybee (Apis dorsata F.) in semiarid environment of Northwest India. J. Insects 2014. doi: 10.1155/2014/639467
Southwick E. E., Heldmaier G. (1987). Temperature control in honey bee colonies. Bioscience. 37, 395–399. doi: 10.2307/1310562
Sparks T. H., Langowska A., Głazaczow A., Wilkaniec Z., Bieńkowska M., Tryjanowski P. (2010). Advances in the timing of spring cleaning by the honeybee Apis mellifera in Poland. Ecol. entomology. 35, 788–791. doi: 10.1111/j.1365-2311.2010.01226.x
Stabentheiner A. (2005). Individuelle und soziale Thermoregulation der Honigbiene. Entomologica Austriaca. 12, 13–22.
Stabentheiner A., Helmut K., Schmaranzer S. (2004). Der Einfluss der Sonnenstrahlung auf die Körpertemperatur Wasser sammelnder Wespen (Paravespula germanica). Mitt. der deutschen Gesellschaft für allgemeine und angewandte Entomologie. 14, 451–454.
Stabentheiner A., Kovac H. (2014). Energetic optimisation of foraging honeybees: flexible change of strategies in response to environmental challenges. PloS One 9, e105432. doi: 10.1371/journal.pone.0105432
Stabentheiner A., Pressl H., Papst T., Hrassnigg N., Crailsheim K. (2003). Endothermic heat production in honeybee winter clusters. J. Exp. Biol. 206, 353–358. doi: 10.1242/jeb.00082
Steiner A. (1981). Anti-predator strategies. II. Grasshoppers (Orthoptera, Acrididae) attacked by Prionyx parkeri and some Tachysphex wasps (Hymenoptera, Sphecinae and Larrinae): a descriptive study. Psyche: A J. Entomology. 88, 1–24. doi: 10.1155/psyc.v88.1-2
Sulzer W., Kastberger G., Muick M., Hirschmugl M., Huettinger E. (2010). Multitemporal crop and land cover analysis in Chitwan (Nepal) by means of remote sensing. Correlation with the distribution of giant honeybee (Apis dorsata) colonies. Grazer Schriften der Geographie und Raumforschung. 45, 73–82.
Tan N. Q. (2007). Biologie der Riesenhonigbiene Apis dorsata in Vietnam. Apidologie. 38, 221–229. doi: 10.1051/apido:2007002
Tan K., Latty T., Dong S., Liu X., Wang C., Oldroyd B. P. (2015). Individual honey bee (Apis cerana) foragers adjust their fuel load to match variability in forage reward. Sci. Rep. 5, 16418. doi: 10.1038/srep16418
Thangjam R., Deka M., Borah R., Singh H., Buragohain P. (2016). Diversity of insect pollinators and foraging behaviour of honey bee, Apis dorsata on Rapeseed crop. Ann. Plant Prot. Sci. 24, 83–85.
Thapa R., Wongsiri S. (2011). Giant honeybees use wax specks to recognize old nest sites. Bee World. 88, 79–81. doi: 10.1080/0005772X.2011.11417432
Tucker J. B. (2001). The “yellow rain” controversy: Lessons for arms control compliance. Nonproliferation Review. 8, 25–42. doi: 10.1080/10736700108436836
Underwood B. (1990). Time of drone flight of Apis laboriosa Smith in Nepal. Apidologie. 21, 501–504. doi: 10.1051/apido:19900602
Underwood B. A. (1991). Thermoregulation and energetic decision-making by the honeybees Apis cerana, Apis dorsata and Apis laboriosa. J. Exp. Biol. 157, 19–34. doi: 10.1242/jeb.157.1.19
Vijayan S., Somanathan H. (2023). Migration in honey bees. Insectes Sociaux. 70, 127–140. doi: 10.1007/s00040-022-00892-2
Wattanachaiyingcharoen W., Oldroyd B. P., Wongsiri S., Palmer K., Paar J. (2003). A scientific note on the mating frequency of Apis dorsata. Apidologie 34, 85–86. doi: 10.1051/apido:2002044
Weihmann F., Hoetzl T., Kastberger G. (2012). Training for defense? From stochastic traits to synchrony in giant honey bees (Apis dorsata). Insects. 3, 833–856. doi: 10.3390/insects3030833
Weihmann F., Waddoup D., Hötzl T., Kastberger G. (2014). Intraspecific aggression in giant honey bees (Apis dorsata). Insects. 5, 689–704. doi: 10.3390/insects5030689
Winston M. L., Otis G. W., Taylor O. R. Jr. (1979). Absconding behaviour of the Africanized honeybee in South America. J. Apicultural Res. 18, 85–94. doi: 10.1080/00218839.1979.11099951
Woyke J., Wilde J., Reddy C. C., Nagaraja N. (2005). Periodic mass flights of the giant honey bee Apis dorsata in successive days at two nesting sites in different environmental conditions. J. apicultural Res. 44, 180–189. doi: 10.1080/00218839.2005.11101176
Woyke J., Wilde J., Wilde M. (2000). The mysterious color of Apis dorsata workers. Asian Bee J. 2, 43–56.
Woyke J., Wilde J., Wilde M. (2003). Periodic mass flights of Apis laboriosa in Nepal. Apidologie. 34, 121–127. doi: 10.1051/apido:2003002
Woyke J., Wilde J., Wilde M. (2004). Temperature correlated dorso-ventral abdomen flipping of Apis laboriosa and Apis dorsata worker bees. Apidologie. 35, 493–502. doi: 10.1051/apido:2004042
Woyke J., Wilde J., Wilde M. (2012). Swarming and migration of Apis dorsata and Apis laboriosa honey bees in India, Nepal and Bhutan. J. Apicultural Science. 56, 81–91. doi: 10.2478/v10289-012-0009-7
Woyke J., Wilde J., Wilde M. (2016). Shape indexes of nests of Apis dorsata and Apis laboriosa. J. Apicultural Res. 55, 433–444. doi: 10.1080/00218839.2016.1252552
Woyke J., Wilde J., Wilde M., Reddy M. S., Nagaraja N., Sivaram V. (2007). Presence or absence of drones in ‘drone’dusk mass flights performed by Apis dorsata forager bees. J. apicultural Res. 46, 40–49.
Keywords: giant honeybees, shimmering, reproduction, periodic mass flight activity, swarming, infrared recording, motion detection, collective defensiveness
Citation: Kastberger G, Ebner M and Hötzl T (2025) Never lose sight of enemies: giant honeybees perceive troublemakers even in mass flight mode—a case study. Front. Bee Sci. 2:1411720. doi: 10.3389/frbee.2024.1411720
Received: 03 April 2024; Accepted: 12 December 2024;
Published: 30 January 2025.
Edited by:
Mathieu Lihoreau, Centre National de la Recherche Scientifique (CNRS), FranceReviewed by:
Sofia Bouchebti, Tel Aviv University, IsraelCopyright © 2025 Kastberger, Ebner and Hötzl. This is an open-access article distributed under the terms of the Creative Commons Attribution License (CC BY). The use, distribution or reproduction in other forums is permitted, provided the original author(s) and the copyright owner(s) are credited and that the original publication in this journal is cited, in accordance with accepted academic practice. No use, distribution or reproduction is permitted which does not comply with these terms.
*Correspondence: Gerald Kastberger, Z2VyYWxkLmthc3RiZXJnZXJAdW5pLWdyYXouYXQ=
Disclaimer: All claims expressed in this article are solely those of the authors and do not necessarily represent those of their affiliated organizations, or those of the publisher, the editors and the reviewers. Any product that may be evaluated in this article or claim that may be made by its manufacturer is not guaranteed or endorsed by the publisher.
Research integrity at Frontiers
Learn more about the work of our research integrity team to safeguard the quality of each article we publish.