 Federico Saba
 Julien Mariethoz2,3
 Frederique Lisacek
- 1Section of Biology, University of Geneva, Geneva, Switzerland
- 2Proteome Informatics Group, SIB Swiss Institute of Bioinformatics, Geneva, Switzerland
- 3Computer Science Department, University of Geneva, Geneva, Switzerland
Introduction: One of the main challenges in bioinformatics has been and still is, the comparison of entities through the development of algorithms for similarity scoring and data clustering according to biologically relevant aspects. Glycoinformatics also faces this challenge, in particular regarding the automated comparison of protein and/or tissue glycomes, that remains a relatively uncharted territory.
Methods: Low and high throughput experimental glycomic and glycoproteomic results were collected, revealing a bias toward N-linked glycomes. Then, N-glycomes were considered and represented as networks of related glycan compositions as opposed to lists of glycans. They were processed and compared through a java application generating graphs and another producing a similarity matrix based on graph content. Several scoring schemes (e.g., Jaccard index or cosine) were tested and evaluated using the Matthews Correlation Coefficient, in order to capture a meaningful protein and tissue N-glycome similarity.
Results: Assuming that a glycome corresponds to a well-connected graph of glycan compositions, graph comparison has revealed gaps that can be interpreted as inconsistencies. The outcome of systematic graph comparison is both formal and practical. In principle, it is shown that the idiosyncrasy of current glycome data limits the definition of appropriate estimates for systematically comparing N-glycomes. Yet, several potentially interesting criteria could be identified in a series of use cases detailed in the study.
Discussion: Differentially expressed glycomes are usually compared manually, but the resulting work tends to remain in publications due to the lack of dedicated tools. Even manually, cross-comparison is challenging mostly because different sets of features are used from one study to the other. The work presented here enables laying down guidelines for developing a software tool comparing glycomes based on appropriate definitions of similarity and suitable methods for its evaluation and implementation.
1 Introduction
With the increased attention expressed in proteomics towards the identification of proteoforms (Aebersold et al., 2018), glycoproteomics has recently been spreading, leading to a boost in glyco-data production. The co-existence of many different techniques, even though now dominated by mass spectrometry (MS) used in both glycomics and glycoproteomics, gives rise to heterogeneous data on intact glycoproteins, particularly in terms of glycan structure resolution. This is reflected in glycan and glycoprotein databases [chapter 52 of (Varki et al., 2022)] that include information extracted from published studies in glycomics as well as decade-old glycoscience technologies along with low resolution glycan compositions generated in glycoproteomics experiments. But, as the differential analysis of glycomes remains an important goal of glycobiology, glycoinformatics tools that are necessary to achieve comparability, are challenged by glyco-data heterogeneity.
Numerous protocols to study glycan differential expression in a wide array of applications have been published in the past decades. This is, for example, the case of cancer glycan biomarker identification, as summarised in [chapter 47 of (Varki et al., 2022)], of immunoglobulin differential glycosylation in ageing (Gudelj et al., 2018) or of inflammation (Loke et al., 2016), among others. Often enough, differences are expressed in heat maps [e.g., (Boyaval et al., 2022),(Chatterjee et al., 2021)] or alternative statistical charts capturing the correlation between glycan expression and a set of glycan properties (e.g., boxplots Dotz and Wuhrer, 2019). The non-standardised status of the latter hinders cross-studies comparison. Glycan properties usually encompass structural features beginning with types/cores that represent a widely accepted classification of N- and O-linked glycans [chapter 9 and 10 of (Varki et al., 2022)]. Then, these broad categories are possibly refined with attributes such as biantennary, "(core)-fucosylated”, or bisecting in N-glycans or “sialylated” in both N- and O-glycans, with or without linkage specification such alpha2,3/alpha2,8 to qualify sialic acids further. This set of categories is rarely the same from one publication to the other even though some overlap can be observed and it is then possibly complemented with selected glycan epitopes. This selection is again highly variable and can include blood types, Lewis antigens, and/or other glycan motifs such as LacNAc or LacdiNAc, that belong to a list with a loose extent. These non-systematic categorisations challenge the automation of comparative studies because of the limited overlap of glycan feature selections. In the end, glycome comparison is achieved within one publication at a time, possibly across two or more publications by the same authors using their own set of glycan features. Whether small or large scale, the resulting studies involve different and often incompatible approaches, so that a comparison process cannot be generalised. Manual adjustment is needed and automation is hampered.
A second major issue limiting glycome automated comparison, is the usual presentation as lists of independent glycan structures while these structures are often contained in one another. This is yet another hindrance to capturing similarities and differences in whole glycomes since the structural relatedness between structures reveals parts of the biosynthetic machinery at stake. Furthermore, from a bioinformatics point of view, a traditional list representation makes database query results difficult to read and, most importantly, to interpret especially as the amount of glycomics and glycoproteomics data is steadily growing. This issue was partially solved through the implementation of a piece of software called GlyConnect Compozitor. From any set of glycans representing a protein, a cell or a tissue glycome, the tool automatically detects the relatedness of glycan compositions through their shared numbers of monosaccharides and plots them in an interactive graph (Robin et al., 2020). The first intent was to facilitate the biological interpretation of large data collections through a network visualization of the glycan compositions found in a glycomics or glycoproteomics experiment.
The network representation of glycome data is not just enhancing readability, but is also grounded in biology since it roughly mimics the biosynthesis underlying the represented compositions. Indeed, compositions are connected with each other through directed links symbolising a monosaccharide residue addition by an enzyme on an existing glycan. This provides a first consistency check for glycome data. As noted in the original description (Robin et al., 2020) and specified by some users (e.g., (Alagesan et al., 2022), where the tool is used “to correct the sparsity of missing compositions and identify potential outliers”) GlyConnect Compozitor compensates for the disruption of a seemingly continuous path when only one step is missing by introducing so-called virtual nodes. In practise, virtual nodes increase the connectivity of the graph and as such, its consistency. This can be illustrated with the example of a disialylated biantennary glycan that is logically connected to its asialylated form via the corresponding monosialylated biantennary form (continuous path). However, the detection threshold in mass spectrometry data may only be exceeded by the disialylated and asialylated and not the monosialylated forms. Consequently, the mapping of this data into a network of related structures will create a gap between the former two, which only the monosialylated form can fill. Even if sialyltransferases are very efficient, an intermediary state of sialylation can reasonably be assumed. More generally, precisely because cazymes are assumed to act sequentially, a “consistent” glycome represented as a graph, should not contain many outliers. Nonetheless, systematic gap filling with suspected, though undetected, data points needs to be strictly controlled.
Of course, pathway modelling or the integration of transcriptomics data alternatively cover this aspect bioinformatically (Bao et al., 2021; Dworkin et al., 2022), and this type of approach is out of the scope of this article. The main goal here is to open the discussion on the acceptable criteria for qualifying a glycome with the goal of enabling a systematic and automated comparison. To that end, the present article describes a solution prototyped with a Java integration scheme, in order to calculate a similarity score for each pairwise comparison of N-glycomes of the GlyConnect database (Alocci et al., 2019). A minimal number of glycan properties was selected as a starting point. Several similarity scores were tested and a similarity matrix that can be used to extract more than three similar glycomes at a time (three is the current limitation of Compozitor) was built. The highest scoring comparisons in the matrix are then destined to be proposed to the user for further exploration. The study is mainly focused on N-linked glycans as they represent the largest dataset both in the literature and therefore in the database. It is suggested as a prospective approach destined to feed the manual interpretation of glycomics and glycoproteomics results. The various similarity measures were tested to compare mainly protein and tissue N-glycomes. Examples reflecting observations are detailed and used to derive useful features to apprehend the consistency of an N-glycome in the form of an interpretable graph. In the end, the search for consistency supports not only the interpretation of MS identification results but also the tailor-making of a glycan composition dataset fed to glycoproteomics search engines, recently reviewed in (Cao et al., 2021; Hackett and Zaia, 2021) among others.
2 Materials and methods
2.1 Data source
2.1.1 GlyConnect
The GlyConnect platform includes a database of glycoproteins and glycans (Alocci et al., 2019) hosted on the Expasy server (Duvaud et al., 2021) of the SIB Swiss Institute of Bioinformatics as part of the Glyco@Expasy initiative (Mariethoz et al., 2018). GlyConnect data is curated and centered on glycoproteins, glycosites and glycans that are all described with specific details regarding species and tissue sources. By default, all glycan structures are shown using the SNFG notation (Neelamegham et al., 2019).
2.1.2 Test datasets
Two independent datasets collecting pairs of similar protein N-glycomes were manually selected from GlyConnect data. Glycomes with less than six compositions were ignored. Similarity was set to match the following criteria:
• Comparable graph size: due to significant differences in network sizes, a maximum node number difference was set (ratio of sizes <0.3), also imposing a proportionality rule so that smaller networks have smaller tolerated size difference, and vice versa.
• Maximised node overlap: the ratio between non-shared and shared nodes between two graphs reflects the observation that two glycome networks in which the number of shared nodes is greater than the number of nodes unique to one graph tend to be similar. This ratio was set to a minimum of .55.
• Additional experimental evidence: compositions associated with further structural experimental evidence reinforce the similarity between a pair of glycomes that share a high proportion of nodes.
• Comparable glycosylation profiles: the distribution of glycan properties inferred from the compositions and reported in the Compozitor bar plot, are comparable.
The first dataset consists of twenty-five desired and twenty unwanted pairwise protein N-glycome comparisons while twenty-one desired and nineteen unwanted pairwise protein N-glycome comparisons compose the second dataset. The selection of pairwise comparisons was performed to match/not meet the above criteria for the positive/negative examples. The four lists can be found in the Supplementary Tables S1, S2.
Further attempts were made with tissue and disease glycomes but since results were more contrasted with protein glycomes, the formers were not considered in the present article.
The similarity criteria stated above may bring together unexpected pairs from a biological point of view such as human lactotransferrin and the Freestyle 293-F (Cellosaurus ID: CVCL-D603) expressed Sars-Cov-2 spike protein. Such pairing often reflects biases arising from mass spectrometry data. As such, they can be of interest. Yet, pairing may also match a biological reality when two co-localised proteins are likely to share glyco-enzyme availability [e.g., secreted human beta-2-glycoprotein 1 (P02749) and complement factor H (P08603)] or when glycosylation patterns extend across species (e.g., bovine (Q3SZR3) and canine (F6Y713) alpha-1-acid glycoproteins). The latter is not straightforward as, for example, mouse (Q8C129) and human (Q9UIQ6) leucyl-cystinyl aminopeptidases have very distinct glycomes in GlyConnect (see Section 3.7.4 for further details).
2.1.3 GlyConnect compozitor
Compozitor is a web application that enables the user to retrieve contextual information about a set of glycan compositions in the form of interactive networks (Robin et al., 2020). The interface is subdivided into subsets organized in tabs each one dedicated to searching a particular glycome type, whether associated with either a protein, a cell line, a tissue or a disease. It is available at https://glyconnect.expasy.org/compozitor/ and integrated in the GlyConnect platform.
A protein or a tissue glycome can be selected from the GlyConnect database and promptly visualised in Compozitor. The software takes advantage of glycan compositions in a glycome being frequently related to one another by the addition of one monosaccharide. For example, the N-glycan core is related to the core fucoslyated N-glycan core through the addition of a fucose and both may co-occur in a glycome. Compozitor first detects all existing relationships and maps them into a graph where each node is a unique glycan composition, and each link represents the addition of a monosaccharide.
Table 1 summarises the range of possibilities, where monosaccharide compositions of glycans are represented in three possible common notations: classic abbreviations with semi-colons (GlyConnect notation) or brackets (Byonic notation) or 1-letter code (condensed notation). Each node of a Compozitor graph is depicted in the condensed notation. In the background, this composition has a unique GlyConnect identifier, which in turn, has a unique GlyTouCan identifier (Fujita et al., 2020). Cross-links to the GlyConnect database from within the graph, reflect a variety of information on structural, physical, taxonomic, pathological and topological properties, all linked to their respective literature references. The number inside each node is the number of glycan structures in the network matching the composition represented by that node, while the size of the nodes is proportional to the number of publications reporting the composition (in GlyConnect). Note that graphs and node lists can be saved and the export function was recently updated with the inclusion of GlyTouCan IDs as a step closer to data standardisation.
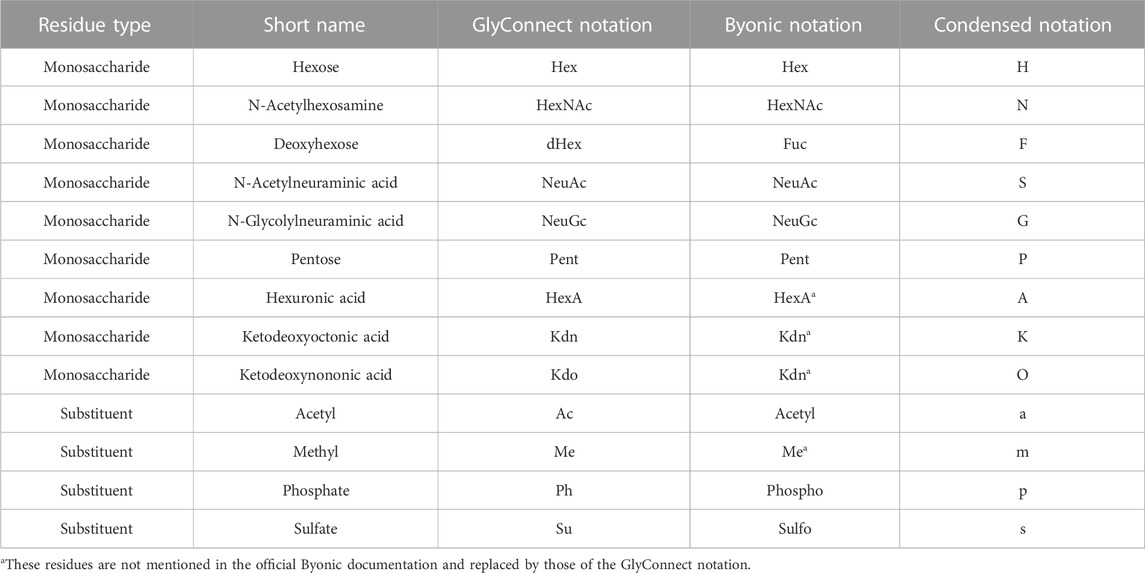
TABLE 1. Monosaccharide notations used in Compozitor.
In this environment, software usability and data visualisation are central and guide the development of interactive resources toward understanding the relationships between glycans, proteins, tissues, diseases and taxonomy. Since these data types are indeed interconnected, retrieving them cannot be limited to lists of observations as often the case in databases.
Finally, Compozitor offers the option to compare up to three glycomes and colour-codes the contribution of each graph. The limit of three was set to avoid an overflow of information that would challenge the interpretation of the graphical representation. A glycome graph resulting from a first query is shown with blue coloured nodes. A second query will generate a glycome graph that can be superimposed on the first one for comparison purposes. Common nodes will be shown in magenta and others in red. As it only maps glycan compositions, Compozitor is a coarse glycome visualising and comparative tool.
2.1.4 Implementation
2.1.4.1 JavaScript object notation
Data are organised in JSON, a text-based format for data interchange. A small set of structuring rules for the portable representation of structured data are defined, but the semantic and the interpretation of text conforming the syntax are intentionally not provided by ©Ecma International. The extreme versatility of the format enables the user to apply a wide range of processing types and semantics to the JSON syntax. Compozitor data are processed by Doppelganger.java to return the results of a query, as explained in the next subsection.
2.1.4.2 Doppelganger
GlyConnect data are obtained indirectly via HTTP through Compozitor and saved offline by the Java application Doppelganger. All entries are associated with an identification number called Compozitor ID allowing unequivocal retrieval. However, other IDs are also present for those entries cross-linked with other on-line platforms. For example, Compozitor ID 558 identifies the glycome network of human serotransferrin, which is also identified by P02787, its UniProt accession number.
Details of the developed packages are provided in Supplementary data. Doppelganger is encoded in the Java programming language, using internal Java libraries except for the Google Gson open-source library to ease the manipulation of JSON files https://github.com/google/gson. The code is publicly visible at https://github.com/sabafed/Doppelganger.
2.2 Virtual nodes
A peculiar feature of Compozitor is the introduction of grey nodes to the graph among the differently coloured real nodes. These are the virtual nodes that are defined to increase the connectivity of a graph by connecting two compositions that differ from two residues. More specifically, a virtual node is added to a network when the continuity of a path is disrupted and only one step is missing. Precise definitions can be found in (Robin et al., 2020) and examples of use in (Mariethoz et al., 2021). The comparison of all the real nodes (compositions) in the GlyConnect database with all the virtual nodes generated in Compozitor graphs it is possible to distinguish:
• Virtual nodes in a network that match at least one composition (real node) reported as a GlyConnect entry (called Virtuals Existing)
• Virtual nodes that cannot be matched to a GlyConnect entry (called Virtuals Created)
• Frequently recurring virtual nodes in the networks
• Virtual nodes that affect similarity scores.
Importantly, the generation of virtual nodes is biologically agnostic so that if, for example, H5N4 and H6N5 co-occur but are not connected in a graph then, H6N4 and H5N5 will both be suggested as virtual nodes for this connection. Whether the hexose or the hexosamine comes first or second is not pre-set. Consequently, the two possibilities are kept.
2.3 Similarity measures
2.3.1 Jaccard index
The Jaccard index (JI) is used for measuring the similarity of finite sets through the ratio of intersection over union, with a set defined as a collection of unique elements distinguishable from each other. The measure is defined as:
and bounded 0 ≤ J(A,B)≤ 1. J(A,B) = 0 corresponds to the event of two sets not having any element in common and J(A,B) = 1 to the event of perfectly overlapping sets.
JI was used to explore glycome similarity from the perspective of nodes (compositions) shared between two graphs. In that case, A and B are sets of nodes respectively present in each graph. The information brought by the Node Jaccard Index (NJI) takes neither the pairs of consecutive compositions nor the type of glycosylation common to the two networks into account, but is built on the occurrence of nodes only.
As Eq. 1 requires distinct elements, the Link Jaccard Index (LJI) is defined by taking the source and target of an edge. If taken in pairs, LJI reflects information not only on the compositions reported in a graph but also on how two compositions are connected to each other. Moreover, considering the edges as pair of linked nodes also evaluates how many pairs of consecutive compositions are shared between networks and which glycan additions are common.
2.3.2 Cosine similarity
Cosine similarity is a measure traditionally used to compare two sequences of numbers. If the sequences are considered as vectors in a two-dimensional space, it is the cosine of the angle between the two vectors, which corresponds to the dot product of the vectors divided by the product of their lengths.
If A and B are two vectors of attributes (properties), cosine similarity is represented as:
Values of cosine similarity are bounded in [0,1] as for the Jaccard Index. However, while the latter could only be measured for finite sets of entities, the former can be applied to numerical vectors.
2.3.3 Network density ratio
Density is the property of a network that expresses its connectivity by comparing the number of existing edges to the number of potential edges in a graph of the same size. It is computed as:
where N is the number of nodes and x is the number of edges.
The Network Density Ratio (NDR) is an attempt to capture the similarity in connectivity between two glycomes. The interpretation relies on cut-off values. Since the ratio between two identical densities is equal to 1, then the more similar two densities are, the closer to 1 their density ratio is. The value of 1 is therefore considered the centre of the range of comparison values. Ratios in the [0.50; 0.95] range provide the lower bound of the interval inside which NDR values must fall. The upper bound is then obtained through estimating:
In that way, a cut-off at 0.9 corresponds to an interval bounded [0.90; 1.10]. This calculation allows to implement the same testing procedure used for the other methods.
2.3.4 Sequence similarity
Amino acid sequence similarity was considered as a potential influence on comparison and subsequently as a corrective factor in order not to overrate graph similarity. This is of course, limited to protein glycomes and was implemented for correcting possible biases. However, the effect on scoring proved not to be significant with the current version of the database that does not contain a large body of homologous proteins. Consequently, no further mention of this option is made in this article.
2.4 Method testing
The Matthews Correlation Coefficient (MCC) is the main metric chosen to evaluate the performance of the various methods explored. Derived from the phi coefficient, it allows the estimate of the performance of an algorithm by considering True Positives (TP), True Negatives (TN), False Positives (FP) and False Negatives (FN). It is defined as:
MCC ranges from −1 to +1 and in this study, the proportion of expected vs. unexpected glycome comparisons retrieved or not is used as the parameter to assess the results. In other words, values around 0 indicate a performance of the method not better than a random prediction, values around +1 indicate sensitive and specific results, and values around −1 are worse than a random prediction.
This testing aims to implement one (or a combination) of the scoring methods to perform a pairwise comparison of the graphs in Compozitor. Each comparison is given a score, which is then inserted in a MxM triangular matrix where M is the number of networks examined. Those having a score above a set cut-off are finally labelled as similar glycomes and can potentially be used in Compozitor to recommend similar graphs to its users.
3 Results
In Compozitor, lists of glycan compositions associated with peptides, proteins, organisms, cells or tissues as reported in the literature, are shown as nodes in a graph and linked through the sequential addition of one monosaccharide at the time. It represents a gross approximation of the enzymatic networks behind a glycome, in an attempt to give some biological sense to the initial lists. The following describes the exploration of various similarity measures for comparing N-glycomes. It should be noted that the reference to GlyConnect creates a clear distinction between compositions that are associated with resolved structures and those that remain at a coarse resolution of composition. It is assumed that confidence in a glycome network is higher when evidence of structure(s) is available for a large proportion of nodes.
3.1 Similar glycomes
Compozitor represents glycomes as graphs but also generates a bar plot of glycan properties (e.g., fucosylated, sialylated, etc) meant as a rough glycome profiling approach. As a result, similarity was thought along two distinct lines. First, the nodes of the graph were given importance in order to track the frequency of glycan compositions as well as that of their properties and corresponding similarity measures were defined, thereby reflecting the content of a glycome. Second, the connectivity of graphs can be considered as prevalent so that links between compositions or between properties hold the relevant information for similarity, thereby reflecting the extent of a glycome.
As mentioned in Section 2.1.2, two datasets were built to evaluate how different measures tend to capture similarity from both the perspectives of nodes and links of a network. Each of the desired comparisons were assigned as positives and the unwanted ones as negatives. Therefore, in this binary context there are four possible classifications for each comparison: 1) if an expected similarity is retrieved, then it is labelled as a True Positive (TP), 2) if an expected similarity is not retrieved then it is labelled as a False Negative (FN), 3) if an unexpected similarity is not retrieved, then it is labelled as a True Negative (TN) and 4), if an unexpected similarity is retrieved, then it is labelled as a False Positive (FP). This classification is used to calculate all the metrics evaluating the performance of a scoring method. Furthermore, specificity is assessed by calculating the True Negative Rate (TNR = TN/TN + FP) and sensitivity with the True Positive Rate (TPR = TP/TP + FN). The Matthews Correlation Coefficient (MCC) was selected as an appropriate estimate among a broad range of options (Chicco and Jurman, 2020). Mainly, it allows measuring the quality of binary classifications independently of dataset size. This is a determinant feature when comparing different methods that may return a different number of results for the same threshold. These values are calculated and stored in a so-called confusion matrix for each type of similarity.
3.2 Content similarity
Table 2 summarises results obtained for this section with the first dataset.
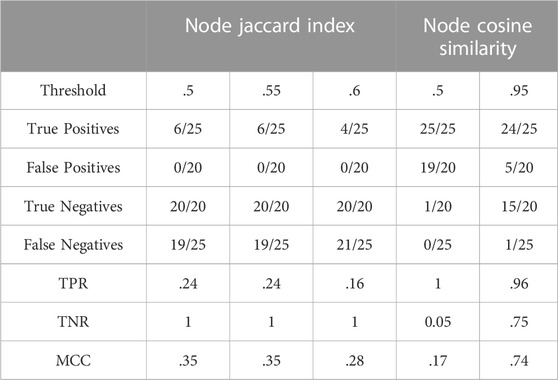
TABLE 2. Similarity of N-glycome content.
3.2.1 Counting compositions
The Jaccard Index defined in Section 2.3.1 was used to define a Node Jaccard index (NJI), counting nodes as entities. Being a straightforward representation of the ratio of elements shared by two sets, this similarity measure was applied to evaluate the retrieval of the expected similar networks, as explained earlier.
The performance of Jaccard Index applied to the nodes is clearly low since the highest scores are closer to zero than to one. The left part of Table 2 reveals that Node Jaccard Index is characterized by a high specificity and a low sensitivity, making it a scoring method suitable for assigning low values to irrelevant similarities but not good enough to recognise the expected ones. Note that the highest value of the MCC is 0.3508232 and appears at the 0.50 and 0.55 thresholds before dropping below 0.3.
3.2.2 Counting glycan properties
The vectors compared by the cosine similarity measure consist of decimal numbers that represent the relative frequencies of two types of information: the glycan properties of the nodes in an N-glycome, or the type of monosaccharide addition that links two nodes.
The results given by this measure were filtered at increasing cut-off levels, i.e., the minimum cosine of the angle between the two vectors is lowered at each threshold. With this incremental approach, the lowest MCC value was found for threshold 0.50 and corresponds to 0.1685500, increasing to a maximum of 0.7370286 at the threshold of 0.95. The right part of Table 2 shows that low MCC values at 0.50 cut-off are due to low TNR causing a high number of false positives, whereas TPR at the same cut-off indicates a perfect identification of all the positives. At the highest threshold, the rise of the MCC is a trade-off of specificity to increase sensitivity.
3.3 Connection similarity
Table 3 summarises results obtained for this section with the first dataset.
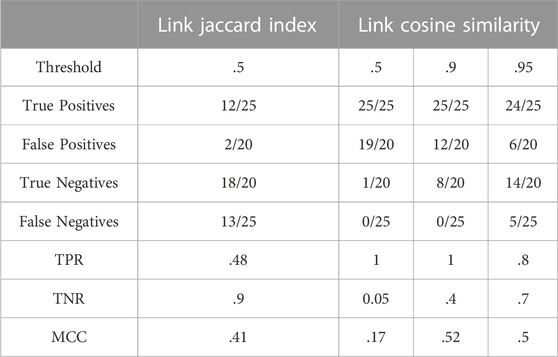
TABLE 3. Similarity of N-glycome connectivity.
3.3.1 Counting connections between compositions
As in Section 3.2.1, the Jaccard index was used on the edges of a glycome network. The source and target of an edge are the most informative parameters in that case, since they are unique comparable entities. If taken in pairs, information is not only limited to compositions reported in a graph but also on how compositions are connected with one another. Moreover, considering an edge as a pair of linked nodes also accounts for compositional frequency in both networks because counting applies to the shared added monosaccharide as well as associated pairs of consecutive compositions.
The left part of Table 3 shows that this method has an extremely high TNR but a much lower TPR, meaning that it is not suited to recall true positives but very good in identifying false positives and true negatives. Another limitation of this method is that close to half of N-linked positives are mislabelled as negatives (false negatives).
It is ultimately worth mentioning that the best performance of the method happens at a Jaccard Index threshold of 50% and rapidly declines if higher values are attempted.
3.3.2 Counting connections between properties
As in Section 3.2.2, the cosine similarity was used but this time, on the edges of a glycome network. The number of occurrences of each link over the total number of links in the graph returns the vector of frequencies used to compute the cosine. As in 3.2.2, an incremental approach was defined to monitor the values of the MCC.
The right part of Table 3 reveals that link cosine at low threshold performs better in identifying the true positives (high TPR) than in distinguishing between a true and a false positive (TNR is almost zero). Increasing the minimum score, however, produces an increase in sensitivity at a cost of a small loss of specificity.
3.4 Influence of network density
Table 4 summarises results obtained for this section with the first dataset.
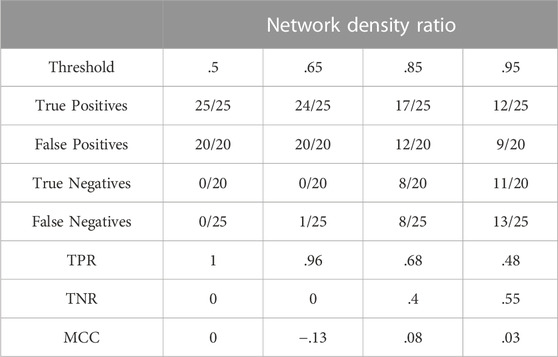
TABLE 4. Alternative similarity of N-glycome connectivity.
The figures in Table 4 demonstrate that the network density ratio within the [0.85; 1.15] interval, fails to distinguish positives and negatives. As can be expected, the network size has a strong influence on the use of this measure. See Section 3.7.1 for further illustration and details.
3.5 Evaluation of the different measures
Each comparison of two protein N-glycomes relies on previously manually classified positive or negative examples. The criteria used for manual curation are defined in Section 2.1.2. Each comparison was scored with the range of methods detailed in Section 2.3 and these results were then compared based on their best performance and on the threshold at which the best performance occurred, using the MCC evaluation also described in Section 2.3. A global overview of the scores for each dataset and for mean values between the two, is mapped in Figure 1, which shows that the best performing measures are those based on Node Cosine Similarity (green curves). In contrast, the plots emphasise the lower performance of Node and Link Jaccard Indices (pink, orange, purple and yellow curves). This observation is consistent across datasets cited in Section 2.1.2. Figure 1 also shows the slight improvement of adding virtual nodes since all curves corresponding to the inclusion of virtual nodes in the network tend to be above those where virtual nodes are ignored.

FIGURE 1. MCC score mapping to threshold values above .5 for each tested method across the two datasets defined in 2.1.2, including or not virtual nodes. (A) MCC trend for all methods in the first dataset (B) MCC trend for all methods in second dataset (C) Mean MCC trend between first and second datasets. Abbreviations Matthews Correlation Coefficient (MCC), Link Cosine Similarity (LCS), Node Cosine Similarity (NCS), Link Jaccard Index (LJI), Node Jaccard Index (NJI), Network Density Ratio (NDR), Virtual Nodes (VN).
3.6 The contribution of virtual nodes
An obvious interpretation of the presence of a virtual node is a possibly missed composition in a mass spectrometry experiment. Data accumulated in GlyConnect, hence the increased variety of possible glycome networks led to assess the nature and the frequency of virtual nodes introduced by Compozitor, in order to refine the understanding of the role of virtual nodes. It was previously observed that some virtual nodes tend to disappear from one GlyConnect release to the other, for instance, in the frequently updated N-glycome of human erythropoietin (EPO) (Mariethoz et al., 2021). Furthermore, the presence of virtual nodes is often a reflection of data quality, especially in high throughput experiment results that notoriously contain a higher percentage of false positives. For example, the human laminin subunit beta-1 (P07942) has been identified as a glycoprotein in two high-throughput glycoproteomics (cancer) studies; the Compozitor view of the combined glycomes represents the 33 compositions stored in GlyConnect, in a particularly disrupted graph in the absence of virtual nodes and generates a particularly high number of virtual nodes (20/33, i.e., 60%) to increase connectivity (Supplementary Figure S1). This type of cases (strictly high-throughput glycoproteomics studies) contrasts with N-glycome data cumulated from both glycomics and glycoproteomics. To illustrate this point, data relative to the human beta-2-glycoprotein 1 (P02749) in GlyConnect consists of 35 compositions, supported by eleven published articles describing a range of glycomics and glycoproteomics experiments. In Compozitor, the introduction of virtual nodes for human beta-2-glycoprotein 1 is limited to three (<1%). This is a clear illustration of the notion of consistency set in the introduction. It is definitely a challenge to make sense of the human laminin subunit beta-1 N-glycome as defined in the current release of GlyConnect while the continuity of the graph of human beta-2-glycoprotein 1, even though reported in several distinct body fluids, appears as a well-connected graph, hence as a consistent set. Attempting to link this data to enzyme (glycosyltransferase) expression seems a reachable goal when connected nodes form continuous paths from smaller to larger structures.
3.6.1 Created vs. existing compositions
Compozitor creates virtual nodes to fill a gap in a glycome network, irrespective of whether the corresponding composition is or not in the database. In other words, some inserted virtual nodes match existing compositions found in other glycomes but some are just ad hoc compositions, never reported before, therefore not stored in GlyConnect and possibly unrealistic from a biological viewpoint. Note that a simple procedure for establishing whether virtual nodes are created or already reported is described in (Mariethoz et al., 2021).
Protein and tissue N-glycomes were analysed to track both types of virtual nodes, existing and created. To begin with, the overall proportion of generated virtual nodes was comparable between proteins and tissues, as shown in Table 5. Then, to establish whether the number of virtual nodes in a network correlates with its size, the frequency of virtual nodes in each protein glycome network was calculated. As a trend, it appears that the larger the network the less virtual nodes are required to enhance connectivity. Moreover, as observable in Figure 2 where the ratio of virtual nodes in networks is plotted with the network size, networks with up to 15 nodes have the highest proportion of virtual nodes, reaching almost 12% of the total size in some cases, while a stable decline is clearly shown with the increase of size. This supports the assumption that the consistency of glycome data in GlyConnect is likely to improve with increasing the content of the database. The trend is also reinforced with the similar counts obtained considering tissue glycomes which produced lower numbers since tissue glycome networks are significantly larger than that of proteins. Frequently studied fluids such as blood serum and urine produce networks of two to three hundred of nodes (backed by many dozens of publications) while the glycomes of frequently studied proteins such as serotransferrin or uromodulin are mapped in smaller networks. For this reason, the following continues with protein N-glycomes where the contribution of virtual nodes is more pronounced.
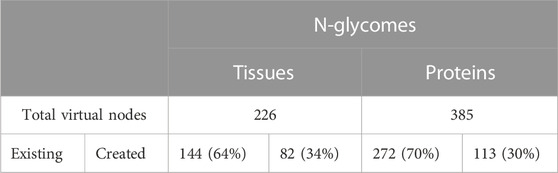
TABLE 5. Occurrence of virtual nodes in N-glycome graphs.
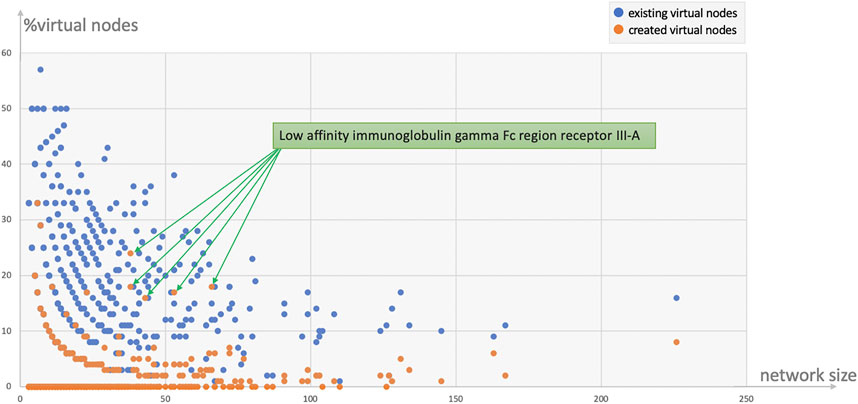
FIGURE 2. Ratio of virtual nodes as a function of network size reflecting the protein data in Table 5. Most virtual nodes correspond to glycan compositions already recorded in the database as part of a reported N-glycome (272 blue points) while virtual nodes created to preserve the connectivity of a graph (113 orange points) are less frequent. The exceptional case of the human low affinity immunoglobulin gamma Fc region receptor III-A that produced five outliers is discussed in the text.
In line with the numbers of Table 5; Figure 2 shows that the majority of virtual nodes added to protein networks already exist in the database, such that the plots of the distribution of all virtual nodes and that of existing ones are identical. Figure 2 also highlights that smaller networks need more virtual nodes. The highest ratio (upper left side of the plot) is a the CD5 N-glycome composed of three glycans whose compositions differ from one another by two monosaccharides. The introduction of four virtual nodes is necessary to connect the three reported structures. The five outliers (orange points in Figure 2) correspond to the same protein, the human low affinity immunoglobulin gamma Fc region receptor III-A (P08637) described in two published references (the multiplicity was due to a software bug that is now fixed and the five entries are merged into one in current release of the database). Out of the 23 virtual nodes needed to connect the 70 compositions of the human low affinity immunoglobulin gamma Fc region receptor III-A, 13 were created (∼56%). Supplementary Figure S2 shows the graph with unlabelled virtual nodes that are in fact connecting compositions described in only one of the two references. The unusually large compositions reported (H11N10F1S4 and H12N11F1S4) probably explain the unlikelihood of the existence of intermediary nodes such as H10N10F1S4 or H12N10F1S4.
The frequency of the twenty most frequent created and existing virtual nodes is detailed in Table 6. These figures are reported for protein N-glycomes, where the Occurrence column indicates the number of protein networks having the virtual node cited in the Node column. The presence of these nodes in networks was scrutinised in relation to meta-data (species, tissue, disease state, etc), as detailed in the following sections.
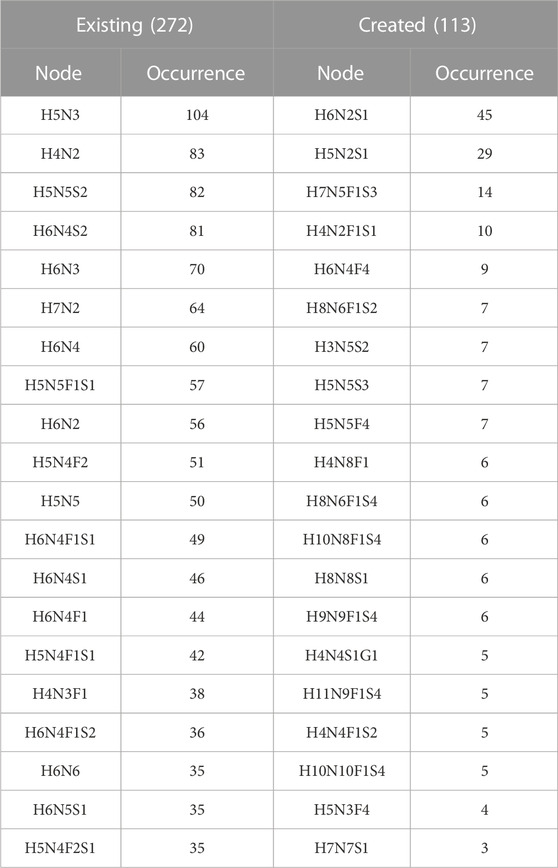
TABLE 6. Top 20 most frequent existing and created virtual nodes in protein N-glycomes.
3.6.2 Created virtual nodes
The logical rules for inserting virtual nodes in the initial and current version of Compozitor are simplistic and do not rely on glycobiology knowledge. That is why some unrealistic nodes are generated such as H6N2S1 because in most cases, the outcome of the computation is not one virtual node, but two (see Section 2.2). H6N2S1 and H6N3 are both at a distance of one residue from the target node H6N3S1 starting with H6N2. Compozitor generates two options based on the presence of H6N2 (Man6) and H6N3S1 that need two monosaccharides to be connected. Logically, the alternative is either H6N2S1 or H6N3 as intermediary steps. Biologically, H6N2S1 is absurd since a sialic acid cannot be added on Man6. In contrast, H6N3 is a valid intermediary composition, potentially a bisecting GlcNAc, but most likely on a path to a hybrid N-glycan including a galactose on which the sialic acid can be added. Note that H6N3 is listed in Table 6 as a common virtual node in the Existing section. In the end, H6N2S1 present in 45 glycomes across the N-Linked protein dataset, systematically appears as an alternative to H6N3 and can be dismissed as an absurd option. In the next version of Compozitor an exclusion rule will be added to prevent the occurrence of H6N2S1. It will apply to H5N2S1, the second most common created virtual node raising the same issue.
Another rule of precedence was uncovered by examining the virtual node H7N5F1S3 created to connect H6N5F1S3 and H7N6F1S3 as an alternative to virtual but existing H6N6F1S3. This situation is illustrated in Figure 3 showing the corresponding excerpt of the graph for the human integrin alpha-5/beta-1 complex (P08648 + P05556). Figure 3 also reflects GlyConnect content where compositions are associated with structures reported on the human integrin alpha-5/beta-1 complex in published work. The path that begins with a tri-antennary (H6N5F1S3) to end with a tetra-antennary (H7N6F1S3) is interrupted, but Compozitor proposes to create a H7N5F1S3 node or to map an existing H6N6F1S3 node (7 optional structures in GlyConnect) as virtual nodes to bridge the gap. It appears in this case that a +N followed by a +H is more likely to reflect the real underlying enzymatic chain of events at play in the formation of the H7N6F1S3 tetra-antennary composition. Considering the associated structures shown in Figure 3, the GlcNAc residue is indeed needed before the galactose. This justifies the dismissal of H7N5F1S3 that is present in 13 other graphs with the same alternate path involving H6N6F1S3.
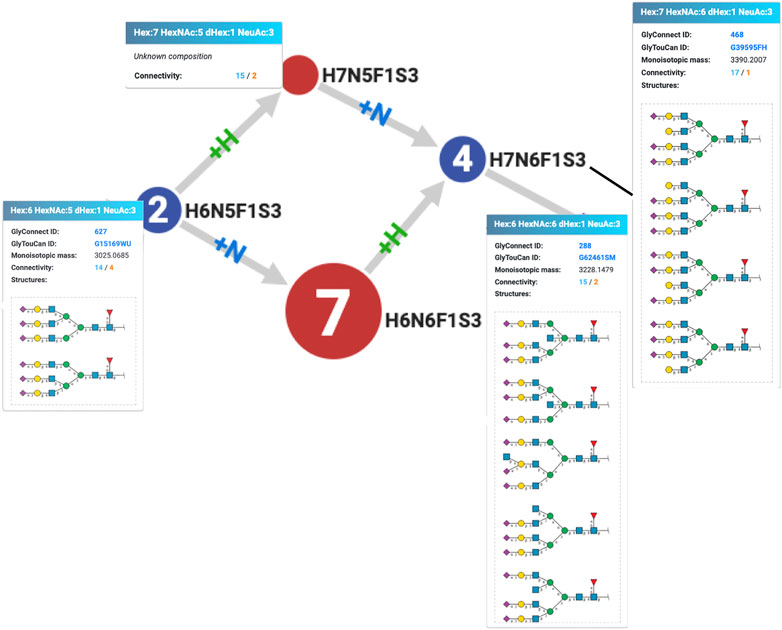
FIGURE 3. Excerpt of the Compozitor graph of the human integrin alpha-5/beta-1 complex (P08648 + P05556) showing the unlikelihood of the existence of H7N5F1S3 that is not ever reported in GlyConnect while H6N6F1S3 is present in seven other protein N-glycomes. The addition of an hexosamine prior to that of an hexose on H6N5F1S3 is a more likely enzymatic event, which makes sense considering the structures associated with the compositions.
Other virtual node creation is more convoluted and seems to generally involve inappropriate connections. The case of H3N5S2 is somehow illustrative. H3N5S2 springs from H3N4S2 and a thorough examination of reports that support refined structures for H3N4S2 revealed a mistake (that will be corrected in the next release of GlyConnect), making this composition dubious as an N-glycan. Several examples of paths stemming from H3N4S2 are shown in Figure 4. Roughly speaking, two situations are observed. In many networks, H3N4S2 is a root, meaning that it is not connected to a smaller composition and only connects to larger ones (orange paths only in Compozitor). The path can stop a few steps later as in the human Complement 4A (P0C0L4), at H5N4F1S2 or extend much further up to H7N6S1F3 in human Biglycan (P21810). In all cases, these paths go through H5N4S2, a composition that is very frequent in human N-glycomes (for example, matching GlyTouCan ID G84467IZ). The issue in linking H3N4S2 with H5N4S2 is that the corresponding paths contain many improbable nodes including H3N5S2 (created virtual), while H5N4S2 should in fact, only be reachable from H5N4S1.
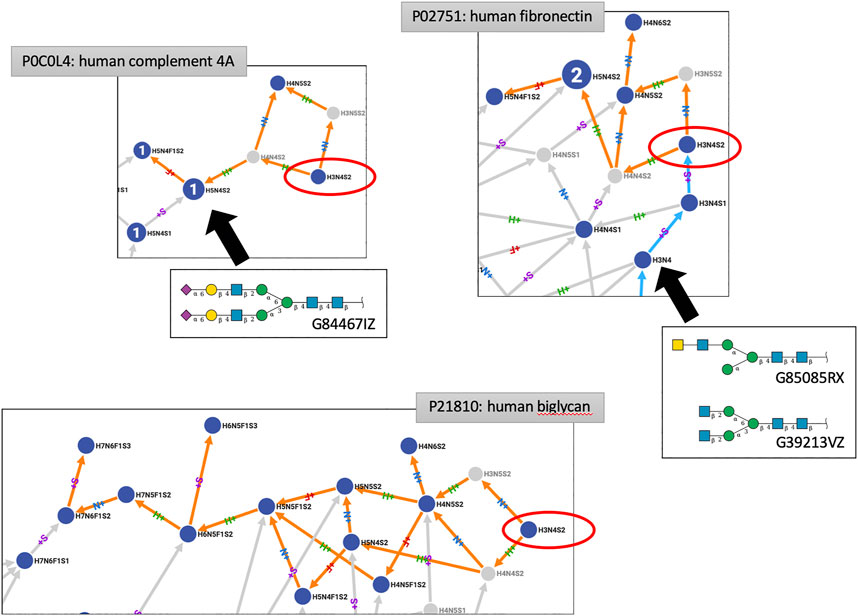
FIGURE 4. Excerpts of three protein N-glycomes shown in Compozitor where H3N4S2 occurs (red ellipses). When H3N4S2 is a root, it cannot be reached from other nodes (strictly orange paths linking out). In that case, paths go through H5N4S2, a composition that is very frequent in human N-glycomes (shown here as G84467IZ) but more likely to be reached from H5N4S1. These observations cast doubt on the existence of H3N4S2.When H3N4S2 can be reached from a smaller composition (cyan paths linking in), typically H3N4 but given the associated structures (G85085RX and G39213VZ), disialylation appears as an unlikely event.
When H3N4S2 is not a root (orange and cyan paths in Compozitor, i.e., links in and out), it stems from H3N4S1 that is associated with a sialylated LacdiNAc motif on one branch only. Complex N-glycan structure synthesis may diverge from H3N4 onward to accommodate the extension of one (for example, GlyTouCan ID G85085RX) or two branches (for example, GlyTouCan ID G39213VZ), as shown in Figure 4. It is then suspected that the theoretically valid extension of these structures toward H3N4S2 is likely to be a source of overlinking in the network, which is built on logical and not biological rules. As the main criterion for Compozitor is to maximise connectivity, some links may not make biological sense. These situations will be reviewed to define new rules in a future version of Compozitor.
Finally, the case of connecting compositions with more than three fucoslyations is difficult to interpret with the current data in GlyConnect. Hyperfucosylated structures are sparse and corresponding to compositions that are often disconnected in Compozitor graphs. However, these compositions are included in glycoproteomics software and often enough mapped in experimental results. This, in turn, overpopulates compositional data in GlyConnect while higher resolution structures are still missing. Such an imbalance raises more questions than it answers. The creation of virtual nodes is then almost impossible to argue and the only solution is to wait for more hyperfucosylated structures to be solved and integrated in GlyConnect to draw stronger conclusions from networks where they occur.
3.6.3 Existing virtual nodes
Regarding existing compositions missing in networks and filled by virtual nodes, the examination of corresponding mass spectra appears as the main means of justification for including these nodes. Previous interaction with researchers running MS experiments has led to identify some structures missed in the report but present at trace levels, thereby justifying the introduction of virtual nodes (personal communication: Katherine Wongtrakul-Kish). Another option for assessing the plausibility of virtual nodes is glycome comparison and this was a side purpose of work described in the previous section.
Nonetheless, the very frequently missed compositions were examined with the purpose of interpreting the observed figures of Table 6. The path that generates oligomannose structures is often incomplete in the majority of glycomes stored in GlyConnect. Glycoproteomics software usually offers the range from Man5 to Man10, possibly up to Man12 and virtual nodes often bridge gaps in this continuous and linear path. It is therefore consistent with H6N2 and H7N2 featuring in the top twenty, as well as H8N2. H4N2 is high in the list potentially as a precursor in this context. Other frequent existing virtual nodes tend to correspond to intermediary compositions as illustrated in Figure 5. The top listed H5N3 and H6N3 are very often reported in the literature in association with multiple species and multiple tissue sources. The most defined structures matching these compositions in GlyConnect, are shown in the figure with their GlyTouCan accession numbers. These may correspond to intermediary/incomplete structures not abundant enough to be identified.
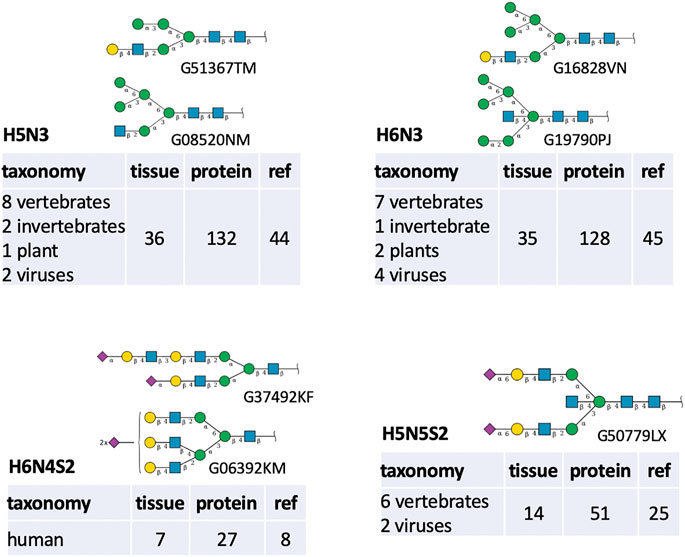
FIGURE 5. Structures (displayed in the SNFG notation along with their GlyTouCan ID) and biological context details associated with four frequently missed compositions shown in Table 6.
The case of H6N4S2 is remarkable in that it is not observed elsewhere than human, in much fewer samples and with clearly distinct structure templates (bi-antennary vs. tri-antennary). In GlyConnect, H5N5S2 is not associated with an alternative to the bisecting structure shown. However, it may also be an intermediary stage to a tri-antennary structure. The virtual status of the latter two cases and the other close compositions listed in Table 6 is difficult to explain with the current protein glycome data.
3.7 Use cases
Recall that nodes with associated structures in the GlyConnect database are considered as more reliable than purely compositional nodes mostly derived from high-throughput glycoproteomics studies. The following now highlights the use of biological knowledge (meta-data) associated with nodes. In each case, the information brought by the different similarity measures is discussed.
3.7.1 Large network comparison
Large networks are best assessed with the cosine similarity of node properties as well as link cosine similarity. These can be combined with network density that is expected to perform well with a more tightly connected network. This is illustrated with an example of human protein N-glycomes comprising between 45 and 85 nodes. Figure 6 shows the comparable glycan property distributions as output by Compozitor for four protein N-glycomes in the A panel and five in the B panel. The full details of similarity score calculations for the pairwise comparisons are provided in Supplementary Tables S3, S4. The values for network density are all very close to 1 and similarity values computed from networks with and without virtual nodes emphasise that the inclusion of virtual nodes tends to enhance similarity.

FIGURE 6. Bar plots of glycan properties in large N-glycomes (45 ≤ #nodes ≤85) of selected human proteins expressed in the same tissues (blood serum as red drop and milk as white drop). The number of supporting publications is indicated for each protein. Panel (A) shows N-glycomes with dominant fucosylated and sialylated glycans. Panel (B) shows N-glycomes with dominant fucosylated and neutral glycans. In each case, N-glycome pairs share high node cosine similarity and network density ratios.
Figure 6 also specifies the number of citations/references supporting the glycome data, as well as the common tissues glycans were identified in, especially in large-scale studies of blood serum (red drop) and milk/mammary gland (white drop). As pointed out in Section 3.6, the support of published articles reflecting different types of experimental results increases the reliability/stability of glycome data. Moreover, expression in the same tissue is key to comparison. The distributions of the two panels are distinctive with a dominant fucosylation in both but co-occurring with sialylation in 1) as opposed to neutrality in 2). However, the low node Jaccard Index reveals the poor overlap of compositions across each glycome network pair. The similarity between these N-glycomes does not match the initial criteria stated in 2.1.2 for selecting positive examples yet, the closeness detected by cosine similarity at the level of glycan properties appears as an appropriate indicator of proximity.
3.7.2 Noise created by large-scale studies
Several references integrated in GlyConnect correspond to high-throughput glycoproteomics experiments leading to the identification of hundreds of intact glycoproteins. However, in each case, the presence of false positives is likely and reflects the uneven performance of identification software as evaluated recently (Kawahara et al., 2021). This point is illustrated in Figure 7 where the N-glycomes of three human proteins are shown to perfectly overlap. These proteins are otherwise not described in other studies, i.e., no other reference supports the reported glycosylation events. The perfect overlap is somehow suspicious mostly because of the peculiarity of some compositions. To begin with, the two unconnected nodes correspond to compositions that are included in the default list of most glycoproteomics analysis software but the matching structures have only been solved in chicken (Gallus gallus) so far. Of course, this may change over time. Furthermore, H5N4 (shown to match a frequent N-linked whose “generic” frequent structure is mapped in Figure 7) is in each protein, multiply fucosylated while the singly fucosylated state is missed in all cases. These compositions are often seen in human immunoglobulins, therefore their existence in human cannot be doubted. Finally, H6N3S1 and H6N4S1 both match hybrid N-glycans possibly found in human milk or blood serum, yet their exact co-occurrences in three proteins is remarkable since they are less frequently observed in N-glycomes.
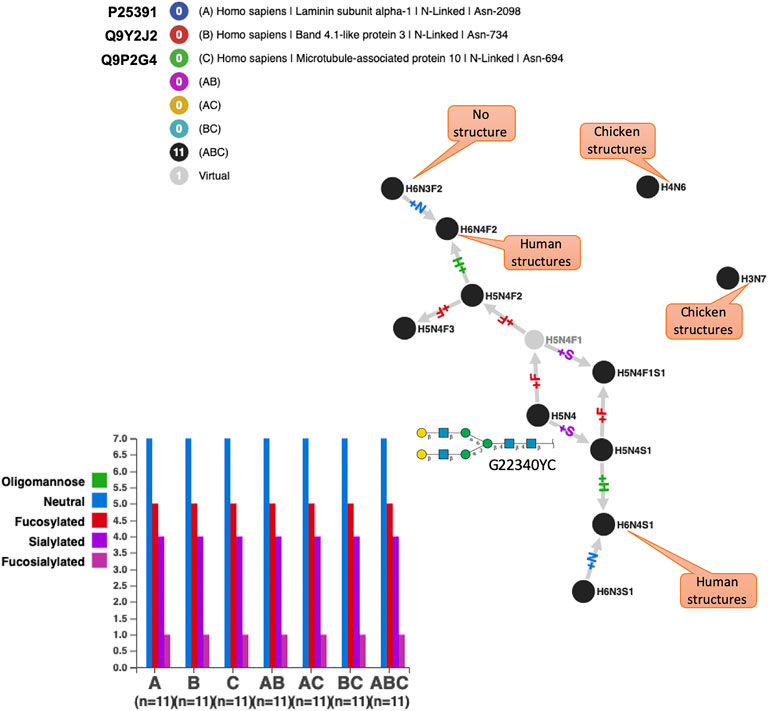
FIGURE 7. Perfect N-glycome overlap for three human proteins exclusively identified in high throughput glycoproteomics studies. These N-glycomes score the best similarity with all methods but the biological significance is difficult to argue for many reasons among which the fact that a microtubule associated protein is unlikely to be glycosylated and that fucosylated glycans have no precursor with only one fucose. H5N4 is the root of the graph and the generic structure associated with this composition is shown in SNFG with its GlyTouCan ID. Captions specify the existence of solved structures matching the shown compositions and the species in which they have been found according to GlyConnect.
From the protein viewpoint, if laminin subunit alpha-1 and band 4.1-like protein 3 are potentially glycosylated, it is less likely to be the case for a microtubule-associated protein 10 that is located in the cytoskeleton. These accumulated inconsistencies cast strong doubt on the reality of the perfectly matching glycomes shown in Figure 7. Nonetheless, Supplementary Table S5 displays the optimal values of all similarity scores, thereby confirming their relevance when N-glycomes are perfectly aligned. In this case, similarity measures serve to detect likely false positives in high-throughput glycoproteomics experiments.
3.7.3 Uncharacterised proteins
GlyConnect was developed as a “next-generation” GlycoSuiteDB (Cooper et al., 2003), the first database in which information on intact glycoproteins was collected and curated. As such, GlyConnect contains old entries of GlycoSuiteDB based on many decades-old publications. Some of the experiments undertaken in the 1970s and 1980s did not benefit from state-of-the-art technology for precisely identifying intact glycoproteins. When the latter could not be specified, they were listed as uncharacterised and of course not associated with a UniProt accession number. Cosine similarity combined with node Jaccard Index have helped associate a few uncharacterised proteins with likely defined proteins. An example is provided in Figure 8 that shows the comparison of the 24 glycans forming the N-glycome of an unknown human protein found in blood serum reported in one publication, matching 23 out of 73 reported glycans of human immunoglobulin alpha 2 (P01877) collected in 12 publications and stored in GlyConnect. In other words, only 1 node (H6N5F1S3) which is terminal in the network, is identified in the uncharacterized protein but not in human immunoglobulin alpha 2. This 95% overlap in N-glycome content is a strong evidence of the human protein found in blood serum presumably being immunoglobulin alpha 2.
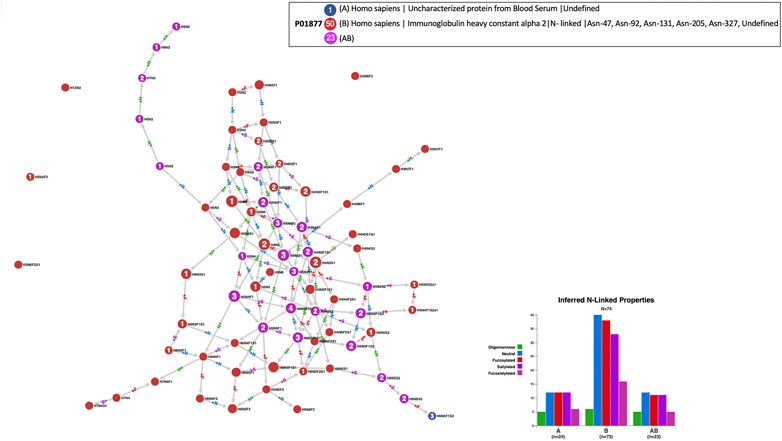
FIGURE 8. Compozitor output of the comparison of the N-glycomes of an uncharacterised protein from human blood serum (blue nodes) with human immunoglobulin alpha 2 - P01877 (red nodes). Magenta nodes represent the 23 shared nodes which represent 95% of the uncharacterised protein. See Section 2.1.3 for a detailed description of a Compozitor output, especially regarding node colour, label and size.
3.7.4 Cross-species comparison
According to GlyConnect records, leucyl-cystinyl aminopeptidase was identified as being glycosylated in two independent large-scale studies involving two distinct tissues, mammary gland and brain, in two distinct species, human (Q9UIQ6) and mouse (Q8C129), respectively. Figure 9 panel A highlights the totally different glycosylation patterns. The glycan property distribution could not be more opposed and the graphs are perfectly disjoint. Node Jaccard Index is obviously a good measure for such a negative example of 100 percent non-overlapping glycomes (see Supplementary Table S6 for details of similarity scores). In contrast, Figure 9 panel B reflects the close glycosylation patterns of alpha-1-acid glycoprotein shared by cow (Q3SZR3) and dog (F6Y713), in blood serum. More glycans are reported in the cow with two published references, than in the dog with only one reference, but the latter are all included in the former. Node Jaccard Index is still insufficient, Link Cosine with virtual nodes is better but clearly Node Cosine (glycan properties) including virtual nodes performs best (see Supplementary Table S6 for details). These examples highlight the variety of cases when the glycomes of orthologous proteins are compared and therefore the challenge of drawing conclusions automatically.
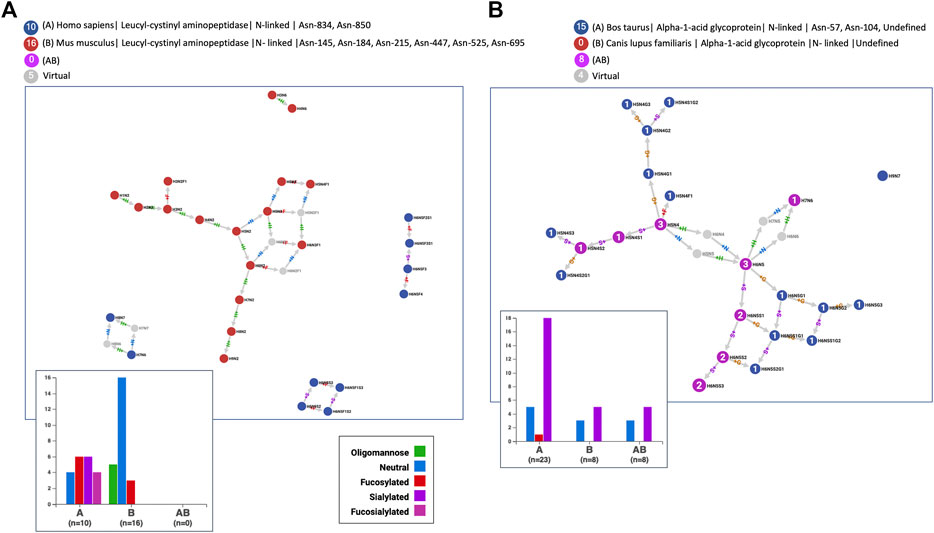
FIGURE 9. The N-glycomes of homologous proteins in distinct species are (A) radically different for leucyl-cystinyl aminopeptidase in human and mouse expressed in different tissues or (B) very comparable for alpha-1-acid glycoprotein in cow and dog both expressed in blood serum.
4 Discussion
Automated glycome comparison is challenged by the heterogeneity, the scarcity and the imbalance of the data available. First, any automation depends on the analysis of a critical mass of data. Over the past decades, published work have created a bias toward N-glycosylation in collectable datasets, making this subset more amenable to analysis. Actually, this situation is due to technical reasons and does not necessarily reflect the reality of biology. Second, other data biases arise from both technological and biological interests. For instance, a lot of data on immunoglobulin glycosylation have accumulated, given the stakes involved in developing technology, usually high-throughput, with these proteins in medical research. Third, glycoproteomics complements glycomics and resulting data may be difficult to reconcile as compositions and site mapping on the one hand, are not always straightforwardly related to partially or fully defined structures with a loose link with proteins, on the other hand. Fourth, high throughput glyco-technology relies on not yet optimised software and this, in turn, introduces noise in collected glycome information.
Even though, glycome comparison is considered here in its simplest form, i.e., considering low resolution compositional data, limiting to curated N-glycosylation data and ignoring–though admittedly rare–quantitative data, the present study emphasises the existence of trends and confirms N-glycome comparability. Finding support for this statement was an underlying goal of the present study. Nonetheless, studying glycan property distributions is a step towards dealing with a form of quantification, especially when site information is known. In several instances, micro-heterogeneity depicted as proportions of glycan cores has proven an informative approach [see, for example, (Watanabe et al., 2018)].
The connectivity of protein N-glycome networks built from glycan compositions is information-rich, yet not fully consistent. The introduction of virtual nodes is a means of improving consistency but it is not sufficient. Other tests to assess consistency, for example, based on estimating classical network analysis parameters (e.g., measuring node centrality) were carried out but did not produce interpretable results. So far, a glycan property-inspired measure such as a profile remains the most direct means of making sense of glycome data.
A clear consequence of the imbalance in knowledge of N-glycosylation events is the heterogeneity of glycome sizes and therefore corresponding network sizes. With the current data, it appears that the appropriateness of a similarity measure depends on the network size. Establishing such relationship was out of the scope of the present study but first indications support the pre-grouping of data according to glycome size. The examination of the performance of the various similarity scores proposed, also shows that those could be combined to strengthen similarity detected with one particular score. This particularly applies to larger glycomes. The current score definitions are mainly producing values between 0 and 1, making the combination easy enough to achieve. The next step is definitely a more systematic approach for combining scores and the preliminary partitioning of data just mentioned above would also enable the use of learning methods to generate a more robust scoring scheme. This is somehow challenged by the sparsity of data (Bojar and Lisacek, 2022). Another consequence of sparse data is illustrated by not handling the similarity of O-glycomes. With the same set-up and smaller datasets, preliminary results with O-glycans were obtained and reveal comparable trends. These observations emphasise the crucial need for more data. Larger datasets will level comparison and eliminate some, if not many, virtual nodes since it was established that the smaller the network, the higher the dependency to virtual node introduction. Nonetheless, the customisation of a glycan composition dataset remains key to analysing results of a glycoproteomics experiment. Compozitor was also designed with the concern of tailoring a composition list to feed an identification software. Exploring the similarity of glycomes is yet another way to investigate the consistency of a composition dataset.
5 Conclusion
The investigation of protein and tissue N-glycome content as represented in the GlyConnect database was proposed as a first step in assessing the worth and feasibility of automated comparison. The careful examination of similar protein N-glycomes considered not as a list of glycans but as a network of related compositions, led to identify strengths and weaknesses of the Compozitor software that builds the networks, in the context of similarity interpretation. The study was originally designed to provide a Compozitor user with the option of discovering how unique or common a glycome network is. This feature will be implemented in the future and should enhance the tailor-making of a composition dataset for glycopeptide identification. Furthermore, the screening of virtual nodes used to increase the connectivity of networks as well as the detection of dubious patterns in results of large-scale studies, reveals underlying information useful for improving network building and refinement. This is of course not limited to processing with Compozitor whose usage only exposes issues. As glycomes are usually compared manually in differential analysis, without generic tools the resulting work will remain in publications. Even manually, cross-comparison is challenging mostly because different sets of features are used from one study to the other. The lack of formal agreement on the selection of glycome properties hampers the development of tools to proceed faster and consistently. With this article, we have raised some key questions and their answers should ease automation in the long run.
Data availability statement
The original contributions presented in the study are included in the article/Supplementary Material, further inquiries can be directed to the corresponding author. “Current version” of both GlyConnect and Compozitor cited in the text are dated in 2022.
Author contributions
FS developed and implemented the methodology. JM supervised technical development. FL conceived and designed the study. FS and FL analysed the results and co-wrote the first draft of the manuscript. All authors contributed to the article and approved the submitted version.
Funding
GlyConnect and Compozitor are supported the Swiss Federal Government through the State Secretariat for Education, Research and Innovation (SERI) and have been developed with the contribution of the Swiss National Science Foundation (SNSF) (grant 31003A-179249). Open access funding by University of Geneva.
Acknowledgments
We thank Compozitor users for their helpful and insightful feedback on the software.
Conflict of interest
The authors declare that the research was conducted in the absence of any commercial or financial relationships that could be construed as a potential conflict of interest.
The author FL declared that they were an editorial board member of Frontiers, at the time of submission. This had no impact on the peer review process and the final decision.
Publisher’s note
All claims expressed in this article are solely those of the authors and do not necessarily represent those of their affiliated organizations, or those of the publisher, the editors and the reviewers. Any product that may be evaluated in this article, or claim that may be made by its manufacturer, is not guaranteed or endorsed by the publisher.
Supplementary material
The Supplementary Material for this article can be found online at: https://www.frontiersin.org/articles/10.3389/frans.2023.1073540/full#supplementary-material
References
Aebersold, R., Agar, J. N., Amster, I. J., Baker, M. S., Bertozzi, C. R., Boja, E. S., et al. How many human proteoforms are there? Nat. Chem. Biol. (2018) 14:206–214. doi:10.1038/nchembio.2576
Alagesan, K., Ahmed-Begrich, R., and Charpentier, E. Improved N- and O-glycopeptide identification using high-field asymmetric waveform ion mobility spectrometry (FAIMS). Biochemistry (2022) 2022:520086. doi:10.1101/2022.12.12.520086
Alocci, D., Mariethoz, J., Gastaldello, A., Gasteiger, E., Karlsson, N. G., Kolarich, D., et al. GlyConnect: Glycoproteomics goes visual, interactive, and analytical. J. Proteome Res. (2019) 18:664–677. doi:10.1021/acs.jproteome.8b00766
A. Varki, R. D. Cummings, J. D. Esko, P. Stanley, G. W. Hart, and M. Aebi editors. Essentials of glycobiology. Fourth edition. Suzhou, China: Cold Spring Harbor Laboratory Press (2022).
Bao, B., Kellman, B. P., Chiang, A. W. T., Zhang, Y., Sorrentino, J. T., York, A. K., et al. Correcting for sparsity and interdependence in glycomics by accounting for glycan biosynthesis. Nat. Commun. (2021) 12:4988. doi:10.1038/s41467-021-25183-5
Bojar, D., and Lisacek, F. Glycoinformatics in the artificial intelligence era. Chem. Rev. (2022) 122:15971–15988. doi:10.1021/acs.chemrev.2c00110
Boyaval, F., Dalebout, H., Van Zeijl, R., Wang, W., Fariña-Sarasqueta, A., Lageveen-Kammeijer, G. S. M., et al. High-mannose N-glycans as malignant progression markers in early-stage colorectal cancer. Cancers (2022) 14:1552. doi:10.3390/cancers14061552
Cao, W., Liu, M., Kong, S., Wu, M., Zhang, Y., and Yang, P. Recent advances in software tools for more generic and precise intact glycopeptide analysis. Mol. Cell. Proteomics (2021) 20:100060. doi:10.1074/mcp.R120.002090
Chatterjee, S., Kawahara, R., Tjondro, H. C., Shaw, D. R., Nenke, M. A., Torpy, D. J., et al. Serum N-glycomics stratifies bacteremic patients infected with different pathogens. J. Clin. Med. (2021) 10:516. doi:10.3390/jcm10030516
Chicco, D., and Jurman, G. The advantages of the Matthews correlation coefficient (MCC) over F1 score and accuracy in binary classification evaluation. BMC Genomics (2020) 21:6. doi:10.1186/s12864-019-6413-7
Cooper, C. A., Joshi, H. J., Harrison, M. J., Wilkins, M. R., and Packer, N. H. GlycoSuiteDB: A curated relational database of glycoprotein glycan structures and their biological sources 2003 update. Nucleic Acids Res. (2003) 31:511–513. doi:10.1093/nar/gkg099
Dotz, V., and Wuhrer, M. N-glycome signatures in human plasma: associations with physiology and major diseases. FEBS Letters (2019) 593(21):2966–2976. doi:10.1002/1873-3468.13598
Duvaud, S., Gabella, C., Lisacek, F., Stockinger, H., Ioannidis, V., and Durinx, C. Expasy, the Swiss bioinformatics resource portal, as designed by its users. Nucleic Acids Res. (2021) 49:W216–W227. doi:10.1093/nar/gkab225
Dworkin, L. A., Clausen, H., and Joshi, H. J. Applying transcriptomics to study glycosylation at the cell type level. iScience (2022) 25:104419. doi:10.1016/j.isci.2022.104419
Fujita, A., Aoki, N. P., Shinmachi, D., Matsubara, M., Tsuchiya, S., Shiota, M., et al. The international glycan repository GlyTouCan version 3.0. Nucleic Acids Res. (2020) 49:D1529–D1533. doi:10.1093/nar/gkaa947
Gudelj, I., Lauc, G., and Pezer, M. Immunoglobulin G glycosylation in aging and diseases. Cell. Immunol. (2018) 333:65–79. doi:10.1016/j.cellimm.2018.07.009
Hackett, W. E., and Zaia, J. The need for community standards to enable accurate comparison of glycoproteomics algorithm performance. Molecules (2021) 26:4757. doi:10.3390/molecules26164757
Kawahara, R., Chernykh, A., Alagesan, K., Bern, M., Cao, W., Chalkley, R. J., et al. Community evaluation of glycoproteomics informatics solutions reveals high-performance search strategies for serum glycopeptide analysis. Nat. Methods (2021) 18:1304–1316. doi:10.1038/s41592-021-01309-x
Loke, I., Kolarich, D., Packer, N. H., and Thaysen-Andersen, M. Emerging roles of protein mannosylation in inflammation and infection. Mol. Asp. Med. (2016) 51:31–55. doi:10.1016/j.mam.2016.04.004
Mariethoz, J., Alocci, D., Gastaldello, A., Horlacher, O., Gasteiger, E., Rojas-Macias, M., et al. Glycomics@ExPASy: Bridging the gap. Mol. Cell. Proteomics (2018) 17:2164–2176. doi:10.1074/mcp.RA118.000799
Mariethoz, J., Hayes, C., and Lisacek, F. Glycan compositions with compozitor to enhance glycopeptide identification. In: D. Cecconi, editor. Proteomics data analysis methods in molecular biology. New York, NY: Springer US (2021). p. 109–127. doi:10.1007/978-1-0716-1641-3_7
Neelamegham, S., Aoki-Kinoshita, K., Bolton, E., Frank, M., Lisacek, F., Lütteke, T., et al. Updates to the symbol nomenclature for glycans guidelines. Glycobiology (2019) 29:620–624. doi:10.1093/glycob/cwz045
Robin, T., Mariethoz, J., and Lisacek, F. Examining and fine-tuning the selection of glycan compositions with GlyConnect compozitor. Mol. Cell. Proteomics (2020) 19:1602–1618. doi:10.1074/mcp.RA120.002041
Keywords: glycan composition, glycome, web interface, glycoprotein, graph, similarity measure, data visualisation
Citation: Saba F, Mariethoz J and Lisacek F (2023) What is a consistent glycan composition dataset?. Front. Anal. Sci. 3:1073540. doi: 10.3389/frans.2023.1073540
Received: 18 October 2022; Accepted: 28 April 2023;
Published: 07 June 2023.
Edited by:
Noortje de Haan, University of Copenhagen, DenmarkReviewed by:
Yingwei Hu, Johns Hopkins University, United StatesThomas Stephen Klarić, Genos Ltd., Croatia
Copyright © 2023 Saba, Mariethoz and Lisacek. This is an open-access article distributed under the terms of the Creative Commons Attribution License (CC BY). The use, distribution or reproduction in other forums is permitted, provided the original author(s) and the copyright owner(s) are credited and that the original publication in this journal is cited, in accordance with accepted academic practice. No use, distribution or reproduction is permitted which does not comply with these terms.
*Correspondence: Frederique Lisacek, ZnJlZGVyaXF1ZS5saXNhY2VrQHNpYi5zd2lzcw==