
94% of researchers rate our articles as excellent or good
Learn more about the work of our research integrity team to safeguard the quality of each article we publish.
Find out more
REVIEW article
Front. Artif. Intell. , 08 April 2024
Sec. AI in Finance
Volume 7 - 2024 | https://doi.org/10.3389/frai.2024.1371502
 Kristina Sutiene1
 Peter Schwendner2*
 Ciprian Sipos3
 Luis Lorenzo4
 Miroslav Mirchev5,6
 Petre Lameski5
 Audrius Kabasinskas1
 Chemseddine Tidjani7
 Belma Ozturkkal8
 Jurgita Cerneviciene1
Building an investment portfolio is a problem that numerous researchers have addressed for many years. The key goal has always been to balance risk and reward by optimally allocating assets such as stocks, bonds, and cash. In general, the portfolio management process is based on three steps: planning, execution, and feedback, each of which has its objectives and methods to be employed. Starting from Markowitz's mean-variance portfolio theory, different frameworks have been widely accepted, which considerably renewed how asset allocation is being solved. Recent advances in artificial intelligence provide methodological and technological capabilities to solve highly complex problems, and investment portfolio is no exception. For this reason, the paper reviews the current state-of-the-art approaches by answering the core question of how artificial intelligence is transforming portfolio management steps. Moreover, as the use of artificial intelligence in finance is challenged by transparency, fairness and explainability requirements, the case study of post-hoc explanations for asset allocation is demonstrated. Finally, we discuss recent regulatory developments in the European investment business and highlight specific aspects of this business where explainable artificial intelligence could advance transparency of the investment process.
Portfolio management is a continuous process of creating portfolios based on an investor's preferred level of risk and reward and then adjusting it over time to maximize returns. This process includes three subsequent layers, namely planning, execution, and feedback (see Figure 1) (Baker and Filbeck, 2013). The first layer of the process is the planning layer. The asset owner—an institutional client like a pension fund or a wealth management client—mandates an asset manager to manage a specific portfolio according to an investment policy. The investment policy defines this mandate. It contains the client's needs, circumstances, and constraints to achieve a particular reward goal at a given risk level. Strategic asset allocation (SAA) is part of this investment policy. Typically, the SAA is defined as upper and lower boundaries for the asset class allocation. The risk tolerance and risk capacity also need to be defined. The second layer of the portfolio management process is the execution layer. The execution starts with determining the overall macroeconomic conditions across countries and asset classes, exploring the risk-and-return characteristics of asset classes. This analysis determines the capital allocation across countries and asset classes (“tactical asset allocation”). Security analysis enables the cross-sectional selection of single securities within each asset class to construct the overall portfolio and execute the necessary trades. Finally, after the portfolio experienced the market dynamics of an investment period, the feedback layer evaluates past performance, updates the market conditions, checks if the investment policy still holds or needs to be adjusted, and finally rebalances the portfolio (Bailey et al., 2007; Horn and Oehler, 2020).
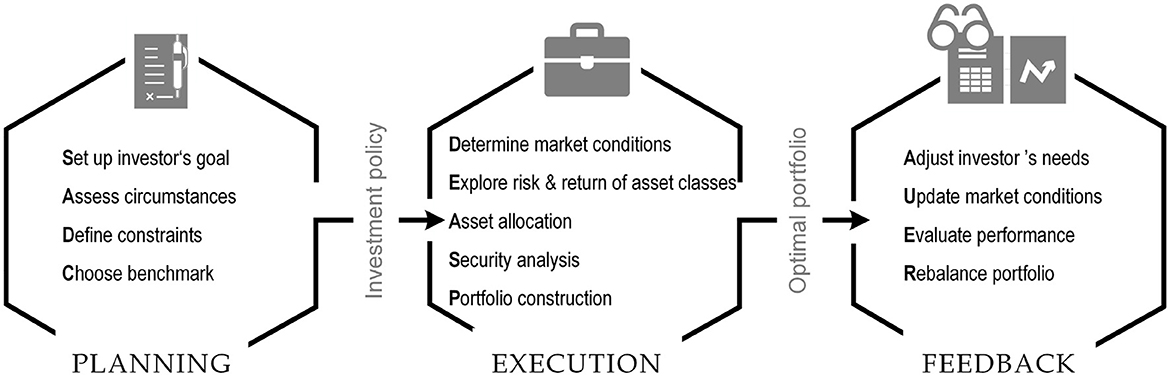
Figure 1. Portfolio management process.
Portfolio construction has been a significant task since 1952 when Markowitz introduced the mean-variance model. This model inspired many researchers, leading to numerous research papers proposing its extensions to overcome the shortcomings that neglected real-life problems. However, the continuously changing market environment, globalization, and integration of financial markets have generated new challenges in portfolio management, such as high systemic risk, spillover effect, contagion channels, and geopolitics risk.
In recent years, artificial intelligence (AI) has disrupted most industries, including the financial sector. AI techniques can contribute to portfolio management in many ways, improving the shortcomings of classical portfolio construction techniques and extending the opportunities to generate additional alpha. For instance, machine learning (ML) can create systems that learn from experience and be used for asset price prediction. Reinforcement learning (RL) is one of the most promising tools for developing a sequential and dynamic portfolio optimization theory. Text mining and sentiment analysis can enhance portfolio management with fresh news from the market. Dimensionality reduction methods can detect latent factors of a broad range of asset prices, which improves the construction of a well-diversified portfolio. Deep learning can optimize an investment portfolio directly or establish a portfolio that mimics an index with a small set of assets.
AI can produce better asset return and risk estimates and solve portfolio optimization problems under complex constraints, resulting in better out-of-sample AI-based portfolio performance than traditional approaches. From a technical point of view, the key players in the financial sector are embracing AI as a tool for automating and enhancing operational efficiency, processing vast amounts of data, improving risk management, and suggesting solutions that better suit investors' needs and accommodate risk. On the other hand, AI-based portfolio management often means that the decision is generated from a black-box model instead of mathematical equations trained on some database. This raises additional challenges in explaining and interpreting the decisions made by AI to earn the trust of various stakeholders, such as shareholders, investors, or portfolio managers.
The principal goal is to identify and evaluate published papers that propose AI-based methods for portfolio construction. To accomplish this, we focus on key considerations within this field, focusing on three main portfolio management steps (see Figure 1). The strengths and limitations of popular approaches used for portfolio construction are reviewed during the analysis, addressing these considerations. Moreover, to emphasize the need for transparency and fairness of decisions, laminable artificial intelligence (XAI) area approaches are briefly reviewed, and a case study of post-hoc explanations for portfolio construction is presented. Notably, the current review extends the most recent survey (Bartram et al., 2021) that focused on ML approaches and empirical results relevant to active portfolio management. In their paper, the authors considered using ML for signal generation, NLP applications, and several applications of reinforcement learning. Additionally, active AI-driven ETFs could be an excellent example of growing investor interest. However, the questions concerning portfolio optimization, portfolio evaluation and rebalancing, and post-hoc explainability of portfolio performance have not been addressed. Another review (Bartram et al., 2020) recently published by CFA mainly focuses on AI applications for asset classification and forecasting. Additionally, the use of NLP for automatic analysis of corporate annual reports, news articles and Twitter posts is presented. Examples of evolutionary algorithms and artificial neural networks are provided for portfolio optimization tasks, accommodating the flexibility to solve complex multi-objective asset allocation problems. Another example of a literature review (Nuzzo and Morone, 2017) outlined the main advances in using experimental techniques to study financial markets. Their work is not directly related to portfolio management but presents the relevant issues about information release and market structure, explores some stylized facts of the distribution of returns, and considers the role of market institutions in trading activity. Comparatively, the extensions of a mean-variance framework have long been an area of particular interest to many researchers, based on which some reviews (Elton and Gruber, 1997; Steinbach, 2001) have been published.
Hally, we could distinguish some famous frameworks and theories that remarkably impacted the way of thinking and modeling how to construct an investment portfolio and initiated the literature strands accordingly (see Figure 2).
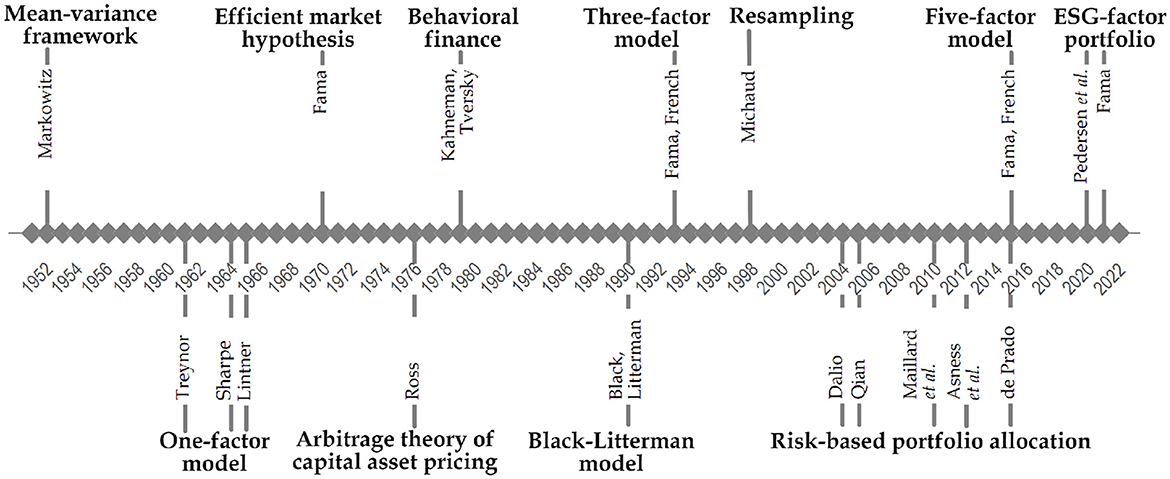
Figure 2. Advancements in investment portfolio management.
Markowitz (1952, 1959) marks the birth of modern portfolio theory (MPT) by introducing the mean-variance efficient frontier framework. As the name suggests, the mean and variance have been employed to measure a portfolio's expected return and risk. The main message was that the investments should not be selected by combining multiple individual securities with preferable risk and return characteristics but by determining how they contribute to the overall portfolio. The efficient frontier concept was formulated based on two distributional measures, namely mean and variance, from which the investor could choose the preferred asset allocation. Notably, the derivation of the mean-variance framework was based on several essential assumptions (Elton and Gruber, 1997; Wilford, 2012). Despite criticism, the mean-variance theory remains crucial. Like other breakthroughs, it has been extended in various directions.
Inspired by Markowitz work, Treynor (1962), Sharpe (1964), and Lintner (1965) independently introduced a factor model, named as Capital Asset Pricing Model (CAPM). Specifically, CAPM is the instance of the one-factor model, which describes the relation between systematic risk and expected returns. Technically, CAPM decomposes an asset's return into factors common to all assets and factors specific to a particular asset. However, one factor is not enough to quantify risk and returns adequately. This resulted in so-called multi-factor models generalized by Ross (1976); Roll and Ross (1980), known as Arbitrage Pricing Theory (APT). The primary difference between CAPM and APT is how a systematic investment risk is defined. CAPM includes a single, market-wide risk factor, while APT advocates several factors which capture market-wide risks.
The efficient market hypothesis (EMH) is one of the milestones in the MPT development (Vamvakaris et al., 2017). Its roots go back to the period of 1963–1965, with the appearance of some works published by Fama (1963), Fama (1965), and Samuelson (1965). According to the Delce (2019) and Lo (2017b), Fama suggested the concept of an efficient market known for its best formulation: “A market in which prices always fully reflect available information is called efficient” (Fama, 1970). Comparatively, Samuelson's contribution to the development of EMH is less well-known, but his role is no less important as he provided a solid theoretical basis for this hypothesis. Since then, many studies have been published on examining whether the EMH is valid in different markets, for example, stock market (Lee et al., 2010; Sánchez-Granero et al., 2020), energy market (Lee and Lee, 2009; Liu et al., 2020), currency market (Potı̀ et al., 2020). The idea behind testing EMH is to measure whether a random market walk is related to price predictability. For this purpose, different kinds of tests for market efficiency have been proposed addressing the concept of random walk (Frunza, 2016). However, there exists enough evidence to infer that the existence of an efficient market seems to be a utopia in practice. Instead, it is more realistic to anticipate relative efficiency, identifying periods with varying degrees of efficiency influenced by changing market conditions over time (Campbell et al., 1998; Kim et al., 2011; Alvarez-Ramirez et al., 2012).
The main alternative to CAPM is the three-factor model (Fama and French, 1993), which become widely used by academics and practitioners. This model included two additional factors, proxy size and value, for estimating cross-sectional equity returns. Two decades later, this model has been extended to the five-factor model (Fama and French, 2015), which includes profitability and investment of the firm in addition to market factor, firm size and value, aiming to describe better the variation in equity prices that the three-factor model does not capture. Over a considerable time, these models have been extensively tested empirically by numerous studies aiming to adequately price the equity returns in both developed and emerging markets (Kubota and Takehara, 2018; Lalwani and Chakraborty, 2019; Mosoeu and Kodongo, 2020). The evidence shows, for example, (Mohanty, 2019), that each market is unique in its composition and trend even over a long time horizon, and hence, a generalized asset pricing model cannot be adopted across all the markets.
The other stream entails the problems arising from the assumptions of “homo economicus”. The field of behavioral finance occurred in the late 1970s as a response to emerging failures of the core pricing models to explain anomalies in financial markets (Kahneman and Tversky, 1979; Kumar, 2016). Behavioral finance indicates that when making decisions like investing, people are not nearly as rational as traditional finance theory assumes. Similarly, Shiller (2003) provides an insight into the changes in the approaches and focuses on the weaknesses of the efficient market hypothesis, trying to explain the financial markets better by understanding and incorporating the inefficiencies and biases in the models. Later, Thaler (1999) extends the idea of behavioral finance of incorporating psychological components to be included in all financial models in the future, as otherwise would be irrational. Lo (2004) and Lo (2017a) suggest that behavioral aspects in the portfolio decision-making process align with an evolutionary model with a perspective of adaptation, and this new approach combining economy and psychology is called the “Adaptive Market Hypothesis”.
In the past decade, there has been a surge in work exploring AI applications across various domains, including investment portfolio management. However, there is no widely acknowledged what could have been the first attempts of AI employment for asset allocation tasks. Considering the current taxonomy of AI approaches, for example, (Schmid et al., 2021), we believe that the Black-Litterman model (Black and Litterman, 1991) could be a potential candidate. In particular, their model suggests a framework for combining market equilibrium information with subjective investors' views by exploiting a Bayesian methodology. The computational evidence shows that the Black-Litterman model produces more stable and better-diversified portfolios than those constructed under Markowitz framework (Rebonato and Denev, 2014).
An alternative to address estimation uncertainty parametrically is Monte Carlo resampling (Michaud, 1998), a procedure to determine portfolio weights as average weights from MPT results derived from bootstrapped market returns. In institutional active portfolio management, leveraged risk-based multi-asset allocations without return estimations are popular, namely Risk Parity (Qian, 2005; López de Prado, 2016; Dalio, 2004), Equal Risk Contribution (Maillard et al., 2010), and inverse-volatility weighting (Asness et al., 2012). A significant milestone is the Hierarchical Risk Parity (HRP) approach (López de Prado, 2016) aimed to improve the robustness of Risk Parity schemes in markets with fluctuating covariances. In the first step, HRP sorts markets via a single-linkage clustering procedure. In the second step, market weights are allocated using a bisection of the covariance matrix.
Environmental, social and governance (ESG) factors and socially responsible investments (SRI) examine how conscious the companies invested are in these areas. Another angle of portfolio optimization in recent years is ESG and SRI evaluation. They become more critical and create a new perspective for investors as the maximization of shareholder value is changing to the maximization of welfare (Fama, 2021). For example, a recent paper Pedersen et al. (2020) designed an ESG-efficient frontier with the highest Sharpe ratio for the ESG-adjusted CAPM, where the choice may lead to a positive, negative or neutral outcome.
AI techniques can be considered decision tools with a straightforward application to the different stages of portfolio execution (see Figure 3). The ability to describe underlying market structures, process vast amounts of structural and non-structural information, or capture the non-linearity between different variables makes AI a key role in handling market complexity. AI tools guide the portfolio manager through the entire process, from visualizing the market to identifying assets, constructing the portfolio, executing trades, and interpreting results. This contributes toward achieving trust in AI-driven portfolio management systems. This section introduces AI techniques beneficial for various subtasks in portfolio management, contributing to trust in AI-driven systems.
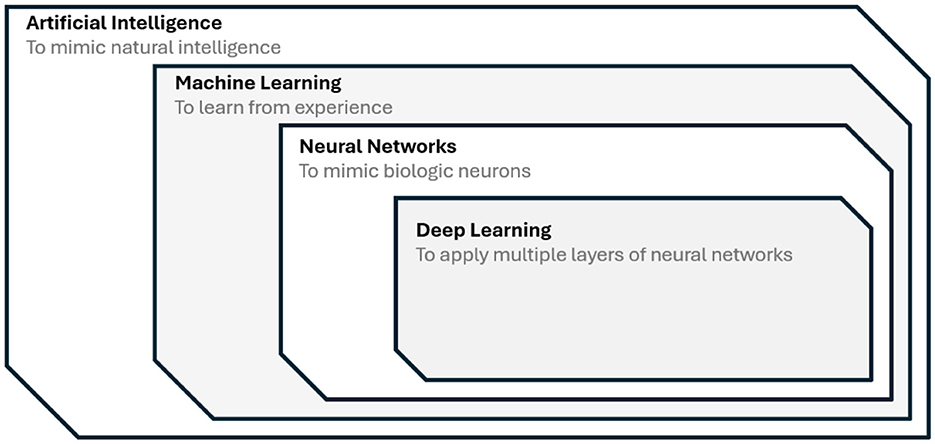
Figure 3. AI, ML, NN, and DL relationship diagram.
Two conventional dimensionality reduction techniques that help the portfolio manager tackle the market complexity are Principal Component Regression (PCR) and Partial Least Square (PLS), regression-based procedures designed to forecast time series parsimoniously. The first is a two-step procedure that involves constructing the principal components using Principal Components Analysis (PCA) and then using these components as the predictors explaining most of the variance in a linear regression model. The first principal component can be taken as a proxy of the market factor. The study in Stock and Watson (2002) provides a notable example of simplifying a high-dimensional forecasting problem with numerous predictors by modeling time series variability using a small number of latent factors. Feasible forecasts are asymptotically efficient, and, more importantly, the estimated factors remain consistent, even in the presence of time variation in the factor model. The link between portfolio optimization models and PCA is straightforward, as explained in Meucci (2009); Partovi and Caputo (2004). The more natural choice of uncorrelated risk for a portfolio is by a PCA decomposition of the return covariance Σ, i.e.,
where the diagonal matrix Λ ≡ diag(λ1, ..., λN) contains the eigenvalues of Σ, sorted in decreasing order. In this way, the complexity of portfolio selection is reduced if there are no correlations among the assets.
Comparatively, PLS regression reduces dimensionality by incorporating the forecasting objective or response. The linear combinations maximize the covariance between the target variable and each standard component obtained from the predictors (Groen and Kapetanios, 2016). Kelly and Pruitt (2013) is one of the first attempts to apply PLS regression to finance. In Kelly and Pruitt (2015), the three-pass regression filter (3PRF) was proposed, which has been proven to be consistent for the infeasible best forecast when both the time dimension and cross-section dimension become large. Unlike PLS, the 3PRF enables the selection of additional disciplining variables based on economic theory.
PCR and PLS are techniques that merge the set of predictors from dimension D to a much smaller number of L linear combinations. Comparatively, Ridge, LASSO and Elastic net methods focus more on shrinkage, moving the model coefficients to zero. Ridge penalizes the square sum of coefficients called l2, reducing the variance compared with Ordinary Least Square (OLS). LASSO regularization penalizes the absolute sum of coefficients called l1 shrunk toward zero, achieving a selection of the predictors, which outperforms OLS as well (Messmer and Audrino, 2020). Elastic net includes a regularization that combines l1 and l2, handling the weight of each by a hyper-parameter. Specifically, LASSO, a form of regularized regression, combines variable selection and regularization to improve prediction accuracy. It automatically selects the most predictive input factors from a set (Feng et al., 2017; Freyberger et al., 2018), enabling the exploration of lead-lag relationships between asset groups. This approach is crucial in determining influential predictors, such as industry or market output, preventing overfitting, and controlling model complexity in machine learning methods (Li, 2015; Gu et al., 2020).
Table 1 gives good examples of selecting significant predictors.
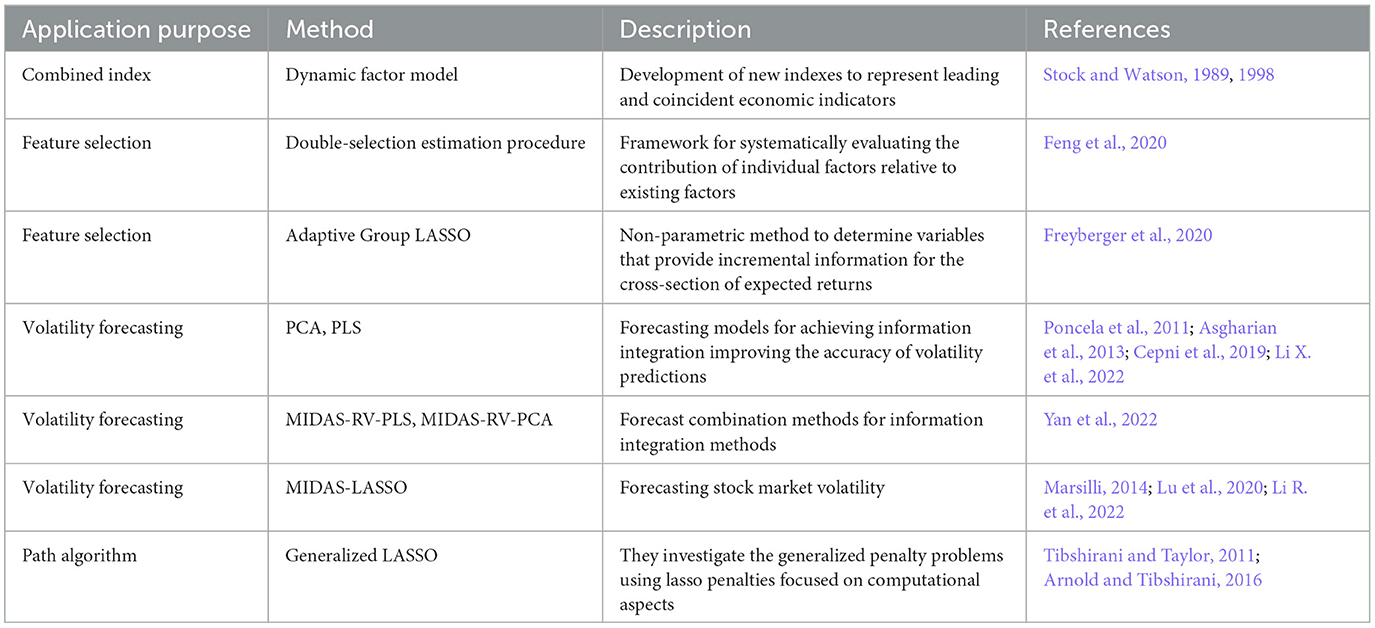
Table 1. Forecasting with a high number of potential predictors.
Time series forecasting is important in any portfolio management task. AI algorithms have performed significantly better than traditional methods, especially in recent years with the introduction of deep learning methods. For example, one algorithm that could be considered traditional for this matter is Autoregressive Integrated Moving Average (ARIMA), which has already been outperformed by a large margin by LSTM (Siami-Namini et al., 2018). Other approaches used for forecasting that give state-of-the-art results are Gated Recurrent Unit (GRU) (Sadon et al., 2021), Seq2Seq (Mootha et al., 2020; Dash et al., 2023) combined with other deep learning approaches such as LSTM. Other deep learning-based forecasting methods have also prevailed in recent literature. One example is Generative Adversarial Networks combined with Gramian Angular Fields (Ghasemieh and Kashef, 2023). Convolutional Neural Networks (CNNs), traditionally employed for images and videos, find application in forecasting financial time series data (Kirisci and Cagcag Yolcu, 2022). They demonstrate superior performance compared to older, non-neural network-based methods. Deep learning-based methods for time series forecasting are prevalent in the literature and will continue to give state-of-the-art results in the foreseeable future.
The multitude of market constituents and their interrelationships, coupled with specific structures, motivate the application of unsupervised machine learning techniques. These methods reveal underlying structures, simplify visualization, and introduce a form of ordering in the market space. While traditional market representation often relies on the risk-return relation for different asset classes, data-mining techniques, including complex information filtering, clustering, and graph theory supported by various machine learning methods, offer new approaches for diversification.
In the classical Mean-Variance approach to portfolio allocation, the optimal portfolio seeks to minimize the variance (σP) while maintaining a specified portfolio return. Reliable empirical determination of a correlation matrix becomes challenging for financial markets when T < N or T approaches N, where the correlation matrix can become ill-conditioned and random to a large extent. As a result, the out-of-sample risk of an optimized portfolio exceeds the in-sample risk. Random Matrix Theory (RMT) (Mantegna and Stanley, 1999; Bouchaud and Potters, 2003; Kwapień and Drożdż, 2012) is a mathematical tool that allows us to analyze the dispersion of correlation matrix when applied to the financial market. The objective is to mitigate bias in future risk estimates (Potters et al., 2005) by simplifying the large correlation matrices (Bun et al., 2017). This is achieved by extracting the systematic part of a signal hidden in the correlation data. Giudici et al. (2022) extended the application of RMT, a minimum spanning tree (MST), and portfolio optimization techniques to ETF markets, assisted by robot advisors as a FinTech innovation.
Cluster analysis, a well-established unsupervised classification method, has proven valuable across various fields, including finance. It aids in visually positioning assets by revealing underlying similarities. From a different perspective, clustering simplifies markets by reducing dimensionality and complexity, facilitating portfolio optimization. Two main clustering algorithms are hierarchical and partitional, with hierarchical identifying nested clusters and partitional finding clusters simultaneously. However, a common challenge lies in the need for cluster validation and the lack of cluster stability (Tan et al., 2005).
The grouping methods used in the partitional clustering process are the classical K-means and the PAM (Partitioning Around Medoids) algorithm, which picks one stock from each cluster with the highest Sharpe ratio. Duarte and De Castro (2020) segment the assets into clusters of correlated assets, allocate resources for each cluster and then within each cluster by different partitional clustering algorithms (K-medoids PAM and Fuzzy clustering). Khedmati and Azin (2020) include K-means and K-medoids but also spectral and hierarchical clustering considering transaction costs for different data sets. Soleymani and Vasighi (2020) addresses a large portfolio dataset to find the most and least riskiest K-means clusters of stocks based on VaR and CVaR measures and working only on financial returns. In unsupervised learning, specifically within partitional clustering and using diverse time-series representations, a significant research direction involves applying fuzzy clustering to economic time series. For instance, D'Urso et al. (2013) and D'Urso et al. (2016) utilized a model-based approach with various fuzzy cluster variations and different distance metrics in financial markets. As an alternative to ultrametric spaces clustering methods, the Self-Organized Map (SOM) method was employed to cluster DJIA and NASDAQ100 portfolios, focusing on non-linear correlations between stocks (Zherebtsov and Kuperin, 2003). The authors concluded that the SOM method is more relevant and promising for clustering large, ill-structured databases requiring nonlinear processing.
The correlation matrix of financial time series can be used to arise hierarchical tree structures, taking the correlations ρij as similarity measurement. The correlation-based clustering represented by network graphs allows for easy market visualization. On the standard methodology to build trees, for each pair i, j of assets, the distance d
is computed, where ρij describes the correlation between log-return time-series. Having di, j, we can compute MST or, equivalently, the Single Linkage Clustering Algorithms (SLCA) by using, for instance, Kruskal's algorithm. Such clustering analysis for portfolio optimization was explored by Tola et al. (2008). Marti et al. (2017) provides an in-depth overview of the state-of-the-art hierarchical clustering of financial time series. The hierarchical tree structure corresponds to diversification aspects in portfolio optimization models, where assets in the classic Markowitz portfolio are consistently located on the outer leaves of the tree (Onnela et al., 2002).
Network representation of complex financial markets offers a profound understanding of the underlying processes in the economic system, enhancing the information available to decision-makers. Analyzing stock market dynamics through network analysis can yield valuable insights and sound indicators for portfolio management (Battiston et al., 2016; Niu et al., 2021). The pioneering work on representing stocks as networks was published by Mantegna R (1999) where an MST was constructed based on the correlation among the stock prices for the DJIA and S&P 500 indices. Subsequent studies by the same group, summarized in Bonanno et al. (2004), extended MST applications to various stock markets and indices, exploring correlations with different time horizons. The concept of MST was further developed into dynamic MSTs in Onnela et al. (2002, 2003), revealing a scale-free property. During market crises, two network properties, normalized tree length and mean occupation layer from a central node (highest degree), decreased, indicating increased centralization. Additionally, stocks in optimal portfolios with minimal risks, as per the Markowitz model, tended to be in the network periphery, suggesting using network peripherality as an optimality indicator.
An alternative filtering approach for creating correlation-based Planar Maximally Filtered Graph (PMFG) was introduced in Tumminello et al. (2005), which produced graphs with a richer structure than MST, and further studied in Tumminello et al. (2006). The Directed Bubble Hierarchical Tree (DBHT) approach (Song et al., 2012) was explored in financial markets in Nicolo Musmeci and Tomaso (2014) and compared with MST and PMFG. Lower risk and better returns for more peripheral portfolios were demonstrated in Pozzi et al. (2013) using both MSTs and PMFG. This conclusion was reaffirmed more systematically in Peralta and Zareei (2016), introducing a ρ-based strategy for portfolio management that balances between the systematic (centrality) and individual properties of assets, confirming the performance of diversified portfolios with more considerable network distances. In Ren et al. (2017), peripheral portfolios perform better in stable periods with a drawdown in the investment horizon. In contrast, centrality-based portfolios are better for situations with a drawup in the selection horizon.
A particular case of applications is using network science and machine learning to build an HRP model (López de Prado, 2016). HRP models, part of the hierarchical approach, demonstrate robust out-of-sample properties without requiring a positive-definite return covariance matrix—a notable weakness in mean-variance-based portfolios. Different variants of this approach are proposed by Alipour et al. (2016); Raffinot (2017) improving the original HRP. Conceptually, HRP computes inverse-variance weights for groups of similar assets using an iterative process involving a correlation matrix. Additional steps include quasi-diagonalization, a rearrangement of the covariance matrix, and recursive bisection.
Recent stock market data analyses have employed Graph Neural Networks (GNN), enabling time-series data to be processed in a networked form within a deep learning pipeline. In Pacreau et al. (2021), portfolio management is formulated as a supervised learning problem using a multi-relational graph representation with sector, correlation, and supply-chain information. The authors employ various graph neural network architectures to solve this problem. A general framework for combinatorial optimization using graph neural networks is presented in Schuetz et al. (2022), which discusses its application to portfolio management. In works like Matsunaga et al. (2019); Chen Y. et al. (2018), graph neural networks are employed to incorporate companies' relationship data for stock price prediction, contributing to more informed decisions in portfolio management.
Additional applications for different purposes within this topic are described in Table 2.

Table 2. Applications of correlations, clustering, and network analysis.
Asset allocation strategy involves forecasting risk-and-return characteristics for different asset classes or risk premiums. It includes determining the allocation percentages for each asset class in the portfolio. ML techniques offer a more efficient means for portfolio managers to handle expected values based on various forecasting models for risk and returns, considering for each case different risk measurements that distinguish downside from upside risk (Kuan et al., 2009; Harris et al., 2019; Liu and Wang, 2021; Mariani et al., 2022). The predictive models should be adapted depending on the target group of assets, considering traditional stocks, bonds or alternative investments (Fu et al., 2018). At this point, we mention the controversy in the literature about the evidence that there are real out-of-sample benefits to investors when relay on predictive models (Welch and Goyal, 2007; Johannes et al., 2014).
ML methods, with their high-dimensional nature, encompass diverse techniques, from traditional statistical learning methods like Gradient-Boosted Trees and Random Forest (RF) to the latest and popular algorithms such as Deep Learning (DL) or Deep Neural Networks (DNN). These methods use learning algorithms to identify the best-performing assets based on profitability and risk for a specific period. The goal of all of these methods is to approximate best the conditional expectation , where ri, t+1 is an asset's return over the risk-free, and is the actual and observable information set of market participants. Portfolio efficiency, gauged in profitability, is enhanced when assets are preselected based on return predictability, with the prominent application of ML techniques (Ballings et al., 2015; Kaczmarek and Perez, 2021). The most promising ML applications focus on finding predictive signals among the noise and capturing the alphas (Mirete-Ferrer et al., 2022). So, the goal is to achieve good indicators proven to detect successful companies in terms of stock-level signals combining different scores. In this way, the high amount of potentially good factors as signal makes ML effective for various reasons:
• ML is specially designed for forecasting purposes;
• It can cope with a large number of predictors and overcome the high dimensionality of the problem by combining many weak sources of information;
• Detection of nonlinear and complex relations and specially designed to mitigate overfitting;
• High sensitivity to low signal-to-noise ratios on the data;
• Avoiding crowded trades for highly correlated signals on different investors.
Deep Learning or deep neural networks algorithms refer to models represented in Figure 4 that consist of L layers or stages of nonlinear information. Each hidden layer takes the output from the previous layers and transforms it into an output as follows using the standard terminology stated in Lee et al. (2017); Hayou et al. (2019) for a fully connected random neural network of depth L, widths (Nl)1 ≤ l ≤ L, weights . For some input a ∈ ℝd, the propagation of this input through the network is given for an activation function ϕ:ℝ → ℝ:
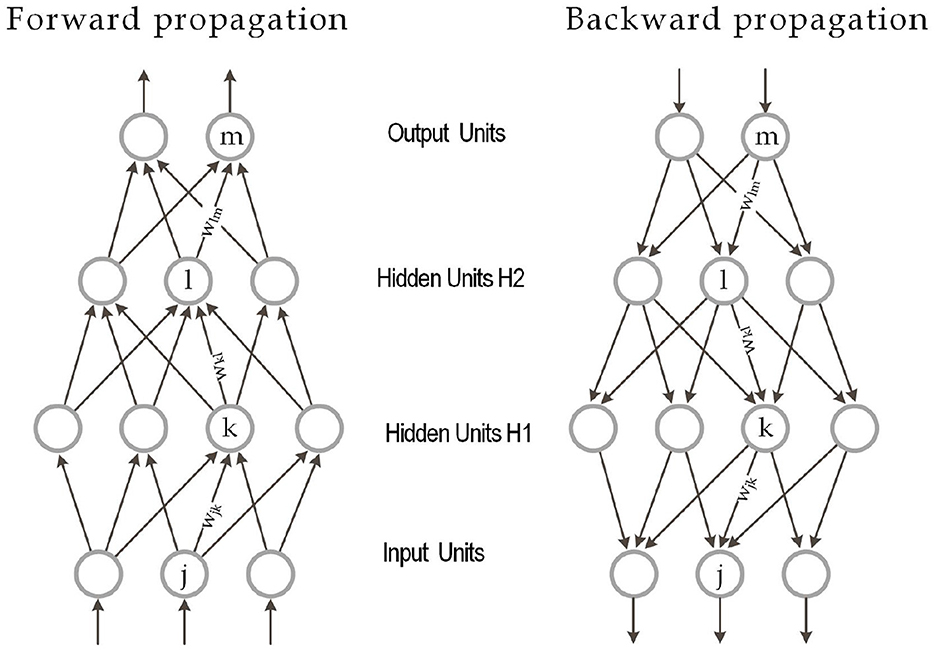
Figure 4. Multilayer neural network with forward and backpropagation and two hidden layers. Source: LeCun et al. (2015).
Indeed, an activation function ϕ decides whether a neuron should be activated and whether the input is important. Typically ϕ takes the rectified linear form Φ(x) = ReLU(xk) = max(xk, 0).
The more common activation functions besides ReLU are the following:
and they have shown their utility in complex non-linear associations and, more generally, in selection problems.
These algorithms have demonstrated the potential to improve the implementation of different portfolio management strategies (Heaton et al., 2016; Grace, 2017) mapping data into the value of returns outperforming very different benchmark index, we can see an excellent example in Huang (2022) applying which is called Multitask Learning (MTL) for value extraction of hundreds of accounting terms in financial statement. The family of DL algorithms applied for portfolio construction is broad (Emerson et al., 2019; Ozbayoglu et al., 2020), and they are used in different stages of portfolio management.
We anticipate that Deep Learning, Reinforcement Learning, and Deep Reinforcement Learning applications in portfolio optimization will be specifically treated when we explain optimal portfolio construction techniques.
Random Forest (RF) is an ensemble ML algorithm introduced by Breiman (2001), employing a majority vote across individual decision tree learners. These non-metric models make no assumptions about data distribution and have fewer parameters to optimize compared to many other ML models. RF effectively handles complex signals like excess returns or risk premia, providing a good variance-bias trade-off and being reported as highly accurate learning algorithms. Additionally, RF models mitigate the impact of noise and changing relationships in past data between predictors and target variables, such as excess returns. Another popular approach is Gradient Boosting Trees (GBT), which builds trees sequentially, with each new tree aiming to correct the errors of the combined ensemble of the previous trees. GBT is typically applied to construct portfolios by leveraging their ability to predict asset returns and optimizing the portfolio based on those predictions. More examples of ML used for portfolio construction are displayed in Table 3.
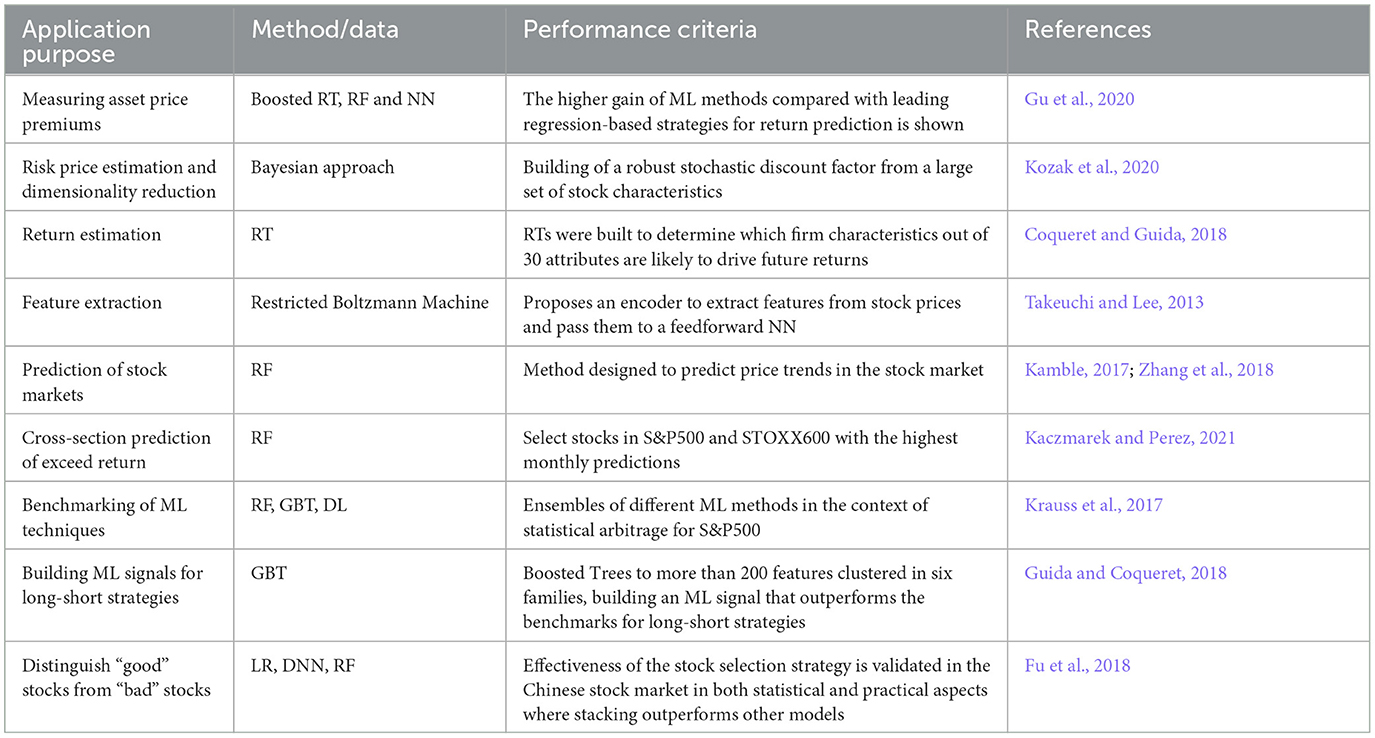
Table 3. Picking attractive securities.
Natural Language Processing (NLP) coupled with Sentiment Analysis (SA) can assess the polarity of market signals in textual content from social media platforms—indicating whether sentiment is positive, negative, or neutral. Sentiment is used qualitatively and quantitatively to reflect opinions, attitudes, moods, or emotions toward securities, assets, companies, or the market. Some studies leverage existing sentiment indicators, while others calculate sentiment indexes. Data sources for sentiment analysis include news channels and social media, and approaches range from text representation methods to artificial intelligence classifiers (Mishev et al., 2020).
Microblogging services, like StockTwits, have become popular as investor-based social networks where users share investment opinions through microblogs. Evidence suggests that these opinions influence stock price movements, contributing to collective market sentiment. Additional sentiment analysis data sources include StockFluence sentiment data, aggregating opinions from various media channels, and Glassdoor, offering business outlook ratings from employee reviews. Twitter and Google are commonly used sentiment analysis data sources, with alternatives including sentiments extracted from Intrinio, Thompson Reuters, and Bloomberg news articles.
Another strand of literature covers the use of cutting-edge NLP approaches to process and distill the public mood, which may include polarity detection, micro text analysis, aspect extraction or sarcasm detection in different levels of granularity like entity level, sentence, document or context. In general, NLP-based sentiment analysis methods could be divided into two categories. First, NLP combined with traditional machine learning like SVM (Long et al., 2019), LightGBM (Wu et al., 2020), XGBoost and RF (Jourovski et al., 2020; Petropoulos and Siakoulis, 2021). Evidence supports that financial news or social media information can provide an additional advantage in predicting price or market turbulence trends. This approach often entails constructing numerous features before inputting them into the ML model. Alternatively, some studies explore DL techniques, which can automatically extract features from news or social media. For instance, a self-regulated generative adversarial network was proposed to enhance generalization and overcome stochasticity in predicting stock movements based on financial news and historical price data (Xu et al., 2022). Comparatively, a hybrid data analytics framework, integrating CNN and bidirectional LSTM, was created to predict stock trends by estimating the impact of news events and sentiment trends converging with historical financial data. Unlike other studies, LSTM was trained to automatically generate an asset allocation strategy using historical lagged data and public mood (Malandri et al., 2018). Similarly, in Xing et al. (2018), sentiment information is mapped to market views using a neural network design based on an ensemble of evolving clustering and LSTM. These views are integrated into modern portfolio theory through a Bayesian approach, and the portfolio's performance is analyzed for aspects like portfolio stability, sentiment time series computation, and profitability in simulations.
Financial sentiment analysis faces challenges due to specialized language and a lack of labeled data. The advent of ULMFit (Howard and Ruder, 2018) has facilitated effective transfer learning in NLP. For example, Feinberg (Bidirectional Encoder Representations from Transformers for financial data) is a pre-trained NLP model designed explicitly for sentiment analysis in financial text (Araci, 2019). Comparatively, Zhao et al. (2020) proposed a RoBERTa as a pre-trained model, which exploits different fine-tuning methods for sentiment analysis and critical entity detection in online financial texts. SEntFiN 1.0 is the most recent publicly available example of a human-annotated dataset of news headlines containing multiple entities (Sinha et al., 2022). The authors concluded that deep bidirectional pre-trained language models such as domain-specific BERT fine-tuned to SEntFiN outperform state-of-the-art learning schemes significantly.
Table 4 provides examples of papers focusing on sentiment signal generation for asset allocation.
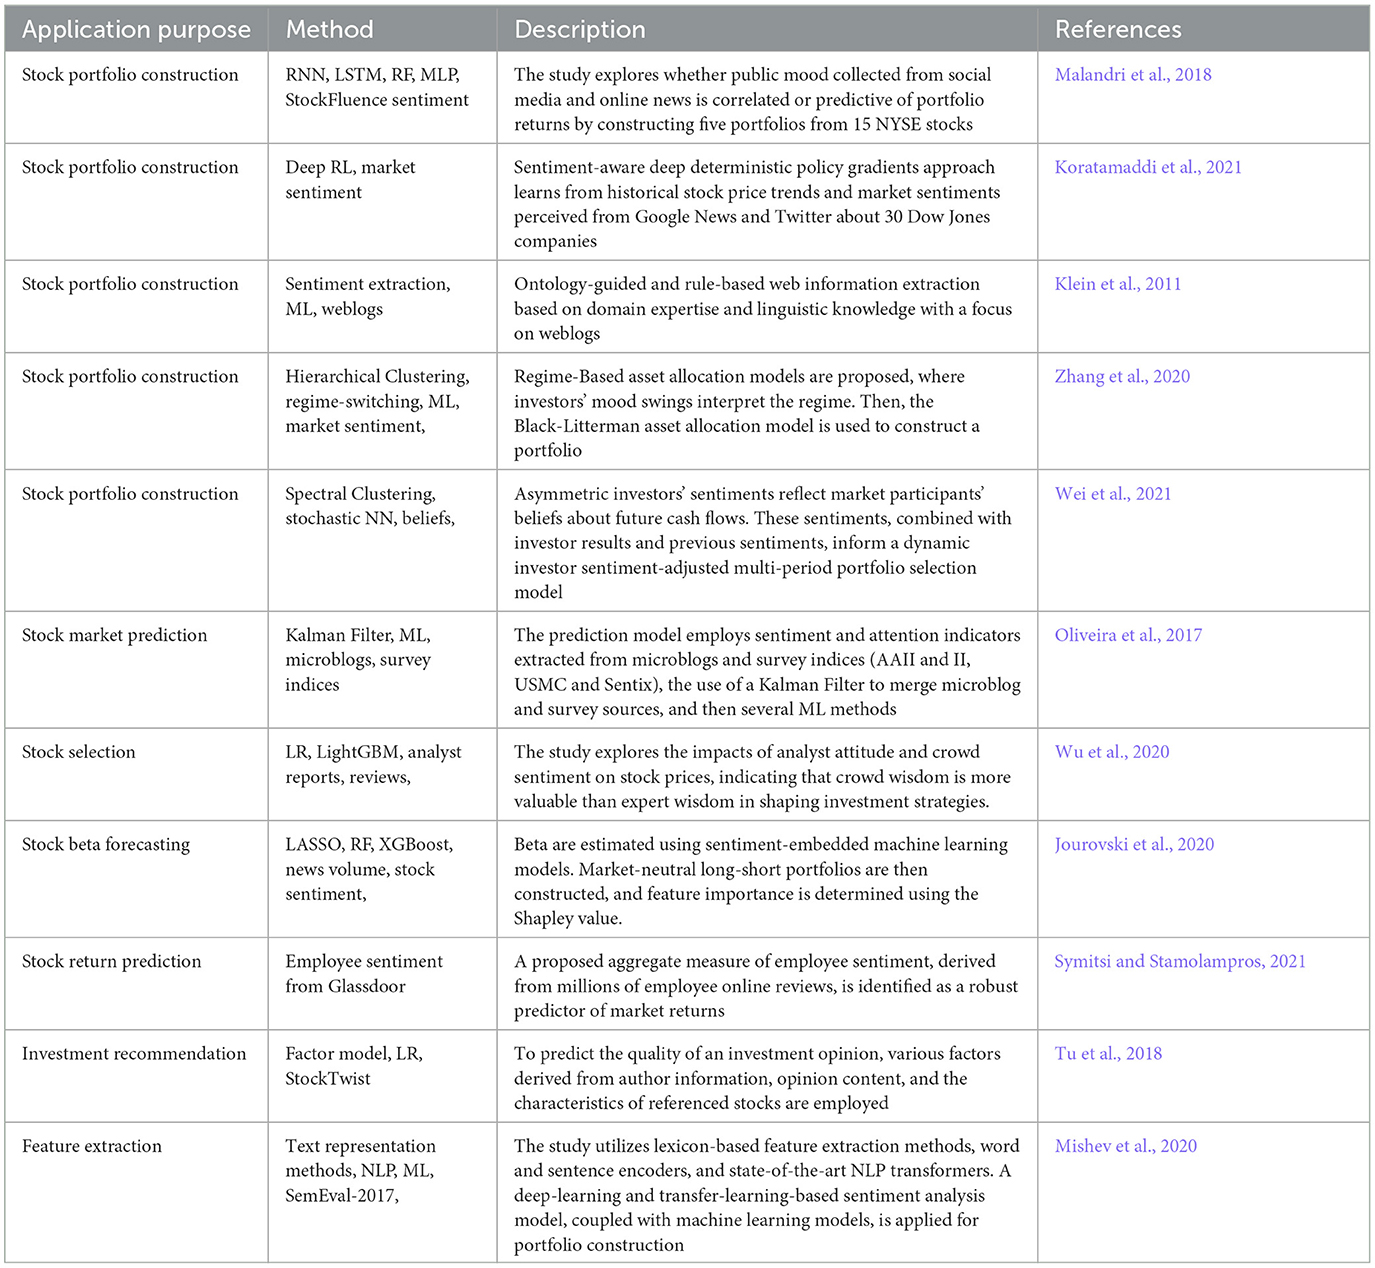
Table 4. The use of sentiment signals for asset allocation.
In classical economic theory, economists explore models with market frictions, where price competition may be dampened, leading to potential unemployment of resources. AI holds significant potential to enhance efficiency by reducing search frictions (Milgrom and Tadelis, 2018). AI aids in understanding market environments, identifying patterns that enhance customer experience, and improving forecasting to promote more efficient market operations. Indeed, determining evolving market conditions is mainly linked to capturing market inefficiencies to identify future performance. This is where the usefulness of the application of AI arises. Many studies demonstrate the superiority of AI over traditional ones. However, the question is how the massive use of information-based systems, for instance, supported by cloud services, can change the price discovery process. Unequal access to AI technology among financial actors may lead to smaller providers' limited participation, posing a concentration risk among more prominent players (Duan et al., 2019).
AI, particularly in High-Frequency Trading (HFT), generally introduces greater complexity to conventional algorithmic trading, notably in highly automated markets such as equities and FX. AI and HFT contribute to enhanced liquidity provision and enable the execution of large orders with low market impact. From a risk perspective, AI allows order flow management, reducing inefficiencies. HFT serves as a significant source of liquidity, so any disruption in their operation results in liquidity being pulled out, especially when AI techniques are widely deployed. At this point, we have to distinguish two significant impacts of the massive application of AI on the financial markets that result in two sides of the same coin. First, AI impacts information efficiency by reducing the marginal cost of information acquisition and processing for portfolio managers. Second, the question is how AI is going to replace human decision, as the machines process much more information faster, making the markets more efficient (Barbopoulos et al., 2021), but at the same time with a higher risk of market manipulation by using spoofing schemes as 2010 Flash Crash (U.S. Department of Justice Office of Public Affairs, 2015) being a source of non-financial risk.
In particular, analyzing the interrelation between AI and market conditions and how this relation changes sophisticated investors' behavior has just begun (Chen Y. et al., 2020). Regarding the first point, consider the quarterly annual reports for the Russell 3000 Index, which includes around 3000 of the largest U.S. companies, resulting in ~12,000 documents in a fiscal year. Managing such a vast amount of information is challenging for humans. An important distinction between humans and machines is that humans tend to pay more attention to large and value firms, whereas AI accesses information more uniformly (Barbopoulos et al., 2021). The studies on the interaction between information and potential impacts on market efficiency have to rely on accurate metrics. For instance, the Security and Exchange Commission's (SEC) Electronic Data Gathering and Retrieval (EDGAR) website allows researchers to measure with automatic algorithms how the stock market responds at the time of earning announcements. All internet search traffic of the EDGAR system is accessible to researchers, including the user's IP addresses and the user requesting the information. The impact of our trading decisions on the market and queries made through the SEC exchange requesting information from companies is observable. Table 5 provides the examples of paper, where the interrelation between AI and market efficiency was analyzed.
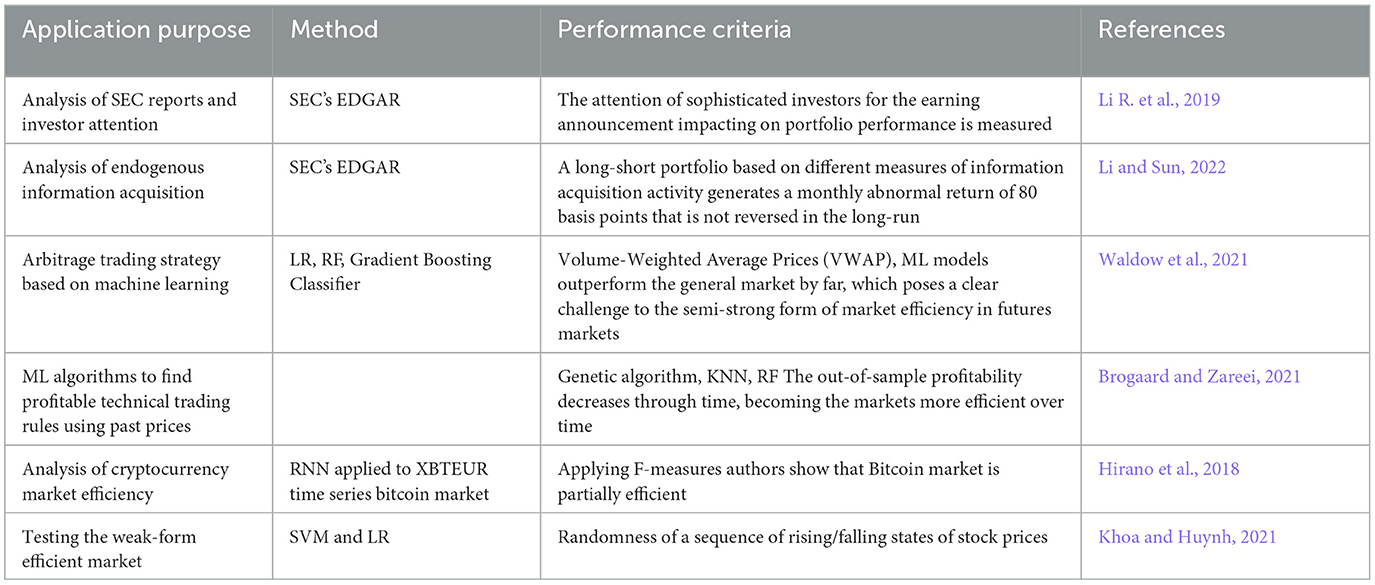
Table 5. Interrelation between AI and market efficiency.
Modern portfolio theory initially considered mean and variance as the sole criteria for portfolio selection. However, over the past 60 years, more sophisticated methodologies and techniques have been proposed, incorporating utility/desirability functions (Scott and Horvath, 1980; Neves et al., 2017), expectation-risk (Konno and Yamazaki, 1991; Speranza, 1993), requirements for higher moments of portfolio (Cvitanić et al., 2008), stochastic dominance (McNamara, 1998), etc. Furthermore, fundamental analysis (Greig, 1992; Mukherji et al., 1997) and technical analysis (Pinches, 1970; Austin, 1986; Chou et al., 1997; Yao et al., 1999), followed by factor analysis (Hui and Kwan, 1994) and attribute clustering (Huang and Jane, 2009), are sources for multi-criteria decision making (MCDM) (Colson, 1985).
One notable paper on multi-criteria portfolio selection is by Zopounidis (1999), where the author reviews decision-aid methods, their structure, and processes existing at that time. The paper also briefly explains how MCDM works in financial management. Comparatively, a significant analysis was presented by Aouni (2009), where the author linked portfolio optimization with multiattribute portfolio selection. In his further research (Aouni, 2010; Aouni et al., 2008), the author gave more examples of how goal programming can be used in portfolio selection. A comprehensive review of MCDM techniques was presented in the study Mardani et al. (2015), where a list of publications (more than 460) with different applications in many fields of science, engineering and management was provided. Among them are such techniques as AHP (Forman and Gass, 2001), PROMETHEE (Brans, 1982), ELECTRE (Roy, 1968), TOPSIS (Hwang and Yoon, 1981), ANP (Saaty, 1996), VIKOR (Yu, 1973), and hybrid MCDM (Shyur and Shih, 2006). However, they found only one publication, namely (Vetschera and Almeida, 2012), related to the portfolio selection problem. Later, Munhoz Arantes and Cesar Ribeiro Carpinetti (2019) published a review (with more than 110 papers cited) of how MCDM can be used for risk assessment. It has been emphasized that MCDM, coupled with the generalization of fuzzy sets, is gaining popularity among decision-makers and researchers. Specifically, Mohagheghi et al. (2019) suggested how MCDM should deal with uncertainty-related issues and which optimization techniques could be useful for project portfolio construction. Moreover, they reviewed real-world applications and case studies, excluding the financial portfolio selection problem. However, Liesiö et al. (2021) linked general project portfolios to financial portfolio selection and introduced so-called portfolio decision analysis techniques.
The abovementioned methods and techniques can help solve financial portfolio selection problems as alternatives to AI black-box techniques. Furthermore, Galankashi et al. (2020) provided a list of potentially attractive criteria and reviewed related works. Moreover, they applied fuzzy ANP and showed the entire decision-making process. Such a technique could be helpful in ANN's training phase.
Optimization-based approaches traditionally use technical and fundamental indicators to determine portfolio composition. Demand and supply of stock shares and market patterns are studied using technical analysis (Achelis, 2000). The basic indicators are based on information from each company's financial reports. Silva et al. (2015) applied evolutionary algorithms using several fundamental indicators [debt ratio, ROE (return on equity) and P/E ratio] together with technical indicators to generate optimal portfolios.
The repeatability of data patterns, the visual signals of indicators and oscillators, and the graphical representation of the evolution of assets are the sources for financial technical analysis (Turcaßs et al., 2016). Portfolio selection based on technical analysis implies the idea that prices move up (i.e., bullish), down (i.e., bearish), and sideways (i.e., trading) in a trend and that these trends ultimately influence the movement of financial assets.
Table 6 summarizes papers on MCDM and emphasizes the method, criteria used and application field.
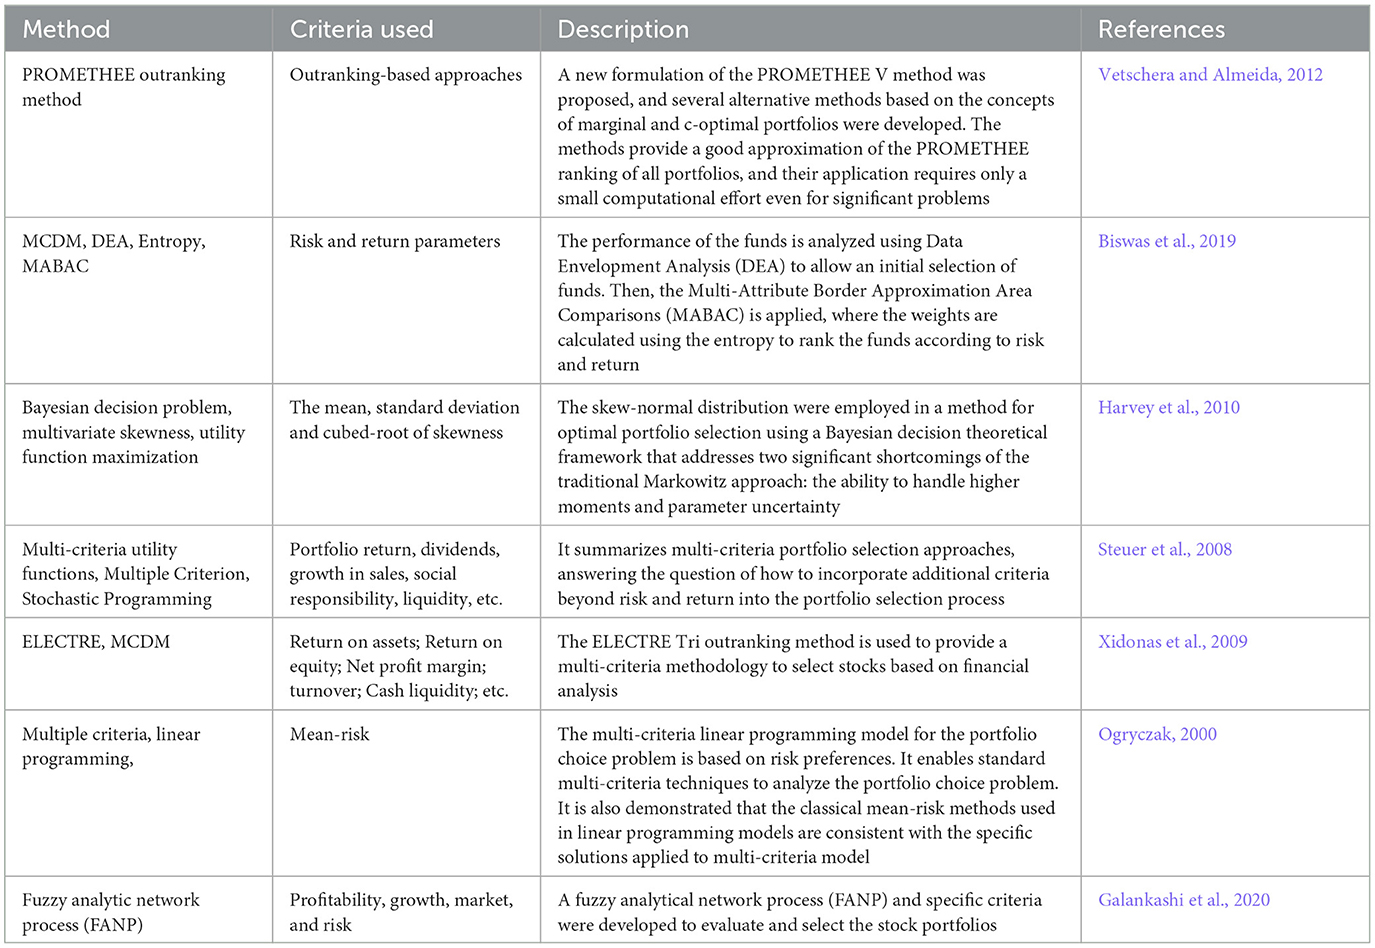
Table 6. MCDM techniques used for portfolio selection.
Table 7 emphasizes the purpose of the MCDM application. However, the method and criteria also are indicated.
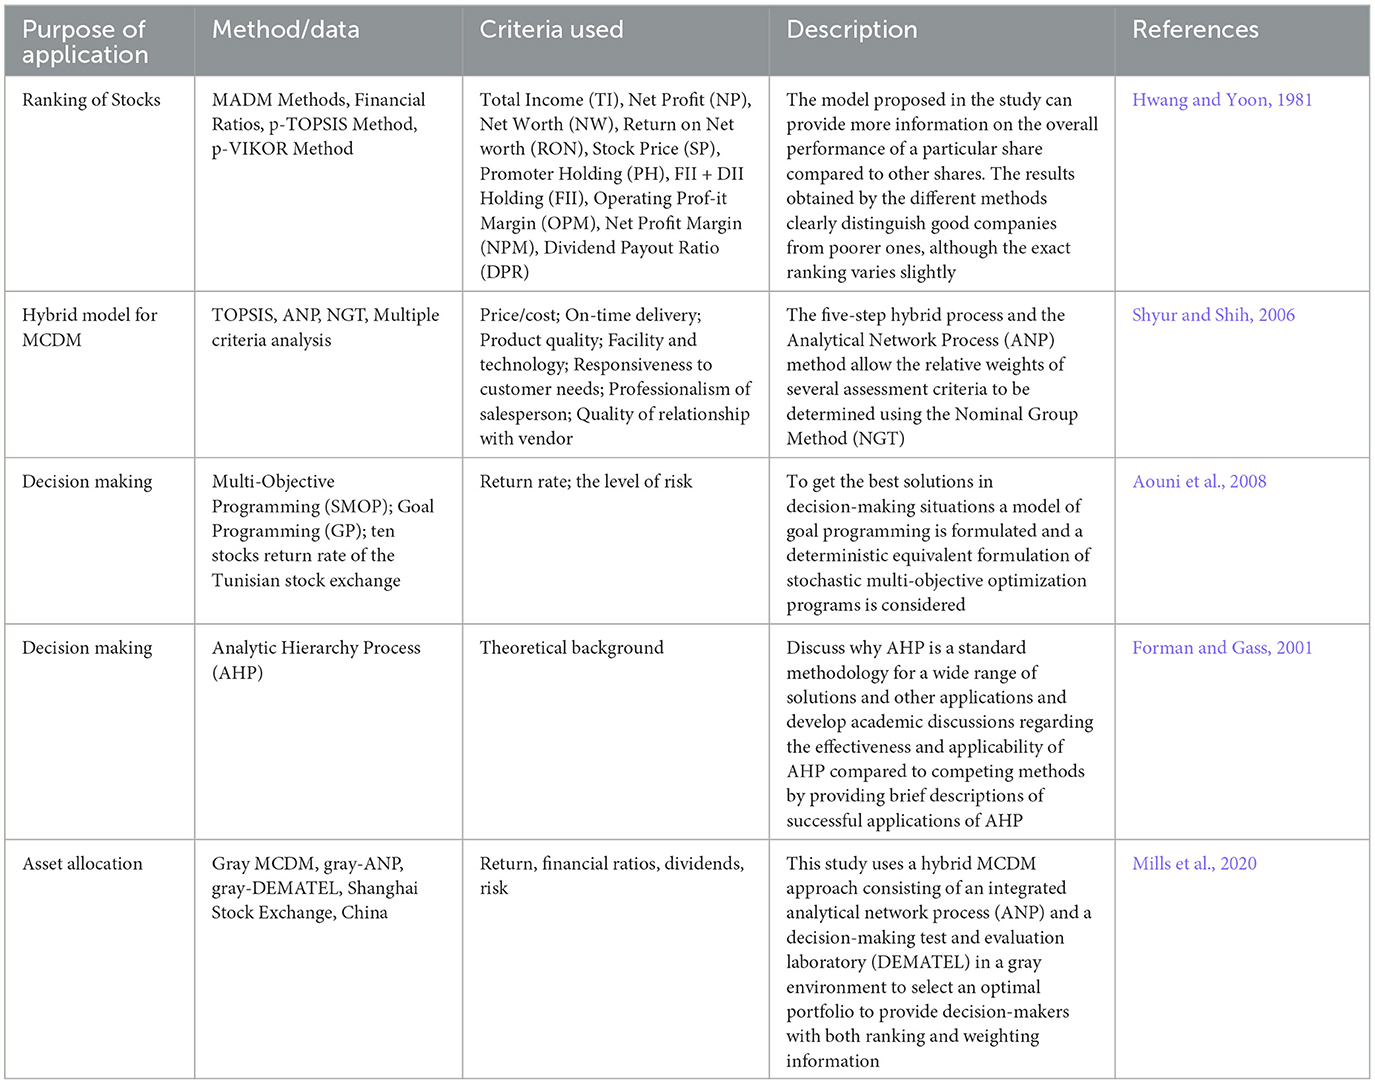
Table 7. MCDM approaches used for particular purpose.
In general, MCDMs are transparent decision-making tools compared to most AI techniques. However, it is heavily dependent on the decision-makers and pre-selected criteria.
The most popular criteria in academic literature for constructing optimal portfolios are mean and variance of returns. However, such an approach leads to a quadratic optimization problem if constraints are no more complex than quadratic. Some authors suggested maximizing skewness (e.g., Konno and Suzuki, 1995) together with maximizing means and minimizing variance, which resulted in the optimization problem becoming much more complex as the utility function became cubic. Furthermore, some authors suggest using a utility function of even higher order (see Harvey et al., 2010 or Levy and Hanoch, 1970). The other approach is related to multi-criteria utility functions (see Steuer et al., 2008 or Ogryczak, 2000). Such types of utility functions lead to linear optimization problems. However, preparations require much more decision-maker involvement as criteria weighting is time-consuming. Moreover, the result is very subjective and may be biased as every decision maker may assign different weights (see Steuer et al., 2008, Galankashi et al., 2020). It is worth mentioning that many authors recommend including historical portfolio return, various security and systematic risk measures, dividends, liquidity, turnover, P/E, P/B, ROA, ROE, workforce, etc. Unsurprisingly, the factors mentioned above come from fundamental and technical analysis.
The following subsections discuss metaheuristics and ML optimization techniques used in portfolio optimization.
Portfolio construction, optimization, and management challenges have been extensively tackled using various metaheuristics, offering more flexibility in problem formulation than classical optimization approaches. Unlike the mean-variance model (Markowitz, 1959), these models can have a richer structure, and the optimization problem may be non-convex. While heuristic methods may compromise solution optimality, they often optimize more efficiently than classical methods. However, their effectiveness is problem-dependent, and formulating a more realistic model with numerous constraints, such as limiting the total number of assets or specifying bounds on each asset's quantity, can be relatively complex. An extensive survey of classical and heuristic optimization methods for portfolio optimization can be found in Mansini et al. (2014). Conversely, metaheuristic algorithms have a general problem-independent structure, although they may require tailoring to specific problems. Advances in parallel computing over the last decade have facilitated practical implementations of computationally intensive metaheuristic methods for large-scale complex problems. Metaheuristic algorithms can be categorized based on various aspects, including population-based or single-solution, naturally inspired, mimic evolution (evolutionary algorithm—EA), utilize swarm intelligence, involve global or local search, etc. These categories may overlap, and some algorithms are hybrid, incorporating techniques from multiple algorithm types. A broad introduction to various metaheuristic algorithms can be found in Talbi (2009). We will consider many of the metaheuristic algorithms, such as genetic algorithms (GA), evolutionary strategy (ES), differential evolution (DE), particle swarm optimization (PSO), ant colony optimization (ACO), artificial bee colony (ABC), simulated annealing (SA), quantum annealing (QA), and tabu search (TS). Some models have a single objective, like minimizing the variance, while others have multiple, like minimizing variance and maximizing return, which require an application of multi-objective evolutionary algorithms (MOEAs).
Table 8 summarizes some of the most critical applications of metaheuristic methods in portfolio optimization. For a comprehensive overview of MOEAs applied in portfolio management before 2012, the reader can refer to Metaxiotis and Liagkouras (2012). A recent survey on swarm intelligence techniques in portfolio optimization is available in Ertenlice and Kalayci (2018). Additionally, Doering et al. (2019) offers a broad survey covering various types of metaheuristic methods for both portfolio optimization and risk management.
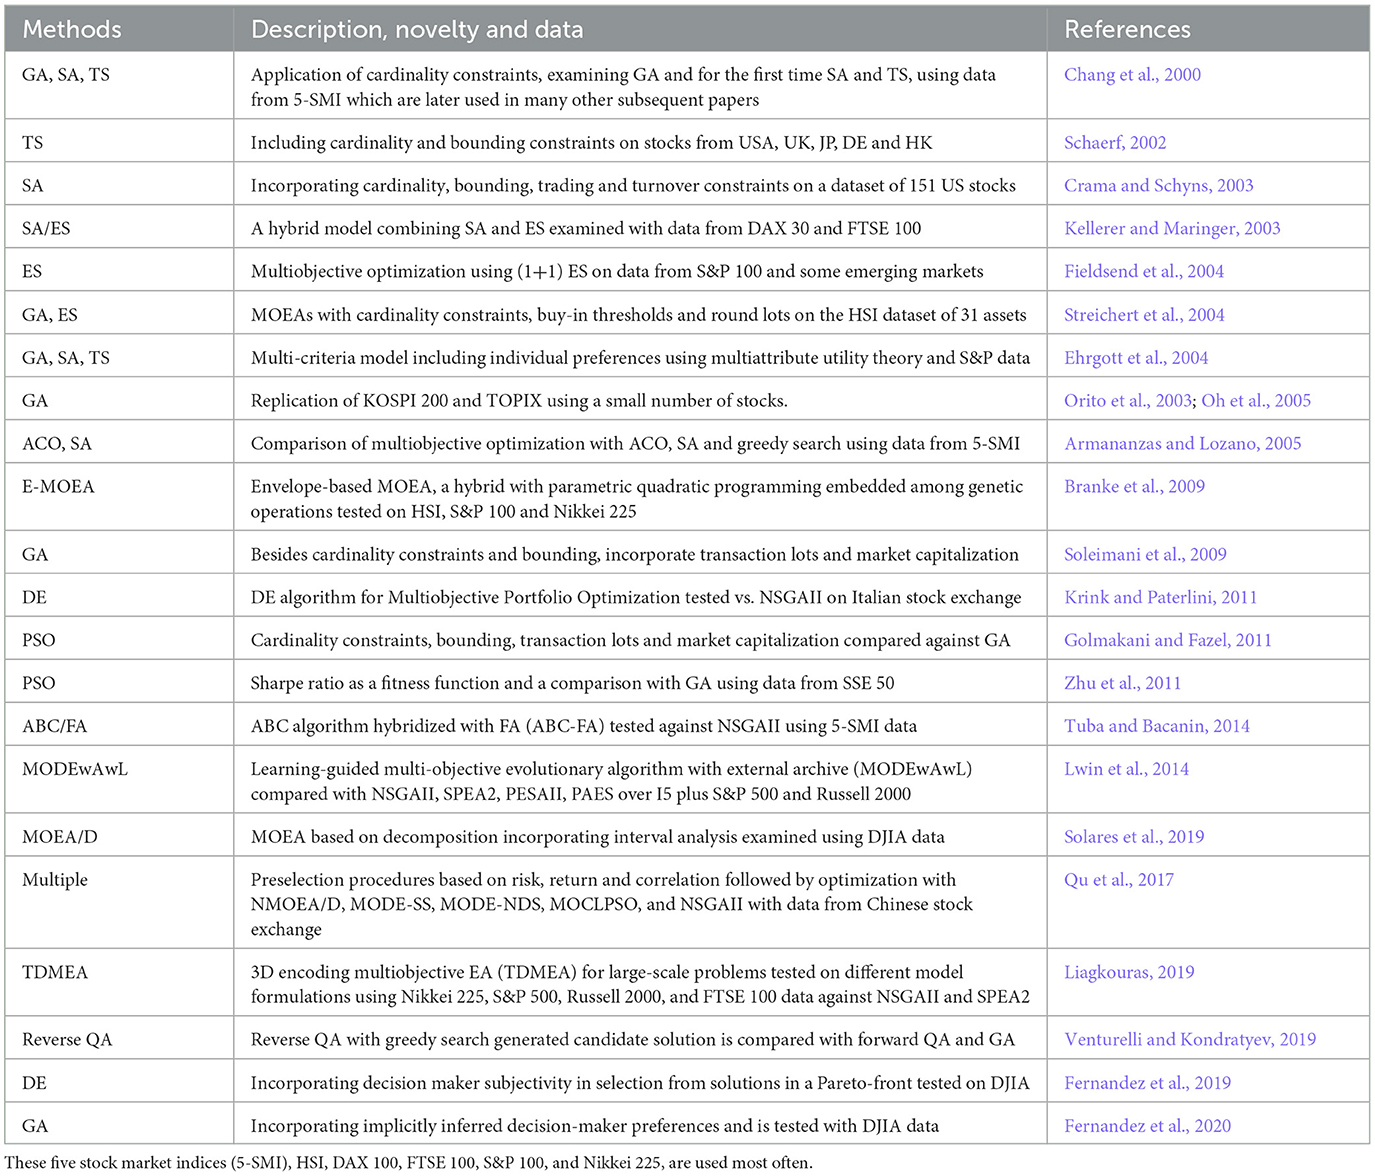
Table 8. Applications of metaheuristic methods for portfolio optimization.
DL concept has been used lately to manage portfolios in diverse conditions based on neural networks (Becker et al., 2019; Andersson and Oosterlee, 2021). Thus, numerous variants of DNN may function as independent evaluators to optimize the algorithm. The cryptocurrency market is often used in this type of research to evaluate the effectiveness of the DNN-based strategy compared to traditional portfolio management strategies (Sun et al., 2021). Some authors add fuzzy neural networks to the market forecasting when conditions change (Ghahtarani, 2021) dramatically. In other recent papers, a finite-time q-power RNN applied to solve the uncertain portfolio model is considered an improvement of classic NN (Ma and Yang, 2021).
Another solution to overcome the limitations of traditional and generic portfolio strategies considered in the recent literature is reinforcement learning (RL) using neural networks. This research direction argues for implementing RNN and conventional NN in reinforcement learning architecture to support investment decisions. The main element in this theory is the connection between agents and the environment (Sutton and Barto, 2018). As a fundamental component of the ML process, in RL theory, the agents are supported by NN to memorize and predict optimal decisions based on present information for an infinite number of actions and states (Wu et al., 2021). The environment then estimates the rewards from these actions to help agents learn for future decisions. This process can define specific models to gradually improve overall performance based on experiences gained with several trial and error steps.
In addition to this research direction, some authors claim that deep reinforcement learning (DRL) can be successfully used to capture the dependencies between the main features of some financial indicators, such as risk aversion, portfolio-specific characteristics and previous portfolio allocations (Benhamou et al., 2021b). At the same time, in deep consolidation learning, network composition and appropriate rewards significantly influence learning transactions in financial time series, using high-frequency data decomposed as input (Lee et al., 2021). A previous paper stipulated that portfolio management requires prior decisions as input to consider the effects of transaction costs, market impact or taxes, and this temporal dependence on the system's state involves reinforcement versions of standard recurrent learning algorithms (Moody et al., 1998). In another approach, DRL deals with low, high, and close prices through a designed depth convolution for these three characteristics. The classic methods cannot accurately estimate the critical time, so a three-dimensional warning gating network is used, giving greater importance to rising moments. Thus, deep-reinforcement learning tools obtain more substantial returns and improve profit indicators while reducing risk (Weng et al., 2020).
In other research, recurrent consolidation learning has successfully optimized portfolios. It memorizes up-to-date market conditions and constantly rebalances the portfolio's content based on classic performance indicators (Aboussalah and Lee, 2020). In some models, a compromise parameter is introduced to adjust the portfolio's optimism level, and learning algorithms evaluate market fluctuations and provide information to generate forecast hyperparameters. The main advantage of using these more complex methods is that the effectiveness and robustness of the portfolios obtained with their help significantly exceed the return and risk indicators obtained with the classical techniques (Min et al., 2021). Other methods study the relationships between financial instruments, which are considered to vary over time. These relationships are studied with the help of CNN, in which the market operator learns and applies an investment behavior that is constantly re-evaluated. Thus, the permanent reallocation of the assets from the portfolio is ensured to optimize the yield indicators (Soleymani and Paquet, 2021).
Recently, a new research direction has combined reinforcement learning and its applications with Python or similar programming languages coding to support understanding portfolio optimization mechanisms. These codes use dedicated open-source software as data processing media for programming (Graesser and Keng, 2019; Dixon et al., 2020). These research methods can integrate portfolio selection with portfolio optimization using multicriteria algorithms. The advanced programming languages with dynamic semantics allow every optimization step to be followed in detail, from the data entry to the extraction of the results (Sarmas et al., 2020). A significant advantage of using these methods is that free cloud-based platforms for programming effectively run the necessary programs (Rather, 2021). Thus, according to an increasing number of authors, Python or other programming languages can be used to build an efficient portfolio based on multiple optimization techniques to improve portfolio performance. Numerous results showed that the prediction models efficiently obtained high accuracy and enhanced yields (Ta et al., 2020).
As seen from the above, regardless of the method proposed for research, most papers cited conclude that optimizing portfolios based on DL, RL, or DRL have significantly better results than traditional algorithms. The generally accepted assertion is that these modern tools are superior to even the most advanced methods based on classical instruments. Moreover, using advanced programming languages, such as Python, supported by powerful open-source software and free cloud-based platforms, leads to superior results in optimizing portfolios, increasing returns and reducing risk.
This section focuses on executing portfolio orders and aligning them with investor objectives while considering market impact and asset price dynamics. Execution orders are a crucial element in portfolio management, closely linked to preceding portfolio rebalancing decisions. This integrated approach involves two interconnected facets. The application of established machine learning techniques, such as supervised and unsupervised learning (e.g., clustering, LASSO, Bayesian networks, and SVMs), becomes increasingly relevant. These techniques apply to portfolio execution, managing multiple variables such as order size, trade-quote relationships, order book imbalances, and spreads.
Rebalancing, a crucial aspect of portfolio management, entails adjusting asset weights to maintain desired allocations or manage risk levels. This involves diverse strategies, from widely adopted to less conventional approaches. This comprehensive review explores these strategies, analyzing their characteristics, advantages, and limitations. The term “rebalancing” emphasizes adjusting asset weights to realign with chosen allocations or risk levels over time, without the necessity of adhering to a 50/50 stock and bond split (Tokat and Wicas, 2007; Kitces, 2015; Hong, 2021). Whether targeting a 50/50, 70/30, or 40/60 allocation, portfolio rebalancing involves reshuffling assets to achieve a predefined composition (Chen J. et al., 2020). Recognizing the diversity of rebalancing methods is crucial; some strategies are well-documented for their simplicity and effectiveness, while others, though less familiar, offer innovative perspectives. The table below summarizes and categorizes these types.
Assessing risk and return within a target asset allocation often relies on a rebalancing strategy. This approach considers the frequency of portfolio reviews, acknowledging it as a factor influencing whether the portfolio's actual performance aligns with its intended asset allocation. The core objective of rebalancing is to manage risk concerning the target asset allocation, prioritizing risk management over solely maximizing returns. Investors typically choose a rebalancing strategy based on their risk tolerance about expected returns, factoring in rebalancing costs (Zilbering et al., 2015). There isn't a universally optimal rebalancing frequency or threshold, as risk-adjusted returns tend to exhibit minimal differences among various rebalancing strategies (Tsai, 2001; Eakins and Stansell, 2007; Zilbering et al., 2015; Gruszka and Szwabiński, 2020).
Acknowledging the diversity of rebalancing methods is crucial; some strategies are well-documented in the literature for their simplicity and effectiveness, while others, though less familiar, offer innovative perspectives. Table 9 summarizes and categorizes these types.
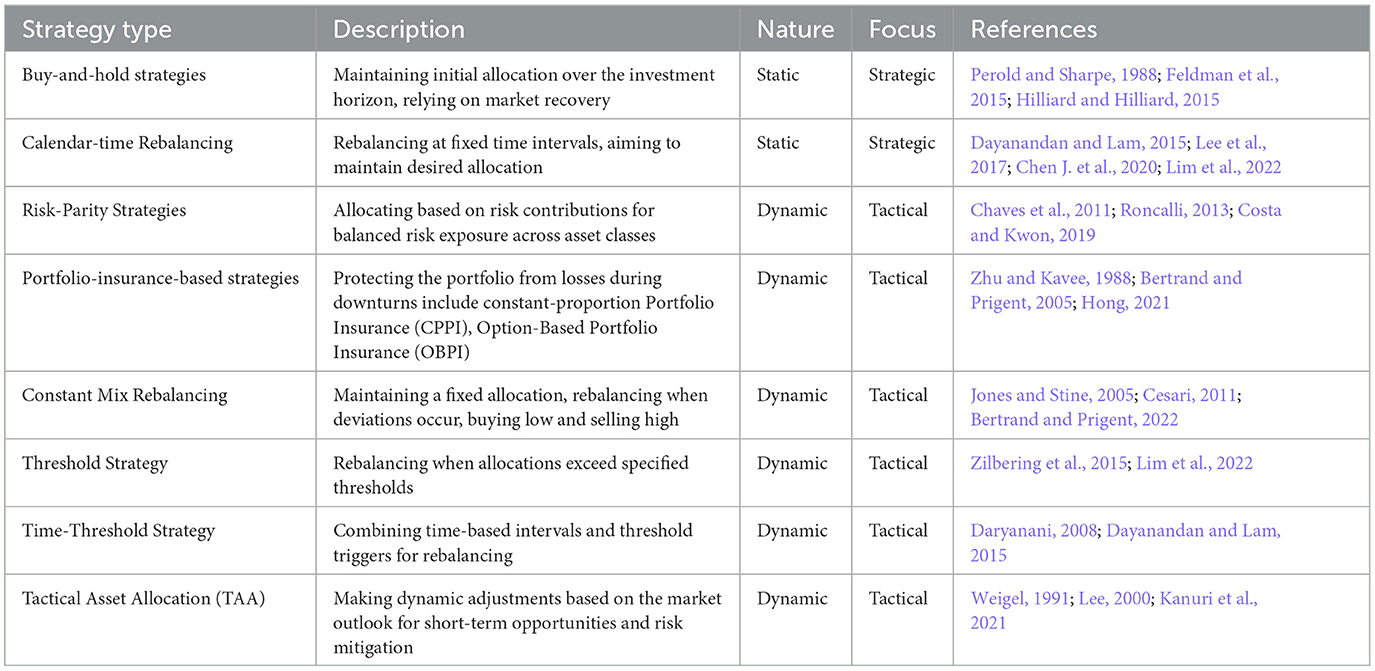
Table 9. Summary and categorization of rebalancing strategies.
Rebalancing strategies have been a subject of interest in various studies and research efforts. Perold and Sharpe (1988) categorized these strategies into four distinct approaches: buy-and-hold, constant mix, constant-proportion portfolio insurance (CPPI), and option-based portfolio insurance (OBPI). CPPI gained widespread adoption due to its ability to align asset allocation decisions with predetermined minimum dollar values (Zandieh and Mohaddesi, 2019). Moving ahead, Daryanani (2008); Zilbering et al. (2015); Dayanandan and Lam (2015) emphasized fundamental strategies, which included: (i) time rebalancing, (ii) threshold rebalancing, and (iii) a time-threshold rebalancing. These studies collectively underscored the significance of maintaining simplicity and consistency in portfolio maintenance.
Recently, Chen J. et al. (2020) introduced a structured framework categorizing rebalancing strategies into three primary approaches: calendar rebalancing, constant-mix strategy with bands, and CPPI. Calendar rebalancing involves periodic adjustments at fixed intervals, such as monthly or quarterly, regardless of market conditions. In contrast, corridor strategies set thresholds or bands around target allocations, prompting rebalancing when assets deviate beyond these bounds. Additionally, more recent research by Lim et al. (2022) has expanded the discussion by considering transaction costs, identifying two distinct approaches: complete portfolio rebalancing and gradual portfolio rebalancing. Complete portfolio rebalancing targets swift asset reallocation within a single trading day, while gradual rebalancing spreads adjustments across multiple trading days to minimize costs.
Customizing rebalancing strategies to consider specific factors like time constraints, transaction costs, and allowable deviations is vital. One adaptable method is threshold rebalancing, using range-based mechanisms to reallocate assets when they exceed predefined thresholds swiftly. Combining periodic and threshold strategies results in a hybrid approach that selectively rebalances portfolios when predetermined thresholds are breached. In the context of range rebalancing applied to portfolio benchmarks, asset classes are returned to their target allocations when they fall outside rebalancing bands. This approach underscores the importance of regular portfolio review and rebalancing only when asset allocations surpass a predetermined minimum rebalancing threshold. Moreover, rebalancing can also respond to tactical tail-risk models, highlighting the need for flexible portfolio management approaches (Packham et al., 2017).
The term “dynamic” denotes a strategy's ability to adapt swiftly to changing market conditions, asset performance, or specific triggers, diverging from predetermined time intervals (Perold and Sharpe, 1988, 1995; Bansal et al., 2004). Dynamic rebalancing, as articulated by Ilmanen and Maloney (2015), is an active investment approach where investors adjust their portfolios not confined to fixed schedules or specific percentage deviations. Instead, they realign portfolios with desired risk levels based on real-time market conditions. Diverging from traditional rebalancing methods, dynamic rebalancing is flexible and responsive, utilizing monthly market trends to dictate when and how much to rebalance while emphasizing exceptional signals in different asset classes. This approach aims to optimize investment performance while effectively managing risk (Gaivoronski et al., 2005).
There are both established and emerging techniques in dynamic portfolio rebalancing. Well-established methods include CPPI, OBPI, time-Threshold Strategy, and TAA, which have demonstrated their ability to enhance portfolio performance regarding risk-adjusted returns over many years.
The advent of AI/ML tools has ushered in a new era of dynamic portfolio rebalancing strategies. These emerging techniques harness the power of artificial intelligence and machine learning, offering innovative solutions. They encompass dynamic portfolio rebalancing through reinforcement learning (RL), utilizing its algorithms to maximize portfolio returns, and applying lag-optimized trading indicators in conjunction with genetic algorithms. To provide a practical glimpse into dynamic rebalancing, Jiang et al. (2020) developed a framework that integrates machine learning models into portfolio rebalancing, focusing on risk-aversion adjustment. This approach outperformed benchmarks in terms of returns and risk. Lim et al. (2022) employed an RL agent, introducing four distinct combinations of portfolio adjustments and price prediction models: (1) complete portfolio balancing without the Long Short-Term Memory (LSTM) prediction model, (2) complete portfolio balancing with the LSTM prediction model, (3) gradual portfolio balancing without the LSTM prediction model, and (4) gradual portfolio balancing with the LSTM prediction. Therefore, portfolio rebalancing utilizing the Recurrent RL (RRL) method and an adjusted objective function considering transaction costs and market risk aligns to develop efficient learning algorithms in RL, as discussed by Szepesvári (2010). Furthermore, RL has diverse applications in finance, including optimizing insurance pricing, bank marketing, portfolio management, and trading, as highlighted by Lim et al. (2022). Additionally, Jiang et al. (2020) integrated machine learning models into a portfolio rebalancing framework, adapting risk levels based on market trend predictions and consistently surpassing benchmark performance.
Nonetheless, it's essential to note that the effectiveness of these strategies may vary depending on factors such as portfolio size, investment objectives, and prevailing market conditions. Among the most recent and relevant studies Yeo et al. (2023) introduced two rule-based dynamic portfolio rebalancing algorithms: Tactical Buy and Hold (TBH), utilizing the forecasted Moving Average Convergence Divergence Histogram (fMACDH) indicator and risk differences and Rule-Based Business Cycle (RBBC), leveraging market sector performance variations across business cycles.
While the early literature on portfolio performance evaluation dates back to the 1960s, recent decades have witnessed a proliferation of novel methodologies, techniques, and empirical research in this field. These metrics effectively gauge the returns generated by a managed portfolio compared to the performance of a designated benchmark portfolio over a specific assessment period. Consequently, the benchmark portfolio must serve as a viable investment alternative for the managed portfolio under scrutiny (Brinson et al., 1995; Aragon and Ferson, 2006). However, Grinblatt and Titman (1989) introduces a comprehensive model designed to offer a nuanced perspective on diverse aspects of portfolio performance measurement. Within this model, a critical examination of various performance metrics unfolds, shedding light on their multiple criticisms. These criticisms encompass challenges like selecting an appropriate benchmark portfolio, the potential overestimation of risk due to market-timing skills, and the paradox of informed investors not realizing positive risk-adjusted returns due to growing risk aversion. Notably, the article contends that these significant issues should not be considered insurmountable obstacles in performance evaluation.
Portfolio performance evaluation assesses how a managed portfolio has performed compared to a specified benchmark. The methods for performance evaluation can be broadly categorized into conventional and risk-adjusted methods. Benchmark comparison and style comparison are prominent traditional methods, while risk-adjusted methods, including the Sharpe ratio, Treynor ratio, Jensen's alpha, Modigliani and Modigliani, and Treynor Squared, adjust returns to consider variations in risk levels between the managed portfolio and the benchmark portfolio. Preference is often given to risk-adjusted methods over conventional ones (Modigliani and Modigliani, 1997; Samarakoon and Hasan, 2013, 2022; Tamplin, 2023).
The conventional method, encompassing benchmark and style comparisons, assesses investment portfolio performance against a broader market index. Outperformance is determined if the portfolio's return exceeds that of the benchmark index over the same periods (Brinson et al., 1991; Samarakoon and Hasan, 2022). However, Aragon and Ferson (2006); Dor and Jagannathan (2002) have emphasized limitations, pointing out that this method may not consider variations in risk levels between the two portfolios. The portfolio might seem superior due to higher risk, leading to potential validity issues in a straightforward comparison.
Risk-adjusted approaches commonly alter returns to account for variations in risk levels between the managed and benchmark portfolios. As previously mentioned, we distinct, in the following, the most known and used approaches (see Table 10).
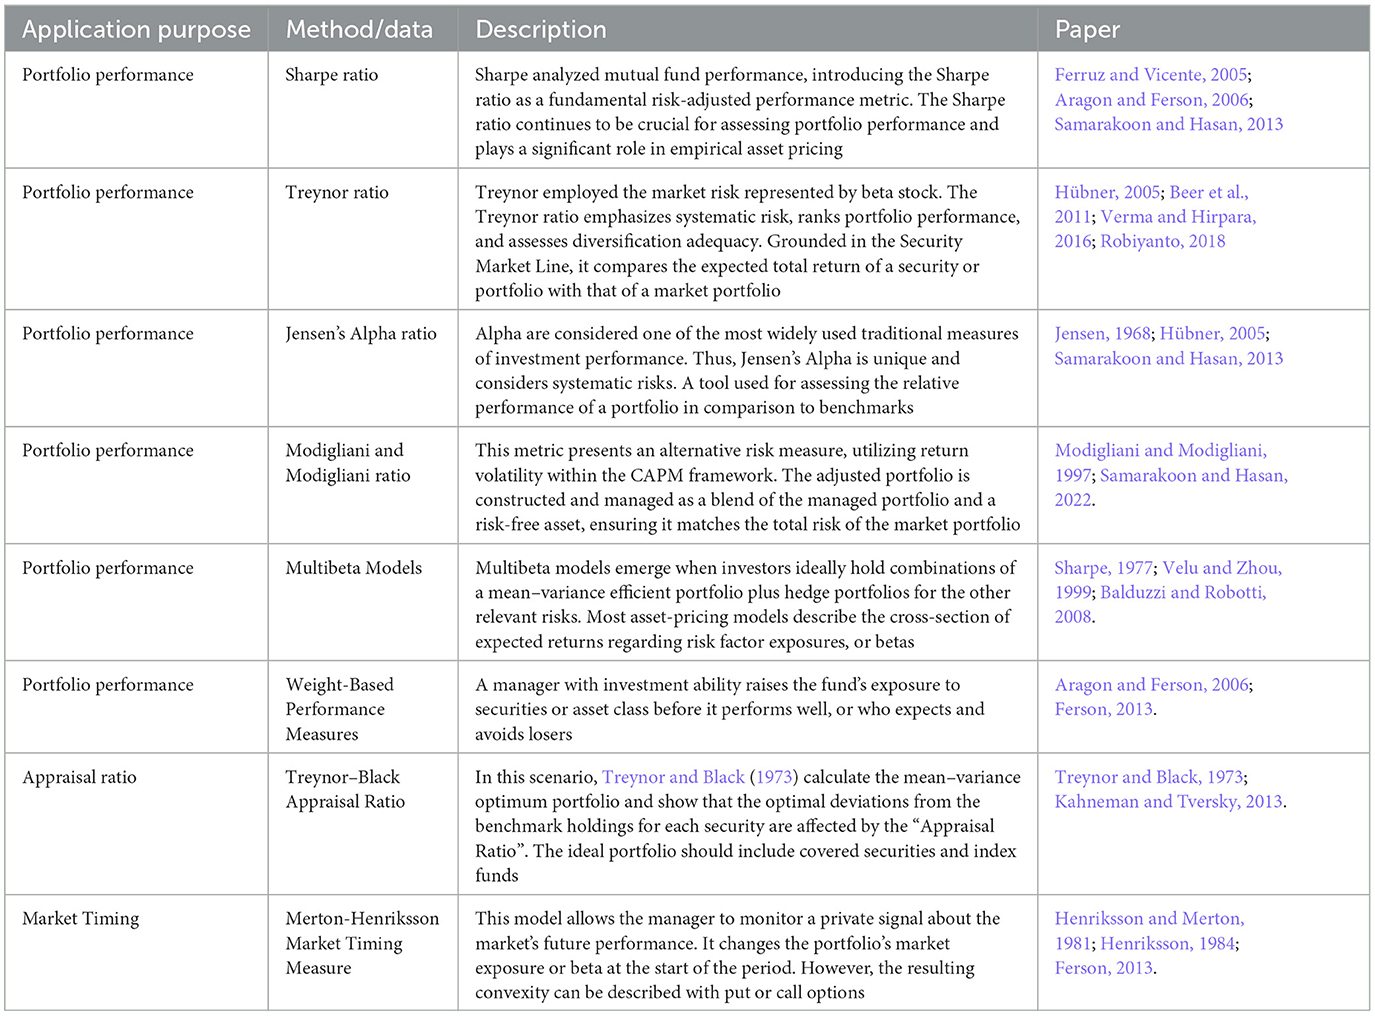
Table 10. Summary of risk-adjusted performance measures.
The field of performance attribution provides valuable insights for delineating investment responsibilities and measuring the contributions of various activities within the investment management process. Performance attribution seeks to clarify portfolio performance relative to a benchmark and pinpoint the origins of excess returns attributable to active decisions made by the portfolio manager. Bacon (2019) traces its evolution, beginning with Fama decomposition in the 1970s and progressing through subsequent developments, including multiperiod and multicurrency attribution in the 1990s, to contemporary models focused on fixed-income and risk-adjusted attribution. Bacon's comprehensive examination encompasses various attribution methods, such as returns-based, holdings-based, and transaction-based approaches, alongside considerations of money-weighted attribution and advancements related to notional funds.
In this historical context, Brinson and Fachler (1985) along with Brinson et al. (1995) established the basis for equity performance attribution, distinguishing excess returns into asset allocation, security selection, and interaction elements, ensuring they collectively constitute the active return. Extending this framework, Ankrim and Hensel (1994) incorporated currency management effects, introducing terms for currency forward premiums and surprise effects. These decomposition models remain relevant, as exemplified in Chen F. et al. (2018) examination of managerial skills.
Moreover, Fisher and DAlessandro (2019) introduced a novel risk-adjusted performance attribution analysis that integrates risk measures with Brinson models. This approach decomposes excess portfolio return into risk, allocation, and net selection components, ensuring additivity and consistency with financial theory. The risk adjustment can utilize either the traditional beta for Jensen's alpha calculation or Fama's beta, incorporating unsystematic risk while relying on relative standard deviations for risk adjustment in the Brinson attribution analysis.
AI-based portfolio appraisal techniques offer several advantages, including optimizing trade timing, project performance evaluation, cognitive bias reduction, and improved decision-making. Some specific methods encompass Equal Weighted Portfolio (EWP), which assigns equal weight to each stock in a portfolio, irrespective of its company size, to reduce concentration risk and increase diversification (Malladi and Fabozzi, 2017; Lee, 2020). Inverse Volatility Portfolio (IVP) is another technique that helps in risk-adjusted allocations, performance evaluation using extensive data analysis, real-time detection and mitigation of decision-making biases, and the analysis of fundamental and alternative datasets to identify fresh investment prospects (Hallerbach, 2015; Rao, 2021).
Moreover, Thethi et al. (2021) recommends using LSTM for stock market prediction, surpassing traditional methods in performance. Shukla et al. (2022) focuses on improving financial portfolios through machine learning, considering the user's risk profile and employing ML for stock selection and capital allocation. Boudabsa and Filipović (2022) introduces a simulation approach for dynamic portfolio valuation and risk management, leveraging machine learning with kernels, demonstrating favorable outcomes in extensive dimensions. Kaczmarek and Perez (2021) illustrates that portfolio optimization techniques, such as Markowitz mean-variance and HRP optimizers, can enhance the risk-adjusted return of portfolios constructed with stocks preselected using ML.
In the context of real estate portfolio appraisal, Viriato (2019); Kok et al. (2017) exemplifies how Automated Valuation Models (AVM) have garnered substantial technological investment. These models can swiftly appraise many assets, streamline processes like property selection, expand investor access, facilitate efficient tax assessments, and improve understanding of value determinants. With the ongoing advancement of ML techniques, as demonstrated by Conway (2018), investors can leverage more precise valuation algorithms, effectively navigating a broad spectrum of opportunities.
The transparency and clarity of models using artificial intelligence are hotly debated. It is crucial for financial institutions, banks, governments or any other body that uses AI to trust the tools provided by researchers (Dwivedi et al., 2021; Ng et al., 2021). The AI tools and methods are not yet widely known to the general public, leading to a lack of confidence in the results obtained. Thus, it is trying to reach the concept of Responsible Artificial Intelligence as a methodology for the widespread implementation of AI methods in real life with correctness, explainability and responsibility (Arrieta et al., 2020). Deep reinforcement learning has recently been introduced to support socially responsible investments and portfolio optimization to achieve superior financial performance and a significant social impact (Vo et al., 2019). It is increasingly clear that the development of research in this area is closely linked to the capacity to ensure the transparency and explainability of the proposed models.
The increasing application of ML techniques to build portfolios and the concern in parallel on the ethical dimension of AI increases the interest in understanding how the different features interact and impact the model portfolio performance. At this point, XAI ensures the acceptance and adoption of AI-driven services and products. Still, it is only one of the four categories of trustworthiness technologies for machine learning, namely Fairness, Explainability, Auditability and Safety (FAES) (Toreini et al., 2020). At this stage, the starting point is the map of social sciences concepts such as ability, benevolence, integrity or predictability and linking these with AI framework showing their behavior in understandable terms for humans (Doshi-Velez and Kim, 2017). In this way, XAI helps compare different models and create rules for decision-making in which the underlying model can be explained to the users.
The concept of Shapley value introduced in cooperative game theory tells us how much each feature contributes to a specific result of the ML model (Lundberg and Lee, 2017; Lundberg et al., 2018). SHapley Additive exPlanation (SHAP) methodology allows us to quantify a model in an agnostic way, and we can see two approaches to address the interpretability issue of ML (Joseph, 2020): variable attributions via the decomposition of individual predictions (local attribution) and importance scores for the model as a whole (global attribution). Shapley values are the contributions of each feature to the overall crash logit probability. From the methodological perspective, the interpretation approaches for deep learning also have two main categories: surrogate model and feature importance extraction. Surrogate models use an explainable model, such as a decision tree, rule sets, linear models or generalized additive models, to proxy the neural network to be interpreted (Cong et al., 2020). Following are some examples of the application of the SHAP methodology. For instance, Jaeger et al. (2021) regress the Calmar ratio spread of HRP vs. Equal Risk Contribution (ERC) against statistical bootstrapped features applying Shapley framework showing insightful explanations. Schwendner et al. (2021) present a conceptual framework named Adaptive Seriational Risk Parity (ASRP) to extend HRP as an asset allocation heuristic using the SHAP framework to explain the resulting performance with features of synthetic market data. Also, referring to synthetic data, Papenbrock et al. (2021) evaluates three competing machine learning methods to regress the portfolio risk spread between both allocation methods against statistical features of the synthetic correlation matrices and then discusses the local and global feature importance using the SHAP framework. Benhamou et al. (2021a) apply Shapley values to provide a global understanding and local explanations of a proposed gradient boosting decision tree (GBDT) to plan regime changes of S&P 500 from a set of 150 technical, fundamental and macroeconomic features.
At this stage, it is interesting to bring here the debate of the dichotomy between the accurate Black Box and the not-so-accurate transparent model where Rudin and Radin (2019) referred to as complexity bias. We tend to find the complex more appealing than the simple. The belief that accuracy must be sacrificed for interpretability is inaccurate, and it explains the problems that have resulted from the use of black box models for high-stakes decisions throughout society, mainly in the finance domain. Going further, trusting a black box model means trusting the model's equations and the entire database from which it was built. In this way, for instance, Philps et al. (2021) proposes a symbolic artificial intelligence (SAI) for stock selection, a form of satisfying, provides an alternative to factor investing and overcomes the interpretability issues of many machine learning (ML) approaches by applying learns simple, interpretable investment rules using the non-linear power of a simple ML approach.
XAI, as an extension of ML techniques, is directly applicable to another use-case on finance linked to the automated management of the asset portfolio allocation. This leads us to the concept of Robo-Advisors (RAs) who offer automated online portfolios, which are currently one of the significant parts of the Fintech Revolution and likely one of the most disruptive trends in wealth and asset management nowadays (Beketov et al., 2018). The takeover of the robots-assets under management in the RA segment is projected to reach US$1,427,650m in 2021 with an annual growth rate 2021 of 34.8% and foreseen 18.78% yearly growth in 2021–2025, resulting in a projected total amount of US$2,842,101 m by 2025 Statista (2021). Two parts of the process operated by RA are crucial: (1) client profiling and (2) asset allocation. There is an abundance of research that demonstrates the interest in the subject and others that shows how RA improves portfolio performance (D'Acunto and Rossi, 2020; Hong et al., 2020; Rossi and Utkus, 2020; Bianchi and Briere, 2021a,b). The counterpart of this new trend is the increased opacity, missing accountability, transparency and financial inclusion. At his point, it becomes essential to design and implement trusted AI-based systems (Toreini et al., 2020) and again, XAI emerges as one of the most critical contributions from the ML landscape.
XAI has developed processes that explain already trained neural networks based on generating synthetic data in another research direction. It is a complex discussion about which XAI method gives the best results and whether the explanations can be reliable (Arras et al., 2022). A comprehensive approach to generating synthetic data uses a Generative Adversarial Network (GAN). Some authors have explored the possibilities of overcoming the difficulties of establishing the correct set of hyperparameters in the case of GAN by using reinforcement learning and Bayesian optimizations. They combine the Multi-Model-based Hybrid Prediction Algorithm with the GAN-based Hybrid Prediction Algorithm. Further, they obtained an improved model named Multi-Model Generative Adversarial Network Hybrid Prediction Algorithm for stock market prices prediction (Polamuri et al., 2021). The learning process approach based on a predictive probabilistic neural network corresponds to a different way of using training in the Conditional Generative Adversarial Networks (cGAN) as a predictive model in portfolio optimization, stock market prediction and trade execution (Zhang et al., 2019; Lee and Seok, 2021).
Summarizing XAI subject, there is no doubt how ML is becoming mainstream for investment management (Table 11), but the debate that has only just begun is how most ML approaches suffer from black-box problem, which is part of the agenda in increasing finance group discussions arising XAI as a key tool for Customers, Regulators, Practitioners and Risk Managers.
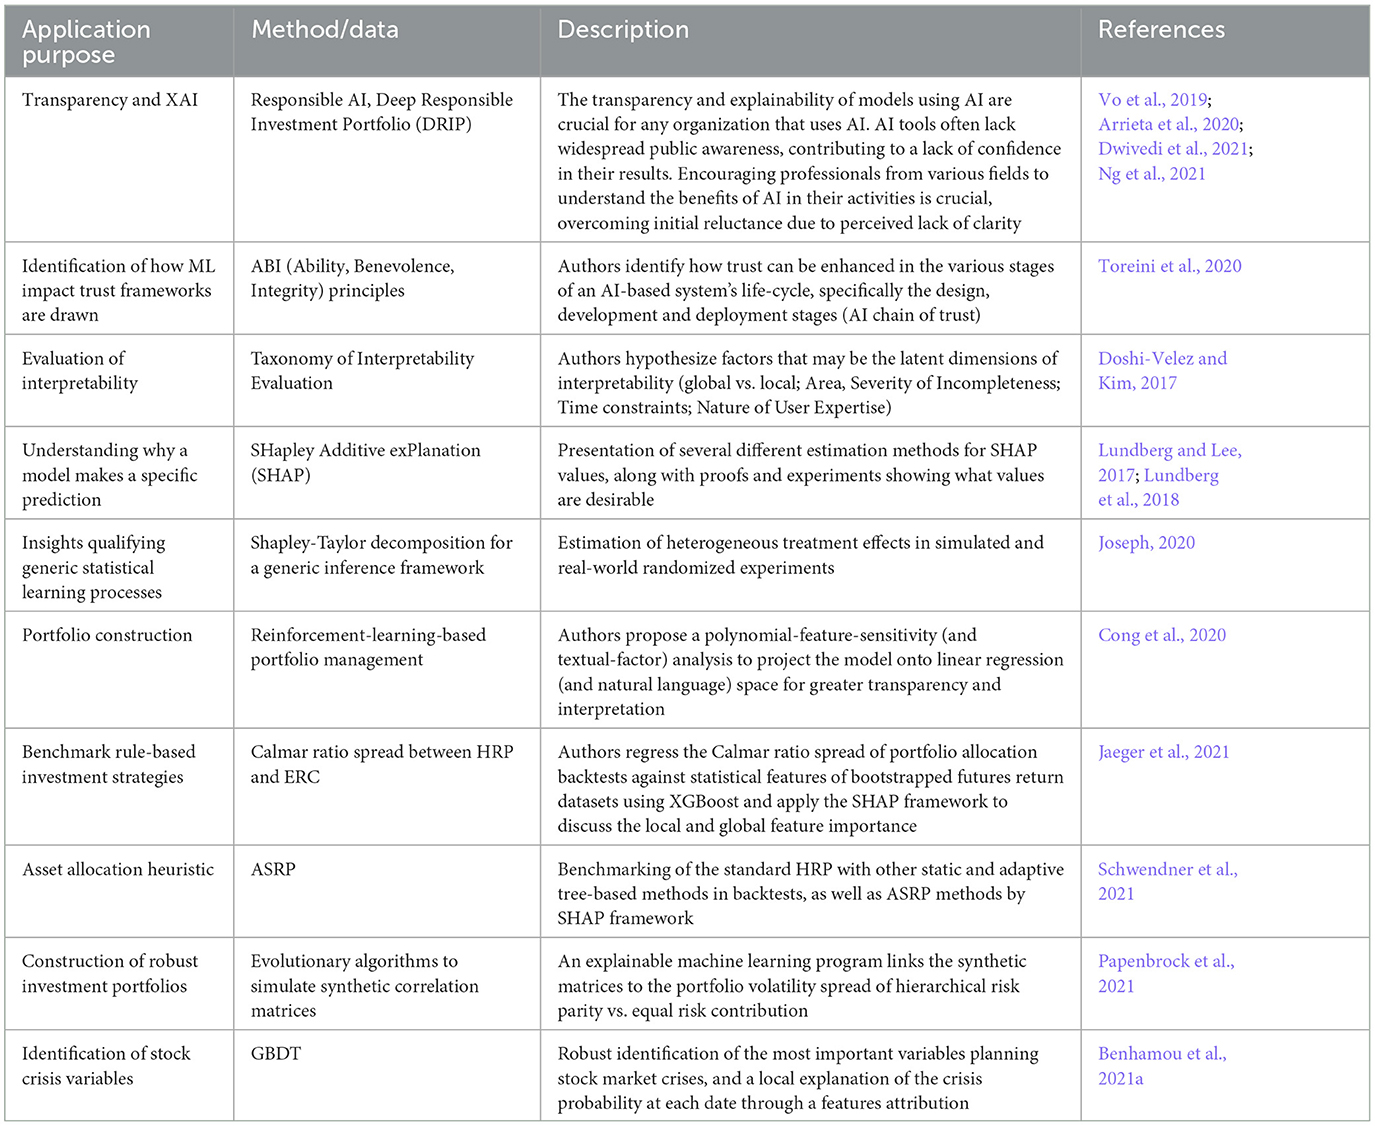
Table 11. Transparency and explainability.
XAI has emerged as a crucial component in the field of portfolio management. Given the complexity of financial markets and the myriad factors affecting asset prices, investment decisions are increasingly informed by sophisticated machine learning models often seen as “black boxes” due to their inherent complexity and lack of interpretability. This lack of transparency can be problematic in a portfolio management context where understanding the reasons behind predictions is vital for risk management and strategic decision-making. XAI comes into play here by providing insights into what the model has learned and how it makes decisions. It provides a way to unravel the complex web of calculations machine learning models perform, intense learning ones.
Specifically, XAI techniques are essential for portfolio allocation decisions and for predicting returns using machine learning. Fund managers need to know why certain assets are favored by the model when allocating resources among various assets in a portfolio. This understanding helps identify the critical drivers behind portfolio allocation, improve trust in the model's decisions, and make more informed allocation adjustments. Regarding return predictions, explainability can reveal the model's sensitivity to certain features. It can also help ensure regulatory compliance, as financial regulators often require firms to explain their algorithmic decision-making processes. Thus, in portfolio choices and return predictions, XAI is critical in enhancing transparency, promoting trust, and ensuring better governance when using AI in portfolio management.
The magic of AI is its ability to process big data at speed and accuracy that is not achievable by humans or conventional methods, to learn from the data and its mistakes, and to evolve and cope with high-complexity tasks. The primary role of the paper is to systematically review the existing state-of-the-art AI approaches used for asset allocation in each step of the portfolio management framework. However, the rapid surge in performance of sophisticated AI-powered systems turned them into black-box models, raising uncertainties about how the decisions are generated (Linardatos et al., 2021). This perfectly explains why the adoption of AI in finance still struggles, as high-speed investment decision-making should satisfy requirements such as reliability/soundness, accountability, transparency, fairness and ethics, which have been declared as the critical determinants of trustworthy solutions (Prenio and Yong, 2021). As a result, XAI has gained increased attention as a means (1) to develop more explainable models while preserving a high level of learning performance and (2) to enable humans to understand how the model works at its core, appropriately trust, and embrace the benefits of AI as artificially intelligent advisor or autonomous system (Arrieta et al., 2020).
The field of XAI, being comparatively new, is a rapidly growing body of research and, therefore, is still very fragmented. On the one hand, as an alternative to transparent/interpretable models, we observe a continuous development of different post-hoc explainability approaches and their extensions, which broadly could be categorized into model-agnostic and model-specific (PWc, 2018; Arrieta et al., 2020). On the other hand, in parallel, the conceptual frameworks, standards, and requirements are being published in their early stages by different bodies of the financial market. For example, in response to AI-powered risk, the draft EU regulatory framework on AI named the AI Act, was published in April 2021 (The European Commission, 2021). Under the proposed AI Act, a technology-neutral definition of AI system is established, and a risk-based classification is laid down, introducing prohibited AI systems, high-risk AI systems, AI systems subject to transparency requirements, and low-risk AI systems. This implies that different requirements and obligations will be applied accordingly, but this has not been settled definitively. Based on its current version, it may be concluded that the intelligent AI-powered portfolio management system is assigned to a low-risk case. As another example, in 2022, the Bank of England and the Financial Conduct Authority published their report on Artificial Intelligence Public-Private Forum (The Bank of England and the Financial Conduct Authority, 2022) summarizing the dialogue between the public sector, the private sector, and academia on AI. In the context of the use of AI in savings and investment management, the authors posed a potential AI-powered risk on markets in case AI becomes more widely used in institutional fund products, as this could lead to a “herd” behavior due to the similar data and models used or through concentrations in the networks used to transfer data and models, which ultimately affect consumers, firms, and the financial system. It has been envisioned as future steps that an industry body for practitioners could build trustworthy AI. At the same time, the regulators should support the innovation and accommodation of AI by clarifying how existing policies and regulations and policies apply to AI. Comparatively, in the report of IOSCO on the use of AI and ML by market intermediaries and asset managers (The Board of the International Organization of Securities Commissions, 2021), the areas such as (1) governance and oversight, (2) algorithm development, testing and ongoing monitoring, (3) data quality and bias, (4) transparency, and explainability, (5) outsourcing, and (6) ethical concerns were highlighted, where potential risks and harms may arise to AI-powered product development. Based on the responses received, the guidance consisting of six measures that reflect expected standards of conduct by market intermediaries and asset managers using AI is provided. Moreover, as the use of AI evolves in line with technological advances, the regulatory framework will need to be updated in tandem to address new emerging risks. And finally, any data-specific solution should inevitably align with GDPR principles (The European Commission, 2016, 2019). According to Tang (2019), adopting AI may violate GDPR provisions concerning two data-related rights, automated decision-making and the right to erasure, and two GDPR principles, i.e., transparency and data minimization.
As market intermediaries and institutional asset managers are developing solutions and products based on AI innovations, there is an increasing need to create and use AI-specific standards, which are now at a very conceptual level. Investment businesses are generally regulated at four levels: financial service providers as companies, product structure, product sales, and markets. As AI standardization is still in its early stages, we may only hypothesize that we expect an update of transparency regulation at the product level. For example, already today, a UCITS fund “should not invest in financial indices whose methodology for the selection and the rebalancing of the components is not based on a set of pre-determined rules and objective criteria” according to ESMA guidelines (ESMA, 2014, par. 58). This excludes dynamically learned rules from an AI system to create an index suitable as a reference underlying. Furthermore, we expect updated regulation at the market level. The FCA report (FCA, 2018) reviews excellent and bad algorithmic trading practices. MiFID II addresses algorithmic trading, but ESMA (2021) points out “that the use of algorithms which only serve to inform a trader of a particular investment opportunity is not considered as algorithmic trading, provided that the execution is not algorithmic”. Regulators prefer human oversight and judgement to fully automated systems. We speculate future regulation might require explainable AI concepts to enable humans to realize this oversight better.
So, it seems that much work still has to be done to retain control and safety, maintain trust and ethics, and comply with accountability and regulation. Ultimately, it may be concluded that the success of AI applications for portfolio management, and more generally, the products and services provided in the financial sector, will be only guaranteed if all these AI-related principles are harmonized.
KS: Writing—original draft, Writing—review & editing. PS: Writing—original draft, Writing—review & editing. CS: Writing—original draft, Writing—review & editing. LL: Writing—original draft, Writing—review & editing. MM: Writing—original draft, Writing—review & editing. PL: Writing—original draft, Writing—review & editing. AK: Writing—original draft, Writing—review & editing. CT: Writing—original draft, Writing—review & editing. BO: Writing—original draft, Writing—review & editing. JC: Writing—original draft, Writing—review & editing.
This publication is based upon work from COST Action 19130—Fintech and Artificial Intelligence in Finance—Toward a transparent financial industry, supported by COST (European Cooperation in Science and Technology), www.cost.eu. Open access funding by Zurich University of Applied Sciences (ZHAW).
The authors declare that the research was conducted in the absence of any commercial or financial relationships that could be construed as a potential conflict of interest.
All claims expressed in this article are solely those of the authors and do not necessarily represent those of their affiliated organizations, or those of the publisher, the editors and the reviewers. Any product that may be evaluated in this article, or claim that may be made by its manufacturer, is not guaranteed or endorsed by the publisher.
Aboussalah, A. M., and Lee, C.-G. (2020). Continuous control with stacked deep dynamic recurrent reinforcement learning for portfolio optimization. Expert Syst. Appl. 140:112891. doi: 10.1016/j.eswa.2019.112891
Alipour, E., Adolphs, C., Zaribafiyan, A., and Rounds, M. (2016). Quantum-Inspired Hierarchical Risk Parity. Vancouver, BC: White paper, 1Qbit.
Alvarez-Ramirez, J., Rodriguez, E., and Espinosa-Paredes, G. (2012). Is the us stock market becoming weakly efficient over time? evidence from 80-year-long data. Phys. A 391, 5643–5647. doi: 10.1016/j.physa.2012.06.051
Andersson, K., and Oosterlee, C. W. (2021). Deep learning for CVA computations of large portfolios of financial derivatives. Appl. Math. Comput. 409:126399. doi: 10.1016/j.amc.2021.126399
Ankrim, E. M., and Hensel, C. R. (1994). Multicurrency performance attribution. Finan. Anal. J. 50, 29–35. doi: 10.2469/faj.v50.n2.29
Aouni, B. (2009). Multi-attribute portfolio selection: new perspectives. Inf. Syst. Operat. Res. J. 47, 1–4. doi: 10.3138/infor.47.1.1
Aouni, B. (2010). Portfolio selection through the goal programming model: an overview. J. Finan. Decis. Mak. 6, 3–15.
Aouni, B., Colapinto, C., and Torre, D. L. (2008). Solving Stochastic Multi-objective Programming in Portfolio Selection Through the GP model. Departmental Working Papers 2008–18. Department of Economics, Management and Quantitative Methods at Università degli Studi di Milano. Available online at: https://ideas.repec.org/p/mil/wpdepa/2008-18.html
Araci, D. (2019). FinBERT: financial sentiment analysis with pre-trained language models. arXiv Preprint arXiv: 1908.10063.
Aragon, G. O., and Ferson, W. E. (2006). Portfolio performance evaluation. Found. Trends Finan. 2, 83–190. doi: 10.1561/0500000015
Armananzas, R., and Lozano, J. A. (2005). “A multiobjective approach to the portfolio optimization problem,” in 2005 IEEE Congress on Evolutionary Computation, Vol. 2 (Vienna: IEEE), 1388–1395.
Arnold, T. B., and Tibshirani, R. J. (2016). Efficient implementations of the generalized lasso dual path algorithm. J. Comput. Graph. Stat. 25, 1–27. doi: 10.1080/10618600.2015.1008638
Arras, L., Osman, A., and Samek, W. (2022). Clevr-xai: a benchmark dataset for the ground truth evaluation of neural network explanations. Inf. Fus. 81, 14–40. doi: 10.1016/j.inffus.2021.11.008
Arrieta, A. B., Díaz-Rodríguez, N., Del Ser, J., Bennetot, A., Tabik, S., Barbado, A., et al. (2020). Explainable artificial intelligence (XAI): concepts, taxonomies, opportunities and challenges toward responsible AI. Inf. Fus. 58, 82–115. doi: 10.1016/j.inffus.2019.12.012
Asgharian, H., Hou, A. J., and Javed, F. (2013). The importance of the macroeconomic variables in forecasting stock return variance: a garch-midas approach. J. Forecast. 32, 600–612. doi: 10.1002/for.2256
Asness, C. S., Frazzini, A., and Pedersen, L. H. (2012). Leverage aversion and risk parity. Finan. Anal. J. 68, 47–59. doi: 10.2469/faj.v68.n1.1
Austin, M. J. (1986). Futures fund performance: a test of the effectiveness of technical analysis. J. Fut. Mark. 6, 175–185. doi: 10.1002/fut.3990060202
Bacon, C. R. (2019). Performance Attribution: History and Progress. New York, NY: CFA Institute Research Foundation.
Bailey, J. V., Richards, T. M., and Tierney, D. E. (2007). Managing Investment Portfolios: A Dynamic Process, Chapter Evaluating Portfolio Performance. New Jersey, NJ: John Wiley & Sons, NJ, 717–782.
Baker, H. K., and Filbeck, G. (2013). Portfolio Theory and Management, chapter Portfolio Theory and Management: Overview. Oxford: Oxford University Press, 20.
Balduzzi, P., and Robotti, C. (2008). Mimicking portfolios, economic risk premia, and tests of multi-beta models. J. Bus. Econ. Stat. 26, 354–368. doi: 10.1198/073500108000000042
Ballings, M., Van den Poel, D., Hespeels, N., and Gryp, R. (2015). Evaluating multiple classifiers for stock price direction prediction. Expert Syst. Appl. 42, 7046–7056. doi: 10.1016/j.eswa.2015.05.013
Bansal, R., Dahlquist, M., and Harvey, C. R. (2004). Dynamic trading strategies and portfolio Choice. doi: 10.3386/w10820
Barbopoulos, L., Dai, R., Putnins, T., and Saunders, A. (2021). Market efficiency in the age of machine learning. SSRN Electron. J. doi: 10.2139/ssrn.3783221
Bartram, S. M., Branke, J., and Motahari, M. (2020). Artificial Intelligence in Asset Management. New York, NY: CFA Institute Research Foundation.
Bartram, S. M., Branke, J., Rossi, G. D., and Motahari, M. (2021). Machine learning for active portfolio management. J. Finan. Data Sci. 3, 9–30. doi: 10.3905/jfds.2021.1.071
Battiston, S., Farmer, J. D., Flache, A., Garlaschelli, D., Haldane, A. G., Heesterbeek, H., et al. (2016). Complexity theory and financial regulation. Science 351, 818–819. doi: 10.1126/science.aad0299
Becker, S., Cheridito, P., and Jentzen, A. (2019). Deep optimal stopping. J. Mach. Learn. Res. 20, 1–25. Available online at: https://jmlr.org/papers/volume20/18-232/18-232.pdf
Beer, F., Estes, J., and Munte, H. (2011). The performance of faith and ethical investment products: an empirical investigation of the last decade. J. Acad. Bus. Econ. 30, 101–124. Available online at: https://api.semanticscholar.org/CorpusID:153256066
Beketov, M., Lehmann, K., and Wittke, M. (2018). Robo advisors: quantitative methods inside the robots. J. Asset Manag. 19, 363–370. doi: 10.1057/s41260-018-0092-9
Benhamou, E., Ohana, J.-J., Saltiel, D., and Guez, B. (2021a). Explainable ai (xai) models applied to planning in financial markets. SSRN Electron. J. doi: 10.2139/ssrn.3862437
Benhamou, E., Saltiel, D., Ohana, J., Atif, J., and Laraki, R. (2021b). “Deep reinforcement learning for portfolio allocation,” in Machine Learning and Knowledge Discovery in Databases. Applied Data Science and Demo Track. ECML PKDD 2020. Lecture Notes in Computer Science, eds Y. Dong, G. Ifrim, D. Mladenić, C. Saunders, and S. Van Hoecke (Exeter: Springer), 12461.
Bertrand, P., and Prigent, J.-L. (2005). Portfolio insurance strategies: Obpi versus cppi. Finance 26, 5–32. doi: 10.2139/ssrn.299688
Bertrand, P., and Prigent, J.-L. (2022). On the Diversification and Rebalancing Returns: Performance Comparison of Constant Mix Versus Buy-and-Hold Strategies. Portfolio Insurance Strategies: OBPI Versus CPPI (December 1, 2001). University of CERGY Working Paper No. 2001–30, GREQAM Working Paper (Marseille: Groupe de Recherche en Economie Quantitative D'Aix Marseille). Available online at: https://ssrn.com/abstract=299688
Bianchi, M., and Briere, M. (2021a). Augmenting Investment Decisions with Robo-Advice. TSE Working Papers 21-1251. Toulouse: Toulouse School of Economics (TSE).
Bianchi, M., and Briere, M. (2021b). Robo-advising: less AI and more XAI? SSRN Electron. J. doi: 10.2139/ssrn.3825110
Biswas, S., Bandyopadhyay, G., Guha, B., and Bhattacharjee, M. (2019). An ensemble approach for portfolio selection in a multi-criteria decision making framework. Decis. Mak. 2, 138–158. doi: 10.31181/dmame2003079b
Black, F., and Litterman, R. B. (1991). Asset allocation. J. Fixed Income 1, 7–18. doi: 10.3905/jfi.1991.408013
Bonanno, G., Caldarelli, G., Lillo, F., Micciche, S., Vandewalle, N., and Mantegna, R. N. (2004). Networks of equities in financial markets. Eur. Phys. J. B 38, 363–371. doi: 10.1140/epjb/e2004-00129-6
Bouchaud, J. P., and Potters, M. (2003). Theory of Financial Risk and Derivative Pricing: From Statistical Physics to Risk Management, 2nd Edn. Cambridge: Cambridge University Press.
Boudabsa, L., and Filipović, D. (2022). Machine learning with kernels for portfolio valuation and risk management. Finan. Stoch. 26, 131–172. doi: 10.1007/s00780-021-00465-4
Branke, J., Scheckenbach, B., Stein, M., Deb, K., and Schmeck, H. (2009). Portfolio optimization with an envelope-based multi-objective evolutionary algorithm. Eur. J. Oper. Res. 199, 684–693. doi: 10.1016/j.ejor.2008.01.054
Brans, J. (1982). L'ingénierie de la décision: élaboration d'instruments d'aide á la décision. La méthode PROMETHEE. Quebec: Presses de l'Université Laval.
Brida, J., and Risso, W. (2009). Dynamics and structure of the 30 largest north american companies. Soc. Comp. Econ. 35, 85–99. doi: 10.1007/s10614-009-9187-1
Brinson, G. P., and Fachler, N. (1985). Measuring non-us equity portfolio performance. J. Portf. Manag. 11, 73–76. doi: 10.3905/jpm.1985.409005
Brinson, G. P., Hood, L. R., and Beebower, G. L. (1995). Determinants of portfolio performance. Finan. Anal. J. 51, 133–138. doi: 10.2469/faj.v51.n1.1869
Brinson, G. P., Singer, B. D., and Beebower, G. L. (1991). Determinants of portfolio performance ii: an update. Finan. Anal. J. 47, 40–48. doi: 10.2469/faj.v47.n3.40
Brogaard, J., and Zareei, A. (2021). “Machine learning and the stock market,” in Proceedings of Paris December 2020 Finance Meeting EUROFIDAI-ESSEC (Paris).
Bun, J., Bouchaud, J. P., and Potters, M. (2017). Cleaning large correlation matrices: tools from random matrix theory. Phys. Rep. 666, 1–109. doi: 10.1016/j.physrep.2016.10.005
Campbell, J., Lo, A., MacKinlay, A. C., and Whitelaw, R. F. (1998). The econometrics of financial markets. Macroecon. Dyn. 2, 559–562. doi: 10.1017/S1365100598009092
Cepni, O., Güney, I. E., and Swanson, N. R. (2019). Nowcasting and forecasting gdp in emerging markets using global financial and macroeconomic diffusion indexes. Int. J. Forecast. 35, 555–572. doi: 10.1016/j.ijforecast.2018.10.008
Cesari, R. (2011). The Algebra of Portfolio Dynamics. Available online at: https://ssrn.com/abstract=1931750
Chang, T.-J., Meade, N., Beasley, J. E., and Sharaiha, Y. M. (2000). Heuristics for cardinality constrained portfolio optimisation. Comp. Operat. Res. 27, 1271–1302. doi: 10.1016/S0305-0548(99)00074-X
Chaves, D., Hsu, J., Li, F., and Shakernia, O. (2011). Risk parity portfolio vs. other asset allocation heuristic portfolios. J. Invest. 20:108. doi: 10.3905/joi.2011.20.1.108
Chen, F., Qian, M., Sun, P.-W., and Yu, B. (2018a). In search for managerial skills beyond common performance measures. J. Bank. Finan. 86, 224–239. doi: 10.1016/j.jbankfin.2015.12.008
Chen, J., Cheng, M., and Courage, A. (2020). Rebalancing. Available online at: https://www.investopedia.com/terms/r/rebalancing.asp
Chen, Y., Kelly, B., and Wu, W. (2020). Sophisticated investors and market efficiency: evidence from a natural experiment. J. Financ. Econ. 138, 316–341. doi: 10.1016/j.jfineco.2020.06.004
Chen, Y., Wei, Z., and Huang, X. (2018b). “Incorporating corporation relationship via graph convolutional neural networks for stock price prediction,” in Proceedings of the 27th ACM International Conference on Information and Knowledge Management (Torino), 1655–1658.
Chou, S., Hsu, H., and Yang, C. (1997). A stock selection dss combining ai and technical analysis. Ann. Operat. Res. 75, 335–353. doi: 10.1023/A:1018923916424
Colson, G. (1985). “Theories of risk and mcdm,” in Multiple Criteria Decision Methods and Applications: Selected Readings of the First International Summer School Acireale, Sicily, September 1983, eds G. Fandel, and J. Spronk (Berlin, Heidelberg: Springer Berlin Heidelberg), 171–196.
Cong, L., Tang, K., Wang, J., and Zhang, Y. (2020). Alphaportfolio for investment and economically interpretable ai. SSRN Electron. J. doi: 10.2139/ssrn.3554486
Conway, J. J. E. (2018). Artificial Intelligence and Machine Learning: Current Applications in Real Estate. Available online at: https://dspace.mit.edu/handle/1721.1/120609/ (accessed August 8, 2023).
Coqueret, G., and Guida, T. (2018). Stock returns and the cross-section of characteristics: a tree-based approach. SSRN Electron. J. doi: 10.2139/ssrn.3169773
Costa, G., and Kwon, R. H. (2019). Risk parity portfolio optimization under a markov regime-switching framework. Quant. Finan. 19, 453–471. doi: 10.1080/14697688.2018.1486036
Crama, Y., and Schyns, M. (2003). Simulated annealing for complex portfolio selection problems. Eur. J. Oper. Res. 150, 546–571. doi: 10.1016/S0377-2217(02)00784-1
Cvitanić, J., Polimenis, V., and Zapatero, F. (2008). Optimal portfolio allocation with higher moments. Ann. Finan. 4, 1–28. doi: 10.1007/s10436-007-0071-5
D'Acunto, F., and Rossi, A. G. (2020). Robo-Advising. CESifo Working Paper Series 8225. Munich: CESifo.
Dalio, R. (2004). Engineering Targeted Returns and Risk. Westport, CT: Bridgewater Associates. Available online at: https://bridgewater.brightspotcdn.com/fa/e3/d09e72bd401a8414c5c0bdaf88bb/bridgewater-associates-engineering-targeted-returns-and-risks-aug-2011.pdf
Daryanani, G. (2008). Opportunistic rebalancing: a new paradigm for wealth managers. J. Finan. Plann. 21. Available online at: https://www.financialplanningassociation.org/sites/default/files/2020-05/9%20Opportunistic%20Rebalancing%20A%20New%20Paradigm%20for%20Wealth%20Managers.pdf
Dash, A., Singh, A., Jain, A., Shukla, A., Mishra, H., Vyas, P., et al. (2023). “Stock price analysis and prediction using seq2seq lstm,” in Proceedings of International Conference on Data Analytics and Insights, ICDAI 2023, eds N. Chaki, N. D. Roy, P. Debnath, and K. Saeed (Singapore: Springer Nature), 655–666.
Dayanandan, A., and Lam, M. (2015). Portfolio rebalancing-hype or hope? J. Bus. Inq. 14, 79–92. Available online at: https://api.semanticscholar.org/CorpusID:41883789
Delce, T. (2019). When efficient market hypothesis meets hayek on information: beyond a methodological reading. J. Econ. Methodol. 9, 37–58. doi: 10.1080/1350178X.2019.1675896
Dixon, M. F., Halperin, I., and Bilokon, P. (2020). Machine Learning in Finance: From Theory to Practice. Cham: Springer.
Doering, J., Kizys, R., Juan, A. A., Fitó, À., and Polat, O. (2019). Metaheuristics for rich portfolio optimisation and risk management: current state and future trends. Operat. Res. Perspect. 6:100121. doi: 10.1016/j.orp.2019.100121
Dor, A. B., and Jagannathan, R. (2002). Understanding Mutual Fund and Hedge Fund Styles Using Return Based Style Analysis. National Bureau of Economic Research.
Doshi-Velez, F., and Kim, B. (2017). Towards a rigorous science of interpretable machine learning. arxiv. doi: 10.48550/arXiv.1702.08608
Duan, Y., Edwards, J. S., and Dwivedi, Y. K. (2019). Artificial intelligence for decision making in the era of big data-evolution, challenges and research agenda. Int. J. Inf. Manage. 48, 63–71. doi: 10.1016/j.ijinfomgt.2019.01.021
Duarte, F. G., and De Castro, L. N. (2020). A framework to perform asset allocation based on partitional clustering. IEEE Access 8, 110775–110788. doi: 10.1109/ACCESS.2020.3001944
D'Urso, P., Cappelli, C., Di Lallo, D., and Massari, R. (2013). Clustering of financial time series. Phys. A 392, 2114–2129. doi: 10.1016/j.physa.2013.01.027
D'Urso, P., De Giovanni, L., and Massari, R. (2016). Garch-based robust clustering of time series. Fuzzy Sets Syst. 305, 1–28. doi: 10.1016/j.fss.2016.01.010
D'Urso, P., De Giovanni, L., and Massari, R. (2021). Trimmed fuzzy clustering of financial time series based on dynamic time warping. Ann. Operat. Res. 299, 1379–1395. doi: 10.1007/s10479-019-03284-1
D'Urso, P., Giovanni, L. D., Massari, R., D'Ecclesia, R. L., and Maharaj, E. A. (2020). Cepstral-based clustering of financial time series. Expert Syst. Appl. 161:113705. doi: 10.1016/j.eswa.2020.113705
Dwivedi, Y. K., Hughes, L., Ismagilova, E., Aarts, G., Coombs, C., Crick, T., et al. (2021). Artificial intelligence (AI): multidisciplinary perspectives on emerging challenges, opportunities, and agenda for research, practice and policy. Int. J. Inf. Manage. 57:101994. doi: 10.1016/j.ijinfomgt.2019.08.002
Eakins, S. G., and Stansell, S. R. (2007). An examination of alternative portfolio rebalancing strategies applied to sector funds. J. Asset Manag. 8, 1–8. doi: 10.1057/palgrave.jam.2250055
Ehrgott, M., Klamroth, K., and Schwehm, C. (2004). An mcdm approach to portfolio optimization. Eur. J. Oper. Res. 155, 752–770. doi: 10.1016/S0377-2217(02)00881-0
Elton, E. J., and Gruber, M. J. (1997). Modern portfolio theory, 1950 to date. J. Bank. Finan. 21, 1743–1759. doi: 10.1016/S0378-4266(97)00048-4
Emerson, S., Kennedy, R., O'Shea, L., and O'Brien, J. R. (2019). Trends and applications of machine learning in quantitative finance. Mach. Learn. eJ. Available online at: https://api.semanticscholar.org/CorpusID:198348785
Ertenlice, O., and Kalayci, C. B. (2018). A survey of swarm intelligence for portfolio optimization: algorithms and applications. Swarm Evol. Comp. 39, 36–52. doi: 10.1016/j.swevo.2018.01.009
ESMA (2014). Guidelines for Competent Authorities and Ucits Management Companies—Guidelines on Etfs and Other Ucits Issues. Available online at: https://www.esma.europa.eu/sites/default/files/library/2015/11/esma-2014-0011-01-00_en_0.pdf (accessed September 11, 2023).
ESMA (2021). Mifid II Review Report - Mifid II/Mifir Review Report on Algorithmic Trading. Available online at: https://www.esma.europa.eu/file/121044/download?token=3CWH3QwW (accessed September 11, 2023).
Fama, E. F. (1970). Efficient capital markets: a review of theory and empirical work. J. Finan. 25, 383–417. doi: 10.2307/2325486
Fama, E. F. (2021). Contract costs, stakeholder capitalism, and esg. Eur. Finan. Manag. 27, 189–195. doi: 10.1111/eufm.12297
Fama, E. F., and French, K. R. (1993). Common risk factors in the returns on stocks and bonds. J. Financ. Econ. 33, 3–56. doi: 10.1016/0304-405X(93)90023-5
Fama, E. F., and French, K. R. (2015). A five-factor asset pricing model. J. Financ. Econ. 116, 1–22. doi: 10.1016/j.jfineco.2014.10.010
FCA (2018). Algorithmic Trading Compliance in Wholesale Markets. Available online at: https://www.fca.org.uk/publication/multi-firm-reviews/algorithmic-trading-compliance-wholesale-markets.pdf (accessed September 19, 2023).
Feldman, T., Jung, A., and Klein, J. (2015). Buy and hold versus timing strategies: the winner is... J. Portf. Manag. 42, 110–118. doi: 10.3905/jpm.2015.42.1.110
Feng, G., Giglio, S., and Xiu, D. (2017). Taming the Factor Zoo: A Test of New Factors. Fama-Miller Working Paper. Cambridge, MA.
Feng, G., Giglio, S., and Xiu, D. (2020). Taming the factor zoo: a test of new factors. J. Finan. 75, 1327–1370. doi: 10.1111/jofi.12883
Fernandez, E., Navarro, J., Solares, E., and Coello, C. C. (2019). A novel approach to select the best portfolio considering the preferences of the decision maker. Swarm Evol. Comp. 46, 140–153. doi: 10.1016/j.swevo.2019.02.002
Fernandez, E., Navarro, J., Solares, E., and Coello, C. C. (2020). Using evolutionary computation to infer the decision maker's preference model in presence of imperfect knowledge: a case study in portfolio optimization. Swarm Evol. Comp. 54:100648. doi: 10.1016/j.swevo.2020.100648
Ferruz, L., and Vicente, L. (2005). Style portfolio performance: empirical evidence from the spanish equity funds. J. Asset Manag. 5, 397–409. doi: 10.1057/palgrave.jam.2240156
Ferson, W. E. (2013). Investment performance: a review and synthesis. Handb. Econ. Finan. 2, 969–1010. doi: 10.1016/B978-0-44-459406-8.00014-7
Fieldsend, J. E., Matatko, J., and Peng, M. (2004). “Cardinality constrained portfolio optimisation,” in International Conference on Intelligent Data Engineering and Automated Learning (Exeter: Springer), 788–793.
Fisher, J. D., and DAlessandro, J. (2019). Risk-adjusted attribution analysis of real estate portfolios. J. Portf. Manag. 45, 80–94. doi: 10.3905/jpm.2019.1.102
Forman, E. H., and Gass, S. I. (2001). The analytic hierarchy process—An exposition. Oper. Res. 49, 469–486. doi: 10.1287/opre.49.4.469.11231
Frahm, G., and Jaekel, U. (2005). Random matrix theory and robust covariance matrix estimation for financial data. arXiv Preprint.
Freyberger, J., Neuhierl, A., and Weber, M. (2018). Dissecting Characteristics Nonparametrically. Chicago„ IL: University of Chicago, Becker Friedman Institute for Economics Working Paper No. 2018–50.
Freyberger, J., Neuhierl, A., and Weber, M. (2020). Dissecting characteristics nonparametrically. Rev. Financ. Stud. 33, 2326–2377. doi: 10.1093/rfs/hhz123
Frunza, M.-C. (2016). “Chapter 3e - efficient market hypothesis testing,” in Solving Modern Crime in Financial Markets, ed M.-C. Frunza (Cambridge, MA: Academic Press), 303–310.
Fu, X., Du, J., Guo, Y., Liu, M., Dong, T., and Duan, X. (2018). A machine learning framework for stock selection. arXiv Preprint arXiv:1806.01743.
Gaivoronski, A. A., Krylov, S., and Van der Wijst, N. (2005). Optimal portfolio selection and dynamic benchmark tracking. Eur. J. Oper. Res. 163, 115–131. doi: 10.1016/j.ejor.2003.12.001
Galankashi, M. R., Rafiei, F. M., and Ghezelbash, M. (2020). Portfolio selection: a fuzzy-ANP approach. Finan. Innov. 6:17. doi: 10.1186/s40854-020-00175-4
Ghahtarani, A. (2021). A new portfolio selection problem in bubble condition under uncertainty: application of Z-number theory and fuzzy neural network. Expert Syst. Appl. 177:114944. doi: 10.1016/j.eswa.2021.114944
Ghasemieh, A., and Kashef, R. (2023). An enhanced wasserstein generative adversarial network with gramian angular fields for efficient stock market prediction during market crash periods. Appl. Intell. 53, 28479–28500. doi: 10.1007/s10489-023-05016-2
Giudici, P., Polinesi, G., and Spelta, A. (2022). Network models to improve robot advisory portfolios. Ann. Operat. Res. 313, 965–989. doi: 10.1007/s10479-021-04312-9
Golmakani, H. R., and Fazel, M. (2011). Constrained portfolio selection using particle swarm optimization. Expert Syst. Appl. 38, 8327–8335. doi: 10.1016/j.eswa.2011.01.020
Grace, A. (2017). Can Deep Learning Techniques Improve the Risk Adjusted Returns From Enhanced Indexing Investment Strategies (M.sc. thesis). Technological University Dublin. Available online at: https://arrow.tudublin.ie/scschcomdis/118/ (accessed February 17, 2023).
Graesser, L., and Keng, W. L. (2019). Foundations of Deep Reinforcement Learning: Theory and Practice in Python (Addison-Wesley Data & Analytics Series). Boston, MA: Addison-Wesley Professional.
Greig, A. C. (1992). Fundamental analysis and subsequent stock returns. J. Account. Econ. 15, 413–442. doi: 10.1016/0165-4101(92)90026-X
Grinblatt, M., and Titman, S. (1989). Portfolio performance evaluation: old issues and new insights. Rev. Financ. Stud. 2, 393–421. doi: 10.1093/rfs/2.3.393
Groen, J. J., and Kapetanios, G. (2016). Revisiting useful approaches to data-rich macroeconomic forecasting. Comp. Stat. Data Anal. 100, 221–239. doi: 10.1016/j.csda.2015.11.014
Gruszka, J., and Szwabiński, J. (2020). Best portfolio management strategies for synthetic and real assets. Phys. A 539:122938. doi: 10.1016/j.physa.2019.122938
Gu, S., Kelly, B., and Xiu, D. (2020). Empirical asset pricing via machine learning. Rev. Financ. Stud. 33, 2223–2273. doi: 10.1093/rfs/hhaa009
Guida, T., and Coqueret, G. (2018). “Ensemble learning applied to quant equity: gradient boosting in a multifactor framework,” in Big Data and Machine Learning in Quantitative Investment (John Wiley & Sons, Ltd), 129–148.
Hallerbach, W. G. (2015). “Advances in portfolio risk control,” in Risk Based Factor Investinging, ed E. Jurczenko (Elsevier), 1–30.
Haluszczynski, A., Laut, I., Modest, H., and Räth, C. (2017). Linear and nonlinear market correlations: characterizing financial crises and portfolio optimization. Phys. Rev. E 96:062315. doi: 10.1103/PhysRevE.96.062315
Harris, R. D., Nguyen, L. H., and Stoja, E. (2019). Systematic extreme downside risk. J. Int. Finan. Mark. Inst. Money 61, 128–142. doi: 10.1016/j.intfin.2019.02.007
Harvey, C. R., Liechty, J. C., Liechty, M. W., and Müller, P. (2010). Portfolio selection with higher moments. Quant. Finan. 10, 469–485. doi: 10.1080/14697681003756877
Hayou, S., Doucet, A., and Rousseau, J. (2019). “On the impact of the activation function on deep neural networks training,” in International Conference on Machine Learning (California, CA: PMLR), 2672–2680.
Heaton, J. B., Polson, N. G., and Witte, J. H. (2016). Deep learning for finance: deep portfolios. Appl. Stochast. Models Bus. Indus. 33, 3–12. doi: 10.2139/ssrn.2838013
Henriksson, R. (1984). Market timing and mutual fund performance: an empirical investigation. J. Bus. 57, 73–96. doi: 10.1086/296225
Henriksson, R., and Merton, R. (1981). On market timing and investment performance. ii. statistical procedures for evaluating forecasting skills. J. Bus. 54, 513–533. doi: 10.1086/296144
Hilliard, J. E., and Hilliard, J. (2015). A comparison of rebalanced and buy and hold portfolios: does monetary policy matter? Rev. Pac. Basin Finan. Mark. Policies 18:1550006. doi: 10.1142/S021909151550006X
Hirano, Y., Pichl, L., Eom, C., and Kaizoji, T. (2018). “Analysis of bitcoin market efficiency by using machine learning,” in CBU International Conference Proceedings, Vol. 6 (Prague), 175–180.
Hong, C. Y., Lu, X., and Pan, J. (2020). FinTech Adoption and Household Risk-Taking. NBER Working Papers 28063. Cambridge, MA: National Bureau of Economic Research, Inc.
Horn, M., and Oehler, A. (2020). Automated portfolio rebalancing: automatic erosion of investment performance? J. Asset Manag. 21, 489–505. doi: 10.1057/s41260-020-00183-0
Howard, J., and Ruder, S. (2018). Universal language model fine-tuning for text classification. arXiv Preprint arXiv:1801.06146.
Huang, K. (2022). DeepValue: a comparable framework for value-based strategy by machine learning. Comp. Econ. 60, 325–346. doi: 10.1007/s10614-021-10151-4
Huang, K. Y., and Jane, C.-J. (2009). A hybrid model for stock market forecasting and portfolio selection based on arx, grey system and rs theories. Exp. Syst. Appl. 36 (3, Part 1), 5387–5392. doi: 10.1016/j.eswa.2008.06.103
Hübner, G. (2005). The generalized treynor ratio. Rev. Finan. 9, 415–435. doi: 10.1007/s10679-005-2265-x
Hui, T.-K., and Kwan, E. (1994). International portfolio diversification: a factor analysis approach. Omega 22, 263–267. doi: 10.1016/0305-0483(94)90039-6
Hwang, C., and Yoon, K. (1981). Multiple Attribute Decision Making: Methods and Applications. New York, NY: Springer-Verlag.
Ilmanen, A., and Maloney, T. (2015). Portfolio Rebalancing Part 1 of 2: Strategic Asset Allocation. Greenwich, CT: AQR Portfolio Solutions Group.
Jaeger, M., Krügel, S., Marinelli, D., Papenbrock, J., and Schwendner, P. (2021). Interpretable machine learning for diversified portfolio construction. J. Finan. Data Sci. 3:66. doi: 10.3905/jfds.2021.1.066
Jensen, M. (1968). The performance of mutual funds in the period 1945-1964. J. Finan. 23, 389–416. doi: 10.1111/j.1540-6261.1968.tb00815.x
Jiang, Z., Ji, R., and Chang, K.-C. (2020). A machine learning integrated portfolio rebalance framework with risk-aversion adjustment. J. Risk Finan. Manag. 13:155. doi: 10.3390/jrfm13070155
Johannes, M., Korteweg, A., and Polson, N. (2014). Sequential learning, predictability, and optimal portfolio returns. J. Finan. 69, 611–644. doi: 10.1111/jofi.12121
Jones, S. K., and Stine, J. (2005). Constant mix portfolios and risk aversion. J. Finan. Counsel. Plann. 16. Available online at: https://ssrn.com/abstract=2248767
Joseph, A. (2020). Parametric inference with universal function approximators. arXiv Preprint arXiv:1903.04209.
Jourovski, A., Dubikovskyy, V., Adell, P., Ramakrishnan, R., and Kosowski, R. (2020). “Forecasting beta using machine learning and equity sentiment variables,” in Machine Learning for Asset Management (John Wiley & Sons, Ltd), 231–260.
Kaczmarek, T., and Perez, K. (2021). Building portfolios based on machine learning predictions. Econ. Res. 0, 1–19. doi: 10.1080/1331677X.2021.1875865
Kahneman, D., and Tversky, A. (1979). Prospect theory: an analysis of decision under risk. Econometrica 47, 263–291. doi: 10.2307/1914185
Kahneman, D., and Tversky, A. (2013). “Prospect theory: an analysis of decision under risk,” in Handbook of the Fundamentals of Financial Decision Making: Part I (Singapore: World Scientific), 99–127.
Kamble, R. A. (2017). “Short and long term stock trend prediction using decision tree,” in 2017 International Conference on Intelligent Computing and Control Systems (ICICCS) (Madurai), 1371–1375.
Kanuri, S., Malm, J., and Malhlotra, D. (2021). Is tactical allocation a winning strategy? J. Beta Invest. Strat. 12, 47–59. doi: 10.3905/jii.2021.1.105
Kellerer, H., and Maringer, D. (2003). Optimization of cardinality constrained portfolios with a hybrid local search algorithm. Or Spectr. 25, 481–495. doi: 10.1007/s00291-003-0139-1
Kelly, B., and Pruitt, S. (2013). Market expectations in the cross-section of present values. J. Finan. 68, 1721–1756. doi: 10.1111/jofi.12060
Kelly, B., and Pruitt, S. (2015). The three-pass regression filter: a new approach to forecasting using many predictors. J. Econ. 186, 294–316. doi: 10.1016/j.jeconom.2015.02.011
Khedmati, M., and Azin, P. (2020). An online portfolio selection algorithm using clustering approaches and considering transaction costs. Expert Syst. Appl. 159:113546. doi: 10.1016/j.eswa.2020.113546
Khoa, B. T., and Huynh, T. T. (2021). Is it possible to earn abnormal return in an inefficient market? An approach based on machine learning in stock trading. Comp. Intell. Neurosci. 2021:2917577. doi: 10.1155/2021/2917577
Kim, J. H., Shamsuddin, A., and Lim, K.-P. (2011). Stock return predictability and the adaptive markets hypothesis: evidence from century-long U.S. data. J. Emp. Finan. 18, 868–879. doi: 10.1016/j.jempfin.2011.08.002
Kirisci, M., and Cagcag Yolcu, O. (2022). A new cnn-based model for financial time series: taiex and ftse stocks forecasting. Neural Process. Lett. 54, 3357–3374. doi: 10.1007/s11063-022-10767-z
Kitces, M. E. (2015). An In-Depth Look at Portfolio Rebalancing Strategies. Washington, DC: Report, Kitces Reports.
Klein, A., Altuntas, O., Hausser, T., and Kessler, W. (2011). “Extracting investor sentiment from weblog texts: a knowledge-based approach,” in 2011 IEEE 13th Conference on Commerce and Enterprise Computing (Luxembourg: IEEE), 1–9.
Kok, N., Koponen, E.-L., and Martínez-Barbosa, C. A. (2017). Big data in real estate? From manual appraisal to automated valuation. J. Portf. Manag. 43, 202–211. doi: 10.3905/jpm.2017.43.6.202
Konno, H., and Suzuki, K.-I. (1995). A mean-variance-skewness portfolio optimization model. J. Operat. Res. Soc. Jpn, 38, 173–187. doi: 10.15807/jorsj.38.173
Konno, H., and Yamazaki, H. (1991). Mean-absolute deviation portfolio optimization model and its applications to tokyo stock market. Manage. Sci. 37, 519–531. doi: 10.1287/mnsc.37.5.519
Koratamaddi, P., Wadhwani, K., Gupta, M., and Sanjeevi, S. G. (2021). Market sentiment-aware deep reinforcement learning approach for stock portfolio allocation. Eng. Sci. Technol. 24, 848–859. doi: 10.1016/j.jestch.2021.01.007
Korzeniewski, J. (2018). Efficient stock portfolio construction by means of clustering. Acta Universitatis Lodziensis 1, 85–92. doi: 10.18778/0208-6018.333.06
Kozak, S., Nagel, S., and Santosh, S. (2020). Shrinking the cross-section. J. Financ. Econ. 135, 271–292. doi: 10.1016/j.jfineco.2019.06.008
Krauss, C., Do, X. A., and Huck, N. (2017). Deep neural networks, gradient-boosted trees, random forests: statistical arbitrage on the s&p 500. Eur. J. Oper. Res. 259, 689–702. doi: 10.1016/j.ejor.2016.10.031
Krink, T., and Paterlini, S. (2011). Multiobjective optimization using differential evolution for real-world portfolio optimization. Comp. Manag. Sci. 8, 157–179. doi: 10.1007/s10287-009-0107-6
Kuan, C.-M., Yeh, J.-H., and Hsu, Y.-C. (2009). Assessing value at risk with care, the conditional autoregressive expectile models. J. Econom. 150, 261–270. doi: 10.1016/j.jeconom.2008.12.002
Kubota, K., and Takehara, H. (2018). Does the fama and french five-factor model work well in japan? Int. Rev. Finan. 18, 137–146. doi: 10.1111/irfi.12126
Kumar, R. (2016). “3 - efficient capital markets and its implications,” in Valuation, ed R. Kumar (San Diego, CA: Academic Press), 73–91.
Kwapień, J., and Drożdż, S. (2012). Physical approach to complex systems. Phys. Rep. 515, 115–226. doi: 10.1016/j.physrep.2012.01.007
Laloux, L., Cizeau, P., Potters, M., and Bouchaud, J.-P. (2000). Random matrix theory and financial correlations. Int. J. Theoret. Appl. Finan. 3, 391–397. doi: 10.1142/S0219024900000255
Lalwani, V., and Chakraborty, M. (2019). Multi-factor asset pricing models in emerging and developed markets. Manag. Finan. 46, 360–380. doi: 10.1108/MF-12-2018-0607
LeCun, Y., Bengio, Y., and Hinton, G. (2015). Deep learning. Nature 521, 436–444. doi: 10.1038/nature14539
Lee, C.-C., and Lee, J.-D. (2009). Energy prices, multiple structural breaks, and efficient market hypothesis. Appl. Energy 86, 466–479. doi: 10.1016/j.apenergy.2008.10.006
Lee, C.-C., Lee, J.-D., and Lee, C.-C. (2010). Stock prices and the efficient market hypothesis: evidence from a panel stationary test with structural breaks. Japan World Econ. 22, 49–58. doi: 10.1016/j.japwor.2009.04.002
Lee, J., Bahri, Y., Novak, R., Schoenholz, S. S., Pennington, J., and Sohl-Dickstein, J. (2017). Deep neural networks as Gaussian processes. arXiv Preprint arXiv:1711.00165.
Lee, J., Koh, H., and Choe, H. (2021). Learning to trade in financial time series using high-frequency through wavelet transformation and deep reinforcement learning. Appl. Intell. 51, 6202–6223. doi: 10.1007/s10489-021-02218-4
Lee, M., and Seok, J. (2021). Estimation with uncertainty via conditional generative adversarial networks. Sensors 21:6194. doi: 10.3390/s21186194
Lee, S. I. (2020). Deeply equal-weighted subset portfolios. arXiv [preprint]. doi: 10.48550/arXiv.2006.14402
Lee, W. (2000). Theory and Methodology of Tactical Asset Allocation, Vol. 65. New Jersey, NJ: John Wiley & Sons.
Levy, H., and Hanoch, G. (1970). Relative effectiveness of efficiency criteria for portfolio selection. J. Finan. Quant. Anal. 5, 63–76. doi: 10.2307/2979007
Li, F. W., and Sun, C. (2022). Information acquisition and expected returns: evidence from EDGAR search traffic. J. Econ. Dyn. Control 141, 104384. doi: 10.1016/j.jedc.2022.104384
Li, J. (2015). Sparse and stable portfolio selection with parameter uncertainty. J. Bus. Econ. Stat. 33, 381–392. doi: 10.1080/07350015.2014.954708
Li, R., Wang, X. W., Yan, Z., and Zhao, Y. (2019a). Sophisticated investor attention and market reaction to earnings announcements: evidence from the sec's edgar log files. J. Behav. Finan. 20, 490–503. doi: 10.1080/15427560.2019.1575829
Li, X., Liang, C., and Ma, F. (2022a). Forecasting stock market volatility with a large number of predictors: new evidence from the ms-midas-lasso model. Ann. Operat. Res. 1–40.
Li, X., Wei, Y., Chen, X., Ma, F., Liang, C., and Chen, W. (2022b). Which uncertainty is powerful to forecast crude oil market volatility? New evidence. Int. J. Finan. Econ. 27, 4279–4297. doi: 10.1002/ijfe.2371
Li, Y., Jiang, X.-F., Tian, Y., Li, S.-P., and Zheng, B. (2019b). Portfolio optimization based on network topology. Phys. A 515, 671–681. doi: 10.1016/j.physa.2018.10.014
Liagkouras, K. (2019). A new three-dimensional encoding multiobjective evolutionary algorithm with application to the portfolio optimization problem. Knowl. Based Syst. 163, 186–203. doi: 10.1016/j.knosys.2018.08.025
Liesiö, J., Salo, A., Keisler, J. M., and Morton, A. (2021). Portfolio decision analysis: recent developments and future prospects. Eur. J. Oper. Res. 293, 811–825. doi: 10.1016/j.ejor.2020.12.015
Lim, Q. Y. E., Cao, Q., and Quek, C. (2022). Dynamic portfolio rebalancing through reinforcement learning. Neural Comp. Appl. 34, 7125–7139. doi: 10.1007/s00521-021-06853-3
Linardatos, P., Papastefanopoulos, V., and Kotsiantis, S. (2021). Explainable ai: a review of machine learning interpretability methods. Entropy 23:e23010018. doi: 10.3390/e23010018
Lintner, J. (1965). Security prices, risk, and maximal gains from diversification*. J. Finan. 20, 587–615. doi: 10.1111/j.1540-6261.1965.tb02930.x
Liu, F., and Wang, R. (2021). A theory for measures of tail risk. Math. Operat. Res. 46, 1109–1128. doi: 10.1287/moor.2020.1072
Liu, X., Zhou, X., Zhu, B., and Wang, P. (2020). Measuring the efficiency of China's carbon market: a comparison between efficient and fractal market hypotheses. J. Clean. Prod. 271:122885. doi: 10.1016/j.jclepro.2020.122885
Lo, A. W. (2004). The adaptive markets hypothesis. J. Portf. Manag. 30, 15–29. doi: 10.3905/jpm.2004.442611
Lo, A. W. (2017a). Adaptive Markets: Financial Evolution at the Speed of Thought, chapter The Adaptive Markets Hypothesis. Princeton, NJ: Princeton University Press, 176–221
Lo, A. W. (2017b). The New Palgrave Dictionary of Economics, chapter Efficient Markets Hypothesis. London: Palgrave Macmillan, 1–17.
Long, W., Song, L., and Tian, Y. (2019). A new graphic kernel method of stock price trend prediction based on financial news semantic and structural similarity. Expert Syst. Appl. 118, 411–424. doi: 10.1016/j.eswa.2018.10.008
López de Prado, M. (2016). Building diversified portfolios that outperform out of sample. J. Portf. Manag. 42, 59–69. doi: 10.3905/jpm.2016.42.4.059
Lu, X., Ma, F., Wang, J., and Wang, J. (2020). Examining the predictive information of cboe ovx on China's oil futures volatility: Evidence from ms-midas models. Energy 212:118743. doi: 10.1016/j.energy.2020.118743
Lundberg, S. M., Erion, G. G., and Lee, S.-I. (2018). Consistent individualized feature attribution for tree ensembles. arXiv [preprint]. doi: 10.48550/arXiv.1802.03888
Lundberg, S. M., and Lee, S.-I. (2017). “A unified approach to interpreting model predictions,” in Proceedings of the 31st International Conference on Neural Information Processing Systems, NIPS'17 (Red Hook, NY: Curran Associates Inc.), 4768–4777.
Lwin, K., Qu, R., and Kendall, G. (2014). A learning-guided multi-objective evolutionary algorithm for constrained portfolio optimization. Appl. Soft Comput. 24, 757–772. doi: 10.1016/j.asoc.2014.08.026
Ma, M., and Yang, J. (2021). A novel finite-time q-power recurrent neural network and its application to uncertain portfolio model. Neurocomputing 461, 137–146. doi: 10.1016/j.neucom.2021.07.036
Maillard, S., Roncalli, T., and Teïletche, J. (2010). The properties of equally weighted risk contribution portfolios. J. Portf. Manag. 36, 60–70. doi: 10.3905/jpm.2010.36.4.060
Malandri, L., Xing, F. Z., Orsenigo, C., Vercellis, C., and Cambria, E. (2018). Public mood–driven asset allocation: the importance of financial sentiment in portfolio management. Cognit. Comput. 10, 1167–1176. doi: 10.1007/s12559-018-9609-2
Malladi, R., and Fabozzi, F. J. (2017). Equal-weighted strategy: why it outperforms value-weighted strategies? Theory and evidence. J. Asset Manag. 18, 188–208. doi: 10.1057/s41260-016-0033-4
Mansini, R., Ogryczak, W., and Speranza, M. G. (2014). Twenty years of linear programming based portfolio optimization. Eur. J. Oper. Res. 234, 518–535. doi: 10.1016/j.ejor.2013.08.035
Mantegna, R. (1999a). Hierarchical structure in financial markets. Eur. Phys. J. B 11, 193–197. doi: 10.1007/s100510050929
Mantegna, R. N., and Stanley, H. E. (1999). Introduction to Econophysics: Correlations and Complexity in Finance. Cambridge: Cambridge University Press.
Mardani, A., Jusoh, A., Nor, K. M., Khalifah, Z., Zakwan, N., and Valipour, A. (2015). Multiple criteria decision-making techniques and their applications—A review of the literature from 2000 to 2014. Econ. Res. 28, 516–571. doi: 10.1080/1331677X.2015.1075139
Mariani, F., Polinesi, G., and Recchioni, M. C. (2022). A tail-revisited markowitz mean-variance approach and a portfolio network centrality. Comp. Manag. Sci. 19, 425–455. doi: 10.1007/s10287-022-00422-2
Markowitz, H. (1952). Portfolio selection. J. Finance 7, 77–91. doi: 10.1111/j.1540-6261.1952.tb01525.x
Marsilli, C. (2014). Variable Selection in Predictive Midas Models. Working papers. Paris: Banque de France.
Marti, G., Nielsen, F., Bi'nkowski, M., and Donnat, P. (2017). A review of two decades of correlations, hierarchies, networks and clustering in financial markets. arXiv. doi: 10.48550/arXiv.1703.00485
Matsunaga, D., Suzumura, T., and Takahashi, T. (2019). Exploring graph neural networks for stock market predictions with rolling window analysis. arXiv [preprint]. doi: 10.48550/arXiv.1909.10660
McNamara, J. R. (1998). Portfolio selection using stochastic dominance criteria. Decis. Sci. 29, 785–801. doi: 10.1111/j.1540-5915.1998.tb00877.x
Messmer, M., and Audrino, F. (2020). The Lasso and the Factor Zoo-Expected Returns in the Cross-Section. Available online at: https://ssrn.com/abstract=2930436
Metaxiotis, K., and Liagkouras, K. (2012). Multiobjective evolutionary algorithms for portfolio management: a comprehensive literature review. Expert Syst. Appl. 39, 11685–11698. doi: 10.1016/j.eswa.2012.04.053
Meucci, A. (2009). “Managing diversification” in Risk. Bloomberg Education & Quantitative Research and Education Paper, 74–79. Available online at: https://ssrn.com/abstract=1358533
Michaud, R. O. (1998). Efficient Asset Management: A Practical Guide to Stock Portfolio Optimization and Asset Allocation. Financial Management Association Survey and Synthesis Series. Brighton, MA: Harvard Business School Press.
Milgrom, P. R., and Tadelis, S. (2018). “How artificial intelligence and machine learning can impact market design,” in The Economics of Artificial Intelligence: An Agenda (Chicago, IL: University of Chicago Press), 567–585.
Mills, E. F. E. A., Baafi, M. A., Amowine, N., and Zeng, K. (2020). A hybrid grey mcdm approach for asset allocation: evidence from China's shanghai stock exchange. J. Bus. Econ. Manag. 21, 446–472. doi: 10.3846/jbem.2020.11967
Min, L., Dong, J., Liu, J., and Gong, X. (2021). Robust mean-risk portfolio optimization using machine learning-based trade-off parameter. Appl. Soft Comput. 113:107948. doi: 10.1016/j.asoc.2021.107948
Mirete-Ferrer, P. M., Garcia-Garcia, A., Baixauli-Soler, J. S., and Prats, M. A. (2022). A review on machine learning for asset management. Risks 10:84. doi: 10.3390/risks10040084
Mishev, K., Gjorgjevikj, A., Vodenska, I., Chitkushev, L. T., and Trajanov, D. (2020). Evaluation of sentiment analysis in finance: from lexicons to transformers. IEEE Access 8, 131662–131682. doi: 10.1109/ACCESS.2020.3009626
Modigliani, F., and Modigliani, L. (1997). Risk-adjusted performance. J. Portf. Manag. 23, 45–54. doi: 10.3905/jpm.23.2.45
Mohagheghi, V., Mousavi, S. M., Antuchevičienė, J., and Mojtahedi, M. (2019). Project portfolio selection problems: a review of models, uncertainty approaches, solution techniques, and case studies. Technol. Econ. Dev. Econ. 25, 1380–1412. doi: 10.3846/tede.2019.11410
Mohanty, S. S. (2019). Does one model fit all in global equity markets? Some insight into market factor based strategies in enhancing alpha. Int. J. Finan. Econ. 24, 1170–1192. doi: 10.1002/ijfe.1710
Moody, J., Wu, L., Liao, Y., and Saffell, M. (1998). Performance functions and reinforcement learning for trading systems and portfolios. J. Forecast. 17, 441–470. doi: 10.1002/(SICI)1099-131X(1998090)17:5/6<441::AID-FOR707>3.3.CO;2-R
Mootha, S., Sridhar, S., Seetharaman, R., and Chitrakala, S. (2020). “Stock price prediction using bi-directional lstm based sequence to sequence modeling and multitask learning,” in 2020 11th IEEE Annual Ubiquitous Computing, Electronics & Mobile Communication Conference (UEMCON) (New York, NY), 0078–0086.
Mosoeu, S., and Kodongo, O. (2020). The Fama-French five-factor asset pricing model and emerging markets equity returns. Q. Rev. Econ. Finan. doi: 10.2139/ssrn.3377918
Mukherji, S., Dhatt, M. S., and Kim, Y. H. (1997). A fundamental analysis of Korean stock returns. Finan. Anal. J. 53, 75–80. doi: 10.2469/faj.v53.n3.2086
Munhoz Arantes, R. F., and Cesar Ribeiro Carpinetti, L. (2019). “Group decision making techniques for risk assessment: a literature review and research directions,” in 2019 IEEE International Conference on Fuzzy Systems (FUZZ-IEEE) (New Orleans, LA), 1–6.
Nanda, S. R., Mahanty, B., and Tiwari, M. K. (2010). Clustering Indian stock market data for portfolio management. Exp. Syst. Appl. 37, 8793–8798. doi: 10.1016/j.eswa.2010.06.026
Neves, J., Silva, P., and Vasconcellos, C. (2017). Maximization of utility and portfolio selection models. Cadernos IME 11:29731. doi: 10.12957/cadmat.2017.29731
Ng, D. T. K., Leung, J. K. L., Chu, S. K. W., and Qiao, M. S. (2021). Conceptualizing AI literacy: an exploratory review. Comp. Educ. 2:100041. doi: 10.1016/j.caeai.2021.100041
Nicolo Musmeci, T. M., and Tomaso, A. (2014). Clustering and hierarchy of financial markets data: advantages of the DBHT. arXiv Preprint abs/1406.0496.
Niu, X., Niu, X., and Wu, K. (2021). Implicit government guarantees and the externality of portfolio diversification: a complex network approach. Phys. A 572:125908. doi: 10.1016/j.physa.2021.125908
Nuzzo, S., and Morone, A. (2017). Asset markets in the lab: a literature review. J. Behav. Exp. Finan. 13, 42–50. doi: 10.1016/j.jbef.2017.02.006
Ogryczak, W. (2000). Multiple criteria linear programming model for portfolio selection. Ann. Operat. Res. 97, 143–162. doi: 10.1023/A:1018980308807
Oh, K. J., Kim, T. Y., and Min, S. (2005). Using genetic algorithm to support portfolio optimization for index fund management. Expert Syst. Appl. 28, 371–379. doi: 10.1016/j.eswa.2004.10.014
Oliveira, N., Cortez, P., and Areal, N. (2017). The impact of microblogging data for stock market prediction: using Twitter to predict returns, volatility, trading volume and survey sentiment indices. Expert Syst. Appl. 73, 125–144. doi: 10.1016/j.eswa.2016.12.036
Onnela, J.-P., Chakraborti, A., Kaski, K., Kertesz, J., and Kanto, A. (2003). Dynamics of market correlations: taxonomy and portfolio analysis. Phys. Rev. E 68:056110. doi: 10.1103/PhysRevE.68.056110
Onnela, J.-P., Chakraborti, A., Kaski, K., and Kertiész, J. (2002). Dynamic asset trees and portfolio analysis. Eur. Phys. J. B 30, 285–288. doi: 10.1140/epjb/e2002-00380-9
Orito, Y., Yamamoto, H., and Yamazaki, G. (2003). Index fund selections with genetic algorithms and heuristic classifications. Comp. Ind. Eng. 45, 97–109. doi: 10.1016/S0360-8352(03)00020-2
Ozbayoglu, A. M., Gudelek, M. U., and Sezer, O. B. (2020). Deep learning for financial applications: a survey. Appl. Soft Comput. 93:106384. doi: 10.1016/j.asoc.2020.106384
Packham, N., Papenbrock, J., Schwendner, P., and Wöbbeking, F. (2017). Tail-risk protection trading strategies. Quant. Finan. 17, 729–744. doi: 10.1080/14697688.2016.1249512
Papenbrock, J., and Schwendner, P. (2015). Handling risk-on/risk-off dynamics with correlation regimes and correlation networks. Financ. Mark. Portf. Manag. 29, 125–147. doi: 10.1007/s11408-015-0248-2
Papenbrock, J., Schwendner, P., Jaeger, M., and Krügel, S. (2021). Matrix evolutions: Synthetic correlations and explainable machine learning for constructing robust investment portfolios. J. Finan. Data Sci. 3:56. doi: 10.3905/jfds.2021.1.056
Partovi, M. H., and Caputo, M. (2004). Principal portfolios: recasting the efficient frontier. Econ. Bull. 7, 1–10. Available online at: https://ssrn.com/abstract=2248767
Pedersen, L. H., Fitzgibbons, S., and Pomorski, L. (2020). Responsible investing: the ESG-efficient frontier. NYU Stern Sch. Bus. doi: 10.2139/ssrn.3466417
Peralta, G., and Zareei, A. (2016). A network approach to portfolio selection. J. Emp. Finan. 38, 157–180. doi: 10.1016/j.jempfin.2016.06.003
Perold, A. F., and Sharpe, W. F. (1988). Dynamic strategies for asset allocation. Finan. Anal. J. 44, 16–27. doi: 10.2469/faj.v44.n1.16
Perold, A. F., and Sharpe, W. F. (1995). Dynamic strategies for asset allocation. Finan. Anal. J. 51, 149–160. doi: 10.2469/faj.v51.n1.1871
Petropoulos, A., and Siakoulis, V. (2021). Can central bank speeches predict financial market turbulence? Evidence from an adaptive nlp sentiment index analysis using xgboost machine learning technique. Central Bank Rev. 21, 141–153. doi: 10.1016/j.cbrev.2021.12.002
Philps, D., Tilles, D., and Law, T. (2021). Interpretable, transparent, and auditable machine learning: an alternative to factor investing. J. Finan. Data Sci. 3, 84–100. doi: 10.3905/jfds.2021.1.077
Pinches, G. E. (1970). The random walk hypothesis and technical analysis. Finan. Anal. J. 26, 104–110. doi: 10.2469/faj.v26.n2.104
Polamuri, S. R., Srinivas, K., and Mohan, A. K. (2021). Multi-model generative adversarial network hybrid prediction algorithm (MMGAN-HPA) for stock market prices prediction. J. King Saud Univ. 34, 7433–7444. doi: 10.1016/j.jksuci.2021.07.001
Poncela, P., Rodríguez, J., Sánchez-Mangas, R., and Senra, E. (2011). Forecast combination through dimension reduction techniques. Int. J. Forecast. 27, 224–237. doi: 10.1016/j.ijforecast.2010.01.012
Potì, V., Levich, R., and Conlon, T. (2020). Predictability and pricing efficiency in forward and spot, developed and emerging currency markets. J. Int. Money Finan. 107:102223. doi: 10.1016/j.jimonfin.2020.102223
Potters, M., Bouchaud, J. P., and Laloux, L. (2005). Financial applications of random matrix theory: old places and new pieces. arXiv Preprint arXiv:0507111.
Pozzi, F., Di Matteo, T., and Aste, T. (2013). Spread of risk across financial markets: better to invest in the peripheries. Sci. Rep. 3, 1–7. doi: 10.1038/srep01665
Prenio, J., and Yong, J. (2021). Humans Keeping Ai in Check-Emerging Regulatory Expectations in the Financial Sector. Basel: Bank for International Settlements; Financial Stability Institute.
PWc (2018). Explainable Ai Driving Business Value Through Greater Understanding. Baltimore, MD. Available online at: https://www.pwc.co.uk/audit-assurance/assets/explainable-ai.pdf
Qian, E. (2005). Risk Parity Portfolios: Efficient Portfolios Through True Diversification. Boston, MA: PanAgora Asset Management. Available online at: https://www.panagora.com/assets/PanAgora-Risk-Parity-Portfolios-Efficient-Portfolios-Through-True-Diversification.pdf
Qu, B., Zhou, Q., Xiao, J., Liang, J., and Suganthan, P. (2017). Large-scale portfolio optimization using multiobjective evolutionary algorithms and preselection methods. Math. Prob. Eng. 2017:4197914. doi: 10.1155/2017/4197914
Raffinot, T. (2017). Hierarchical clustering-based asset allocation. J. Portf. Manag. 44, 89–99. doi: 10.3905/jpm.2018.44.2.089
Rao, A. (2021). How a Portfolio Approach to Ai Helps Your Roi. Technical Report. Baltimore, MD: PWc.
Rather, A. M. (2021). Lstm-based deep learning model for stock prediction and predictive optimization model. EURO J. Decis. Process. 9:100001. doi: 10.1016/j.ejdp.2021.100001
Rebonato, R., and Denev, A. (2014). Portfolio Management Under Stress: A Bayesian-Net Approach to Coherent Asset Allocation, Chapter Diversification and stability in the Black—Litterman Model (Cambridge: Cambridge University Press), 83–91.
Ren, F., Lu, Y.-N., Li, S.-P., Jiang, X.-F., Zhong, L.-X., and Qiu, T. (2017). Dynamic portfolio strategy using clustering approach. PLoS ONE 12:e0169299. doi: 10.1371/journal.pone.0169299
Robiyanto, R. (2018). Performance evaluation of stock price indexes in the indonesia stock exchange. Int. Res. J. Bus. Stud. 10, 173–182. doi: 10.21632/irjbs.10.3.173-182
Roll, R., and Ross, S. A. (1980). An empirical investigation of the arbitrage pricing theory. J. Finan. 35, 1073–1103. doi: 10.1111/j.1540-6261.1980.tb02197.x
Ross, S. A. (1976). The arbitrage theory of capital asset pricing. J. Econ. Theory 13, 341–360. doi: 10.1016/0022-0531(76)90046-6
Rossi, A. G., and Utkus, S. P. (2020). Who benefits from robo-advising? Evidence from machine learning. FinPlanRN. doi: 10.2139/ssrn.3552671
Roy, B. (1968). Classement et choix en présence de points de vue multiples (la méthode electre). La Revue d'Informatique et de Recherche Opérationelle 8, 57–75. doi: 10.1051/ro/196802V100571
Rudin, C., and Radin, J. (2019). Why are we using black box models in AI when we don't need to? A lesson from an explainable AI competition. Harvard Data Sci. Rev. 1. doi: 10.1162/99608f92.5a8a3a3d
Saaty, T. L. (1996). Decision Making with Dependence and Feedback: The Analytic Network Process. Pittsburgh, PA: RWS Publications.
Sadon, A. N., Ismail, S., Jafri, N. S., and Shaharudin, S. M. (2021). “Long short-term vs gated recurrent unit recurrent neural network for google stock price prediction,” in 2021 2nd International Conference on Artificial Intelligence and Data Sciences (AiDAS) (IPOH), 1–5.
Samarakoon, L., and Hasan, T. (2013). Encyclopedia of Finance, Chapter Portfolio Performance Evaluation. New York, NY: Springer International Publishing, 471–475.
Samarakoon, L. P., and Hasan, T. (2022). Methods for Portfolio Performance Evaluation. New York, NY: Springer Books, 983–990.
Sánchez-Granero, M., Balladares, K., Ramos-Requena, J., and Trinidad-Segovia, J. (2020). Testing the efficient market hypothesis in latin american stock markets. Phys. A 540:123082. doi: 10.1016/j.physa.2019.123082
Sarmas, E., Xidonas, P., and Doukas, H. (2020). “Multicriteria portfolio construction with Python,” in Springer Optimization and Its Applications (New York, NY: Springer International Publishing), 163.
Schaerf, A. (2002). Local search techniques for constrained portfolio selection problems. Comp. Econ. 20, 177–190. doi: 10.1023/A:1020920706534
Schmid, T., Hildesheim, W., Holoyad, T., and Schumacher, K. (2021). The ai methods, capabilities and criticality grid. Künstliche Intelligenz 35, 425–440. doi: 10.1007/s13218-021-00736-4
Schuetz, M. J., Brubaker, J. K., and Katzgraber, H. G. (2022). Combinatorial optimization with physics-inspired graph neural networks. Nat. Mach. Intell. 4, 367–377. doi: 10.1038/s42256-022-00468-6
Schwendner, P., Papenbrock, J., Jaeger, M., and Krügel, S. (2021). Adaptive seriational risk parity and other extensions for heuristic portfolio construction using machine learning and graph theory. J. Finan. Data Sci. 3, 65–83. doi: 10.3905/jfds.2021.1.078
Scott, R., and Horvath, P. (1980). On the direction of preference for moments of higher order than the variance. J. Finan. 35, 915–919. doi: 10.1111/j.1540-6261.1980.tb03509.x
Sharpe, W. F. (1964). Capital asset prices: a theory of market equilibrium under conditions of risk. J. Finan. 19, 425–442. doi: 10.1111/j.1540-6261.1964.tb02865.x
Sharpe, W. F. (1977). “The capital asset pricing model: a “multi-beta” interpretation,” in Financial Dec Making Under Uncertainty, eds H. Levy and M. Sarnat (Academic Press), 127–135.
Shiller, R. J. (2003). From efficient markets theory to behavioral finance. J. Econ. Perspect. 17, 83–104. doi: 10.1257/089533003321164967
Shukla, M. A., Bhoomika, M., Supreeth, M. M. J., and Sreenivasa, B. (2022). Financial portfolio enhancement using machine learning and artificial intelligence. J. Android IOS Appl. Test. 7, 7–11. doi: 10.46610/JoAAT.2022.v07i02.002
Shyur, H.-J., and Shih, H.-S. (2006). A hybrid mcdm model for strategic vendor selection. Math. Comput. Model. 44, 749–761. doi: 10.1016/j.mcm.2005.04.018
Siami-Namini, S., Tavakoli, N., and Siami Namin, A. (2018). “A comparison of arima and lstm in forecasting time series,” in 2018 17th IEEE International Conference on Machine Learning and Applications (ICMLA) (Orlando, FL), 1394–1401.
Silva, A., Neves, R., and Horta, N. (2015). A hybrid approach to portfolio composition based on fundamental and technical indicators. Expert Syst. Appl. 42, 2036–2048. doi: 10.1016/j.eswa.2014.09.050
Sinha, A., Kedas, S., Kumar, R., and Malo, P. (2022). Sentfin 1.0: Entity-aware sentiment analysis for financial news. J. Assoc. Inf. Sci. Technol. 73, 1314–1335. doi: 10.1002/asi.24634
Solares, E., Coello, C. A. C., Fernandez, E., and Navarro, J. (2019). Handling uncertainty through confidence intervals in portfolio optimization. Swarm Evol. Comp. 44, 774–787. doi: 10.1016/j.swevo.2018.08.010
Soleimani, H., Golmakani, H. R., and Salimi, M. H. (2009). Markowitz-based portfolio selection with minimum transaction lots, cardinality constraints and regarding sector capitalization using genetic algorithm. Expert Syst. Appl. 36, 5058–5063. doi: 10.1016/j.eswa.2008.06.007
Soleymani, F., and Paquet, E. (2021). Deep graph convolutional reinforcement learning for financial portfolio management-DeepPocket. Expert Syst. Appl. 182:115127. doi: 10.1016/j.eswa.2021.115127
Soleymani, F., and Vasighi, M. (2020). Efficient portfolio construction by means of cvar and k-means++ clustering analysis: evidence from the nyse. Int. J. Finan. Econ. doi: 10.1002/ijfe.2344
Song, W.-M., di Matteo, T., and Aste, T. (2012). Hierarchical information clustering by means of topologically embedded graphs. PLoS ONE 7:e0031929. doi: 10.1371/journal.pone.0031929
Statista (2021). Robo-Advisor Worldwide Highlights. Available online at: https://www.statista.com/outlook/dmo/fintech/digital-investment/robo-advisors/worldwide (accessed March 15, 2023).
Steinbach, M. C. (2001). Markowitz revisited: Mean-variance models in financial portfolio analysis. SIAM Rev. 43, 31–85. doi: 10.1137/S0036144500376650
Steuer, R. E., Qi, Y., and Hirschberger, M. (2008). Handbook of Financial Engineering, Chapter Portfolio Selection in the Presence of Multiple Criteria (Boston, MA: Springer US), 24.
Stock, J. H., and Watson, M. W. (1989). New indexes of coincident and leading economic indicators. NBER Macroecon. Ann. 4, 351–394. doi: 10.1086/654119
Stock, J. H., and Watson, M. W. (1998). Diffusion indexes. Working Paper 6702, Cambridge, MA: National Bureau of Economic Research.
Stock, J. H., and Watson, M. W. (2002). Forecasting using principal components from a large number of predictors. J. Am. Stat. Assoc. 97, 1167–1179. doi: 10.1198/016214502388618960
Streichert, F., Ulmer, H., and Zell, A. (2004). “Evolutionary algorithms and the cardinality constrained portfolio optimization problem,” in Operations Research Proceedings 2003 (Heidelberg: Springer), 253–260.
Sun, R., Jiang, Z., and Su, J. (2021). “A deep residual shrinkage neural network-based deep reinforcement learning strategy in financial portfolio management,” in 2021 IEEE 6th International Conference on Big Data Analytics (ICBDA) (Xiamen), 76–86.
Sutton, R. S., and Barto, A. G. (2018). Reinforcement Learning: An Introduction. Cambridge, MA: MIT Press.
Symitsi, E., and Stamolampros, P. (2021). Employee sentiment index: Predicting stock returns with online employee data. Expert Syst. Appl. 182:115294. doi: 10.1016/j.eswa.2021.115294
Szepesvári, C. (2010). Algorithms for Reinforcement Learning, Vol. 4. San Rafael, CA: Morgan & Claypool Publishers Series.
Ta, V.-D., Liu, C.-M., and Tadesse, D. A. (2020). Portfolio optimization-based stock prediction using long-short term memory network in quantitative trading. Appl. Sci. 10:437. doi: 10.3390/app10020437
Takeuchi, L., and Lee, Y.-Y. A. (2013). Applying Deep Learning to Enhance Momentum Trading Strategies in Stocks. Technical Report. Stanford, CA: Stanford University.
Talbi, E.-G. (2009). Metaheuristics: From Design to Implementation, Vol. 74. New Jersey, NJ: John Wiley & Sons.
Tamplin, T. (2023). Risk-Adjusted Return: Definition, Methods, Factors, & Limitations. Available online at: https://www.financestrategists.com/wealthmanagement/investment-risk/risk-adjusted-return/ (accessed December 6, 2022).
Tan, P.-N., Steinbach, M., and Kumar, V. (2005). Introduction to Data Mining Addison-Wesley. Reading, MA: Pearson Education Limited, 487–559.
Tang, A. (2019). Making ai gdpr compliant. ISACA J. 5, 1–6. Available online at: https://www.isaca.org/resources/isaca-journal/issues/2019/volume-5/making-ai-gdpr-compliant
Thaler, R. H. (1999). The end of behavioral finance. Finan. Anal. J. 55, 12–17. doi: 10.2469/faj.v55.n6.2310
The Bank of England and the Financial Conduct Authority (2022). Artificial Intelligence Public-Private Forum. London.
The Board of the International Organization of Securities Commissions (2021). The Use of Artificial Intelligence and Machine learnIng by Market Intermediaries and Asset Managers. Madrid.
Thethi, J. K., Pandit, A., Patel, H., and Shirsath, V. (2021). Stock market prediction and portfolio management using ml techniques. Int. J. Eng. Res. Technol. 9. doi: 10.17577/IJERTCONV9IS03090
Tibshirani, R. J., and Taylor, J. (2011). The solution path of the generalized lasso. Ann. Stat. 39, 1335–1371. doi: 10.1214/11-AOS878
Tokat, Y., and Wicas, N. W. (2007). Portfolio rebalancing in theory and practice. J. Investing. 16, 52–59. doi: 10.3905/joi.2007.686411
Tola, V., Lillo, F., Gallegati, M., and Mantegna, R. N. (2008). Cluster analysis for portfolio optimization. J. Econ. Dyn. Control 32, 235–258. doi: 10.1016/j.jedc.2007.01.034
Toreini, E., Aitken, M., Coopamootoo, K., Elliott, K., Zelaya, C. G., and van Moorsel, A. (2020). “The relationship between trust in ai and trustworthy machine learning technologies,” in Proceedings of the 2020 Conference on Fairness, Accountability, and Transparency, FAT* '20 (New York, NY: Association for Computing Machinery), 272–283.
Treynor, J. L. (1962). Jack Treynor's ‘Toward a Theory of Market Value of Risky Assets?. Econ. Model.
Treynor, J. L., and Black, F. (1973). How to use security analysis to improve portfolio selection. J. Bus. 46, 66–86. doi: 10.1086/295508
Tsai, C. S.-Y. (2001). Rebalancing diversified portfolios of various risk profiles. J. Finan. Plann. 14, 104. Available online at: https://www.proquest.com/openview/1549ccc01a8fc7a5aaf6fcf55ed448a2/1?pq-origsite=gscholar&cbl=4849
Tu, W., Yang, M., Cheung, D. W., and Mamoulis, N. (2018). Investment recommendation by discovering high-quality opinions in investor based social networks. Inf. Syst. 78, 189–198. doi: 10.1016/j.is.2018.02.011
Tuba, M., and Bacanin, N. (2014). Artificial bee colony algorithm hybridized with firefly algorithm for cardinality constrained mean-variance portfolio selection problem. Appl. Math. Inf. Sci. 8:2831. doi: 10.12785/amis/080619
Tumminello, M., Aste, T., Di Matteo, T., and Mantegna, R. N. (2005). A tool for filtering information in complex systems. Proc. Nat. Acad. Sci. U. S. A. 102, 10421–10426. doi: 10.1073/pnas.0500298102
Tumminello, M., Di Matteo, T., Aste, T., and Mantegna, R. N. (2006). Correlation based networks of equity returns sampled at different time horizons. Eur. Phys. J. B 55, 209–217. doi: 10.1140/epjb/e2006-00414-4
Turcaßs, F. M., Dumiter, F., Braica, A., Brezeanu, P., and Opret͡, A. (2016). Using technical analysis for portfolio selection and post-investment analysis. Econ. Comp. Econ. Cybernet. Stud. Res. 50, 197–214. Available online at: https://api.semanticscholar.org/CorpusID:157633836
U.S. Department of Justice Office of Public Affairs (2015). Futures Trader Charged With Illegally Manipulating Stock Market, Contributing to the May 2010 Market “flash crash? (Washington, DC).
Vamvakaris, M. D., Pantelous, A. A., and Zuev, K. (2017). “Chapter 22 - investors' behavior on s&p 500 index during periods of market crashes: a visibility graph approach,” in Handbook of Investors' Behavior During Financial Crises, eds F. Economou, K. Gavriilidis, G. N. Gregoriou, and V. Kallinterakis (Cambridge, MA: Academic Press), 401–417.
Velu, R., and Zhou, G. (1999). Testing multi-beta asset pricing models. J. Emp. Finan. 6, 219–241. doi: 10.1016/S0927-5398(99)00002-X
Venturelli, D., and Kondratyev, A. (2019). Reverse quantum annealing approach to portfolio optimization problems. Quant. Mach. Intell. 1, 17–30. doi: 10.1007/s42484-019-00001-w
Verma, M., and Hirpara, M. J. R. (2016). Performance evaluation of portfolio using the sharpe, jensen, and treynor methods. Sch. J. Econ. Bus. Manag. 3, 382–390. doi: 10.21276/sjebm.2016.3.7.4
Vetschera, R., and Almeida, A. T. D. (2012). A promethee-based approach to portfolio selection problems. Comp. Operat. Res. 39, 1010–1020. doi: 10.1016/j.cor.2011.06.019
Viriato, J. C. (2019). Ai and machine learning in real estate investment. J. Portf. Manag. 45, 43–54. doi: 10.3905/jpm.2019.45.7.043
Vo, N. N., He, X., Liu, S., and Xu, G. (2019). Deep learning for decision making and the optimization of socially responsible investments and portfolio. Decis. Support Syst. 124:113097. doi: 10.1016/j.dss.2019.113097
Waldow, F., Schnaubelt, M., Krauss, C., and Fischer, T. G. (2021). Machine learning in futures markets. J. Risk Finan. Manag. 14:119. doi: 10.3390/jrfm14030119
Wei, J., Yang, Y., Jiang, M., and Liu, J. (2021). Dynamic multi-period sparse portfolio selection model with asymmetric investors' sentiments. Expert Syst. Appl. 177:114945. doi: 10.1016/j.eswa.2021.114945
Weigel, E. J. (1991). The performance of tactical asset allocation. Finan. Anal. J. 47, 63–70. doi: 10.2469/faj.v47.n5.63
Welch, I., and Goyal, A. (2007). A comprehensive look at the empirical performance of equity premium prediction. Rev. Financ. Stud. 21, 1455–1508. doi: 10.1093/rfs/hhm014
Weng, L., Sun, X., Xia, M., Liu, J., and Xu, Y. (2020). Portfolio trading system of digital currencies: a deep reinforcement learning with multidimensional attention gating mechanism. Neurocomputing 402, 171–182. doi: 10.1016/j.neucom.2020.04.004
Wilford, D. S. (2012). True markowitz or assumptions we break and why it matters. Rev. Finan. Econ. 21, 93–101. doi: 10.1016/j.rfe.2012.06.003
Wu, M.-E., Syu, J.-H., Lin, J. C.-W., and Ho, J.-M. (2021). Portfolio management system in equity market neutral using reinforcement learning. Appl. Intell. 51, 8119–8131. doi: 10.1007/s10489-021-02262-0
Wu, X., Ye, Q., Hong, H., and Li, Y. (2020). Stock selection model based on machine learning with wisdom of experts and crowds. IEEE Intell. Syst. 35, 54–64. doi: 10.1109/MIS.2020.2973626
Xidonas, P., Mavrotas, G., and Psarras, J. (2009). A multicriteria methodology for equity selection using financial analysis. Comp. Operat. Res. 36, 3187–3203. doi: 10.1016/j.cor.2009.02.009
Xing, F. Z., Cambria, E., and Welsch, R. E. (2018). Intelligent asset allocation via market sentiment views. IEEE Comp. Intell. Mag. 13, 25–34. doi: 10.1109/MCI.2018.2866727
Xu, H., Cao, D., and Li, S. (2022). A self-regulated generative adversarial network for stock price movement prediction based on the historical price and tweets. Knowl. Based Syst. 247:108712. doi: 10.1016/j.knosys.2022.108712
Yan, X., Bai, J., Li, X., and Chen, Z. (2022). Can dimensional reduction technology make better use of the information of uncertainty indices when predicting volatility of chinese crude oil futures? Resour. Policy 75:102521. doi: 10.1016/j.resourpol.2021.102521
Yao, J., Tan, C. L., and Poh, H.-L. (1999). Neural networks for technical analysis: a study on klci. Int. J. Theoret. Appl. Finan. 2, 221–241. doi: 10.1142/S0219024999000145
Yeo, L. L. X., Cao, Q., and Quek, C. (2023). Dynamic portfolio rebalancing with lag-optimised trading indicators using serofam and genetic algorithms. Expert Syst. Appl. 216:119440. doi: 10.1016/j.eswa.2022.119440
Yu, P. L. (1973). A class of solutions for group decision problems. Manag. Sci. 19, 936–946. doi: 10.1287/mnsc.19.8.936
Zandieh, M., and Mohaddesi, S. O. (2019). Portfolio rebalancing under uncertainty using meta-heuristic algorithm. Int. J. Operat. Res. 36, 12–39. doi: 10.1504/IJOR.2019.102068
Zhang, J., Cui, S., Xu, Y., Li, Q., and Li, T. (2018). A novel data-driven stock price trend prediction system. Expert Syst. Appl. 97, 60–69. doi: 10.1016/j.eswa.2017.12.026
Zhang, K., Zhong, G., Dong, J., Wang, S., and Wang, Y. (2019). Stock market prediction based on generative adversarial network. Proc. Comp. Sci. 147, 400–406. doi: 10.1016/j.procs.2019.01.256
Zhang, R., Yi, C., and Chen, Y. (2020). “Explainable machine learning for regime-based asset allocation,” in Proceedings - 2020 IEEE International Conference on Big Data, Big Data 2020 (Atlanta, GA), 5480–5485.
Zhao, L., Li, L., and Zheng, X. (2020). A BERT based sentiment analysis and key entity detection approach for online financial texts. arXiv arXiv:2001.05326. doi: 10.48550/arXiv.2001.05326
Zherebtsov, A. A., and Kuperin, Y. A. (2003). Application of self-organizing maps for clustering Djia and Nasdaq100 portfolios. arXiv Preprint arXiv:0305330.
Zhu, H., Wang, Y., Wang, K., and Chen, Y. (2011). Particle swarm optimization (pso) for the constrained portfolio optimization problem. Expert Syst. Appl. 38, 10161–10169. doi: 10.1016/j.eswa.2011.02.075
Zhu, Y., and Kavee, R. C. (1988). Performance of portfolio insurance strategies. J. Portf. Manag. 14, 48. doi: 10.3905/jpm.1988.409161
Zilbering, Y., Jaconetti, C. M., and Kinniry Jr, F. M. (2015). Best Practices for Portfolio Rebalancing. Valley Forge, PA: The Vanguard Group.
Keywords: portfolio, asset allocation, artificial intelligence, machine learning, optimization, rebalancing, explainability, regulation
Citation: Sutiene K, Schwendner P, Sipos C, Lorenzo L, Mirchev M, Lameski P, Kabasinskas A, Tidjani C, Ozturkkal B and Cerneviciene J (2024) Enhancing portfolio management using artificial intelligence: literature review. Front. Artif. Intell. 7:1371502. doi: 10.3389/frai.2024.1371502
Received: 16 January 2024; Accepted: 12 March 2024;
Published: 08 April 2024.
Edited by:
Arianna Agosto, University of Pavia, ItalyReviewed by:
Gloria Polinesi, Marche Polytechnic University, ItalyCopyright © 2024 Sutiene, Schwendner, Sipos, Lorenzo, Mirchev, Lameski, Kabasinskas, Tidjani, Ozturkkal and Cerneviciene. This is an open-access article distributed under the terms of the Creative Commons Attribution License (CC BY). The use, distribution or reproduction in other forums is permitted, provided the original author(s) and the copyright owner(s) are credited and that the original publication in this journal is cited, in accordance with accepted academic practice. No use, distribution or reproduction is permitted which does not comply with these terms.
*Correspondence: Peter Schwendner, cGV0ZXIuc2Nod2VuZG5lckB6aGF3LmNo
Disclaimer: All claims expressed in this article are solely those of the authors and do not necessarily represent those of their affiliated organizations, or those of the publisher, the editors and the reviewers. Any product that may be evaluated in this article or claim that may be made by its manufacturer is not guaranteed or endorsed by the publisher.
Research integrity at Frontiers
Learn more about the work of our research integrity team to safeguard the quality of each article we publish.