
94% of researchers rate our articles as excellent or good
Learn more about the work of our research integrity team to safeguard the quality of each article we publish.
Find out more
ORIGINAL RESEARCH article
Front. Artif. Intell. , 28 June 2024
Sec. Machine Learning and Artificial Intelligence
Volume 7 - 2024 | https://doi.org/10.3389/frai.2024.1304483
 Sushant Agarwal1,2*
 Sanjay Saxena3
 Alessandro Carriero4
 Gian Luca Chabert5
 Gobinath Ravindran6
 Sudip Paul7John R. Laird8Deepak Garg9Mostafa Fatemi10Lopamudra Mohanty11,12Arun K. Dubey13Rajesh Singh14
 Mostafa M. Fouda15
 Narpinder Singh16Subbaram Naidu17Klaudija Viskovic18Melita Kukuljan19Manudeep K. Kalra20
 Luca Saba5
 Jasjit S. Suri15,21,22,23*
Background and novelty: When RT-PCR is ineffective in early diagnosis and understanding of COVID-19 severity, Computed Tomography (CT) scans are needed for COVID diagnosis, especially in patients having high ground-glass opacities, consolidations, and crazy paving. Radiologists find the manual method for lesion detection in CT very challenging and tedious. Previously solo deep learning (SDL) was tried but they had low to moderate-level performance. This study presents two new cloud-based quantized deep learning UNet3+ hybrid (HDL) models, which incorporated full-scale skip connections to enhance and improve the detections.
Methodology: Annotations from expert radiologists were used to train one SDL (UNet3+), and two HDL models, namely, VGG-UNet3+ and ResNet-UNet3+. For accuracy, 5-fold cross-validation protocols, training on 3,500 CT scans, and testing on unseen 500 CT scans were adopted in the cloud framework. Two kinds of loss functions were used: Dice Similarity (DS) and binary cross-entropy (BCE). Performance was evaluated using (i) Area error, (ii) DS, (iii) Jaccard Index, (iii) Bland–Altman, and (iv) Correlation plots.
Results: Among the two HDL models, ResNet-UNet3+ was superior to UNet3+ by 17 and 10% for Dice and BCE loss. The models were further compressed using quantization showing a percentage size reduction of 66.76, 36.64, and 46.23%, respectively, for UNet3+, VGG-UNet3+, and ResNet-UNet3+. Its stability and reliability were proved by statistical tests such as the Mann–Whitney, Paired t-Test, Wilcoxon test, and Friedman test all of which had a p < 0.001.
Conclusion: Full-scale skip connections of UNet3+ with VGG and ResNet in HDL framework proved the hypothesis showing powerful results improving the detection accuracy of COVID-19.
SARS-CoV-2 is an infectious illness and a severe acute respiratory syndrome coronavirus 2 that has affected nearly 677 million individuals and killed 6.7 million people all over the world. On March 11, 2020, the World Health Organization (WHO) declared COVID-19 a worldwide epidemic, the novel coronavirus disease. COVID-19 is a fast-growing disease with inadequate hospital resources (WHO, 2022). During COVID-19, numerous molecular pathways (Saba et al., 2020) shown evidence of myocardial damage (Cau et al., 2021a), diabetes (Viswanathan et al., 2021), pulmonary embolism (Cau et al., 2021b), vascular damage (Khanna et al., 2022), and thrombosis (Fanni et al., 2021). Early, quick, and accurate identification of COVID-19 sickness is crucial to saving lives and protecting frontline workers due to the absence of a proper vaccine or medication. One of the gold standards for COVID-19 detection is RT-PCR, commonly known as “reverse transcription-polymerase chain reaction” (Gibson et al., 1996; Bustin et al., 2005). Furthermore, there is a need for new detection techniques due to the RT-PCR test’s slowness and low sensitivity (Fang et al., 2020). Because of superior sensitivity and repeatability in the diagnosis of COVID-19, imaging-based diagnosis such as chest X-ray (Nillmani et al., 2022), and computed tomography (CT) are becoming more popular in diagnosing and controlling COVID-19 infection (Sluimer et al., 2006; Saba and Suri, 2013; Giannitto et al., 2020; Cau et al., 2021c).
Healthcare imaging research and development have increased as a result of computer-aided diagnosis using machine learning (ML) (Suri and Rangayyan, 2006; Shrivastava et al., 2015) and artificial intelligence (AI) (Winston, 1992; Ramesh et al., 2004; Hamet and Tremblay, 2017). The potential benefit of AI to mimic manual delineation has speeded up the identification and diagnosis of illnesses (Molinari et al., 2007; Acharya et al., 2011, 2012a,b, 2013a,b,c; Pareek et al., 2013; Biswas et al., 2018a, 2019; Saba et al., 2019, 2021; Agarwal et al., 2021). AI techniques have tried to precisely duplicate the human brain using neural networks. This makes them capable of resolving imaging-related problems. Feature extraction, classification, and segmentation are all completely automated using deep layers in deep learning (DL), a subfield of AI (Ker et al., 2017; Litjens et al., 2017; Shen et al., 2017; Razzak et al., 2018; Fourcade and Khonsari, 2019; Hesamian et al., 2019; Zhou et al., 2019).
The primary imaging benefit of CT (Saba and Suri, 2013; Pathak et al., 2020; Wu X. et al., 2020) imaging is the ability to detect anomalies such as consolidation, ground-glass opacity (GGO) (Salehi et al., 2020; Cozzi et al., 2021), and other opacities that can be detected in the CT for a COVID-19 patient (Xie et al., 2020). Most chest CT lung scans frequently contain the GGO abnormality (Gozes et al., 2020; Yang et al., 2020; Shalbaf and Vafaeezadeh, 2021; Cau et al., 2021c). Most radiologists evaluate COVID-19 lesions using judgmental and semantic approaches due to time restraints and the vast volume of data. Additionally, the human and semi-automated evaluations take a lot of time, sluggish, and subjective (Alqudah et al., 2020; Xu et al., 2020; Aslan et al., 2021; Wu et al., 2021). As a result, to increase the timeliness of diagnosis for early COVID-19 sickness, rapid and error-free detection and real-time prognosis solutions are needed.
Several studies have been tried for COVID-19 lesion segmentation. They have been categorized into non-UNet-based solutions such as Ding et al. (2021), and UNet-based solutions (Hou et al., 2021; Lizzi et al., 2021; Paluru et al., 2021). A slight deviation from UNet was Generative Adversarial Network (GAN) by Zhang et al. (2020) and DR-MIL model by Qi et al. (2021). The challenges with these models were their low Dice Similarity Coefficient (DSC) in their prediction systems. Further, these techniques do leverage on the hybrid nature of the DL system design, nor there was an attempt to model them in the cloud-based framework or a reduction in the AI model size framework. A detailed analysis of previous methods will be discussed in a benchmarking subsection in the Discussion section.
To overcome the shortcomings of low DSC in the prediction, we proposed two HDL-based on UNet3+ framework. These models required less training data to achieve higher prediction scores. Further, we designed these HDL models in (a) a quantization framework for reduced model size and (b) in cloud-based settings. Thus, the following are the study’s primary contributions: (i) COVLIAS 3.0 was designed for the cloud and uses a quantized hybrid of Solo DL (SDL) and Hybrid DL (HDL) to target the lesion location for quicker segmentation. Annotations from one expert radiologist were used to train UNet3+ and two HDL models, namely VGG-UNet3+ and ResNet-UNet3+. (ii) A cohort of 3,500 CT scans chosen from a set of 45 COVID-19-positive patients for cross-validation using a 5-fold (K5) technique. (iii) A 500-image dataset that had never been seen before was used to validate the system. (iv) The computation of Area Error, Dice Similarity, Jaccard Index, Bland–Altman Plots, and Correlation Coefficient Plots comprised the performance evaluation systems. (v) Using quantization to reduce the storage space and prediction time of the final models. (vi) Statistical tests including the Mann–Whitney, paired t-test, Wilcoxon, and Freidman test, together with the p values, showed their stability and reliability. (vii) The online system took less than 1 s for each slice.
The training cohort consisted of approximately 3,500 (3,542) CT images that were derived from 45 Croatian patients (Figure 1). With a mean age of 67, the patients were split into 37 men and the remaining females (SD 7.588). The group’s average GGO and consolidation scores were 2.5 and 1.5, respectively. In the cohort of 45 patients, all had coughs, 85.5% had dyspnea, 28% had hypertension, and 13.5% smoked, but none had cancer, diabetes, chronic obstructive pulmonary disease (COPD), or any other significant disorders. They did not all die from COVID-19 infection and were not all sent to the intensive care unit (ICU).
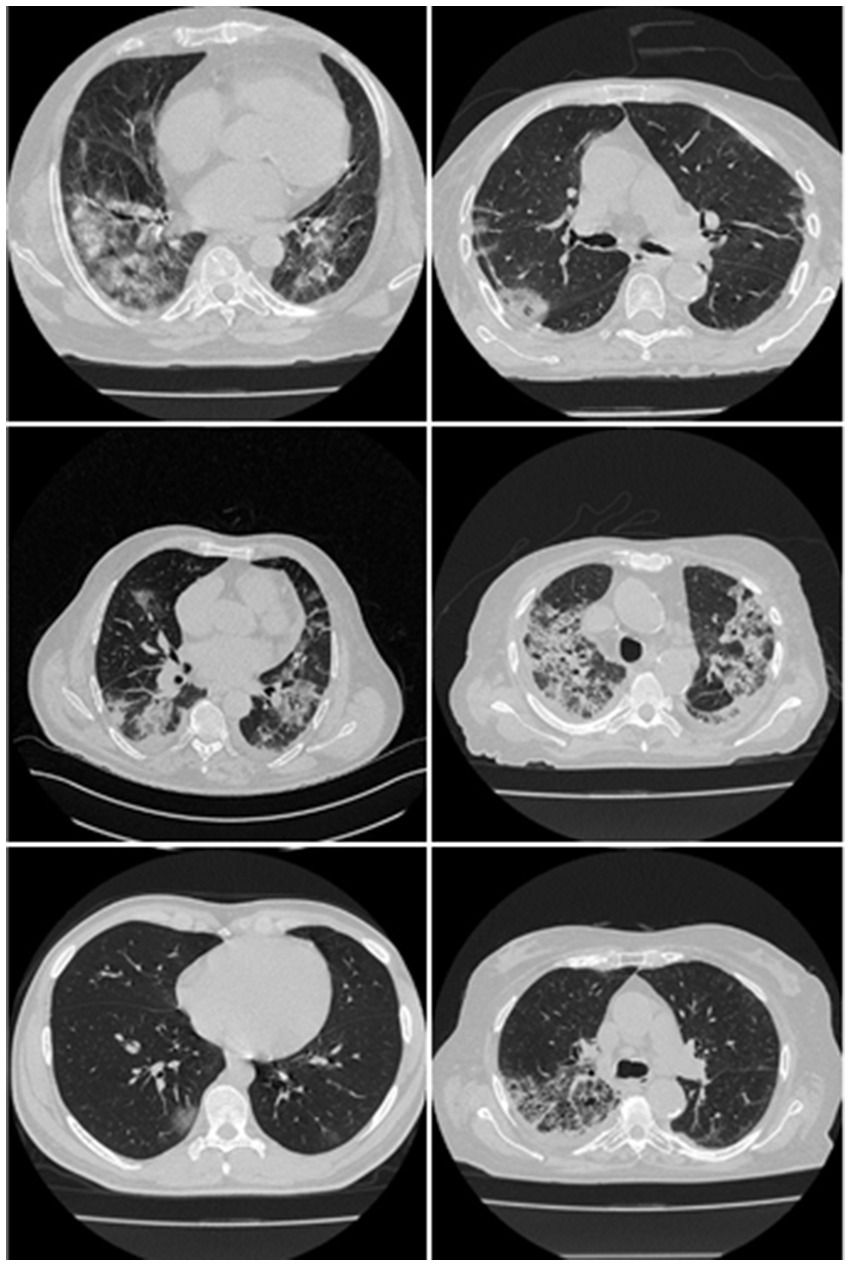
Figure 1. Raw CT images from the Croatian dataset.
UHID Ethics committee approved this study investigation where 45 COVID-19-positive Croatian cohorts were considered. The data were collected retrospectively between March 1 to December 31, 2020, at the University Hospital for Infectious Diseases in Zagreb, Croatia. The patient who met the following criteria: age > 18 years old, who had positive test results on RT-PCR, oxygen saturation 92% (hypoxia), respiratory rate 22/min (tachypnea), pulse rate > 100 (tachycardia), and systolic blood pressure 100 mm Hg (hypotension), went for thoracic MDCT scans. Fujifilm Corporation, Tokyo, Japan, 2017 vendor was used having the CT hardware 64-detector FCT Speedia HD. The technique used for CT acquisition was an inspiratory breath-hold (single) in the craniocaudal direction. System Software Version: V2.25, Copyright Hitachi, Ltd. 2017 had the following voltage and current ratings (120 kV, 350 mA having a rotation speed of 0.75 s). Using these parameters, standard Supria software was used for the whole-body X-ray CT imaging. The imaging parameters were: slice thickness of 1.25 mm along with recon index of 1 mm for picture filter 22 (lung standard). The iterative algorithm adopted was Intelli IP Lv.2 (WW1600/WL600). The criteria considered for imaging adopted reasonable image quality acceptance or no motion artifact due to patient movement and ensuring the presence of no metallic objects. The volume acquired consisted of ~300 slices, out of which ~70 CT slices (512 × 512 px2) were extracted by the senior radiologist, which accounted for about 23% of the total CT slice. The red color marked annotated lesion over the grayscale raw CT scan can be seen in Figure 2.
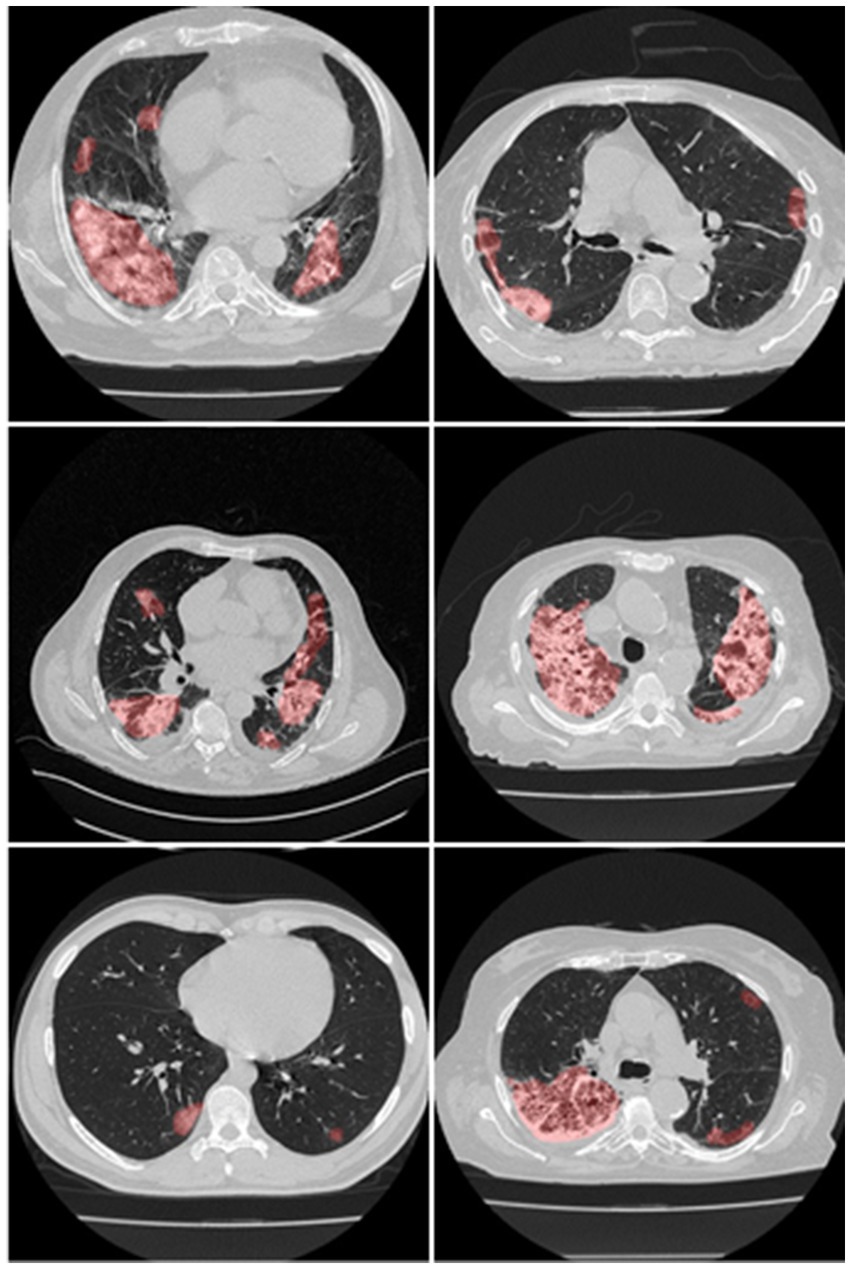
Figure 2. Manual overlays (red) on raw CT images.
To more quickly locate and segment lesions, the suggested study combines SDL and HDL models. The invention of merging two SDL models came about as a result of a recent demonstration that the combination of two HDL models, as opposed to the SDL models, had better feature extraction power (Jena et al., 2021). Therefore, two HDL models—namely, VGG-UNet3+ and ResNet-UNet3+ were used in this investigation. They were trained using data from a single expert radiologist and compared the SDL, namely, UNet3 + .
The UNet3+ (Figure 3) were proposed by Huang et al. (2020) as a full scales-connected architecture designed for medical image segmentation. UNet3+ is a DL model that explores full-scale skip connections, unlike that of UNet++, which uses interlinked and dense skip connections, but refrains from full scales connections. The advantage of using full-scale skip connections over and above interlinked and dense skip connections is that the model combines low-level information from the images with high-level meanings from feature maps at different levels of resolution on the image. In contrast to the UNet, a collection of inter encoder-decode skip connections applies a non-overlapping max pooling operation to convey low-level detailed information from the smaller-scale encoder layers X1En and X2En. Finally, to make the model understand the hierarchical features from the full-scale feature maps, full-scale deep supervision is also used. Note that this study does not implement UNet and UNet++; they are mentioned just to show how the new UNet3+ and its hybrid variants were derived.
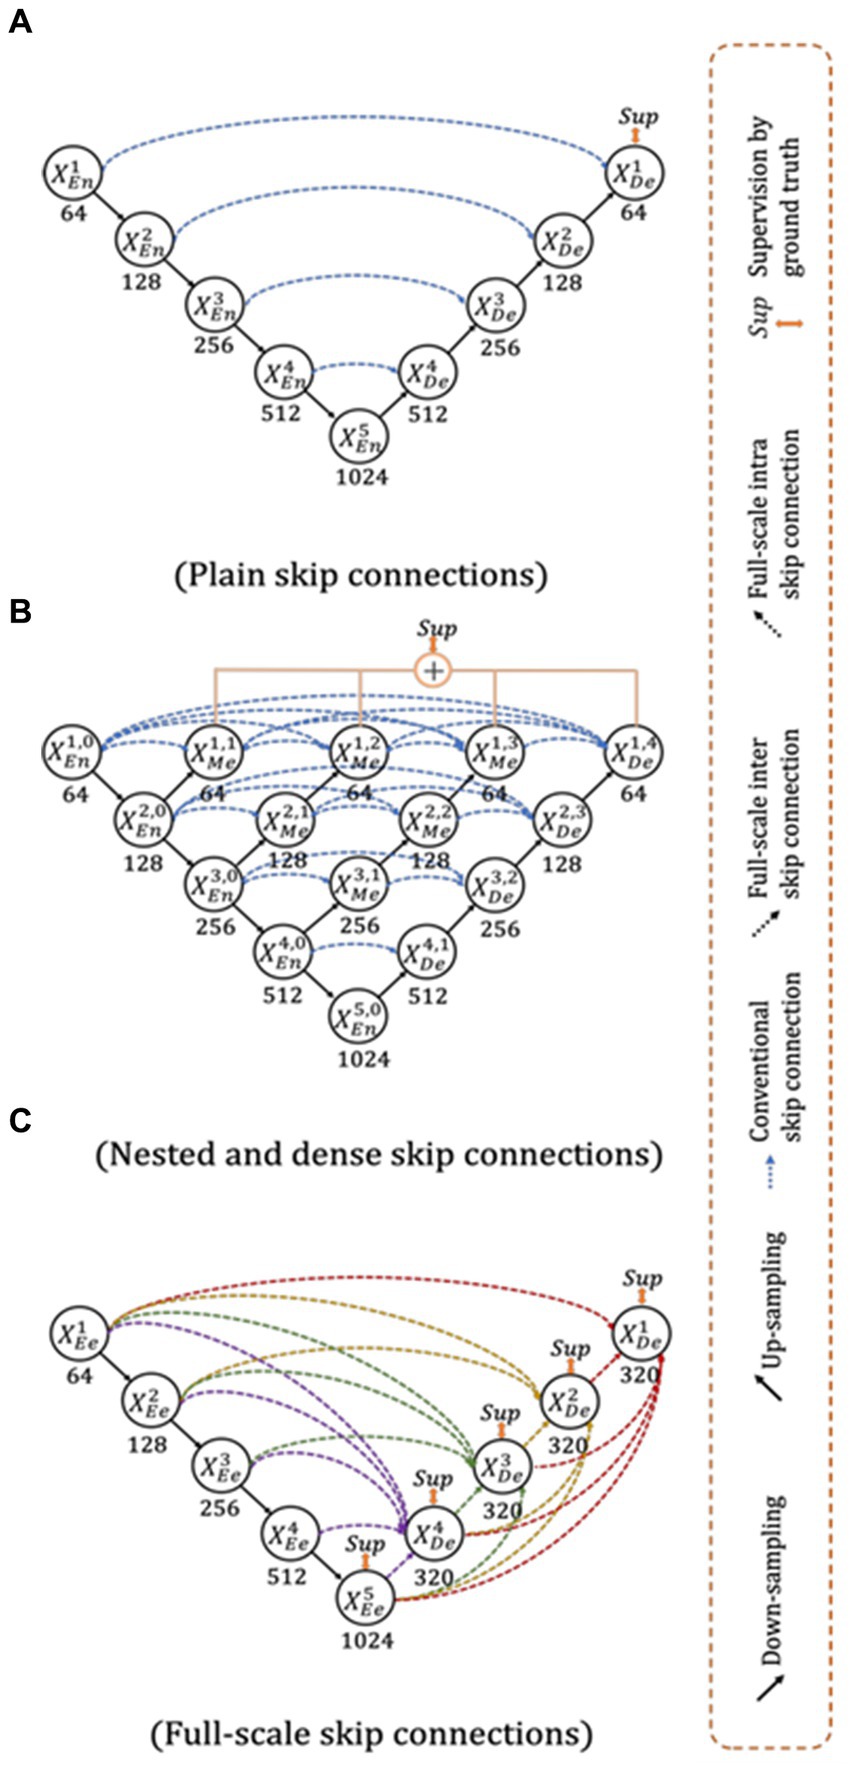
Figure 3. Top: UNet (Ronneberger et al., 2015), Middle UNet++ (Zhou et al., 2020), and Bottom: UNet 3+ (Huang et al., 2020).
The VGGNet architecture was designed to shorten training time by substituting 11 and 5-sized filters for the initial layer’s kernel filter (Simonyan and Zisserman, 2014). VGGNet was incredibly quick and efficient, but it struggled with optimization because of vanishing gradients. Because it is compounded by the gradient at each epoch and the update to the initial layers is so small, backpropagation produces far less training with no weights. To solve this problem, Residual Network, often known as ResNet (He et al., 2016), was developed. Gradients can now skip a select few layers in this design thanks to a new connection known as the “skip connection,” which solves the disappearing gradient problem. An identity function was also added to the network during the backpropagation step to maintain the local gradient values to a non-zero value.
By fusing one SDL (VGG or ResNet) with another SDL (UNet3+), the HDL models create a superior network that benefits from the strengths of both parent networks (Das et al., 2022). Three components make up the VGG-UNet3+ and ResNet-UNet3+ architectures used in this study: an encoder, a decoder, and a pixel-wise SoftMax classifier.
During the model creation process, the new models adopted the binary cross-entropy (BCE)-loss functions (Shore and Johnson, 1981; De Boer et al., 2005; Jamin and Humeau-Heurtier, 2019). The loss function can be mathematically described as given in Equation 1 if represented the BCE-loss function, represented the classifier’s probability utilized in the AI model, i represented the input gold standard label 1, (1− i ) represented the gold standard label 0.
Here × represents the product of the two terms.
The dice loss is named after the Dice-Sørensen coefficient, a statistic developed in the 1940s to evaluate the similarity between two samples. It was introduced to the computer vision field by Milletari et al. (2016) for the segmentation of 3D medical images. When X is the input image and Y is the target or ground truth image, the Dice loss (D) employed in this manuscript can be represented as given in Equation 2.
Standardized cross-validation (CV) method was used to assess the accuracy of the AI models. Our team has developed several CV-based protocols of various types for a variety of applications using the AI framework (Acharya et al., 2013b; Shrivastava et al., 2015; Araki et al., 2016; Maniruzzaman et al., 2018). We employed the K5 cross-validation methodology using observed data analysis, consisting of 80% training (2,800 scans) and 20% training data (700 CT scans). Because of the favorable COVID-19 parameters, the 5-fold was chosen. Here, in each fold, the chance was given to have its own test set, where 10% of the data was taken into consideration for protocol’s internal validation mechanism. The test data consisted of unseen 500 COVID-19 positive images for generalizability.
The accuracy (ACC) of the AI system is assessed by contrasting predicted output with actual ground truth pixel values. The black and white pixels of the output mask were converted to binary 0/1 integers for further processing. Using the standardized symbols TP, TN, FN, and FP to signify true positive, true negative, false negative, and false positive, truth table was designed for accuracy determination (Eq. 3).
This proposed study is a novel implementation of two HDL architectures VGG-UNet3+ and ResNet-UNet3+ for COVID-19-based lesion segmentation. A cohort of 3,500 lung CT images from 45 COVID-19 positive patients has been utilized with a five-fold CV technique. Another cohort of 500 COVID-19 positive patients from the MosMed (Russia) dataset was used as part of an unseen-AI analysis. Figure 4 shows the overlay of the DL predicted lesion using the three DL models UNet3+, VGG-UNet3+, and ResNet-UNet3+ for the dice and BCE loss functions, using the unseen dataset.
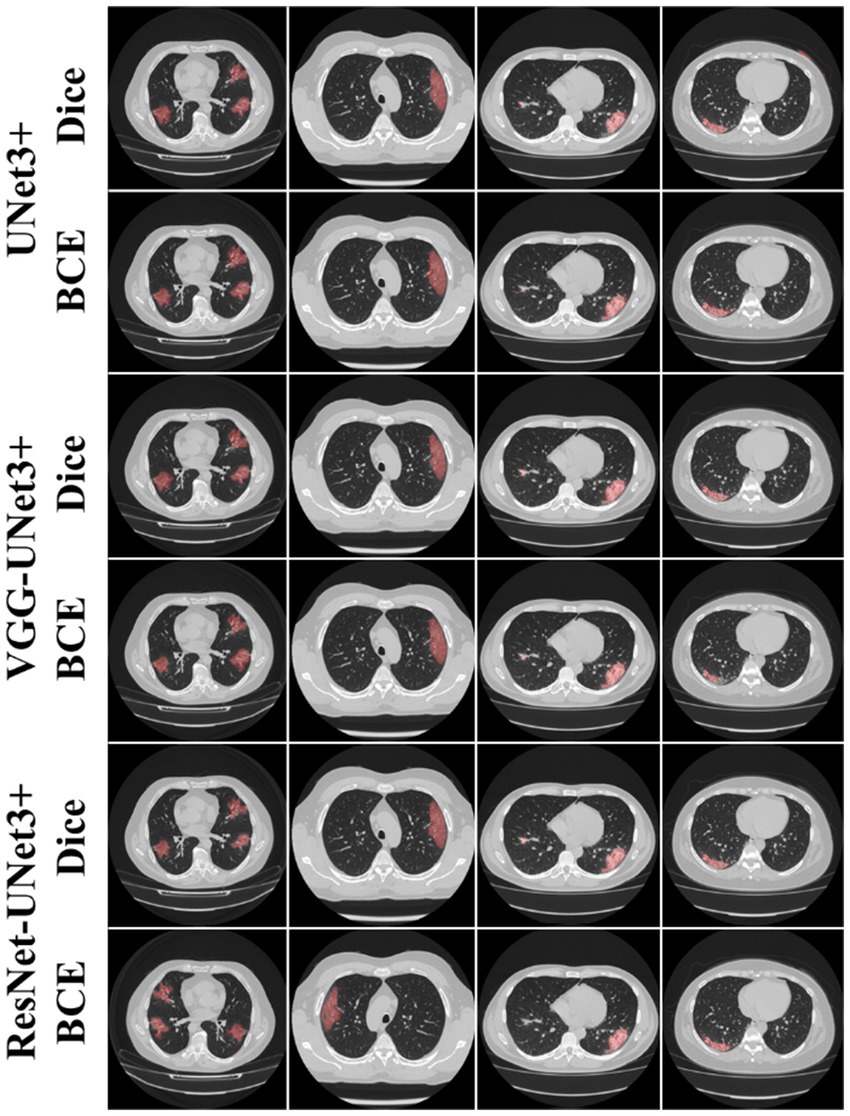
Figure 4. AI predicted COVID-19 lesion overlay, using three models: UNet3+ (row 1 and 2), VGG-UNet3+ (row 3 and 4), and ResNet-UNet3+ (row 5 and 6). BCE and Dice are the two loss functions.
This proposed study uses (i) Area Error (AE), (ii) Dice similarity (DS) (Basar et al., 2022; Chu et al., 2022), (iii) Jaccard index (JI) (Eelbode et al., 2020), (iv) Bland–Altman (BA) plots (Dewitte et al., 2002; Giavarina, 2015), and (v) Correlation coefficient plots, for the three DL models against Dice and BCE loss for performance evaluation, using the unseen dataset containing 500 CT images. Figures 5–7 show the cumulative frequency distribution (CFD) plot for Area error, DS, and JI for UNet3+, VGG-UNet3+, and ResNet-UNet3+, respectively, and depicts the score at an 80% threshold. Figures 8, 9 depict the BA and CC plots for the three DL models. This study also uses manual delineation from a trained radiologist to validate the results from the three DL models, thus, useable for clinical settings. Using the performance evaluation on the unseen dataset, the HDL model ResNet-UNet3+ outperformed all the other models proposed in this study, thereby proving the performance of the HDL model is superior to the SDL model.
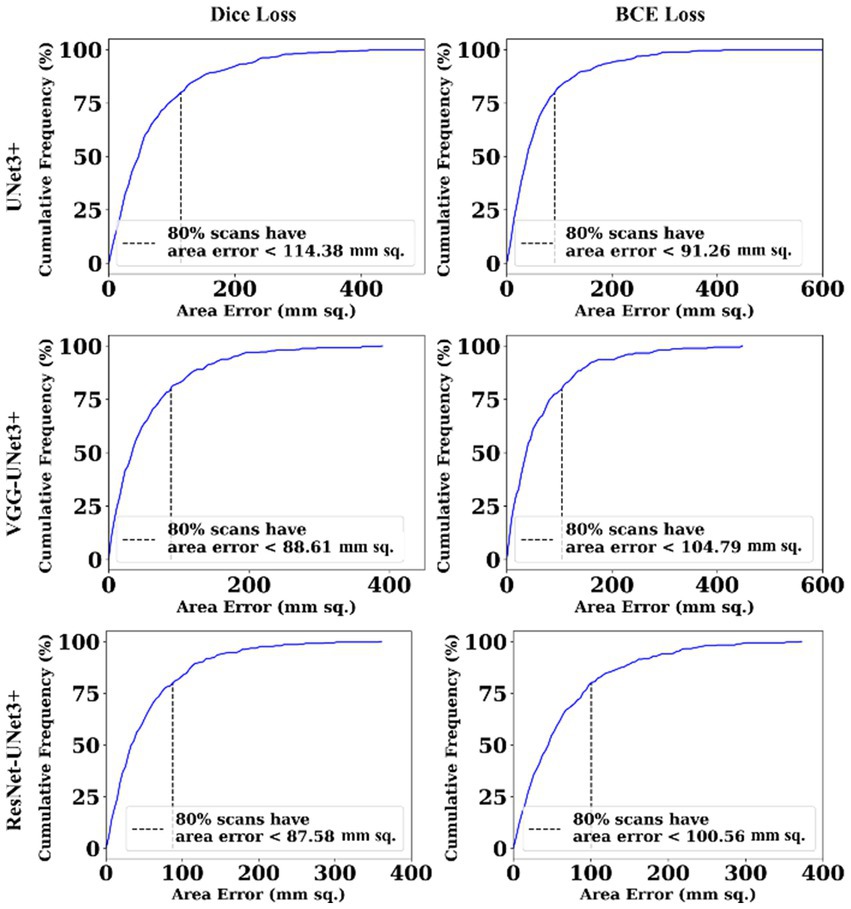
Figure 5. Area error.

Figure 6. Dice Similarity plot.

Figure 7. Jaccard Index plot.
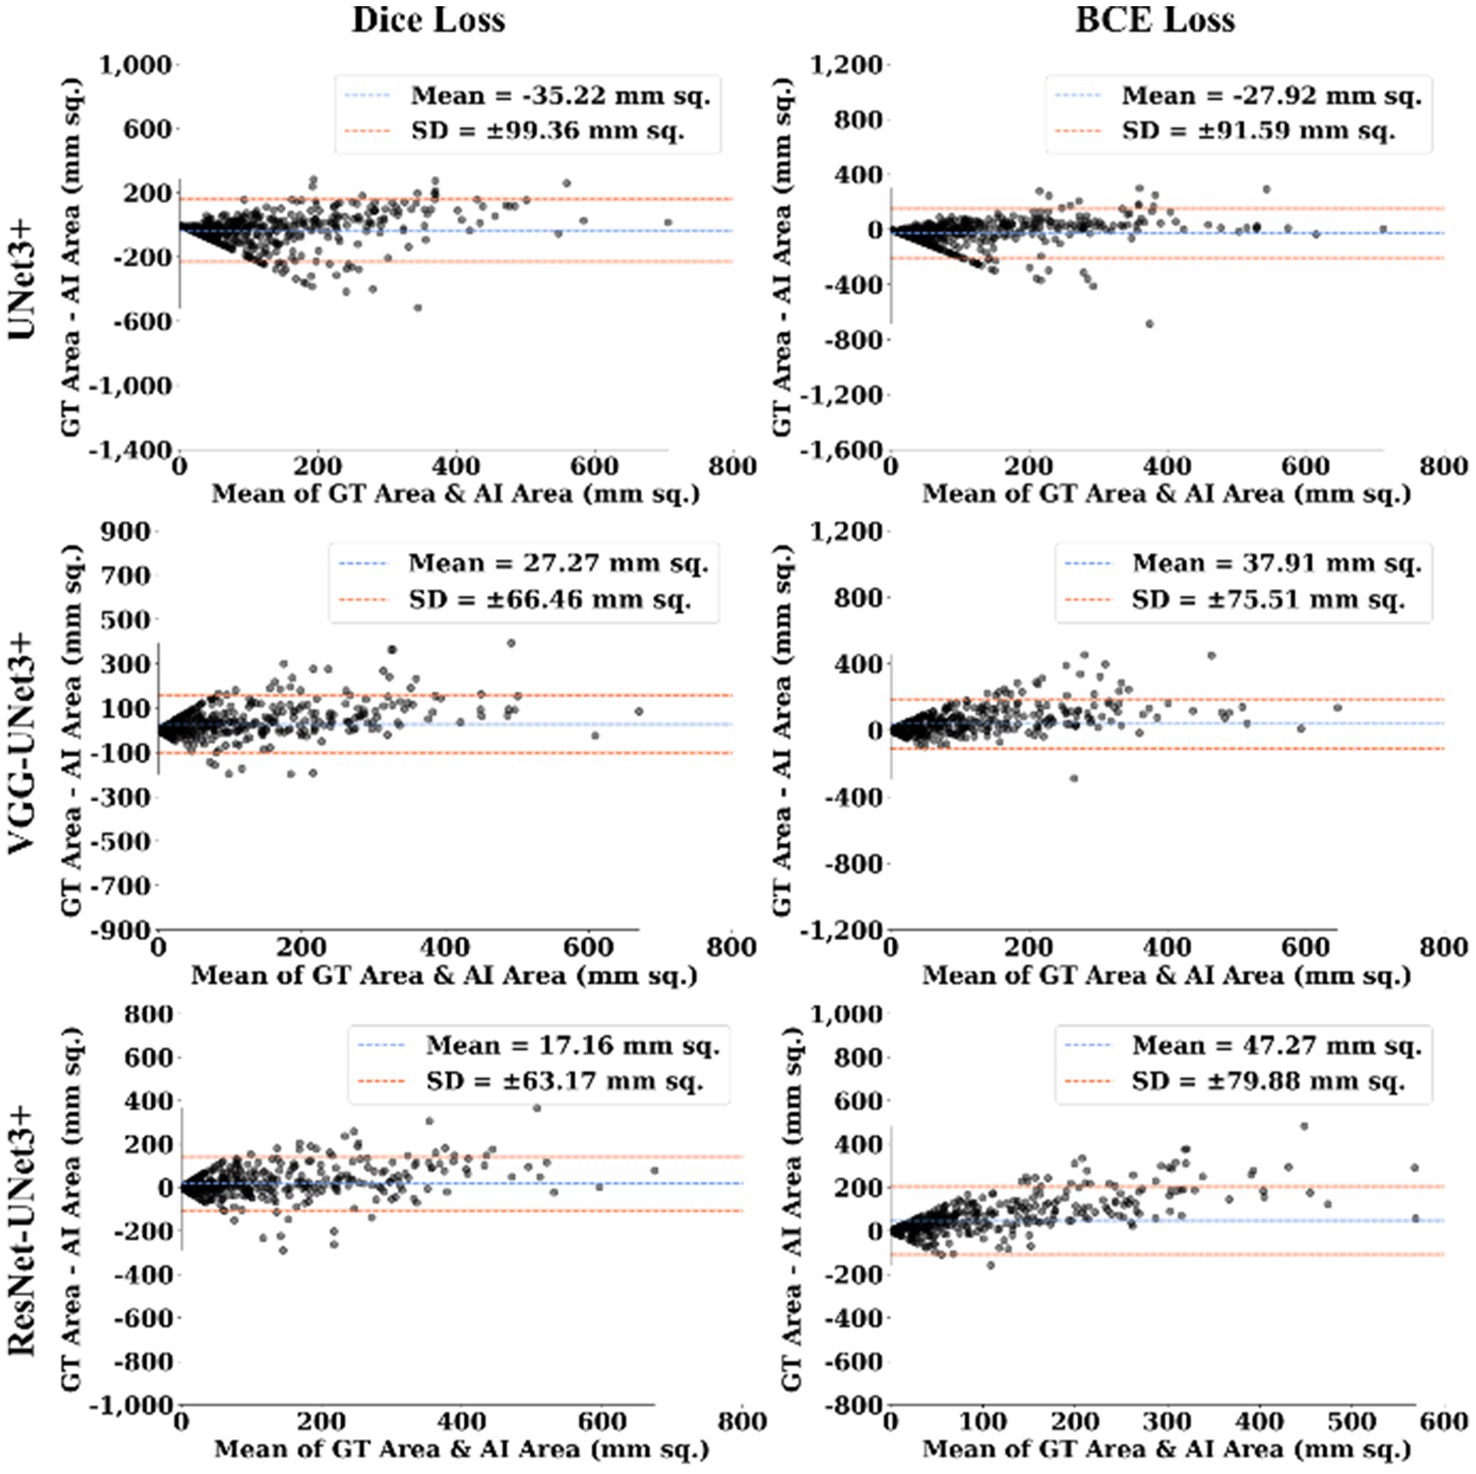
Figure 8. BA Plot.
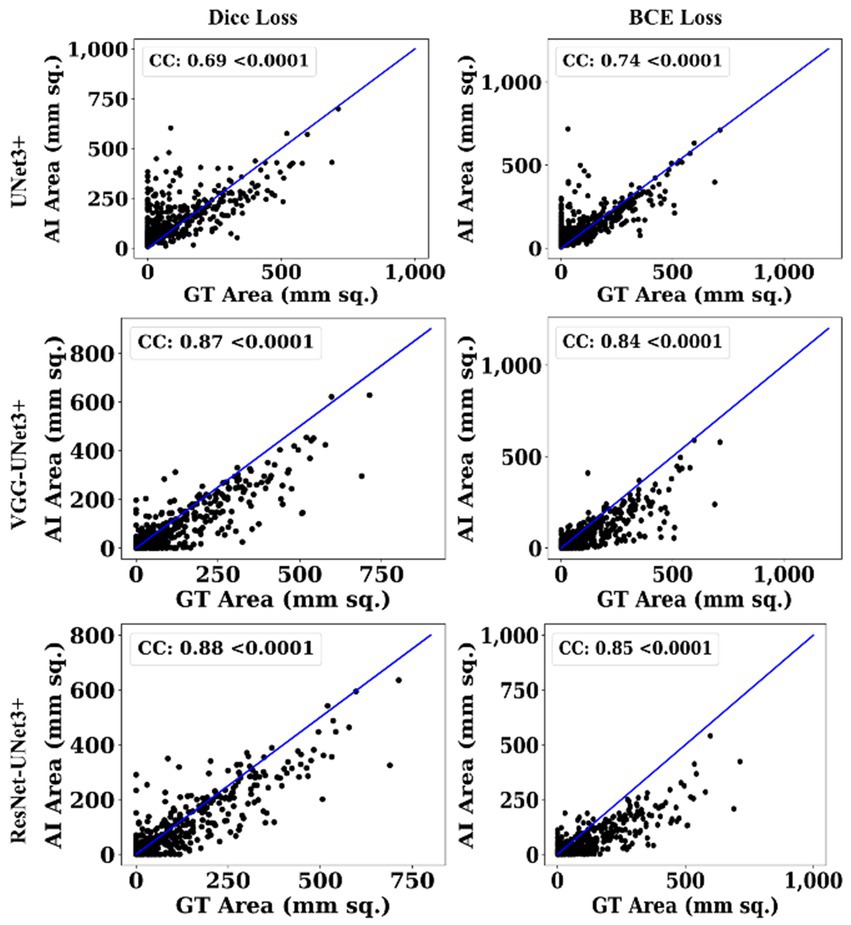
Figure 9. CC Plot.
The main application domain is the pulmonary field of medicine combined with radiological imaging which involves AI-based solution for segmentation of COVID-19 lung lesions embedded with pruning framework in cloud-based settings. This study uses one SDL UNet3+ and two HDL models, (i) VGG-UNet3+ and (ii) ResNet-UNet3+, trained using a 5-fold cross-validation technique utilizing a set of 3,500 manually annotated images, to demonstrate automatic lesion identification in a DL framework. The three DL models in this proposed study are trained using Dice and BCE loss and tested against the unseen dataset of 500 CT images utilizing (i) AE, (ii) DS, (iii) JI, (iv) BA, and (v) CC plots. Considering these metrics, the best AI model, ResNet-UNet3+ was superior to UNet3+ by 17 and 10% using Dice loss and BCE loss when compared against a seen dataset. Thereby establishing that the dice performed better than BCE loss for COVID-19 lesion segmentation. Further, the COVLIAS 3.0 showed DSC was 16% better when comparing against the mean DSC of previous studies (Zhang et al., 2020; Ding et al., 2021; Lizzi et al., 2021; Paluru et al., 2021). Mann–Whitney, Paired t-Test, Wilcoxon, and Friedman tests demonstrated the stability and scientific reliability of the proposed system, with a p value <0.001 (Table 1). To speed-up the training process NVIDIA’s DGX V100, with multi-GPU, was adopted. The results show that ResNet-UNet3+ is the best model out of all the DL models.

Table 1. Statistical test.
Table 2 lists the key metrics for comparing the three models, describing (i) the loss function used while training, (ii) the total number of AI model parameters, (iii) the number of layers, (iv) the size of the final saved model, (v) the number of training epochs, (vi) the batch size, and (vii) the online prediction time per image for COVLIAS 3.0.
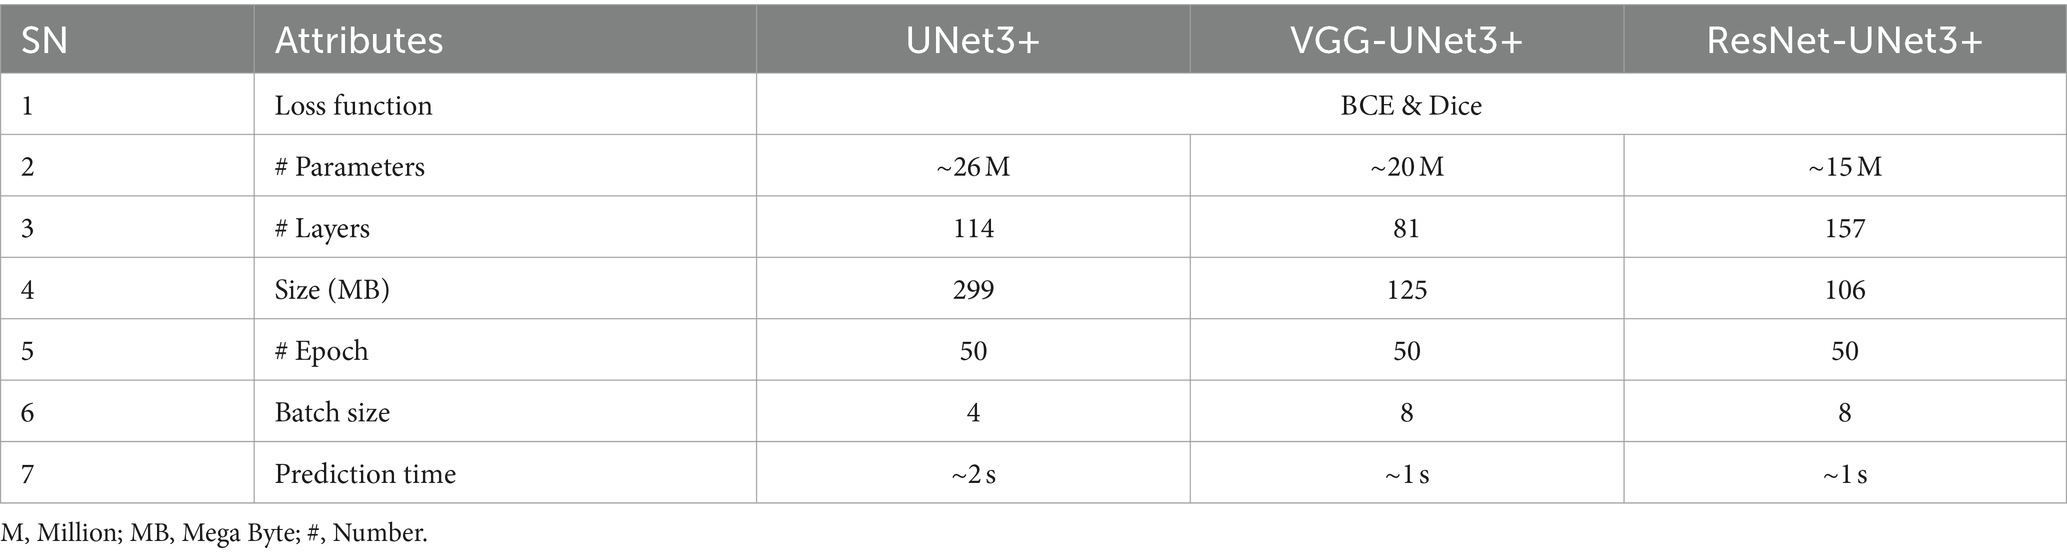
Table 2. Model parameters.
In cloud-based setting, the patient and physician relationship can be very efficient, especially during the virology period. In all such setups, it is vital to demonstrate the usage of the visual images. These visual images carry a deep role especially under explainability paradigm. The trust of the physicians to use the software system is the most important component in medical imaging. This was demonstrated in our previous contributions (Saba et al., 2016, 2017, 2018, 2023). Some of these applications are in cardiology applications. These visual displays serve two purposes: (i) show the comprehension nature of the design depicting and (ii) proves the nature of explainability. Both these objectives are met in our display. Further, the figures provide an overview of the system and display the overall pipeline of the system. To make the system accessible, we have made a web-based AI system using Amazon Web Services. The system is capable of processing single as well as multiple CT images at a time. After selection of the image(s), the system loads the AI model and segments the COVID-19 lesion and displays it as a report, which can be downloaded as a portable document format (PDF).
Note that a certain pre-processing discussed in our previous research (Suri et al., 2022a,b) must be done before the system can accept the image and process it for segmentation and analysis. Each run is assigned a unique identification ID, which allows it to be easily accessible for analysis purposes and can also be used to finetune the AI model at a later stage. Figure 10 represents the landing page of COVLIAS 3.0: Hybrid AI-Based COVID-19 Lesion Segmentation system. Figure 11 presents the output from the web-based COVLIAS 3.0 system. To make the cloud deployment cost-effective and reduce the processing time, we have utilized multiprocessing and load-balancing.
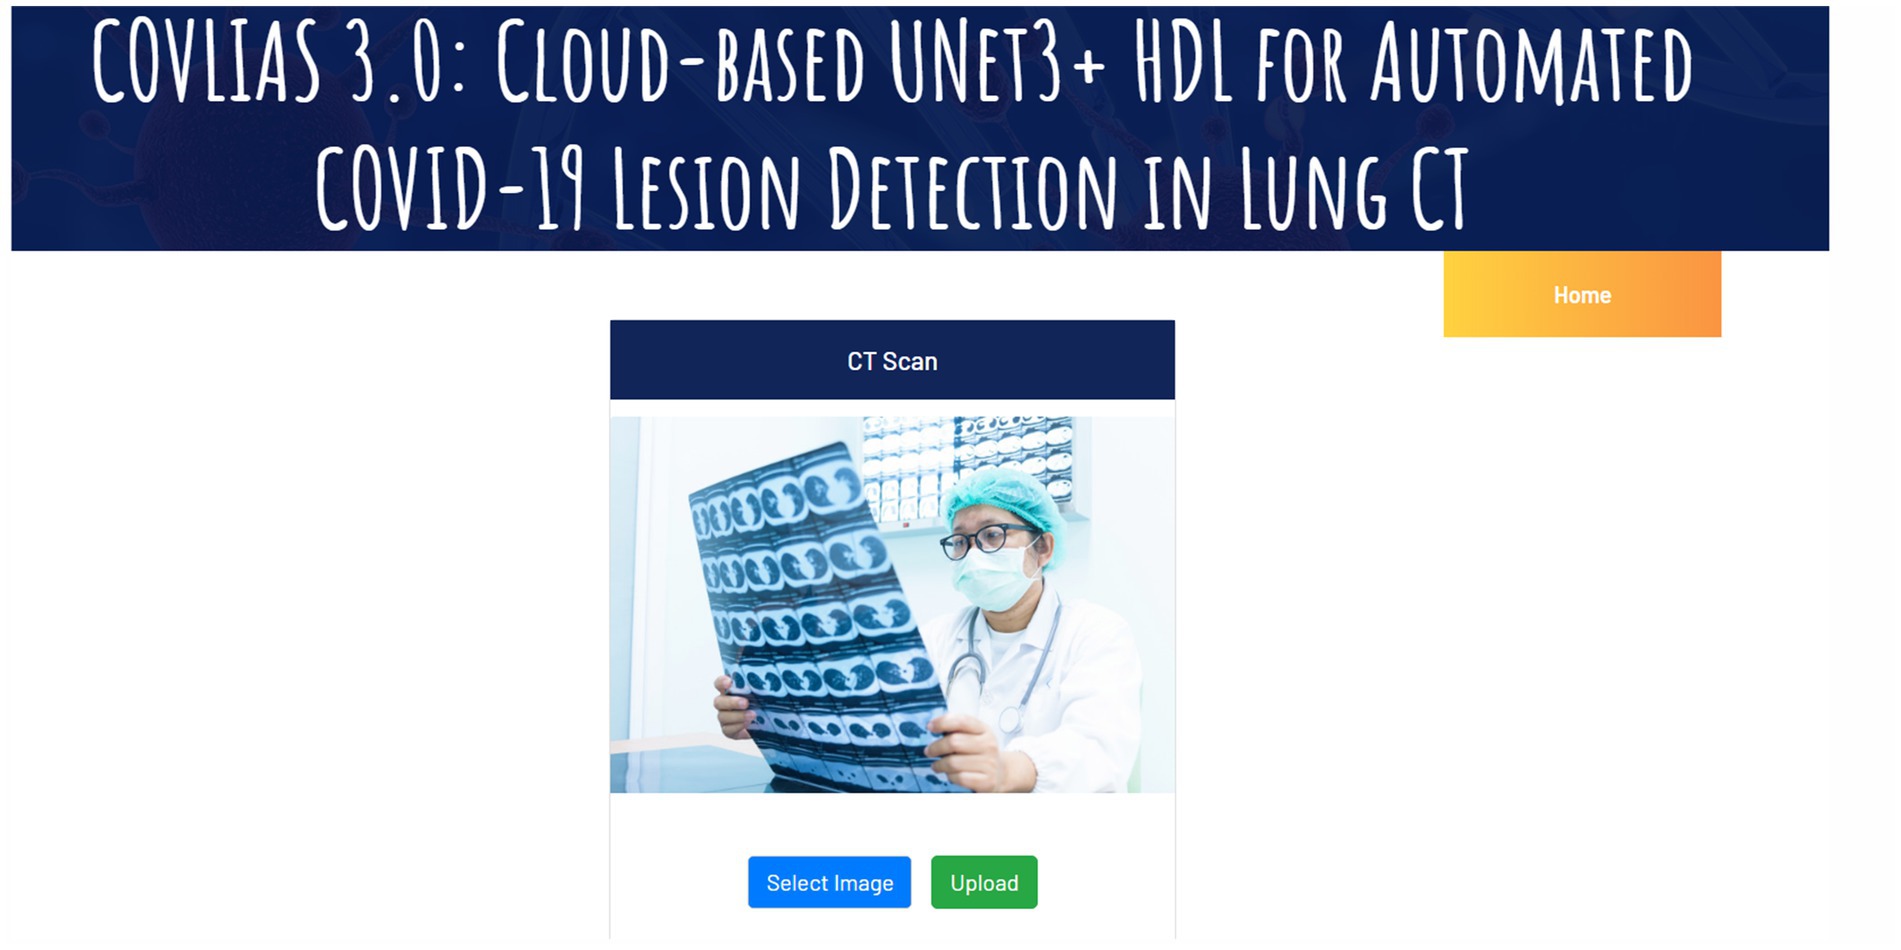
Figure 10. Landing page of COVLIAS 3.0: Hybrid AI-Based COVID-19 Lesion Segmentation system.

Figure 11. Snapshot of the result page using COVLIAS 3.0: Hybrid AI-Based COVID-19 Lesion Segmentation system.
Quantization in deep learning is the process of reducing the number of bits used to represent the weights and parameters of a neural network model (Wu H. et al., 2020; Ma H. et al., 2021). By reducing the precision of the parameters, the overall size of the model can be dramatically reduced, which can have a significant impact on the speed of computation and the amount of memory required. In other words, it is the process of reducing the resolution of a pixel by reducing the number of its possible values. This is typically done by rounding off the pixel’s values to a predetermined set of values, which are referred to as levels.
Additionally, quantization can also be used to improve the accuracy of the model by reducing the impact of noise and other distortions. Quantization is used in many different areas of signal processing, including digital audio, image processing, and communication systems.
(1) Reduced memory and storage requirements: By using fewer bits to represent the weights and parameters of the model, the overall size of the model is reduced, which can significantly reduce the memory and storage requirements. This can be especially beneficial for deploying models to devices with limited memory and storage capabilities. (2) Improved model performance: Quantization can also lead to improved model accuracy and performance by reducing the impact of noise and other distortions. (3) Faster computation times: By reducing the precision of the parameters, the computational complexity of the model is reduced, which can lead to faster computation times.
Table 3 presents a list of metrics for comparing the three quantized models, describing (i) the size of the final saved model, (ii) the size of the final quantized (compressed) saved model, (iii) percentage (%) size reduction, and (iv) the online prediction time per image for COVLIAS 3.0 using quantized models. Quantized UNet3+, VGG-UNet3+, and ResNet-UNet3+ models were able to achieve 66.76, 36.64, and 46.23% compression, respectively.
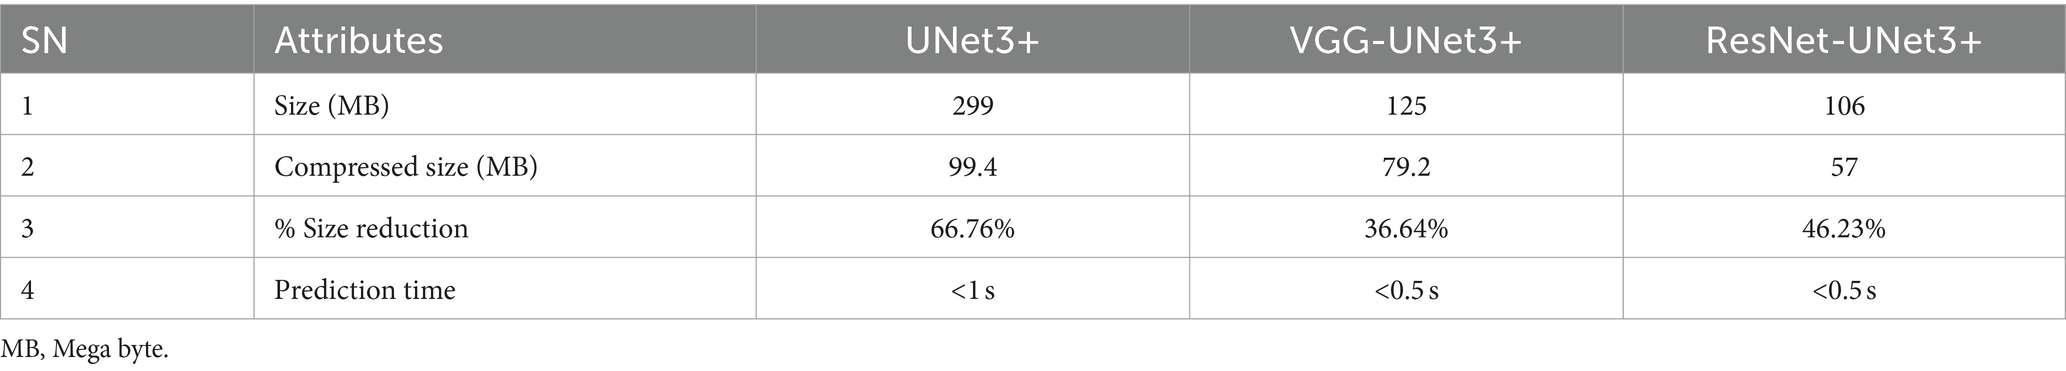
Table 3. Quantization.
With Res2Net50 (Gao et al., 2019) as its foundation, Ding et al. (2021) developed MT-nCov-Net, a multitasking DL network that comprised the segmentation of both lesions and lungs in CT images. More than 36,000 scans from five separate CT imaging databases were used in this investigation. The study adopted random flipping, rotation, cropping, and Gaussian blurring as part of the augmentation protocol, resulting a Dice of 0.86. Hou et al. (2021) used an improvised canny edge detector (Ding and Goshtasby, 2001; McIlhagga, 2011) on CT scans to identify COVID-19 lesions. The authors used a dataset of roughly 800 CT images. Lizzi et al. (2021) designed a cascaded UNet system for COVID-19-based lesion segmentation on CT images, using a variety of augmentation methods, including zooming, rotation, Gaussian noise, elastic deformation, and motion blur, were applied. The authors showed a DSC of 0.62, compared to Ding et al. (2021)'s value of 0.86. The network DR-MIL shown by Qi et al. (2021) was built on the foundation of ResNet-50 and XceptionNet (Chollet, 2017). In this work, rotation, reflection, and translation were applied as image augmentation techniques on around 2,400 CT scans. The study did not mention about DSC. Paluru et al. (2021) introduced Anam-Net, a hybrid of UNet and ENet. This method required an additional step of lung segmentation prior to COVID-19 lesion segmentation. While using a training cohort of 4,300 CT scans, the system showed DSC of 0.77. The Anam-Net system was designed for Android application on an edge device. Zhang et al. (2020) introduced CoSinGAN, a GAN network for COVID-19-based lesion segmentation. This GAN employed only 700 CT lung images for training and used no augmentation. The DSC using CoSinGAN’s was 0.75. Cai et al. (2020) used the UNet-based model and adopted a 10-fold CV protocol on 250 images and showed a DSC of 0.77. Using the same methodology, the author presented lung and lesion segmentation. The length of an intensive care unit (ICU) stay can be predicted by the authors using the results of lesion segmentation. For 3D CT volume segmentation, Ma J. et al. (2021) also applied the typical UNet design to a collection of 70 patients. The training phase also included model optimization, and the study reported a DSC of 0.67. The model’s performance was compared to that of other studies in the same field by the authors. Kuchana et al. (2021) employed UNet and Attention UNet to segment the lung and lesions in a group of 50 patients. The model showed a DSC of 0.84 after the authors improved the hyperparameters during the training procedure.
Finally, Arunachalam et al. (2021) presented a two-stage lesion segmentation technique, where, stage-I involved employing region-based convolutional neural networks (RCNN) to estimate the region of interest, while stage-II involved creating bounding boxes. For the train, validation, and test sets, the performance metrics were 0.99, 0.931, and 0.8. In conjunction with automated bounding box estimates for mask production, the RCNN was predominantly used for COVID-19 lesion identification. Our COVLIAS 3.0 leverages hybrid model technology demonstrating a higher DSC of 16% and further implemented in cloud-based framework embedded with quantization infrastructure thereby reducing the training model sizes.
UNet has been evolving over the last 7 years, especially in ultrasound (Sanches et al., 2012; Jain et al., 2021, 2022). The modifications to fundamental UNet have given the power to the segmentation process, which includes the addition of more stochastic image processing techniques in UNet framework (El-Baz et al., 2011, 2015; Shrivastava et al., 2015). Using the hybrid system with advanced UNet that uses full-scale skip connections has improved the performance of the system. Further, quantizing the DL models helped reduce the storage space and overall computation time in the cloud framework.
The following are the two main limitations: (i) The major weakness of the above model is the lack of strong features extraction or small feature extraction. The addition of attention models or transformer models can improve this. (ii) Another limitation of this protocol is the requirement of hardware such as graphical processing unit (GPU). Since GPUs are not easily available in all universities, this can be a limitation when applying pruning-based segmentation models.
Small features can be detected by adding attention-based models. Multithreaded architectures can be used for increasing the speed of the system. Empirical convergence can be used during the training process, which involves fixed number of epochs where the validation loss can be close to training loss. Further, we can converge by taking training number of epochs less than a threshold value.
Due to recent advances in pruning models (Agarwal et al., 2022) and evolutionary methods, one can extend this to the UNet framework. In the future, more variants of hybrid systems (DL with ML) can be used and tested for the performance and reliability of the system (Biswas et al., 2018b). To make the system more robust, the system can be trained on a combination of the dataset from different countries, ethnicities, patients with comorbidities as tried in other modalities (Skandha et al., 2022). There are other potential applications of such technologies that are not limited to mammography, urology, pulmonary, ophthalmology, neurology, nephrology, and cardiology. This includes diagnosis of lesions in brain, breast, prostate, retinal, renal, lung, and heart.
To handle the lesion localization and segmentation more quickly, the proposed study provides three DL models for lesion segmentation in 3,500 CT images (Croatia) obtained from 45 COVID-19 patients. One experienced radiologist was used to train the one SDL namely UNet3+, and two HDL models, namely, VGG-UNet3+, and ResNet-UNet3+. For performance evaluation, the training program used a 5-fold cross-validation technique. It makes use of tracings from two qualified radiologists as part of the validation. Using the unseen dataset of 500 CT images and the AE, DS, JI, BA, and CC plots, the three DL models in this proposed study were evaluated against Dice and BCE loss.
The key takeaway was that ResNet-UNet3+ was superior to UNet3+ by 17 and 10% for Dice and BCE loss when compared against an unseen dataset. Second takeaway was that the Quantized UNet3+, VGG-UNet3+, and ResNet-UNet3+ models were able to achieve 66.76, 36.64, and 46.23% compression, respectively. The third takeaway was that since the system was designed for cloud-based settings. To sum up, our pilot research showed how consistently the HDL model could find and segment COVID-19 lesions in CT images superior performance.
The original contributions presented in the study are included in the article/supplementary material; further inquiries can be directed to the corresponding authors.
The use of artificial intelligence for multislice computer tomography (MSCT) images in patients with adult respiratory diseases syndrome and COVID-19 pneumonia (approval Code: 01-2239-1-2020) approval: authorized by the University Hospital for Infectious Diseases Dr. Fran Mihaljevic, Zegreb, Mirogojska 8. On November 9th, 2020. Approved to Klaudija Viskovic, MD, PhD. The requirement of written informed consent for participation was waived by the institutional review boards due to the retrospective nature of the research.
SA: Data curation, Methodology, Software, Visualization, Writing – original draft. SS: Validation, Writing – review & editing. AC: Data curation, Validation, Writing – review & editing. GC: Validation, Writing – review & editing, Data curation. GR: Validation, Writing – review & editing, Funding acquisition. SP: Validation, Writing – review & editing. JL: Validation, Writing – review & editing. DG: Validation, Writing – review & editing. MFa: Writing – review & editing, Validation. LM: Writing – review & editing. AD: Writing – review & editing, Visualization. RS: Writing – review & editing. MFo: Writing – review & editing, Funding acquisition. NS: Writing – review & editing. SN: Validation, Writing – review & editing, Supervision. KV: Writing – review & editing, Data curation, Formal analysis, Validation. MKu: Investigation, Writing – review & editing, Validation. MKa: Supervision, Writing – review & editing. LS: Formal analysis, Investigation, Methodology, Supervision, Validation, Writing – review & editing. JS: Formal analysis, Investigation, Methodology, Resources, Supervision, Writing – review & editing.
The author(s) declare that no financial support was received for the research, authorship, and/or publication of this article.
SA was employed at GBTI, United States. JS was employed by AtheroPoint™, United States.
The remaining authors declare that the research was conducted in the absence of any commercial or financial relationships that could be construed as a potential conflict of interest.
All claims expressed in this article are solely those of the authors and do not necessarily represent those of their affiliated organizations, or those of the publisher, the editors and the reviewers. Any product that may be evaluated in this article, or claim that may be made by its manufacturer, is not guaranteed or endorsed by the publisher.
Acharya, R. U., Faust, O., Alvin, A. P. C., Sree, S. V., Molinari, F., Saba, L., et al. (2012a). Symptomatic vs. asymptomatic plaque classification in carotid ultrasound. J. Med. Syst. 36, 1861–1871. doi: 10.1007/s10916-010-9645-2
Acharya, U. R., Faust, O., Vinitha Sree, S., Alvin, A. P. C., Krishnamurthi, G., Seabra, J. C. R., et al. (2013b). Understanding symptomatology of atherosclerotic plaque by image-based tissue characterization. Comput. Methods Prog. Biomed. 110, 66–75. doi: 10.1016/j.cmpb.2012.09.008
Acharya, U. R., Mookiah, M. R. K., Vinitha Sree, S., Afonso, D., Sanches, J., Shafique, S., et al. (2013c). Atherosclerotic plaque tissue characterization in 2D ultrasound longitudinal carotid scans for automated classification: a paradigm for stroke risk assessment. Med. Biol. Eng. Comput. 51, 513–523. doi: 10.1007/s11517-012-1019-0
Acharya, U. R., Saba, L., Molinari, F., Guerriero, S., and Suri, J. S. (2012b). “Ovarian tumor characterization and classification: a class of GyneScan™ systems” in 2012 Annual International Conference of the IEEE Engineering in Medicine and Biology Society. IEEE, pp. 4446–4449.
Acharya, U. R., Vinitha Sree, S., Mookiah, M. R. K., Yantri, R., Molinari, F., Zieleźnik, W., et al. (2013a). Diagnosis of Hashimoto’s thyroiditis in ultrasound using tissue characterization and pixel classification. Proc. Inst. Mech. Eng. H J. Eng. Med. 227, 788–798. doi: 10.1177/0954411913483637
Acharya, U. R., Faust, O., Sree, SV., Alvin, A.P.C., Krishnamurthi, G., Sanches, J., et al. (2011)."Atheromatic™: symptomatic vs. asymptomatic classification of carotid ultrasound plaque using a combination of HOS, DWT & texture" in 2011 Annual International Conference of the IEEE Engineering in Medicine and Biology Society, IEEE, pp. 4489–4492.
Agarwal, M., Agarwal, S., Saba, L., Chabert, G. L., Gupta, S., Carriero, A., et al. (2022). Eight pruning deep learning models for low storage and high-speed COVID-19 computed tomography lung segmentation and heatmap-based lesion localization: a multicenter study using COVLIAS 2.0. Comput. Biol. Med. 146:105571. doi: 10.1016/j.compbiomed.2022.105571
Agarwal, M., Saba, L., Gupta, S. K., Johri, A. M., Khanna, N. N., Mavrogeni, S., et al. (2021). Wilson disease tissue classification and characterization using seven artificial intelligence models embedded with 3D optimization paradigm on a weak training brain magnetic resonance imaging datasets: a supercomputer application. Med. Biol. Eng. Comput. 59, 511–533. doi: 10.1007/s11517-021-02322-0
Alqudah, A. M., Qazan, S., Alquran, H., Qasmieh, I. A., and Alqudah, A. (2020). Covid-2019 detection using x-ray images and artificial intelligence hybrid systems. Biomed. Sign. Process 2:1. doi: 10.13140/RG.2.2.16077.59362
Araki, T., Ikeda, N., Shukla, D., Jain, P. K., Londhe, N. D., Shrivastava, V. K., et al. (2016). PCA-based polling strategy in machine learning framework for coronary artery disease risk assessment in intravascular ultrasound: a link between carotid and coronary grayscale plaque morphology. Comput. Methods Prog. Biomed. 128, 137–158. doi: 10.1016/j.cmpb.2016.02.004
Arunachalam, A., Ravi, V., Acharya, V., and Pham, T. D. (2021). Toward data-model-agnostic autonomous machine-generated data labeling and annotation platform: Covid-19 autoannotation use case. IEEE Trans. Eng. Manag.
Aslan, M. F., Unlersen, M. F., Sabanci, K., and Durdu, A. (2021). CNN-based transfer learning–BiLSTM network: a novel approach for COVID-19 infection detection. Appl. Soft Comput. 98:106912. doi: 10.1016/j.asoc.2020.106912
Basar, S., Waheed, A., Ali, M., Zahid, S., Zareei, M., and Biswal, R. R. (2022). An efficient defocus blur segmentation scheme based on hybrid LTP and PCNN. Sensors 22:2724. doi: 10.3390/s22072724
Biswas, M., Kuppili, V., Araki, T., Edla, D. R., Godia, E. C., Saba, L., et al. (2018b). Deep learning strategy for accurate carotid intima-media thickness measurement: an ultrasound study on Japanese diabetic cohort. Comput. Biol. Med. 98, 100–117. doi: 10.1016/j.compbiomed.2018.05.014
Biswas, M., Kuppili, V., Edla, D. R., Suri, H. S., Saba, L., Marinhoe, R. T., et al. (2018a). Symtosis: a liver ultrasound tissue characterization and risk stratification in optimized deep learning paradigm. Comput. Methods Prog. Biomed. 155, 165–177. doi: 10.1016/j.cmpb.2017.12.016
Biswas, M., Kuppili, V., Saba, L., Edla, D. R., Suri, H. S., Sharma, A., et al. (2019). Deep learning fully convolution network for lumen characterization in diabetic patients using carotid ultrasound: a tool for stroke risk. Med. Biol. Eng. Comput. 57, 543–564. doi: 10.1007/s11517-018-1897-x
Bustin, S. A., Benes, V., Nolan, T., and Pfaffl, M. W. (2005). Quantitative real-time RT-PCR--a perspective. J. Mol. Endocrinol. 34, 597–601. doi: 10.1677/jme.1.01755
Cai, W., Liu, T., Xue, X., Luo, G., Wang, X., Shen, Y., et al. (2020). CT quantification and machine-learning models for assessment of disease severity and prognosis of COVID-19 patients. Acad. Radiol. 27, 1665–1678. doi: 10.1016/j.acra.2020.09.004
Cau, R., Bassareo, P. P., Mannelli, L., Suri, J. S., and Saba, L. (2021a). Imaging in COVID-19-related myocardial injury. Int. J. Card. Imaging 37, 1349–1360. doi: 10.1007/s10554-020-02089-9
Cau, R., Falaschi, Z., Paschè, A., Danna, P., Arioli, R., Arru, C. D., et al. (2021c). Computed tomography findings of COVID-19 pneumonia in intensive care unit-patients. J. Public Health Res. 10:jphr.2021.2270. doi: 10.4081/jphr.2021.2270
Cau, R., Pacielli, A., Fatemeh, H., Vaudano, P., Arru, C., Crivelli, P., et al. (2021b). Complications in COVID-19 patients: characteristics of pulmonary embolism. Clin. Imaging 77, 244–249. doi: 10.1016/j.clinimag.2021.05.016
Chollet, F. (2017). "Xception: deep learning with depthwise separable convolutions," in Proceedings of the IEEE Conference on Computer Vision and Pattern Recognition, 1251–1258.
Chu, Z., Wang, L., Zhou, X., Shi, Y., Cheng, Y., Laiginhas, R., et al. (2022). Automatic geographic atrophy segmentation using optical attenuation in OCT scans with deep learning. Biomed. Opt. Express 13, 1328–1343. doi: 10.1364/BOE.449314
Cozzi, D., Cavigli, E., Moroni, C., Smorchkova, O., Zantonelli, G., Pradella, S., et al. (2021). Ground-glass opacity (GGO): a review of the differential diagnosis in the era of COVID-19. Jpn. J. Radiol. 39, 721–732. doi: 10.1007/s11604-021-01120-w
Das, S., Nayak, G., Saba, L., Kalra, M., Suri, J. S., and Saxena, S. (2022). An artificial intelligence framework and its bias for brain tumor segmentation: a narrative review. Comput. Biol. Med. 143:105273. doi: 10.1016/j.compbiomed.2022.105273
De Boer, P.-T., Kroese, D. P., Mannor, S., and Rubinstein, R. Y. (2005). A tutorial on the cross-entropy method. Ann. Oper. Res. 134, 19–67. doi: 10.1007/s10479-005-5724-z
Dewitte, K., Fierens, C., Stockl, D., and Thienpont, L. M. (2002). Application of the bland-Altman plot for interpretation of method-comparison studies: a critical investigation of its practice. Clin. Chem. 48, 799–801. doi: 10.1093/clinchem/48.5.799
Ding, W., Abdel-Basset, M., Hawash, H., and Elkomy, O. M. (2021). MT-nCov-net: a multitask deep-learning framework for efficient diagnosis of COVID-19 using tomography scans. IEEE Trans. Cybernet.
Ding, L., and Goshtasby, A. (2001). On the canny edge detector. Pattern Recogn. 34, 721–725. doi: 10.1016/S0031-3203(00)00023-6
Eelbode, T., Bertels, J., Berman, M., Vandermeulen, D., Maes, F., Bisschops, R., et al. (2020). Optimization for medical image segmentation: theory and practice when evaluating with dice score or jaccard index. IEEE Trans. Med. Imaging 39, 3679–3690. doi: 10.1109/TMI.2020.3002417
El-Baz, A. S., Acharya, R., Mirmehdi, M., and Suri, J. S. (2011). Multi Modality State-of-the-Art Medical Image Segmentation and Registration Methodologies, vol. 2. Boca Raton: Springer Science & Business Media.
El-Baz, A., Gimel’Farb, G., and Suri, J. S. (2015). Stochastic Modeling for Medical Image Analysis. 1st Edn: CRC Press.
Fang, Y., Zhang, H., Xie, J., Lin, M., Ying, L., Pang, P., et al. (2020). Sensitivity of chest CT for COVID-19: comparison to RT-PCR. Radiology 296, E115–E117. doi: 10.1148/radiol.2020200432
Fanni, D., Saba, L., Demontis, R., Gerosa, C., Chighine, A., Nioi, M., et al. (2021). Vaccine-induced severe thrombotic thrombocytopenia following COVID-19 vaccination: a report of an autoptic case and review of the literature. Eur. Rev. Med. Pharmacol. Sci. 25, 5063–5069. doi: 10.26355/eurrev_202108_26464
Fourcade, A., and Khonsari, R. (2019). Deep learning in medical image analysis: a third eye for doctors. J. Stomatol. Oral Maxillofac. Surg. 120, 279–288. doi: 10.1016/j.jormas.2019.06.002
Gao, S.-H., Cheng, M.-M., Zhao, K., Zhang, X.-Y., Yang, M.-H., and Torr, P. (2019). Res2net: a new multi-scale backbone architecture. IEEE Trans. Pattern Anal. Mach. Intell. 43, 652–662. doi: 10.1109/TPAMI.2019.2938758
Giannitto, C., Sposta, F. M., Repici, A., Vatteroni, G., Casiraghi, E., Casari, E., et al. (2020). Chest CT in patients with a moderate or high pretest probability of COVID-19 and negative swab. Radiol. Med. 125, 1260–1270. doi: 10.1007/s11547-020-01269-w
Giavarina, D. (2015). Understanding bland Altman analysis. Biochem. Med. 25, 141–151. doi: 10.11613/BM.2015.015
Gibson, U. E., Heid, C. A., and Williams, P. M. (1996). A novel method for real time quantitative RT-PCR. Genome Res. 6, 995–1001. doi: 10.1101/gr.6.10.995
Gozes, O., Frid-Adar, M., Greenspan, H., Browning, P. D., Zhang, H., Ji, W., et al. (2020). "Rapid AI development cycle for the coronavirus (COVID-19) pandemic: initial results for automated detection & patient monitoring using deep learning CT image analysis." arXiv [Preprint]. doi: 10.48550/arXiv.2308.05037
Hamet, P., and Tremblay, J. (2017). Artificial intelligence in medicine. Metabolism 69, S36–S40. doi: 10.1016/j.metabol.2017.01.011
He, K., Zhang, X., Ren, S., and Sun, J. (2016). "Deep residual learning for image recognition" in Proceedings of the IEEE Conference on Computer Vision and Pattern Recognition, Las Vegas, NV, USA, 27–30 June 2016. IEEE, 770–778.
Hesamian, M. H., Jia, W., He, X., and Kennedy, P. (2019). Deep learning techniques for medical image segmentation: achievements and challenges. J. Digit. Imaging 32, 582–596. doi: 10.1007/s10278-019-00227-x
Hou, S. M., Jia, C. L., Hou, M. J., Fernandes, S. L., and Guo, J. C. (2021). A study on weak edge detection of COVID-19's CT images based on histogram equalization and improved canny algorithm. Comput. Math. Methods Med. 2021:5208940. doi: 10.1155/2021/5208940
Huang, H., Lin, L., Tong, R., Hu, H., Zhang, Q., Iwamoto, Y., et al. (2020)."Unet 3+: A full-scale connected unet for medical image segmentation" in ICASSP 2020–2020 IEEE International Conference on Acoustics, Speech and Signal Processing (ICASSP). IEEE, pp. 1055–1059.
Jain, P. K., Dubey, A., Saba, L., Khanna, N. N., Laird, J. R., Nicolaides, A., et al. (2022). Attention-based UNet deep learning model for plaque segmentation in carotid ultrasound for stroke risk stratification: An artificial intelligence paradigm. J. Cardiovasc. Dev. Dis. 9:326. doi: 10.3390/jcdd9100326
Jain, P. K., Sharma, N., Saba, L., Paraskevas, K. I., Kalra, M. K., Johri, A., et al. (2021). Unseen artificial intelligence—deep learning paradigm for segmentation of low atherosclerotic plaque in carotid ultrasound: a multicenter cardiovascular study. Diagnostics 11:2257. doi: 10.3390/diagnostics11122257
Jamin, A., and Humeau-Heurtier, A. (2019). (multiscale) cross-entropy methods: a review. Entropy 22:45. doi: 10.3390/e22010045
Jena, B., Saxena, S., Nayak, G. K., Saba, L., Sharma, N., and Suri, J. S. (2021). Artificial intelligence-based hybrid deep learning models for image classification: the first narrative review. Comput. Biol. Med. 137:104803. doi: 10.1016/j.compbiomed.2021.104803
Ker, J., Wang, L., Rao, J., and Lim, T. (2017). Deep learning applications in medical image analysis. IEEE Access 6, 9375–9389.
Khanna, N. N., Maindarkar, M., Puvvula, A., Paul, S., Bhagawati, M., Ahluwalia, P., et al. (2022). Vascular implications of COVID-19: role of radiological imaging, artificial intelligence, and tissue characterization: a special report. J. Cardiovasc. Dev. Dis. 9:268. doi: 10.3390/jcdd9080268
Kuchana, M., Srivastava, A., das, R., Mathew, J., Mishra, A., and Khatter, K. (2021). AI aiding in diagnosing, tracking recovery of COVID-19 using deep learning on chest CT scans. Multimed. Tools Appl. 80, 9161–9175. doi: 10.1007/s11042-020-10010-8
Litjens, G., Kooi, T., Bejnordi, B. E., Setio, A. A. A., Ciompi, F., Ghafoorian, M., et al. (2017). A survey on deep learning in medical image analysis. Med. Image Anal. 42, 60–88. doi: 10.1016/j.media.2017.07.005
Lizzi, F., Agosti, A., Brero, F., Cabini, R. F., Fantacci, M. E., Figini, S., et al. (2021). "Quantification of pulmonary involvement in COVID-19 pneumonia by means of a cascade oftwo U-nets: training and assessment on multipledatasets using different annotation criteria." arXiv [Preprint]. doi: 10.48550/arXiv.2309.02566
Ma, J., Wang, Y., An, X., Ge, C., Yu, Z., Chen, J., et al. (2021). Toward data-efficient learning: a benchmark for COVID-19 CT lung and infection segmentation. Med. Phys. 48, 1197–1210. doi: 10.1002/mp.14676
Ma, H., et al. (2021). "Quantization backdoors to deep learning models." arXiv [Preprint]. doi: 10.48550/arXiv.2108.09187
Maniruzzaman, M., Rahman, M. J., al-MehediHasan, M., Suri, H. S., Abedin, M. M., el-Baz, A., et al. (2018). Accurate diabetes risk stratification using machine learning: role of missing value and outliers. J. Med. Syst. 42, 1–17. doi: 10.1007/s10916-018-0940-7
McIlhagga, W. (2011). The canny edge detector revisited. Int. J. Comput. Vis. 91, 251–261. doi: 10.1007/s11263-010-0392-0
Milletari, F., Navab, N., and Ahmadi, S.-A. (2016). "V-net: fully convolutional neural networks for volumetric medical image segmentation," in 2016 fourth international conference on 3D vision (3DV). IEEE, pp. 565–571.
Molinari, F., Liboni, W., Pavanelli, E., Giustetto, P., Badalamenti, S., and Suri, J. S. (2007). "Accurate and automatic carotid plaque characterization in contrast enhanced 2-D ultrasound images," in 2007 29th Annual International Conference of the IEEE Engineering in Medicine and Biology Society. IEEE, pp. 335–338.
Nillmani,, Sharma, N., Saba, L., Khanna, N., Kalra, M., Fouda, M., et al. (2022). Segmentation-based classification deep learning model embedded with explainable AI for COVID-19 detection in chest X-ray scans. Diagnostics 12:2132. doi: 10.3390/diagnostics12092132
Paluru, N., Dayal, A., Jenssen, H. B., Sakinis, T., Cenkeramaddi, L. R., Prakash, J., et al. (2021). Anam-net: anamorphic depth embedding-based lightweight CNN for segmentation of anomalies in COVID-19 chest CT images. IEEE Trans Neural Netw. Learn Syst. 32, 932–946. doi: 10.1109/TNNLS.2021.3054746
Pareek, G., Acharya, U. R., Sree, S. V., Swapna, G., Yantri, R., Martis, R. J., et al. (2013). Prostate tissue characterization/classification in 144 patient population using wavelet and higher order spectra features from transrectal ultrasound images. Technol. Cancer Res. Treat. 12, 545–557. doi: 10.7785/tcrt.2012.500346
Pathak, Y., Shukla, P. K., Tiwari, A., Stalin, S., and Singh, S. (2020). Deep transfer learning based classification model for COVID-19 disease. Ing. Rech. Biomed.
Qi, S., Xu, C., Li, C., Tian, B., Xia, S., Ren, J., et al. (2021). DR-MIL: deep represented multiple instance learning distinguishes COVID-19 from community-acquired pneumonia in CT images. Comput. Methods Prog. Biomed. 211:106406. doi: 10.1016/j.cmpb.2021.106406
Ramesh, A., Kambhampati, C., Monson, J. R., and Drew, P. (2004). Artificial intelligence in medicine. Ann. R. Coll. Surg. Engl. 86, 334–338. doi: 10.1308/147870804290
Razzak, M. I., Naz, S., and Zaib, A. (2018). Deep learning for medical image processing: overview, challenges and the future. Classif. BioApps, 26, 323–350. doi: 10.1007/978-3-319-65981-7_12
Ronneberger, O., Fischer, P., and Brox, T. (2015). "U-net: convolutional networks for biomedical image segmentation" in International Conference on Medical Image Computing and Computer-Assisted Intervention. Springer, pp. 234–241.
Saba, L., Banchhor, S. K., Araki, T., Viskovic, K., Londhe, N. D., Laird, J. R., et al. (2018). Intra- and inter-operator reproducibility of automated cloud-based carotid lumen diameter ultrasound measurement. Indian Heart J. 70, 649–664. doi: 10.1016/j.ihj.2018.01.024
Saba, L., Banchhor, S. K., Londhe, N. D., Araki, T., Laird, J. R., Gupta, A., et al. (2017). Web-based accurate measurements of carotid lumen diameter and stenosis severity: An ultrasound-based clinical tool for stroke risk assessment during multicenter clinical trials. Comput. Biol. Med. 91, 306–317. doi: 10.1016/j.compbiomed.2017.10.022
Saba, L., Banchhor, S. K., Suri, H. S., Londhe, N. D., Araki, T., Ikeda, N., et al. (2016). Accurate cloud-based smart IMT measurement, its validation and stroke risk stratification in carotid ultrasound: a web-based point-of-care tool for multicenter clinical trial. Comput. Biol. Med. 75, 217–234. doi: 10.1016/j.compbiomed.2016.06.010
Saba, L., Biswas, M., Suri, H. S., Viskovic, K., Laird, J. R., Cuadrado-Godia, E., et al. (2019). Ultrasound-based carotid stenosis measurement and risk stratification in diabetic cohort: a deep learning paradigm. Cardiovasc. Diagn. Ther. 9, 439–461. doi: 10.21037/cdt.2019.09.01
Saba, L., Gerosa, C., Fanni, D., Marongiu, F., la Nasa, G., Caocci, G., et al. (2020). Molecular pathways triggered by COVID-19 in different organs: ACE2 receptor-expressing cells under attack? A review. Eur. Rev. Med. Pharmacol. Sci. 24, 12609–12622. doi: 10.26355/eurrev_202012_24058
Saba, L., Maindarkar, M., Khanna, N. N., Johri, A. M., Mantella, L., Laird, J. R., et al. (2023). A pharmaceutical paradigm for cardiovascular composite risk assessment using novel Radiogenomics risk predictors in precision explainable artificial intelligence framework: clinical trial tool. Front. Biosci. 28:248. doi: 10.31083/j.fbl2810248
Saba, L., Sanagala, S. S., Gupta, S. K., Koppula, V. K., Johri, A. M., Khanna, N. N., et al. (2021). Multimodality carotid plaque tissue characterization and classification in the artificial intelligence paradigm: a narrative review for stroke application. Ann. Transl. Med. 9:1206. doi: 10.21037/atm-20-7676
Saba, L., and Suri, J. S. (2013). Multi-Detector CT Imaging: Principles, Head, Neck, and Vascular Systems. Boca Raton: CRC Press.
Salehi, S., Abedi, A., Balakrishnan, S., and Gholamrezanezhad, A. (2020). Coronavirus disease 2019 (COVID-19): a systematic review of imaging findings in 919 patients. AJR Am. J. Roentgenol. 215, 87–93. doi: 10.2214/AJR.20.23034
Shalbaf, A., and Vafaeezadeh, M. (2021). Automated detection of COVID-19 using ensemble of transfer learning with deep convolutional neural network based on CT scans. Int. J. Comput. Assist. Radiol. Surg. 16, 115–123. doi: 10.1007/s11548-020-02286-w
Shen, D., Wu, G., and Suk, H.-I. (2017). Deep learning in medical image analysis. Annu. Rev. Biomed. Eng. 19, 221–248. doi: 10.1146/annurev-bioeng-071516-044442
Shore, J., and Johnson, R. (1981). Properties of cross-entropy minimization. IEEE Trans. Inf. Theory 27, 472–482. doi: 10.1109/TIT.1981.1056373
Shrivastava, V. K., Londhe, N. D., Sonawane, R. S., and Suri, J. S. (2015). Reliable and accurate psoriasis disease classification in dermatology images using comprehensive feature space in machine learning paradigm. Expert Syst. Appl. 42, 6184–6195. doi: 10.1016/j.eswa.2015.03.014
Simonyan, K., and Zisserman, A. (2014). "Very deep convolutional networks for large-scale image recognition." arXiv [Preprint]. doi: 10.48550/arXiv.1409.1556
Skandha, S. S., Nicolaides, A., Gupta, S. K., Koppula, V. K., Saba, L., Johri, A. M., et al. (2022). A hybrid deep learning paradigm for carotid plaque tissue characterization and its validation in multicenter cohorts using a supercomputer framework. Comput. Biol. Med. 141:105131. doi: 10.1016/j.compbiomed.2021.105131
Sluimer, I., Schilham, A., Prokop, M., and Van Ginneken, B. (2006). Computer analysis of computed tomography scans of the lung: a survey. IEEE Trans. Med. Imaging 25, 385–405. doi: 10.1109/TMI.2005.862753
Suri, J. S., Agarwal, S., Chabert, G., Carriero, A., Paschè, A., Danna, P., et al. (2022a). COVLIAS 2.0-cXAI: cloud-based explainable deep learning system for COVID-19 lesion localization in computed tomography scans. Diagnostics 12:1482. doi: 10.3390/diagnostics12061482
Suri, J. S., Agarwal, S., Saba, L., Chabert, G. L., Carriero, A., Paschè, A., et al. (2022b). Multicenter study on COVID-19 lung computed tomography segmentation with varying glass ground opacities using unseen deep learning artificial intelligence paradigms: COVLIAS 1.0 validation. J. Med. Syst. 46, 1–29. doi: 10.1007/s10916-022-01850-y
Suri, J. S., and Rangayyan, R. M. (2006). Breast Imaging, Mammography, and Computer-Aided Diagnosis of Breast Cancer. SPIE Bellingham, WA, USA: SPIE Press.
Viswanathan, V., Puvvula, A., Jamthikar, A. D., Saba, L., Johri, A. M., Kotsis, V., et al. (2021). Bidirectional link between diabetes mellitus and coronavirus disease 2019 leading to cardiovascular disease: a narrative review. World J. Diabetes 12, 215–237. doi: 10.4239/wjd.v12.i3.215
WHO (2022). WHO coronavirus (COVID-19) dashboard. Available at: https://covid19.who.int/ (Accessed Janurary 24, 2022).
Wu, Y.-H., Gao, S. H., Mei, J., Xu, J., Fan, D. P., Zhang, R. G., et al. (2021). Jcs: An explainable covid-19 diagnosis system by joint classification and segmentation. IEEE Trans. Image Process. 30, 3113–3126. doi: 10.1109/TIP.2021.3058783
Wu, X., Hui, H., Niu, M., Li, L., Wang, L., He, B., et al. (2020). Deep learning-based multi-view fusion model for screening 2019 novel coronavirus pneumonia: a multicentre study. Eur. J. Radiol. 128:109041. doi: 10.1016/j.ejrad.2020.109041
Wu, H., Judd, P., Zhang, X., Isaev, M., and Micikevicius, P. (2020). "Integer quantization for deep learning inference: principles and empirical evaluation." arXiv [Preprint]. doi: 10.48550/arXiv.2004.09602
Xie, X., Zhong, Z., Zhao, W., Zheng, C., Wang, F., and Liu, J. (2020). Chest CT for typical coronavirus disease 2019 (COVID-19) pneumonia: relationship to negative RT-PCR testing. Radiology 296, E41–E45. doi: 10.1148/radiol.2020200343
Xu, X., Jiang, X., Ma, C., du, P., Li, X., Lv, S., et al. (2020). A deep learning system to screen novel coronavirus disease 2019 pneumonia. Engineering 6, 1122–1129. doi: 10.1016/j.eng.2020.04.010
Yang, X., He, X., Zhao, J., Zhang, Y., Zhang, S., and Xie, P. (2020). "COVID-CT-dataset: a CT scan dataset about COVID-19." arXiv [Preprint]. doi: 10.48550/arXiv.2003.13865
Zhang, P., Zhong, Y., Deng, Y., Tang, X., and Li, X. (2020). CoSinGAN: learning COVID-19 infection segmentation from a single radiological image. Diagnostics 10:901. doi: 10.3390/diagnostics10110901
Zhou, T., Ruan, S., and Canu, S. (2019). A review: deep learning for medical image segmentation using multi-modality fusion. Array 3:100004.
Keywords: COVID-19, computed tomography, COVID lesions, glass ground opacities, segmentation, hybrid deep learning, quantization
Citation: Agarwal S, Saxena S, Carriero A, Chabert GL, Ravindran G, Paul S, Laird JR, Garg D, Fatemi M, Mohanty L, Dubey AK, Singh R, Fouda MM, Singh N, Naidu S, Viskovic K, Kukuljan M, Kalra MK, Saba L and Suri JS (2024) COVLIAS 3.0: cloud-based quantized hybrid UNet3+ deep learning for COVID-19 lesion detection in lung computed tomography. Front. Artif. Intell. 7:1304483. doi: 10.3389/frai.2024.1304483
Edited by:
Rashid Mehmood, King Abdulaziz University, Saudi ArabiaCopyright © 2024 Agarwal, Saxena, Carriero, Chabert, Ravindran, Paul, Laird, Garg, Fatemi, Mohanty, Dubey, Singh, Fouda, Singh, Naidu, Viskovic, Kukuljan, Kalra, Saba and Suri. This is an open-access article distributed under the terms of the Creative Commons Attribution License (CC BY). The use, distribution or reproduction in other forums is permitted, provided the original author(s) and the copyright owner(s) are credited and that the original publication in this journal is cited, in accordance with accepted academic practice. No use, distribution or reproduction is permitted which does not comply with these terms.
*Correspondence: Sushant Agarwal, c3VzaGFudC5hZzA5QGdtYWlsLmNvbQ==; Jasjit S. Suri, amFzaml0LnN1cmlAYXRoZXJvcG9pbnQuY29t
Disclaimer: All claims expressed in this article are solely those of the authors and do not necessarily represent those of their affiliated organizations, or those of the publisher, the editors and the reviewers. Any product that may be evaluated in this article or claim that may be made by its manufacturer is not guaranteed or endorsed by the publisher.
Research integrity at Frontiers
Learn more about the work of our research integrity team to safeguard the quality of each article we publish.