- 1Department of Anatomy, Biomedical Center, Faculty of Medicine, University of Iceland, Reykjavik, Iceland
- 2Department of Biochemistry and Molecular Biology, Biomedical Center, Faculty of Medicine, University of Iceland, Reykjavik, Iceland
Age-related decline occurs in most brain structures and sensory systems. An illustrative case is olfaction. The olfactory bulb (OB) undergoes deterioration with age, resulting in reduced olfactory ability. A decline in olfaction is also associated with early symptoms of neurodegenerative diseases, including Alzheimer’s disease (AD) and Parkinson’s disease (PD). However, the underlying reasons are unclear. The microphthalmia-associated transcription factor (MITF) is expressed in the projection neurons (PNs) of the OB–the mitral and tufted (M/T) cells. Primary M/T cells from Mitf mutant mice show hyperactivity, potentially attributed to the reduced expression of a key potassium channel subunit, Kcnd3/Kv4.3. This influences intrinsic plasticity, an essential mechanism involving the non-synaptic regulation of neuronal activity. As neuronal hyperactivity often precedes neurodegenerative conditions, the current study aimed to determine whether the absence of Mitf causes degenerative effects during aging. Aged Mitf mutant mice showed reduced olfactory ability without inflammation. However, an increase in the expression of potassium channel subunit genes in the OBs of aged Mitfmi-vga9/mi-vga9 mice suggests that during aging, compensatory mechanisms lead to stabilization.
Introduction
Aging is characterized by progressive deterioration. This includes loss of cognitive functions and reduction in the efficiency of sensory systems. Loss of sensory ability can also be a part of neuronal pathologies. The olfactory ability, the detection and discrimination of odors, shows an age-dependent decrease in humans (Rawson et al., 2012; Schubert et al., 2017) and rodents (Patel and Larson, 2009). However, olfactory impairment is also associated with a wide range of neurodegenerative and cognitive diseases, including Alzheimer’s disease (AD) (Murphy, 2019; Tzeng et al., 2021) and Parkinson’s disease (PD) (Doty, 2012; Fullard et al., 2017). Moreover, partial or total loss of olfactory ability (hyposmia or anosmia) contributes to depression (Sabiniewicz et al., 2022) and affects daily life (Schäfer et al., 2021). Olfactory dysfunction is therefore both a possible biomarker and a causal factor of disease. It is therefore important to investigate the underlying pathological mechanisms of olfactory dysfunction during aging.
The olfactory bulb (OB) is the first structure in the central nervous system (CNS) responsible for processing olfactory information. It is a well-defined and multi-layered structure with well-characterized neuronal subtypes (Nagayama et al., 2014). The olfactory process starts at the olfactory sensory neurons (OSNs) in the olfactory epithelium (OE), which detect odor molecules and synapse with two kinds of projection neurons (PNs), the mitral and tufted (M/T) cells and periglomerular cells (PGCs) in the OB (Lodovichi and Belluscio, 2012). The M/T cells transmit information to the piriform cortex (PCx) and other olfactory-associated brain areas, such as the olfactory tubercle (OT), amygdala, and orbitofrontal cortex (OCx) (Mori et al., 2013). Any changes in neuronal turnover, function, or morphology can affect the OB circuitry, which may contribute to impaired olfaction. The known impairments that cause an age-related decline in the olfactory system include structural, molecular, and functional modulations in the OE, main olfactory bulb (MOB), and other regions that are involved in olfactory processing (Doty and Kamath, 2014).
The microphthalmia-associated transcription factor (Mitf) encodes a member of the Myc supergene family of basic helix–loop–helix zipper (bHLH-Zip) transcription factors (Goding and Arnheiter, 2019; Steingrímsson et al., 2004). The MITF protein, which is known as a master regulator of melanocytes, also plays central roles in mast cells (Oppezzo and Rosselli, 2021) and osteoclasts (Lu et al., 2010; Steingrimsson et al., 2002) and has a distinct expression in the M/T cells (Atacho et al., 2020; Ohba et al., 2015). Previous studies have shown that Mitf plays a role in the intrinsic plasticity of primary M/T cells of the mouse OB. Its loss leads to increased neuronal excitability (Atacho et al., 2020). This suggests a role in homeostatic plasticity, which refers to the adjustment of neuronal activity towards a set point (Turrigiano, 2012). Primary PNs from young Mitfmi-vga9/mi-vga9 mice are hyperactive, likely due to a reduced expression of potassium channel subunits (Atacho et al., 2020). As neuronal hyperactivity is a hallmark feature of the early phase of neurodegeneration (Chase and Markopoulou, 2020; Hector and Brouillette, 2020; Marin et al., 2018; Targa Dias Anastacio et al., 2022), it is of interest to determine whether the lack of Mitf has detrimental effects in the aged mouse OB. This question was addressed by examining markers of inflammation, evaluating the number of PNs, and analyzing global gene expression. The results suggest a buffering of neuronal activity via compensatory mechanisms in aging Mitfmi-vga9/mi-vga9 mice. The study contributes to further identifying and understanding the mechanisms behind CNS adaptation to neuronal activity dysregulation during aging.
Material and methods
Animals
All in vivo procedures were approved by the Committee on Experimental Animals and were in accordance with Regulation 460/2017 and European Union Directive 2010/63 (license number 2013-03-01). Wild-type (C57BL/6J) and homo- and heterozygous Mitfmi-vga9 mutant mice were used in this study. The Mitfmi-vga9 mutation is a loss-of-function mutation caused by transgene insertion affecting the expression of Mitf (Hodgkinson et al., 1993; Tachibana et al., 1992). Mice were housed at the mouse facility at the University of Iceland, in groups of two to three per cage under controlled conditions (21°C–22°C; 12 h light/12 h dark). Unless indicated otherwise, food and water were provided ad libitum.
Behavior: hidden food assay
The hidden food assay was performed during the active phase of mice in the dark cycle. Three age groups of mice, namely, 1–2 months old (five female and five male C57BL/6J mice; four female and six male Mitfmi-vga9/+ mice; and five female and five male Mitfmi-vga9/mi-vga9 mice); 8–12 months old (six female and four male C57BL/6J mice; one female and nine male Mitfmi-vga9/+ mice; and five female and five male Mitfmi-vga9/mi-vga9 mice); and 14–27 months old (six female and four male C57BL/6J mice; five female and five male Mitfmi-vga9/+ mice; and six female and three male Mitfmi-vga9/mi-vga9 mice), were used in the assay. The mice were first habituated to the test environment by placing them individually in cages for 24 h. Food and water were provided ad libitum, and cocoa puffs (Nesquik General Mills) were placed in each cage in a small Petri dish (four pieces per cage) for 12 h. The consumption of cereals was monitored for 2 consecutive days to ensure that the cereals were palatable. Following overnight (O/N) starvation (experimental license number 2016-05-01), the mice were kept in an odor-free room for 1 h with no water, food, or cereals. Each mouse was tested separately. In the assay, a cereal was hidden in an opposite corner under the bedding in a new cage, and the time spent finding it was measured.
Immunofluorescence
The mice were transcardially perfused (license number: 2014-07-02) with 1 × phosphate-buffered saline (PBS; Gibco, cat# 18912-014), followed by 4% paraformaldehyde (4% PFA; Sigma-Aldrich, cat# P6148) in 1 × PBS, pH 7.4. Subsequently, brains were post-fixed with 4% PFA in 1 × PBS at 4°C O/N. Following this, the brains were rinsed with 1 × PBS for 2 days. OBs from young and aged C57BL/6J and Mitfmi-vga9/mi-vga9 mice were dissected and placed in a Peel-A-Way disposable plastic tissue Embedding Molds (Polysciences, Inc.) filled with 5% agarose (Invitrogen, cat# 15517-014) dissolved in dH2O. The OBs were sectioned into 50 μm thin sections at room temperature (RT) using a microtome, Microm HM 650V (Thermo Scientific), and were maintained at 4°C until further use. The sections were blocked in blocking buffer composed of 10% normal goat serum (NGS; Gibco, cat# 16210-064) and 0.3% Triton X-100 (Sigma, cat# T8787) in 1 × PBS for 1 h at RT and were then incubated with primary antibodies diluted in the blocking buffer at 4°C O/N. The primary antibodies used in this study were as follows: rabbit polyclonal anti-GFAP (1:1,000; Abcam, ab7260), rabbit monoclonal [EPR16588] anti-Iba-1 (1:1,000; Abcam, ab178846), rabbit monoclonal [EPR21950] anti-Tbr2/Eomes (1:1,000; ab216870), and rabbit monoclonal [EPR8138(2)] anti-Tbr1 (1:1,000; ab183032). Following three washing steps with 1 × PBS for 5 min each, the sections were incubated with secondary antibodies, Alexa Flour 546 IgG anti-rabbit for anti-GFAP and anti-Iba-1, Alexa Flour goat 647 IgG anti-rabbit for anti-Tbr2/Eomes and anti-Tbr1 (Life Technologies; each diluted at 1:1,000 in the blocking buffer), and DAPI (1:1,000; Sigma, cat# D9542) for 1 h at RT in the dark. After washing with 1 × PBS, the tissues were placed on Menzel–Gläser Superfrost Plus microscope slides (Thermo Scientific, cat# 2621573) and mounted using Fluoromount Aqueous Mounting Medium (Sigma-Aldrich, cat# F4680). Imaging was performed at 20 × magnification using 20 confocal Z-stacks. Four images were obtained from each section, two from lateral and two from the medial OB. The sex of the animals used for staining of each antibody was as follows: for GFAP and Iba-1, young mice included six female and four male C57BL/6J and three female and seven male Mitfmi-vga9/mi-vga9, while aged mice included five female and five male C57BL/6J and six female and four male Mitfmi-vga9/mi-vga9. For Tbr2/Eomes staining, two female and three male C57BL/6J and four female and two male Mitfmi-vga9/mi-vga9 mice were used. For Tbr1 staining, young mice included two female and one male C57BL/6J, and three male Mitfmi-vga9/mi-vga9, while aged mice included one female and two male C57BL/6J and two female and one male Mitfmi-vga9/mi-vga9 mouse.
Golgi–Cox staining for light microscopy
Golgi–Cox staining was performed according to the protocol described by Vints et al. (2019). Briefly, PFA-fixed OB sections from aged C57BL/6J and Mitfmi-vga9/mi-vga9 (four male C57BL/6J; two female and two male Mitfmi-vga9/mi-vga9) mice were incubated in Golgi–Cox solution, a mixture of 5% mercury chloride (Sigma-Aldrich, cat# M1136), 5% potassium dichromate (Sigma-Aldrich, cat# 207802), and 5% potassium chromate (Sigma-Aldrich, cat# 216615), for 15 days at RT in the dark. On day 15, the sections were washed three times for 5 min with dH2O and transferred to 28% ammonium hydroxide (Sigma-Aldrich, cat# 221228) in dH2O for 30 min at RT with rotation. Following three washing steps with dH2O, the sections were incubated in 15% ILFORD RAPID FIXER (Harman Technology Limited) in dH2O for 10 min at RT and then washed three times with dH2O. The sections were placed on Menzel–Gläser Superfrost Plus slides (Thermo Scientific, cat# 2621573), dried at RT, and mounted with the Mowiol 4-88 (Aldrich, cat# 81381) mounting medium. Slides were imaged using a Leica light microscope.
Western blotting
Mice were sacrificed by cervical dislocation. OBs from young and aged C57BL/6J and Mitfmi-vga9/mi-vga9 (young mice: one female and two male C57BL/6J, two female and one male Mitfmi-vga9/mi-vga9; aged mice: two female and one male C57BL/6J, one female and two male Mitfmi-vga9/mi-vga9) mice were weighed and homogenized in radioimmunoprecipitation assay (RIPA) buffer (250 mM NaCl, 1% IGEPAL CA-630, 0.5% sodium deoxycholate, 0.1% sodium dodecyl sulfate, and 50 mM Tris-HCl, pH 8.0) containing 1 × Halt protease and phosphatase inhibitor cocktail (Thermo Scientific, cat# 78440). Lysates were spun at 16,000 × g for 10 min at 4°C, and the supernatant was transferred to a new tube. After determining the protein concentration with a Bradford protein assay using the Bradford reagent (Sigma-Aldrich, cat# B6916), each sample was diluted with an appropriate volume of RIPA buffer mixed with 1 × Halt protease and phosphatase inhibitor cocktail to achieve a final amount of 20 µg protein. Following this, 2 × sample buffer (4% sodium dodecyl sulfate, 20% glycerol, bromophenol blue 0.02%, and 120 mM Tris-HCl, pH 6.8) containing 5% β-mercaptoethanol (Sigma-Aldrich, cat# M6250) was added to each sample at a 1:1 ratio, and the lysates were heated at 95°C for 5 min. The protein lysates were run on 12.5% SDS-PAGE gel and transferred onto a 0.2-µm PVDF membrane (Thermo Scientific, cat# 88520). The membrane was incubated in a blocking buffer consisting of 5% non-fat dried milk in 1 × Tris-buffered saline/0.1% Tween 20 (TBS-T) for 1 h at RT. Following this, the membranes were incubated O/N at 4°C with the following primary antibodies diluted in the blocking solution: rabbit polyclonal anti-GFAP (1:1,000; Abcam, cat# ab7260), rabbit monoclonal [EPR16588] anti-Iba-1 [1:1,000; Abcam, ab178846 (EPR16588)], and mouse monoclonal anti-beta actin (1:5000; ab8224) or mouse monoclonal anti-GAPDH (1:5,000; ab8245). The membranes were washed with 1 × TBS-T and incubated for 1 h at RT with the following secondary antibodies diluted at 1:10,000 in the blocking buffer: IRDye goat anti-rabbit IgG 800 (green; LI-COR Biosciences) or IRDye donkey anti-mouse IgG1 680 (red; LI-COR Biosciences). After washing with 1 × TBS-T, the membranes were imaged using the Odyssey CLx Imager (LI-COR Biosciences).
RNA sequencing and data analysis
OBs from aged C57BL/6J and Mitfmi-vga9/mi-vga9 mice (two female and one male C57BL/6J; two female and one male Mitfmi-vga9/mi-vga9) were dissected and flash-frozen in liquid nitrogen. Tissues were homogenized in 1 × DNA/RNA protection reagent (New England Biolabs Inc., Part: T2011-1), and RNA was isolated using a commercially available kit (Monarch Total RNA Miniprep Kit; New England Biolabs Inc., cat# T2010S).
The quality (RIN score) and quantity of the isolated total RNA samples were evaluated using the DNA 5K/RNA chip on the LabChip GX instrument. To create cDNA libraries from poly-A mRNA, Illumina’s TruSeq RNA v2 Sample Prep Kit (Illumina, RS-122-2001) was used. This process involved isolating poly-A mRNA from the total RNA samples (0.2–1 μg input) through hybridization with poly-T beads.
Subsequently, the poly-A mRNA was fragmented at 94°C with divalent cations, followed by initiating first-strand cDNA synthesis using random hexamers and SuperScript IV Reverse Transcriptase (Invitrogen, cat# 18090010). Following this, second-strand cDNA synthesis, unique dual-indexed adapter ligation, and PCR amplification were performed. The resultant cDNA sequencing libraries were evaluated using the LabChip GX system and then diluted to 3 nM and stored at −20°C.
For the sequencing, the samples were pooled, and clustering was carried out on NovaSeq S4 flow cells. The sequencing approach involved paired-end sequencing using the XP workflow on NovaSeq 6000 instruments (Illumina). Basecalling was performed in real-time using RTA v3.4.4. The process of demultiplexing BCL files and generating FASTQ files was done using bcl2fastq2 v.2.20.
A companion package of Kallisto (v 0.46.1) (Bray et al., 2016) was used to quantify transcript abundance following the pseudoalignment of RNA-seq data to the mouse reference genome (Mus musculus.GRCm38.96) (Yates et al., 2016). Differentially expressed (DE) genes in the OBs of aged C57BL/6J and Mitfmi-vga9/mi-vga9 mice (n = 3 per genotype) were identified using Sleuth (Pimentel et al., 2017). The significance of DE genes (p-/q-values) and the fold change (beta estimate) were determined using the likelihood test (LRT) intersected in Sleuth.
Volcano plots were used to represent DE genes between aged Mitfmi-vga9/mi-vga9 and C57BL/6J OBs by plotting the significance on the y-axis and cut-off of fold change on the x-axis (q-value ≤ 0.05; cut-off of |b-value (fold change)| ≥ 0.7) using R packages “ggplot2” and “ggrepel.” R package “cowplot” was used to create bar graphs showing TPM values of each gene between aged Mitfmi-vga9/mi-vga9 and C57BL/6J. Functional enrichment analyses (GO terms) in molecular functions (MF) and enrichment analysis of pathways (KEGG) were generated combining p-value ≤ 0.05 and cut-off of |b-value (fold change)| ≥0.7 with “clusterProfiler” in the Bioconductor R package (Yu et al., 2012).
Quantification of Tbr2/Eomes and Tbr1-positive cells
Tbr2/Eomes and Tbr1-positive cells from OB sections of young and aged C57BL/6J and Mitfmi-vga9/mi-vga9 mice were counted using ImageJ software. Briefly, the software application was uploaded with oib images of the lateral and medial OB, showing the GL, EPL, and MCL. After stacking the image at “Maximum Intensity” using the “Z-project” analyzing method of the software application, the image channels were split. Subsequently, the channel showing Tbr2/Eomes or Tbr1 antibody staining was chosen. To make weaker stained cells more distinguishable, the channel was converted to grayscale, and Tbr2/Eomes and Tbr1-positive cells in the GL, EPL, and MCL were counted manually in the lateral and medial OB. The average number of cells per image was calculated.
Analysis of Golgi–Cox images
Dendrite segmentation was performed using a pix2pix conditional generative adversarial network (cGAN) machine learning model with a resolution of 256 × 256 pixels and three-color channels. The training dataset included annotated sections from four images with random patches and augmentations applied during training. Model weights were saved every 50 steps to mitigate memory loss, and the best model was selected post-training. During inference, the model was applied multiple times across the image with different offsets to avoid artifacts. The segmentation accuracy was assessed qualitatively by experts on 32 images. Post-inference processing to quantify dendrite properties was performed using custom Python code and relevant libraries. These metrics were then analyzed for correlations with aged Mitfmi-vga9/mi-vga9 compared to C57BL/6J.
Statistical analysis
At least three mice per genotype and age group were included in the study. Quantitative results were analyzed using two-way ANOVA and two-tailed unpaired Student’s t-tests using the R statistical package. To obtain p-values for ANOVA tests, multiple comparisons were conducted with Sidak’s and Tukey’s corrections. The numerical results represent the mean and standard deviation (SD). The criteria for significance levels used to generate volcano plots and bar graphs from RNA-seq analysis are described both in Materials and Methods and in the corresponding figure legends.
Results
Reduced olfactory ability is frequently observed in aged Mitfmi-vga9/mi-vga9 mice
To assess the role of aging in the olfactory ability of Mitfmi-vga9/mi-vga9 mice, a hidden food assay was performed with young and aged C57BL/6J, Mitfmi-vga9/+, and Mitfmi-vga9/mi-vga9 mice. The mice were divided into three age groups: 1–2, 8–12, and 14–27 months old. Diagrammatic representation of the assay setup is given in Figure 1A. Young Mitfmi-vga9/mi-vga9 mice behaved similar to young C57BL/6J and Mitfmi-vga9/+ mice, whereas aged Mitfmi-vga9/mi-vga9 mice often had significantly reduced olfactory ability compared to aged C57BL/6J mice. The olfactory ability of 8–12-month-old Mitfmi-vga9/mi-vga9 mice was 15% lower than that of C57BL/6J mice (8–12 months old: t (80) =−2.584, p = 0.0308). In the age range of 14–27 months, Mitfmi-vga9/mi-vga9 mice showed a 34.5% decrease in the olfactory ability compared to C57BL/6J mice (14–27 months old: t (80) =−2.969, p = 0.0109, Tukey’s correction method) (Figure 1B). Variation in the time that Mitfmi-vga9/+ and Mitfmi-vga9/mi-vga9 mice spent searching was high, some showing a similar olfactory ability to C57BL/6J mice. In the aged groups, there were individual Mitfmi-vga9/mi-vga9 mice that showed severely reduced olfactory ability. Interestingly, Mitfmi-vga9/+ mice, which are phenotypically similar to C57BL/6J (i.e., black coat color, normal eyes, and presence of melanocytes and mast cells), showed a trend of reduced olfactory ability. This suggests that the effect is primary, rather than secondary due to Mitf pleiotropy and indicates a dosage effect associated with the Mitf mutation, which is in accordance with previous studies (Atacho et al., 2020; Ingason et al., 2019; Sabaté San José and Petersen, 2024).
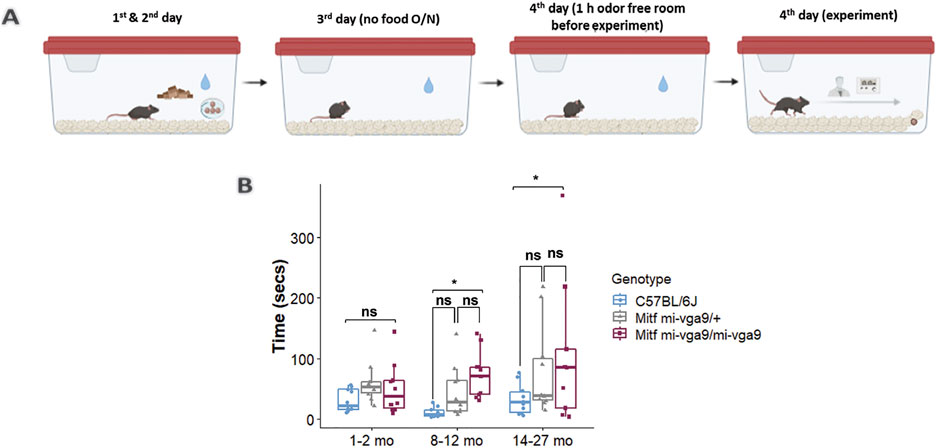
Figure 1. Aged Mitfmi-vga9/mi-vga9 mice have reduced olfactory ability. (A) Setup of the hidden food assay. (B) Results of the hidden food assay showing the time spent by three age groups of C57BL/6J, Mitfmi-vga9/+, and Mitfmi-vga9/mi-vga9 mice to find the hidden cereal. N = 10 per genotype in age groups 1–2 months and 8–12 months; n = 10 for C57BL/6J and Mitfmi-vga9/+, and n = 9 for 14–27-month-old Mitfmi-vga9/mi-vga9. p-values were calculated using two-way ANOVA and adjusted with Tukey’s correction method. *p < 0.05; ns, not significant; mo, months old.
Potassium channel expression in the aged Mitfmi-vga9/mi-vga9 OB
Loss of Mitf leads to increased neuronal activity in primary PNs of young Mitfmi-vga9/mi-vga9 OBs due to reduced IA potassium currents (Atacho et al., 2020). Single-molecule fluorescence in situ hybridization (smFISH) revealed decreased expression of potassium channel subunit Kcnd3 (Kv4.3), correlated with increased neuronal activity in primary PNs of young Mitfmi-vga9/mi-vga9 mice. On the other hand, the expression of Kcnd2 (Kv4.2) was increased in M/T cells of Mitfmi-vga9/mi-vga9 mice, possibly due to a compensatory mechanism (Atacho et al., 2020). Given the hyperactivity in young Mitfmi-vga9/mi-vga9 OB primary M/T cells (Atacho et al., 2020), global gene expression analysis of aged Mitfmi-vga9/mi-vga9 and C57BL/6J OBs was performed to examine the effects of aging on the expression of potassium channel subunits (Figure 2A; Supplementary Material provides a list of DE genes in the aged Mitfmi-vga9/mi-vga9 OB). Aged mice in this and subsequent analysis were 14–27 months old. Indications of inflammation or degeneration were also of interest.
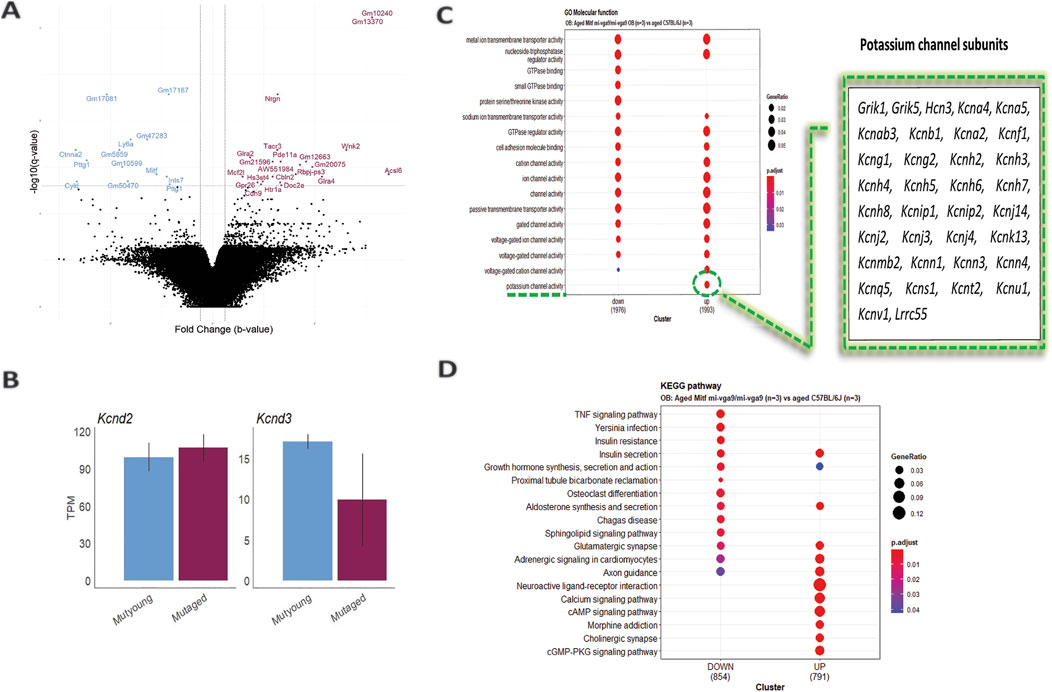
Figure 2. Increased potassium channel activity in the aged Mitfmi-vga9/mi-vga9 OB. (A) Volcano plot shows DE genes in the OB of aged Mitfmi-vga9/mi-vga9 mice compared to aged C57BL/6J mice. Blue indicates decreased DE genes, and purple indicates increased DE genes. N = 3 per genotype. (B) RNA expression of Kcnd3 and Kcnd2 in TPM in young (MUTyoung) and aged (MUTaged) Mitfmi-vga9/mi-vga9 mice. N = 3 per age group. (C) GO Molecular Function (MF) analysis between aged Mitfmi-vga9/mi-vga9 and aged C57BL/6J mice. The table shows genes enriched in the potassium channel activity cluster. (D) KEGG pathway analysis between aged Mitfmi-vga9/mi-vga9 and aged C57BL/6J mice. N = 3 per genotype.
The potassium channel subunit (Kcnd3) previously shown to be reduced in expression in young Mitfmi-vga9/mi-vga9 mice was not differentially expressed in aged Mitfmi-vga9/mi-vga9 mice compared to aged C57BL/6J OB animals. It also remained similar when comparing aged and young Mitfmi-vga9/mi-vga9 mice, suggesting that aging has no impact on global Kcnd3 and Kcnd2 expression (Figure 2B). A likely explanation is that the sensitivity and spatial resolution of smFISH allow this method to detect subtle changes in specific cell types, which the global RNA-seq misses.
To investigate the biological functions of differentially expressed genes between aged Mitfmi-vga9/mi-vga9 and C57BL/6J OBs, Gene Ontology (GO) and Kyoto Encyclopedia of Genes and Genomes (KEGG) pathway analyses were performed. GO molecular function (GO MF) identified overlapping categories between genes with increased and decreased DE; the genes with decreased DE were enriched in GTPase binding, small GTPase binding, and protein serine/threonine kinase activity. However, in general, the expression of potassium channel subunits was increased in the aged Mitfmi-vga9/mi-vga9 mice (Figure 2C). KEGG pathway analysis revealed that various pathways were enriched, and, again, there was considerable overlap between the up- and downregulated DE genes. Pathways such as TNF signaling, Yersinia infection, insulin resistance, proximal tubule bicarbonate reclamation, osteoclast differentiation, Chagas disease, and the sphingolipid signaling pathway were associated with the decreased DE genes. Pathways such as neuroactive ligand–receptor interaction, calcium signaling pathway, morphine addiction, cholinergic synapse, and the cGMP-PKG signaling pathway were enriched by the increased DE genes (Figure 2D). However, no clear functional connection was observed with neurodegeneration or inflammation.
Dendritic morphology in OBs does not change upon aging of Mitfmi-vga9/mi-vga9 mice
Dendritic morphology can be affected by long-term hyperactivity (Ugarte et al., 2023). To investigate this, the Golgi–Cox method was used to evaluate the morphology of the apical dendrites of M/T cells in aged C57BL/6J and Mitfmi-vga9/mi-vga9 OBs (Figure 3A) (Vints et al., 2019; Zhong et al., 2019). Several parameters were quantified in each genotype, including the number of segments (Figure 3B), the segment length (Figure 3C), the number of branch points (Figure 3D), and tortuosity (Figure 3E). Analysis of these parameters revealed no differences between aged Mitfmi-vga9/mi-vga9 and C57BL/6J OBs. Overall, the structure of dendrites was similar in both genotypes.
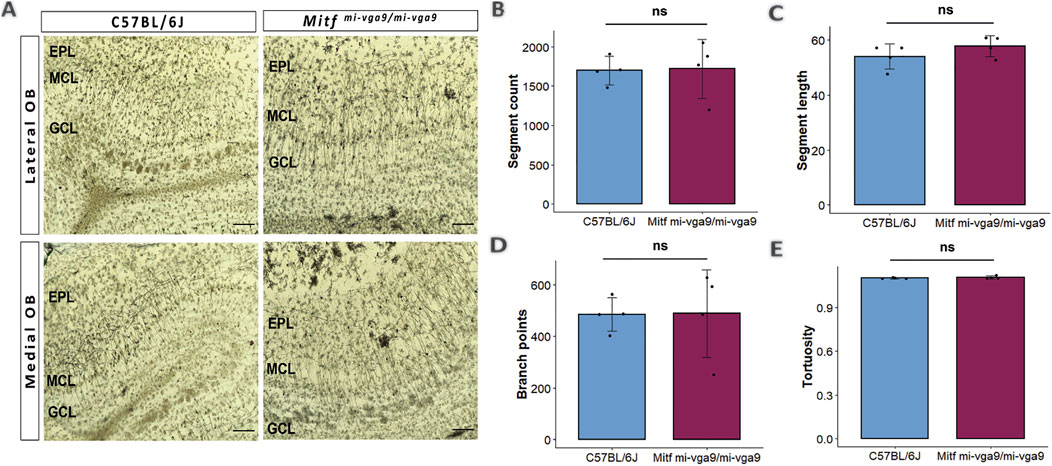
Figure 3. Dendritic morphology does not change upon aging of Mitfmi-vga9/mi-vga9 OBs. (A) Representative Golgi–Cox images from the lateral and medial OBs of aged C57BL/6J and Mitfmi-vga9/mi-vga9 mice. Analysis of Golgi–Cox images with regards to the number of segments (B), segment length (C), number of branch points (D), and tortuosity (E). Scale bar: 200 μm. N = 4 per genotype. Statistical analysis was performed using two-tailed unpaired Student’s t-test. EPL, external plexiform layer; MCL, mitral cell layer; GCL, granule cell layer; ns, not significant.
Inflammatory status does not change in Mitfmi-vga9/mi-vga9 OBs upon aging
Mitf has been shown to be an important regulator of the neurodegenerative and phagocytic transcriptional program of microglia (Dolan et al., 2023). Long-term hyperactivity in neurons is a frequent first step in neurodegeneration (Targa Dias Anastacio et al., 2022). Given the involvement of the MITF protein in the regulation of neuronal activity (Atacho et al., 2020), it is possible that the Mitf mutation may lead to neurodegeneration and subsequent inflammation, thereby contributing to the observed decrease in the olfactory ability.
To further analyze the potential effects of Mitf on neurodegeneration and inflammation during aging, the comparative gene expression analysis using RNA-seq was re-examined focusing on changes in genes associated to inflammation. The analysis showed that there were no changes in the expression of genes known to be specific to activated/reactive astrocytes (Figure 4A) or microglia activation (Figure 4B) between aged Mitfmi-vga9/mi-vga9 and C57BL/6J OBs. This confirmed that the inflammatory status of Mitfmi-vga9/mi-vga9 OBs remains unchanged upon aging.
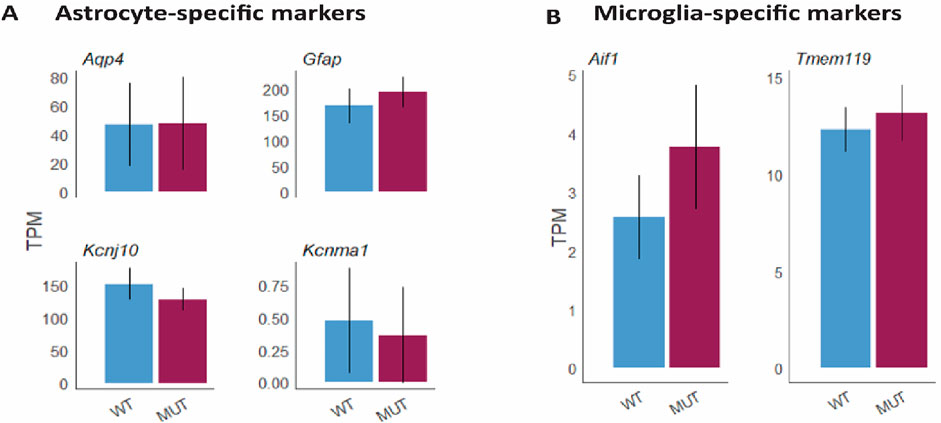
Figure 4. No change in the gene expression level of markers for astrocytes and microglia at the gene level in aged Mitfmi-vga9/mi-vga9 OB. Expression of astrocyte-specific markers (Aqp4, Gfap, Kcnj10, and Kcnma1) (A) and microglia-specific markers (Aif1, aka Iba-1, and Tmem119) (B) in TPMs in the aged Mitfmi-vga9/mi-vga9 (MUT) OB compared to the C57BL/6J (WT) OB. N = 3 per genotype.
No evidence of neuroinflammation in the aged Mitfmi-vga9/mi-vga9 OB
To further examine inflammation at the protein level, immunohistochemistry was performed on OB sections of young and aged C57BL/6J and Mitfmi-vga9/mi-vga9 mice using well-established neuroinflammation markers. Neuroinflammation and neurodegeneration in the CNS are generally studied by analyzing the state of astrocytes and microglia (Lucas et al., 2006) using GFAP, a marker for astrocytes and astrogliosis (Rodríguez et al., 2014), and Iba-1, a marker used to identify and characterize microglia (Streit et al., 2009). No pronounced changes were observed in the number of astrocytes in the OBs of young (Figure 5A) and aged (Figure 5B) C57BL/6J or Mitfmi-vga9/mi-vga9 mice. These results were confirmed with Western blot analysis of GFAP, which showed no changes in the expression in young (Figures 5C, E) or aged (Figures 5D, F) Mitfmi-vga9/mi-vga9 and C57BL/6J OBs. Likewise, there were no apparent changes in the number of microglia between OBs of young (Figure 6A) or aged (Figure 6B) Mitfmi-vga9/mi-vga9 or C57BL/6J mice. Similar results were obtained in the Western blot analysis of Iba-1. No significant difference was observed in the expression of Iba-1 between young (Figures 6C, E) and aged (Figures 6D, F) Mitfmi-vga9/mi-vga9 and C57BL/6J OBs. In summary, there was no evidence of neuroinflammation in aged Mitfmi-vga9/mi-vga9 OBs based on the expression of glia markers.
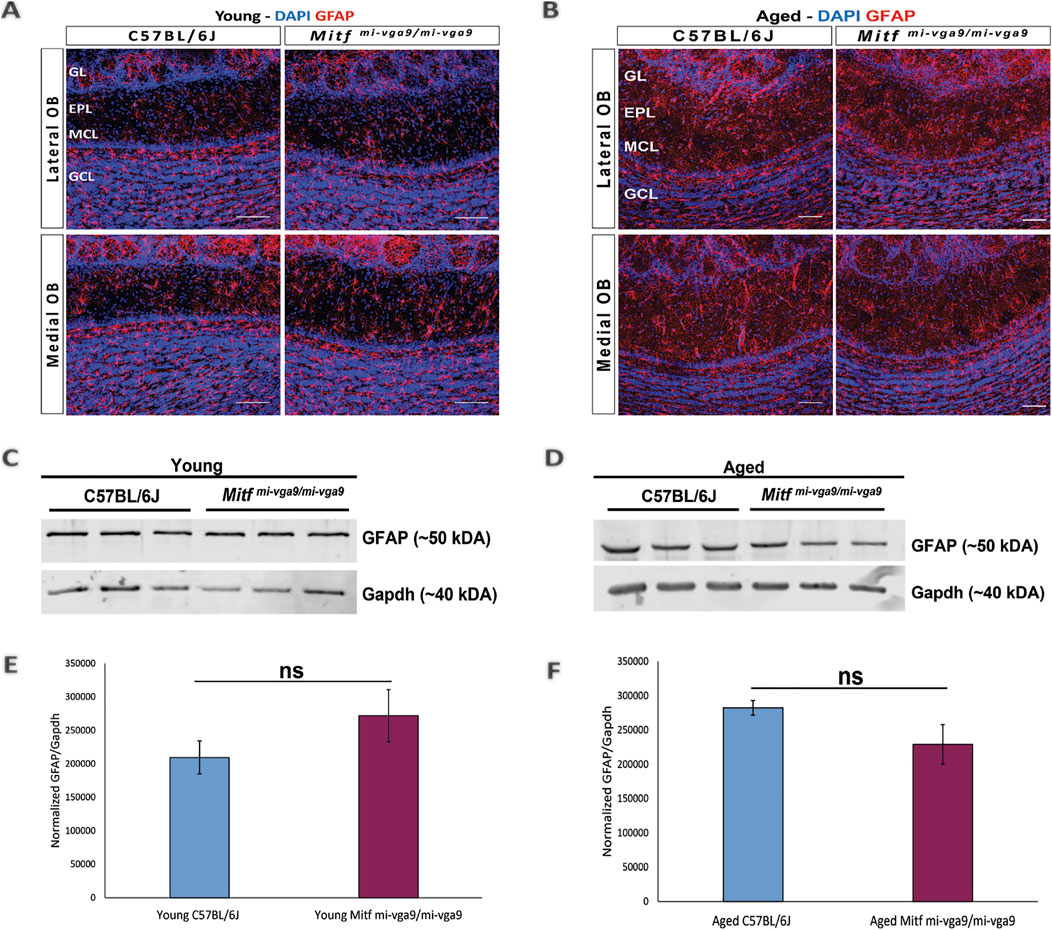
Figure 5. Expression of the astrocyte/astrogliosis marker (GFAP) is similar in young and aged Mitfmi-vga9/mi-vga9 OBs. Representative immunofluorescence images show the expression of GFAP (red) in young (A) and aged (B) C57BL/6J and Mitfmi-vga9/mi-vga9 OBs. N = 10 per genotype, and age group DAPI nuclear staining is shown in blue. Scale bar: 100 μm. Representative images of immunoblots from the lysate of young (C) and aged (D) C57BL/6J and Mitfmi-vga9/mi-vga9 OBs probed for GFAP and Gapdh as a loading control. Densitometric analysis of GFAP bands normalized to Gapdh loading control in young (E) and aged (F) C57BL/6J and Mitfmi-vga9/mi-vga9 mice. All immunoblotting experiments were performed with three mice (n = 3) per genotype and age group. Statistical analysis was performed using two-tailed unpaired Student’s t-test. GL, glomerular layer; EPL, external plexiform layer; MCL, mitral cell layer; GCL, granule cell layer; ns, not significant.
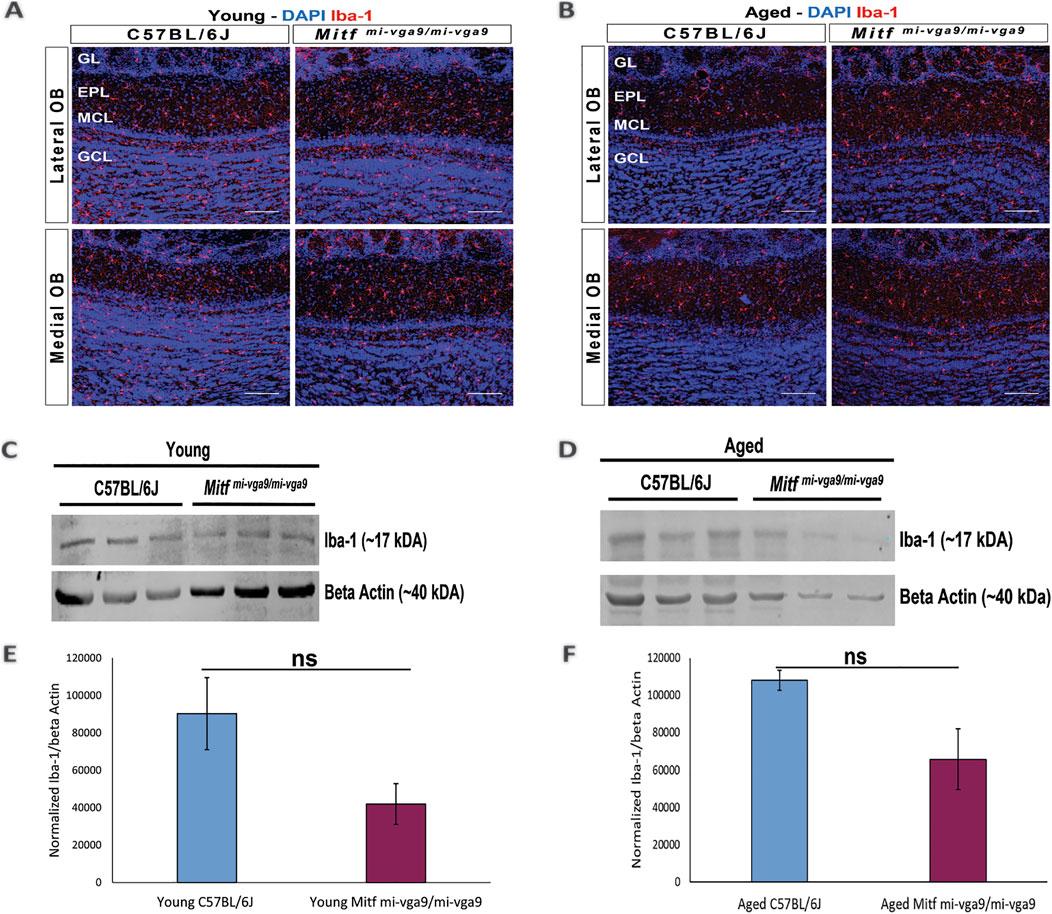
Figure 6. Expression of the microglia activation marker (Iba-1) does not change in young and aged Mitfmi-vga9/mi-vga9 OBs. Representative immunofluorescence images for Iba-1 (red) in young (A) and aged (B) C57BL/6J and Mitfmi-vga9/mi-vga9 OBs. N = 10 per genotype, and age group DAPI nuclear staining is shown in blue. Scale bar: 100 μm. Representative images of immunoblotting from the lysate of young (C) and aged (D) C67BL/6J and Mitfmi-vga9/mi-vga9 OBs probed for Iba-1 and beta-actin as a loading control. Densitometric analysis of Iba-1 bands normalized to beta-actin in young (E) and aged (F) C57BL/6J and Mitfmi-vga9/mi-vga9 OBs. All immunoblotting experiments were performed with three mice (n = 3) per genotype and age group. Statistical analysis was performed using two-tailed unpaired Student’s t-test. GL, glomerular layer; EPL, external plexiform layer; MCL, mitral cell layer; GCL, granule cell layer; ns, not significant.
Quantification of PNs in the aging OB
Neurodegeneration can result in the loss of neurons (Yankner et al., 2008). To investigate this in aged mice, we focused on the cells that normally express Mitf in C57BL/6J mice. OB tissues from young and aged C57BL/6J and Mitfmi-vga9/mi-vga9 mice were stained with antibodies against two members of the Tbr1 subfamily of T-box transcription factors: Tbr2/Eomes and Tbr1. These proteins are expressed in glutamatergic neurons of the OB in a distinct and overlapping manner (Brill et al., 2009; Mizuguchi et al., 2012) (Figures 7, 8). Previous findings showed an increase in Tbr2/Eomes-positive cells in the GL, but not in the EPL or MCL of young Mitfmi-vga9/mi-vga9 OBs (Atacho et al., 2020). However, the number of Tbr2/Eomes-positive cells was not different in GL, EPL, or MCL of aged Mitfmi-vga9/mi-vga9 OBs compared to aged C57BL/6J OBs in the current study (Figure 7B). On the other hand, Tbr1 staining demonstrated that the number of Tbr1-positive cells was significantly increased in the GL in aged Mitfmi-vga9/mi-vga9 OBs, whereas no change was observed in the EPL and MCL (Figure 8D; t (12) =−3.987, p = 0.0267, Sidak’s multiple comparison). Similar trends can be seen in both young and aged mice. Taken together, while there are subtle changes in the composition and a possible increase in the subpopulations of glutamatergic neurons in the Mitf mutant OB, there was no reduction in the number of PNs with aging, arguing strongly against neuronal degeneration.
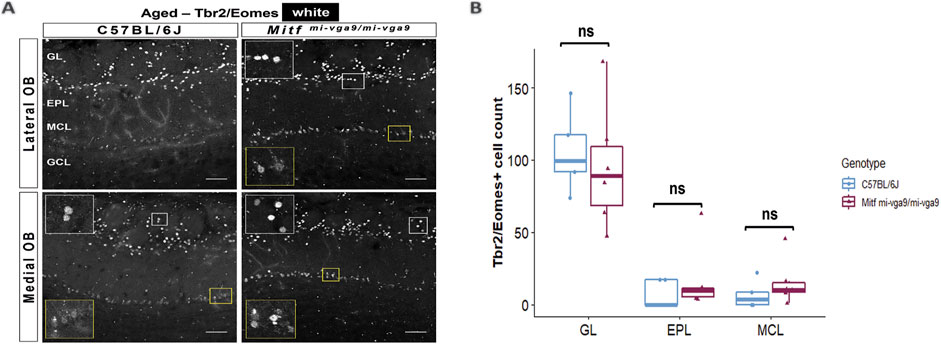
Figure 7. The number of Tbr2/Eomes-positive cells does not change upon aging. (A) Representative immunofluorescence images for Tbr2/Eomes (white) in aged C57BL/6J and Mitfmi-vga9/mi-vga9 OBs. (B) Quantification of Tbr2/Eomes-positive cells in the GL, EPL, and MCL of aged C57BL/6J and Mitfmi-vga9/mi-vga9 OBs. N = 5 for C57BL/6J and n = 6 for Mitfmi-vga9/mi-vga9. Scale bar: 100 μm. Statistical analysis was performed using two-way ANOVA. GL, glomerular layer; EPL, external plexiform layer; MCL, mitral cell layer; GCL, granule cell layer; ns, not significant.
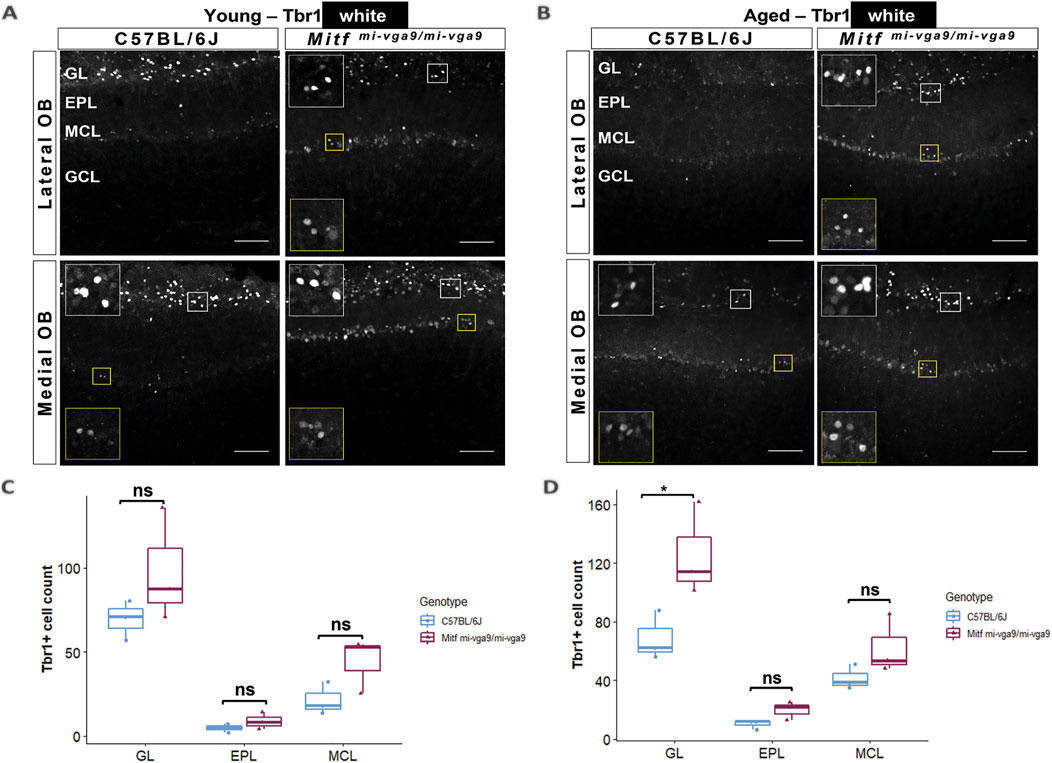
Figure 8. The number of Tbr1-positive cells is increased in the GL of aged Mitfmi-vga9/mi-vga9 OBs. Representative immunofluorescence images for Tbr1 (white) in young (A) and aged (B) C57BL/6J and Mitfmi-vga9/mi-vga9 OBs. Quantification of Tbr1-positive cells in the GL, EPL, and MCL of young (C) and aged (D) C57BL/6J and Mitfmi-vga9/mi-vga9 OBs. N = 3 per genotype and age group. Scale bar: 100 μm. p-values were calculated using two-way ANOVA and adjusted with Sidak’s multiple comparison. *p < 0.05. GL, glomerular layer; EPL, external plexiform layer; MCL, mitral cell layer; GCL, granule cell layer; ns, not significant.
Discussion
Reduction in olfactory ability, neuroinflammation, and neuronal hyperactivity often follow or precede neurodegeneration, e.g., in AD (Doty, 2012; Fullard et al., 2017; Murphy, 2019; Patino et al., 2021; Peters et al., 2003). Aging Mitfmi-vga9/mi-vga9 mice often have reduced olfactory ability, and primary PNs from young Mitfmi-vga9/mi-vga9 OB are hyperactive (Atacho et al., 2020). This could lead to increased neuronal or neural circuit stress in vivo and subsequently to neurodegeneration. The effects of Mitf are pleiotropic, and the loss of Mitf could also lead to degeneration through other mechanisms (Dolan et al., 2023), resulting in the reduction of olfactory ability.
The current study shows that aged Mitfmi-vga9/mi-vga9 OBs have reduced olfactory ability with no clear evidence of neuroinflammation or neurodegeneration. The analysis was both on global signatures of neurodegeneration and on cell-autonomous effects on PNs, the key neurons expressing MITF. No increase in inflammation was detected upon aging of Mitfmi-vga9/mi-vga9 mice, neither at the gene level nor in the expression of inflammatory proteins. Similarly, no reduction was observed in the number of OB PNs in Mitfmi-vga9/mi-vga9 mice with aging. The increase in Tbr1-positive neurons in the Mitfmi-vga9/mi-vga9 OB could reflect a reduction in the numbers of neurons found in a subgroup of tufted neurons, resulting in changes in the composition of glutamatergic neurons in the GL. Comparing gene expressions between aged C57BL/6J and aged Mitfmi-vga9/mi-vga9 mice showed a high number of DE genes, with diverse functions and connected to diverse pathways. However, as the loss of Mitf leads to changes in the expression of two genes coding for potassium channel subunits in M/T cells, it was particularly interesting that there was a global increase in the expression of genes coding for potassium channel subunits during aging. Overall, such a change should lead to reduced neuronal activity. This suggests that with aging, neuronal hyperactivity leads to a reduction in neuronal activity. As complex mechanisms regulate the conduction of information in the OB, these changes are likely to be multifaceted (Burton, 2017), involving complicated interactions between various inhibitory neurons and neurotransmitter systems, contributing to the delicate balance of excitation and inhibition necessary for proper sensory processing (Abraham et al., 2010; Egger et al., 2003; Geramita and Urban, 2017). The disruption of this equilibrium could underlie the observed decrease in olfactory function (Gire et al., 2019) in aged Mitfmi-vga9/mi-vga9 mice. Other possibilities could be a decrease in the function of the OE or OSNs. The Mitf mutation may also elicit effects potentially impacting processes such as proteostasis. MITF has been associated with autophagy in other cell types, including in melanoma cells (Möller et al., 2019). However, no specific changes were observed in the expression of genes that may explain such effects.
A caveat to this study is secondary effects due to the pleiotropy of Mitf. That the olfactory phenotype is also present in the heterozygous Mitf mi-vga9 animals, phenotypically similar to C57BL/6J mice, supports this to be a primary effect. It can be concluded from the current study that the absence of Mitf does not lead to neurodegeneration with aging. However, Mitf could play a role in neurodegeneration induced by neuropathology, as in AD (Dolan et al., 2023). A direct challenge in a conditional model may unravel this.
Data availability statement
Gene expression data analyzed in this study is available in the GEO data repository under the accession number GSE277734. The raw data supporting the conclusions of this article will be made available by the authors, without undue reservation.
Ethics statement
The animal study was approved by the Icelandic Committee on Experimental Animals. The study was conducted in accordance with the local legislation and institutional requirements.
Author contributions
FM: data curation, writing–original draft, formal analysis, writing–review and editing, and project administration. ES: supervision, writing–review and editing, and methodology. PHP: conceptualization, funding acquisition, project administration, supervision, writing–review and editing, methodology, and resources.
Funding
The author(s) declare that financial support was received for the research, authorship, and/or publication of this article. This study was supported in part by the Research Fund of Iceland to PHP (217945-052) and a grant from the University of Iceland Doctoral Grants Fund to FM.
Acknowledgments
We acknowledge the Biomedical Center at the University of Iceland (BMC) and Utopia Arctica (Ingvi Gautsson) for their contribution to data analysis. We thank our colleagues from the BMC, Ragnhildur Káradóttir, Margrét Helga Ögmundsdóttir, Sigríður Rut Franzdóttir, Snævar Sigurðsson, and Sana Gadiwalla, for their insights and assistance during the project.
Conflict of interest
The authors declare that the research was conducted in the absence of any commercial or financial relationships that could be construed as a potential conflict of interest.
Publisher’s note
All claims expressed in this article are solely those of the authors and do not necessarily represent those of their affiliated organizations, or those of the publisher, the editors, and the reviewers. Any product that may be evaluated in this article, or claim that may be made by its manufacturer, is not guaranteed or endorsed by the publisher.
Supplementary material
The Supplementary Material for this article can be found online at: https://www.frontiersin.org/articles/10.3389/fragi.2024.1462900/full#supplementary-material
References
Abraham, N. M., Egger, V., Shimshek, D. R., Renden, R., Fukunaga, I., Sprengel, R., et al. (2010). Synaptic inhibition in the olfactory bulb accelerates odor discrimination in mice. Neuron 65 (3), 399–411. doi:10.1016/j.neuron.2010.01.009
Atacho, D. A. M., Reynisson, H., Petursdottir, A. T., Eysteinsson, T., Steingrimsson, E., and Petersen, P. H. (2020). Mitf links neuronal activity and long-term homeostatic intrinsic plasticity. eNeuro 7 (2), ENEURO.0412–19.2020. doi:10.1523/eneuro.0412-19.2020
Bray, N. L., Pimentel, H., Melsted, P., and Pachter, L. (2016). Near-optimal probabilistic RNA-seq quantification. Nat. Biotechnol. 34 (5), 525–527. doi:10.1038/nbt.3519
Brill, M. S., Ninkovic, J., Winpenny, E., Hodge, R. D., Ozen, I., Yang, R., et al. (2009). Adult generation of glutamatergic olfactory bulb interneurons. Nat. Neurosci. 12 (12), 1524–1533. doi:10.1038/nn.2416
Burton, S. D. (2017). Inhibitory circuits of the mammalian main olfactory bulb. J. Neurophysiol. 118 (4), 2034–2051. doi:10.1152/jn.00109.2017
Chase, B. A., and Markopoulou, K. (2020). Olfactory dysfunction in familial and sporadic Parkinson's disease. Front. Neurol. 11, 447. doi:10.3389/fneur.2020.00447
Dolan, M. J., Therrien, M., Jereb, S., Kamath, T., Gazestani, V., Atkeson, T., et al. (2023). Exposure of iPSC-derived human microglia to brain substrates enables the generation and manipulation of diverse transcriptional states in vitro. Nat. Immunol. 24 (8), 1382–1390. doi:10.1038/s41590-023-01558-2
Doty, R. L. (2012). Olfactory dysfunction in Parkinson disease. Nat. Rev. Neurol. 8 (6), 329–339. doi:10.1038/nrneurol.2012.80
Doty, R. L., and Kamath, V. (2014). The influences of age on olfaction: a review. Front. Psychol. 5, 20. doi:10.3389/fpsyg.2014.00020
Egger, V., Svoboda, K., and Mainen, Z. F. (2003). Mechanisms of lateral inhibition in the olfactory bulb: efficiency and modulation of spike-evoked calcium influx into granule cells. J. Neurosci. 23 (20), 7551–7558. doi:10.1523/jneurosci.23-20-07551.2003
Fullard, M. E., Morley, J. F., and Duda, J. E. (2017). Olfactory dysfunction as an early biomarker in Parkinson's disease. Neurosci. Bull. 33 (5), 515–525. doi:10.1007/s12264-017-0170-x
Geramita, M., and Urban, N. N. (2017). Differences in glomerular-layer-mediated feedforward inhibition onto mitral and tufted cells lead to distinct modes of intensity coding. J. Neurosci. 37 (6), 1428–1438. doi:10.1523/jneurosci.2245-16.2016
Gire, D. H., Zak, J. D., Bourne, J. N., Goodson, N. B., and Schoppa, N. E. (2019). Balancing extrasynaptic excitation and synaptic inhibition within olfactory bulb glomeruli. eNeuro 6 (4), ENEURO.0247–19.2019. doi:10.1523/eneuro.0247-19.2019
Goding, C. R., and Arnheiter, H. (2019). MITF-the first 25 years. Genes Dev. 33 (15-16), 983–1007. doi:10.1101/gad.324657.119
Hector, A., and Brouillette, J. (2020). Hyperactivity induced by soluble amyloid-β oligomers in the early stages of alzheimer's disease. Front. Mol. Neurosci. 13, 600084. doi:10.3389/fnmol.2020.600084
Hodgkinson, C. A., Moore, K. J., Nakayama, A., Steingrímsson, E., Copeland, N. G., Jenkins, N. A., et al. (1993). Mutations at the mouse microphthalmia locus are associated with defects in a gene encoding a novel basic-helix-loop-helix-zipper protein. Cell 74 (2), 395–404. doi:10.1016/0092-8674(93)90429-t
Ingason, A. B., Mechmet, F., Atacho, D. A. M., Steingrímsson, E., and Petersen, P. H. (2019). Distribution of mast cells within the mouse heart and its dependency on Mitf. Mol. Immunol. 105, 9–15. doi:10.1016/j.molimm.2018.11.009
Lodovichi, C., and Belluscio, L. (2012). Odorant receptors in the formation of the olfactory bulb circuitry. Physiol. (Bethesda) 27 (4), 200–212. doi:10.1152/physiol.00015.2012
Lu, S. Y., Li, M., and Lin, Y. L. (2010). Mitf induction by RANKL is critical for osteoclastogenesis. Mol. Biol. Cell 21 (10), 1763–1771. doi:10.1091/mbc.e09-07-0584
Lucas, S. M., Rothwell, N. J., and Gibson, R. M. (2006). The role of inflammation in CNS injury and disease. Br. J. Pharmacol. 147 (Suppl. 1), S232–S240. doi:10.1038/sj.bjp.0706400
Marin, C., Vilas, D., Langdon, C., Alobid, I., López-Chacón, M., Haehner, A., et al. (2018). Olfactory dysfunction in neurodegenerative diseases. Curr. Allergy Asthma Rep. 18 (8), 42. doi:10.1007/s11882-018-0796-4
Mizuguchi, R., Naritsuka, H., Mori, K., Mao, C. A., Klein, W. H., and Yoshihara, Y. (2012). Tbr2 deficiency in mitral and tufted cells disrupts excitatory-inhibitory balance of neural circuitry in the mouse olfactory bulb. J. Neurosci. 32 (26), 8831–8844. doi:10.1523/jneurosci.5746-11.2012
Möller, K., Sigurbjornsdottir, S., Arnthorsson, A. O., Pogenberg, V., Dilshat, R., Fock, V., et al. (2019). MITF has a central role in regulating starvation-induced autophagy in melanoma. Sci. Rep. 9 (1), 1055. doi:10.1038/s41598-018-37522-6
Mori, K., Manabe, H., Narikiyo, K., and Onisawa, N. (2013). Olfactory consciousness and gamma oscillation couplings across the olfactory bulb, olfactory cortex, and orbitofrontal cortex. Front. Psychol. 4, 743. doi:10.3389/fpsyg.2013.00743
Murphy, C. (2019). Olfactory and other sensory impairments in Alzheimer disease. Nat. Rev. Neurol. 15 (1), 11–24. doi:10.1038/s41582-018-0097-5
Nagayama, S., Homma, R., and Imamura, F. (2014). Neuronal organization of olfactory bulb circuits. Front. Neural Circuits 8, 98. doi:10.3389/fncir.2014.00098
Ohba, K., Takeda, K., Yamamoto, H., and Shibahara, S. (2015). Microphthalmia-associated transcription factor is expressed in projection neurons of the mouse olfactory bulb. Genes cells. 20 (12), 1088–1102. doi:10.1111/gtc.12312
Oppezzo, A., and Rosselli, F. (2021). The underestimated role of the microphthalmia-associated transcription factor (MiTF) in normal and pathological haematopoiesis. Cell Biosci. 11 (1), 18. doi:10.1186/s13578-021-00529-0
Patel, R. C., and Larson, J. (2009). Impaired olfactory discrimination learning and decreased olfactory sensitivity in aged C57Bl/6 mice. Neurobiol. Aging 30 (5), 829–837. doi:10.1016/j.neurobiolaging.2007.08.007
Patino, J., Karagas, N. E., Chandra, S., Thakur, N., and Stimming, E. F. (2021). Olfactory dysfunction in huntington's disease. J. Huntingt. Dis. 10 (4), 413–422. doi:10.3233/jhd-210497
Peters, J. M., Hummel, T., Kratzsch, T., Lötsch, J., Skarke, C., and Frölich, L. (2003). Olfactory function in mild cognitive impairment and Alzheimer's disease: an investigation using psychophysical and electrophysiological techniques. Am. J. Psychiatry 160 (11), 1995–2002. doi:10.1176/appi.ajp.160.11.1995
Pimentel, H., Bray, N. L., Puente, S., Melsted, P., and Pachter, L. (2017). Differential analysis of RNA-seq incorporating quantification uncertainty. Nat. Methods 14 (7), 687–690. doi:10.1038/nmeth.4324
Rawson, N. E., Gomez, G., Cowart, B. J., Kriete, A., Pribitkin, E., and Restrepo, D. (2012). Age-associated loss of selectivity in human olfactory sensory neurons. Neurobiol. Aging 33 (9), 1913–1919. doi:10.1016/j.neurobiolaging.2011.09.036
Rodríguez, J. J., Yeh, C. Y., Terzieva, S., Olabarria, M., Kulijewicz-Nawrot, M., and Verkhratsky, A. (2014). Complex and region-specific changes in astroglial markers in the aging brain. Neurobiol. Aging 35 (1), 15–23. doi:10.1016/j.neurobiolaging.2013.07.002
Sabaté San José, A., and Petersen, P. H. (2024). Absence of meningeal mast cells in the Mitf mutant mouse. Front. Cell Neurosci. 18, 1337621. doi:10.3389/fncel.2024.1337621
Sabiniewicz, A., Hoffmann, L., Haehner, A., and Hummel, T. (2022). Symptoms of depression change with olfactory function. Sci. Rep. 12 (1), 5656. doi:10.1038/s41598-022-09650-7
Schäfer, L., Schriever, V. A., and Croy, I. (2021). Human olfactory dysfunction: causes and consequences. Cell Tissue Res. 383 (1), 569–579. doi:10.1007/s00441-020-03381-9
Schubert, C. R., Fischer, M. E., Pinto, A. A., Klein, B. E. K., Klein, R., and Cruickshanks, K. J. (2017). Odor detection thresholds in a population of older adults. Laryngoscope 127 (6), 1257–1262. doi:10.1002/lary.26457
Steingrímsson, E., Copeland, N. G., and Jenkins, N. A. (2004). Melanocytes and the microphthalmia transcription factor network. Annu. Rev. Genet. 38, 365–411. doi:10.1146/annurev.genet.38.072902.092717
Steingrimsson, E., Tessarollo, L., Pathak, B., Hou, L., Arnheiter, H., Copeland, N. G., et al. (2002). Mitf and Tfe3, two members of the Mitf-Tfe family of bHLH-Zip transcription factors, have important but functionally redundant roles in osteoclast development. Proc. Natl. Acad. Sci. U. S. A. 99 (7), 4477–4482. doi:10.1073/pnas.072071099
Streit, W. J., Braak, H., Xue, Q. S., and Bechmann, I. (2009). Dystrophic (senescent) rather than activated microglial cells are associated with tau pathology and likely precede neurodegeneration in Alzheimer's disease. Acta Neuropathol. 118 (4), 475–485. doi:10.1007/s00401-009-0556-6
Tachibana, M., Hara, Y., Vyas, D., Hodgkinson, C., Fex, J., Grundfast, K., et al. (1992). Cochlear disorder associated with melanocyte anomaly in mice with a transgenic insertional mutation. Mol. Cell Neurosci. 3 (5), 433–445. doi:10.1016/1044-7431(92)90055-7
Targa Dias Anastacio, H., Matosin, N., and Ooi, L. (2022). Neuronal hyperexcitability in Alzheimer's disease: what are the drivers behind this aberrant phenotype? Transl. Psychiatry 12 (1), 257. doi:10.1038/s41398-022-02024-7
Turrigiano, G. (2012). Homeostatic synaptic plasticity: local and global mechanisms for stabilizing neuronal function. Cold Spring Harb. Perspect. Biol. 4 (1), a005736. doi:10.1101/cshperspect.a005736
Tzeng, W. Y., Figarella, K., and Garaschuk, O. (2021). Olfactory impairment in men and mice related to aging and amyloid-induced pathology. Pflugers Arch. 473 (5), 805–821. doi:10.1007/s00424-021-02527-0
Ugarte, G., Piña, R., Contreras, D., Godoy, F., Rubio, D., Rozas, C., et al. (2023). Attention deficit-hyperactivity disorder (ADHD): from abnormal behavior to impairment in synaptic plasticity. Biol. (Basel) 12 (9), 1241. doi:10.3390/biology12091241
Vints, K., Vandael, D., Baatsen, P., Pavie, B., Vernaillen, F., Corthout, N., et al. (2019). Modernization of Golgi staining techniques for high-resolution, 3-dimensional imaging of individual neurons. Sci. Rep. 9 (1), 130. doi:10.1038/s41598-018-37377-x
Yankner, B. A., Lu, T., and Loerch, P. (2008). The aging brain. Annu. Rev. Pathol. 3, 41–66. doi:10.1146/annurev.pathmechdis.2.010506.092044
Yates, A., Akanni, W., Amode, M. R., Barrell, D., Billis, K., Carvalho-Silva, D., et al. (2016). Ensembl 2016. Nucleic Acids Res. 44 (D1), D710–D716. doi:10.1093/nar/gkv1157
Yu, G., Wang, L. G., Han, Y., and He, Q. Y. (2012). clusterProfiler: an R package for comparing biological themes among gene clusters. Omics 16 (5), 284–287. doi:10.1089/omi.2011.0118
Keywords: age-related decline, olfactory bulb, olfactory function, Mitf mutation, neuronal hyperactivity, potassium channels
Citation: Mechmet F, Steingrímsson E and Petersen PH (2024) Reduction in the olfactory ability in aging Mitf mutant mice without evidence of neurodegeneration. Front. Aging 5:1462900. doi: 10.3389/fragi.2024.1462900
Received: 10 July 2024; Accepted: 30 September 2024;
Published: 25 October 2024.
Edited by:
Nathan Woodling, University of Glasgow, United KingdomReviewed by:
Melissa L. Harris, University of Alabama at Birmingham, United StatesBiju Chandu, The University of Texas Health Science Center at San Antonio, United States
Copyright © 2024 Mechmet, Steingrímsson and Petersen. This is an open-access article distributed under the terms of the Creative Commons Attribution License (CC BY). The use, distribution or reproduction in other forums is permitted, provided the original author(s) and the copyright owner(s) are credited and that the original publication in this journal is cited, in accordance with accepted academic practice. No use, distribution or reproduction is permitted which does not comply with these terms.
*Correspondence: Petur Henry Petersen, cGhlbnJ5QGhpLmlz; Fatich Mechmet, ZmF0aWNoLm1lY2htZXRAZ21haWwuY29t
†ORCID: Petur Henry Petersen, orcid.org/0000-0001-6622-3002; Fatich Mechmet, orcid.org/0000-0003-0596-0185; Eiríkur Steingrímsson, orcid.org/0000-0001-5826-7486
 Fatich Mechmet1*†
 Eiríkur Steingrímsson
 Petur Henry Petersen