 Samuel Odumu Ogana John
 Stephen Friday Olukotun
 Moses Mpofana Radebe
 Manny Mathuthu1
- 1Center for Applied Radiation Science and Technology (CARST), North-West University (Mahikeng Campus), Cnr Albert Luthuli Road and University Drive, Mmabatho, South Africa
- 2Department of Physics and Engineering Physics, Obafemi Awolowo University, Ile-Ife, Nigeria
Human exposure to natural radionuclides in the environment primarily occurs through ingestion of foodstuffs, highlighting the importance of continuous monitoring of radionuclide levels in foodstuffs by ensuring consumer safety and compliance with regulatory standards. Using gamma spectrometry, this study investigates activity concentration levels of 226Ra, 228Ra, and 40K, and associated radiological health risks, in 14 commonly available sugar brands in South Africa. The activity concentration levels of these natural radionuclides ranged from 2.01 ± 0.13 to 7.93 ± 0.34 Bq/kg for 226Ra, 2.90 ± 0.10 to 7.09 ± 0.32 Bq/kg for 228Ra, and 209.40 ± 4.79 to 453.20 ± 10.49 Bq/kg for 40K. The respective mean values were 3.83 ± 0.21, 2.90 ± 0.21, and 320.26 ± 7.41 Bq/kg, with brown sugar having lower values than with white sugar. Annual effective ingestion dose from intake of 226Ra, 228Ra, and 40K, for infants (1–2 years), children (7–12 years), and adults (>17 years) ranged from 0.28 to 0.69, 0.32 to 0.82, and 0.12 to 0.30 mSv/year, respectively, and the respective mean values are 0.40 ± 0.11, 0.45 ± 0.14, and 0.17 ± 0.05 mSv/year. 228Ra contributed the largest proportion to ingestion dose (46–67%), indicating potential radiation risk to bones. Lifetime cancer risk ranged from 1.25 × 10⁻⁸ to 4.95 × 10⁻⁸ for 226Ra, 1.95 × 10⁻⁸ to 4.77 × 10⁻⁸ for 228Ra, and 5.53 × 10⁻⁷ to 1.19 × 10⁻⁶ for 40K, with a total mean of 8.96 × 10⁻⁷ ± 2.31 × 10⁻⁷. Total chronic daily intake due to 226Ra, 228Ra, and 40K ranged from 0.26 to 0.56 with a mean of 0.39 ± 0.10 (mg/kg-day). The activity concentration levels of the natural radionuclides are within the reference value while annual effective ingestion dose and lifetime cancer risks were below international permissible limits. This indicates that sugar in South Africa is radiologically safe and does not pose significant radiological health risks. In this study, the measured activity levels are comparable to those reported in other similar studies. This baseline study highlights the importance of continuous monitoring of radionuclide levels in foodstuffs, ensuring consumer safety, compliance with regulatory standards, and contributing to ongoing discussions on radiological health risks associated with dietary habits. Public health initiatives could consider offering guidelines for safe levels of consumables such as sugar, especially among vulnerable populations such as children.
Introduction
Our natural environment that chiefly consists of the earth and the atmosphere is endowed with abundant natural and mineral resources, and is a source of radioactivity to which humans are constantly exposed. Naturally occurring radioactive materials (NORMs) are these sources of ionizing radiation, primarily consisting of the radionuclides from the 238U and 232Th decay series and 40K (1–3). These radionuclides enter the human body mainly through the ingestion of food and beverages, and by means of the inhalation of gas in the air. Therefore, it is necessary to maintain control over the levels of radioactivity in the environment, especially in foodstuffs. According to the United Nations Scientific Committee on the Effect of Atomic Radiation (UNSCEAR) report, the concentration of natural radioactivity in food typically ranges from 40 to 600 Bq/kg, which can pose a radiological health risk to vital body organs if not checked (1, 4–6). The long-term use of fertilizers and their by-products to boost crop production contributes to an increase in levels of 40K and 226Ra concentrations in the soil where sugar cane as raw material for sugar production is cultivated (7, 8). The presence of natural radionuclides in foodstuffs and sugars can increase the effective internal radiation dose, and the presence of ionizing radiation may cause various cancer risks. For instance, 232U and its progenies, such as 226Ra, 222Rn, 210Pb, and 210Po, are carcinogenic and can accumulate in human vital organs, such as the kidney, bone, and lung, while 232Th and the progenies, such as 228Ra, can accumulate in liver and skeleton, potentially increasing mortality rates (9–11). 40K with a natural abundance of 1.17 × 10⁻⁴, and specific activity of 2.6 × 10⁸ Bq/kg, is an essential mineral, which is uniformly distributed in the human body due to its uptake from the diet—about 0.18% in adults and 0.2% in children; therefore, it is under homeostatic control (12). For this reason, many international organizations, such as the Food and Agriculture Organization (FAO), World Health Organization (WHO), UNSCEAR, International Commission on Radiological Protection (ICRP), and International Atomic Energy Agency (IAEA), collaborate to establish global guidelines on acceptable levels of radioactivity in foods (1, 10, 13, 14).
The radionuclide sources in the human diet are primarily found in milk products, meat products, grain products, leafy vegetables, roots and fruits, fish products, drinking water, and especially those frequently consumed food products—vary in concentration from one region to the other. The radioactivity of these radionuclide sources in the human diet depend on the amount of intake (1, 12). Sugar is consumed directly, especially in beverages, as s sweetener, and is an important ingredient used in baking, food preservation, fermentation, balancing flavors, caramelizing, and so on. In the form of simple sugar, it primarily provides carbohydrates such as sucrose and is high in calories, supplying energy. Therefore, the importance of sugar in the human diet is enormous, and its safe consumption is critical. South Africa is a world-ranking producer of sugar, and its domestic consumption was expected to increase by 2% from 1.73 to 1.77 million metric tons in the 2022–2023 market year due to population growth (15). The region where sugarcane, the major raw material for sugar production, is grown—KwaZulu-Natal and Mpumalanga provinces—are characterized by geological variations with differing levels of natural radionuclides in the soil due to the presence of abundant mineral deposits. This is likely to affect the final product of sugar consumed, which needs to be determined using reliable methods (16, 17).
High-purity germanium (HPGe) detectors are employed in gamma-ray spectrometry, as a non-destructive analytical technique. This technique is one of those recommended by the IAEA and other global regulatory bodies. It has been widely used to measure the concentrations of natural radionuclides, such as 226Ra, 228Ra, and their progeny, as well as 40K and artificial radionuclides such as 137Cs in environmental samples, including foodstuffs (18). The method requires a simplified sample preparation without chemical separation and is applicable in identifying and quantifying radioactivity levels in a material with good precision. A standard source with the same geometry and matrix—as a sample being analysed—is used to characterize the detector, ensuring high sensitivity, reliability, and accuracy of measurement (18–20). In this study, this method is utilized in the analysis of natural radionuclides in this study.
In recent years, some research studies have reported on the activity levels of radionuclides in various foodstuffs (5, 7, 9, 17, 21–24), employing methods that may differ from those applied in this study. The activity concentration levels of the natural radionuclides measured were further used to estimate the radiological health risks associated with the ingestion of the studied foodstuffs, including the effective dose for various age categories, lifetime cancer risks, and organ-specific doses (14, 25). The results presented in various studies showed varying activity concentration levels and corresponding health risk parameters. This variability was attributed to several factors, including the rate of food and water consumption, the radionuclide transfer factor, as well as the concentration of the radionuclide (12, 24). Additionally, background levels, climate conditions, agricultural practices, and anthropogenic factors also played a role in influencing these levels (12, 14). However, little work has been done on the activity concentration levels in sugar, especially in South Africa, making this study a baseline research study.
The present study was conducted to evaluate the activity concentration levels of the NORM radionuclides (226Ra, 228Ra, and 40K), in two types of sugar consumed in South Africa, and to estimate the associated radiological health risks, such as annual effective ingestion dose (AEID), excess lifetime cancer risk (ELCR), and other related parameters. The study aims to evaluate compliance of radionuclide levels in sugar with international safety standards, such as those of IAEA, UNSCEAR, or WHO, while providing recommendations on safe sugar consumption levels based on the measured radiological risks. This will contribute to establishing a radiometric baseline standard database of natural radioactivity levels in South African foodstuffs, which can serve as a reference for possible future changes in activity concentrations in sugar. The South African food regulatory agency, as well as the sugar industry, will find this study helpful, as the results highlight the importance of monitoring radionuclide levels in food products to ensure consumer safety, compliance with standard regulations, and contribute to the ongoing discussion on radiological health risks associated with dietary habits and consumption.
Materials and methods
Sample and sample preparation
A notable 14 sugar samples, consisting of 4 brown sugars and 10 white sugars from different brands, were purchased from an open grocery store in Mahikeng—a North-West province of South Africa. These samples were selected to represent the most consumed sugars and are among the top 10 sugars in the country, based on a preliminary survey conducted prior to the sample collection (26, 27). The samples were brought to the laboratory, weighed, and placed into 500-ml polyethylene jars with screw lids, which were then sealed using adhesive tape. The jars were stored for 30 days to allow secular equilibrium to be reached between the parent 226Ra and its daughter radionuclides. The density of the samples ranged from 0.700 to 1.109 g/mL, and approximately 400 g of each sugar was prepared, with corrections made for differences in density and geometry. Each sample was assigned a unique identity based on its color type: SB for brown sugar and SW for white sugar.
Experimental setup and sample analysis
The prepared sugar samples were each placed into a low-background, 11.50-cm thick, cylindrical lead-shielded casing of the detector to minimize background radiation. They were counted for 43,200 s. A Canberra p-type well High-Purity Germanium (HPGe) gamma spectrometer, model GCW2021 (Canberra Industries Inc., Detector Products, Meriden, USA), connected to a multichannel analyser (MCA) model DSA 1000 (Canberra Industries Inc., Detector Products, Meriden, USA), and using Genie 2000 (Canberra Industries Inc., Detector Products, Meriden, USA) vs. 3.3 Gamma Acquisition and Analysis software (Canberra Industries Inc., Detector Products, Meriden, USA), was employed in the sample measurement and spectrum analysis, respectively. Inside the detector shielding, the background radiation was measured using an empty jar of the same geometry as that of the sample. Prior to calculating the specific activity concentration, the background value was subtracted from the gamma radiation for each sample.
The detector’s energy resolution was 1.7 keV full width at half maximum (FWHM) at 1.33 MeV of the 60Co gamma line, with a relative efficiency of 20%. The detector’s efficiency–energy calibration was performed using a multinuclide standard source, which is capable of emitting a wider range of gamma rays from 46.54 to 1836 keV. The multinuclide include 210Pb, 241Am, 226Ra, 137Cs, 54Mn, 60,57Co, and 88Y (18)—all homogeneously distributed in a container of similar geometry to that used for counting the samples. The curve for the efficiency–energy calibration is shown in Figure 1, with the fitting function given by the polynomial in Equation 1, at R2 = 0.993. Expanded HPGe gamma spectrometer calibration details are also provided in a previous study (28).
where ε(%) is the efficiency–energy calibration and E (MeV) is the corresponding photo peak energy.
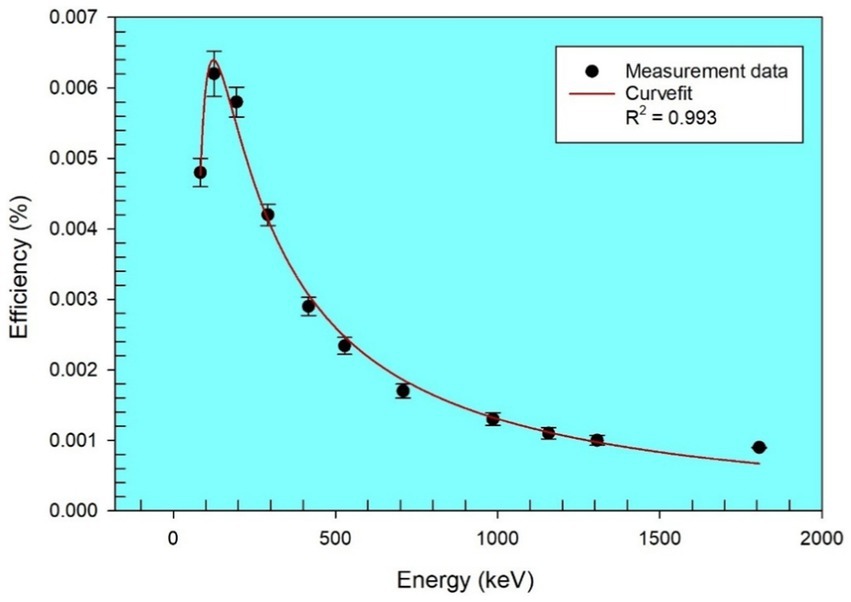
Figure 1. Efficiency– energy calibration curve for HPGe gamma detector.
The equipment was validated using IAEA-standardized reference materials, such as 152Eu, 133Ba, and IAEA-RGU-1, to ascertain the detector’s accuracy. The activity levels of the sources were measured using the detector and then compared to the certified values, adjusting for decay over time using the online Rad Pro decay calculator (Ludlum Measurements, Inc., Sweetwater, USA). The measured result for 152Eu (26.027 kBq) was in close agreement with the calculated activity (25.447 kBq), resulting in a percentage error of 2.281%, with a reference date of 1 December 2013. Compared with other published methods, HPGe gamma spectrometry, as used in this study, provides superior sensitivity, allowing for the detection of radionuclides at lower activity concentrations.
In this study, the limit of detection (LOD) and limit of quantification (LOQ) for the 152Eu were reported to be 0.16 and 0.48 Bq/kg, respectively, which compare favorably with LODs reported in similar studies ranging from 0.059 to 0.287 Bq/kg (20, 29). The method also demonstrated high accuracy, with relative standard deviation (RSD) of 0.0157, aligning with the precision of other gamma spectrometric studies. Analysis time was optimized to 43,200 s, which is competitive compared to other methods requiring longer sample preparation and counting times. To maintain the integrity of results and ensure compliance with regulatory requirements, the quality assurance standard method applied in this study is based on the guidelines provided in previous studies (18, 30).
Furthermore, in this study, the activity concentrations of both the radionuclides and their daughter radionuclides were determined through various gamma lines and those of. The gamma line peak energies used for 226Ra progenies included 214Pb (295.21 keV, Pγ = 19.2% and 351.95 keV, Pγ = 37.20%) and 214Bi (609.31 keV, Pγ = 46.30% and 1120.29 keV, Pγ = 15.10%). For 228Ra the gamma lines of its progenies, 212Pb (238.63 keV, Pγ = 44.60%), 212Bi (727.17 keV, Pγ = 11.80%), and 228Ac (911.60 keV, Pγ = 27.70% and 969.11 keV, Pγ = 16.60%) were used, while for 40K, its single gamma line at 1460.81 keV, Pγ = 10.67% was utilized (4, 13, 19). The weighted mean of the values of the progenies for the respective radionuclides were calculated, along with their uncertainties. The samples were measured at the Centre for Applied Radiation Science and Technology (CARST), North-West University (Mahikeng Campus), South Africa.
Activity calculation
The specific activity concentration As (Bq/kg) for each of the natural radionuclides in the sugar samples was computed using Equation 2 while the minimum detectable activity concentration (MDA) (Bq/kg) was calculated using Equation 3 (4, 13, 19, 31), both were achieved through the Genie 2000 vs. 3.3 Gamma Acquisition and Analysis software.
where ns is the sample’s counts of a particular photopeak, nb is the background count of a photopeak in the spectrum, P γ is the emission probability of gamma rays at the given energy photopeak, εγ is the detection efficiency, t is the time taken in seconds for the sample measurement, and m is the mass of sample in kilogram.
where B is the background count for the gamma line under consideration, while other parameters remain the same as described in Equation 2. The minimum detectable activity for the radionuclides of interest computed at 5.00% MDA confidence factor is 1.34 Bq/kg for 226Ra, 1.83 Bq/kg for 228Ra, and 4.39 Bq/kg for 40K, respectively.
Estimation of radiological health risks
The annual effective ingestion dose (AEID) is the radiation dose absorbed or received in a year by various body organs due to the ingestion of natural radionuclides present in food. Radiological risks from radiation exposure are described using this parameter, balancing the effects of carcinogens, life-shortening, and hereditary impacts; it is estimated using Equation 4 (29, 32)
where is the specific activity concentration of the radionuclide of interest i (Bq/kg), is the mean annual consumption (kg/year) which is 30.7 kg/year (26) and is the ingestion dose coefficient of radionuclide (Sv/Bq). in Sv/Bq for 226Ra is 2.8 × 10⁻⁷, for 228Ra is 6.9 × 10⁻⁷, and for 40K is 6.2 × 10⁻⁹ (29, 33).
The annual effective ingestion dose ED by age group of infants (age 1–2 years), children (age 7–12 years), and adults (age > 17 years) (33) due to ingestion of radionuclides present sugar, is estimated using Equation 5 (21). The idea of estimating age-dependent dose per unit intake is to extend the limited data on tissue concentrations while acquiring more broadly based dose estimates (1).
where ED is the annual effective ingestion dose, is the specific activity concentration of radionuclides, I is the annual sugar intake or consumption rate (10.23 kg/year for infants; 20.47 kg/year for children), and Fdc is the dose conversion factor by age group; the values are presented in Table 1 (1, 33).
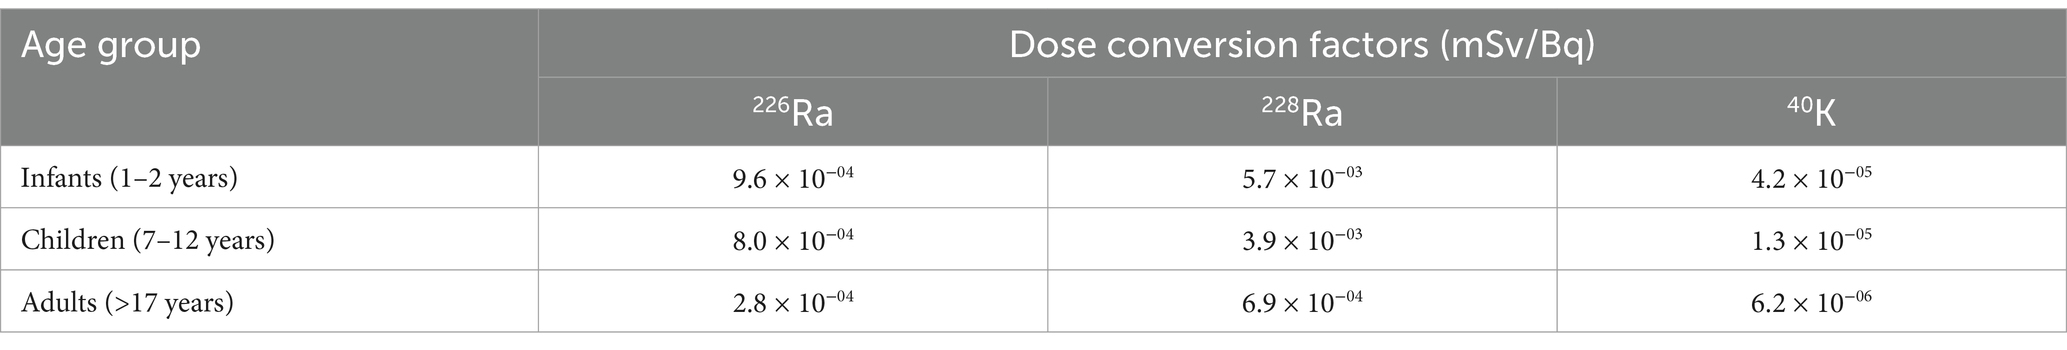
Table 1. Dose conversion factors for 226Ra, 228Ra, and 40K used in determining annual effective dose for different age groups (1, 33).
Based on the ingestion exposure pathway, the excess lifetime cancer risk (ELCR) estimates the probability that an individual or population will develop cancer over a lifetime due to exposure to ionising radiation or potential carcinogens at a given rate. ELCR is estimated using Equation 6 (34, 35).
where CDI is the chronic daily intake averaged over 70 years (mg/kg-day) which is determined using Equation 7, while SF is the slope factor expressed in (mg/kg-day) which represents the slope of the dose–response curve for cancer risk having values of 5.2 × 10⁻⁶ for 226Ra, 5.6 × 10⁻⁶ for 228Ra, and 2.2 × 10⁻⁶ for 40K (34), for the public and especially for stochastic effects. The slope factor translates the estimated daily intake, averaged over a lifetime of exposure, into an increased risk of an individual developing cancer.
where is the specific activity concentration of radionuclides, is the intake rate of the foodstuff, sugar, 30.70 kg/year, and is the body weight of an individual (in kg) which is usually assumed to be 70 kg for the adults (34, 35).
Results and discussion
The results of the measured activity concentrations and uncertainties of the radionuclides 226Ra, 228Ra, and 40K in (Bq/kg) in 14 different brands of sugar consumed in South Africa are presented in Table 2. The results show that the radionuclides under study were detected in all the samples at varied concentrations. The specific activity concentration indicates that 226Ra activity varied from 2.01 ± 0.15 Bq/kg in sample SW-12 to 7.93 ± 0.14 Bq/kg in sample SW-11, with a mean value of 3.83 ± 0.21 Bq/kg. The 228Ra activity varied from 2.90 ± 0.18 Bq/kg in sample SW-12 to 7.09 ± 0.10 Bq/kg in sample SW-11, with a mean of 2.90 ± 0.21 Bq/kg, while 40K ranged from 209.40 ± 4.79 Bq/kg in sample SW-12 to 453.20 ± 10.49 Bq/kg in sample SW-11, with a mean of 320.26 ± 7.41 Bq/kg. The activity concentrations of the radionuclides measured are found to be below the worldwide recommended reference value set by the United Nations Scientific Committee on the Effects of Atomic Radiation (1) for the diet which is 22 Bq/kg for 226Ra and 15 Bq/kg for 228Ra. However, in this study, the activity concentration levels of 226Ra and 228Ra are found to be less than those reported by (9, 20, 22, 36), but greater than those of (37–39). However, the concentration of 40K in the body is under homeostatic control because it is uniformly distributed in the body due to its intake present in foodstuffs (1, 12), there is no specific reference level provided.
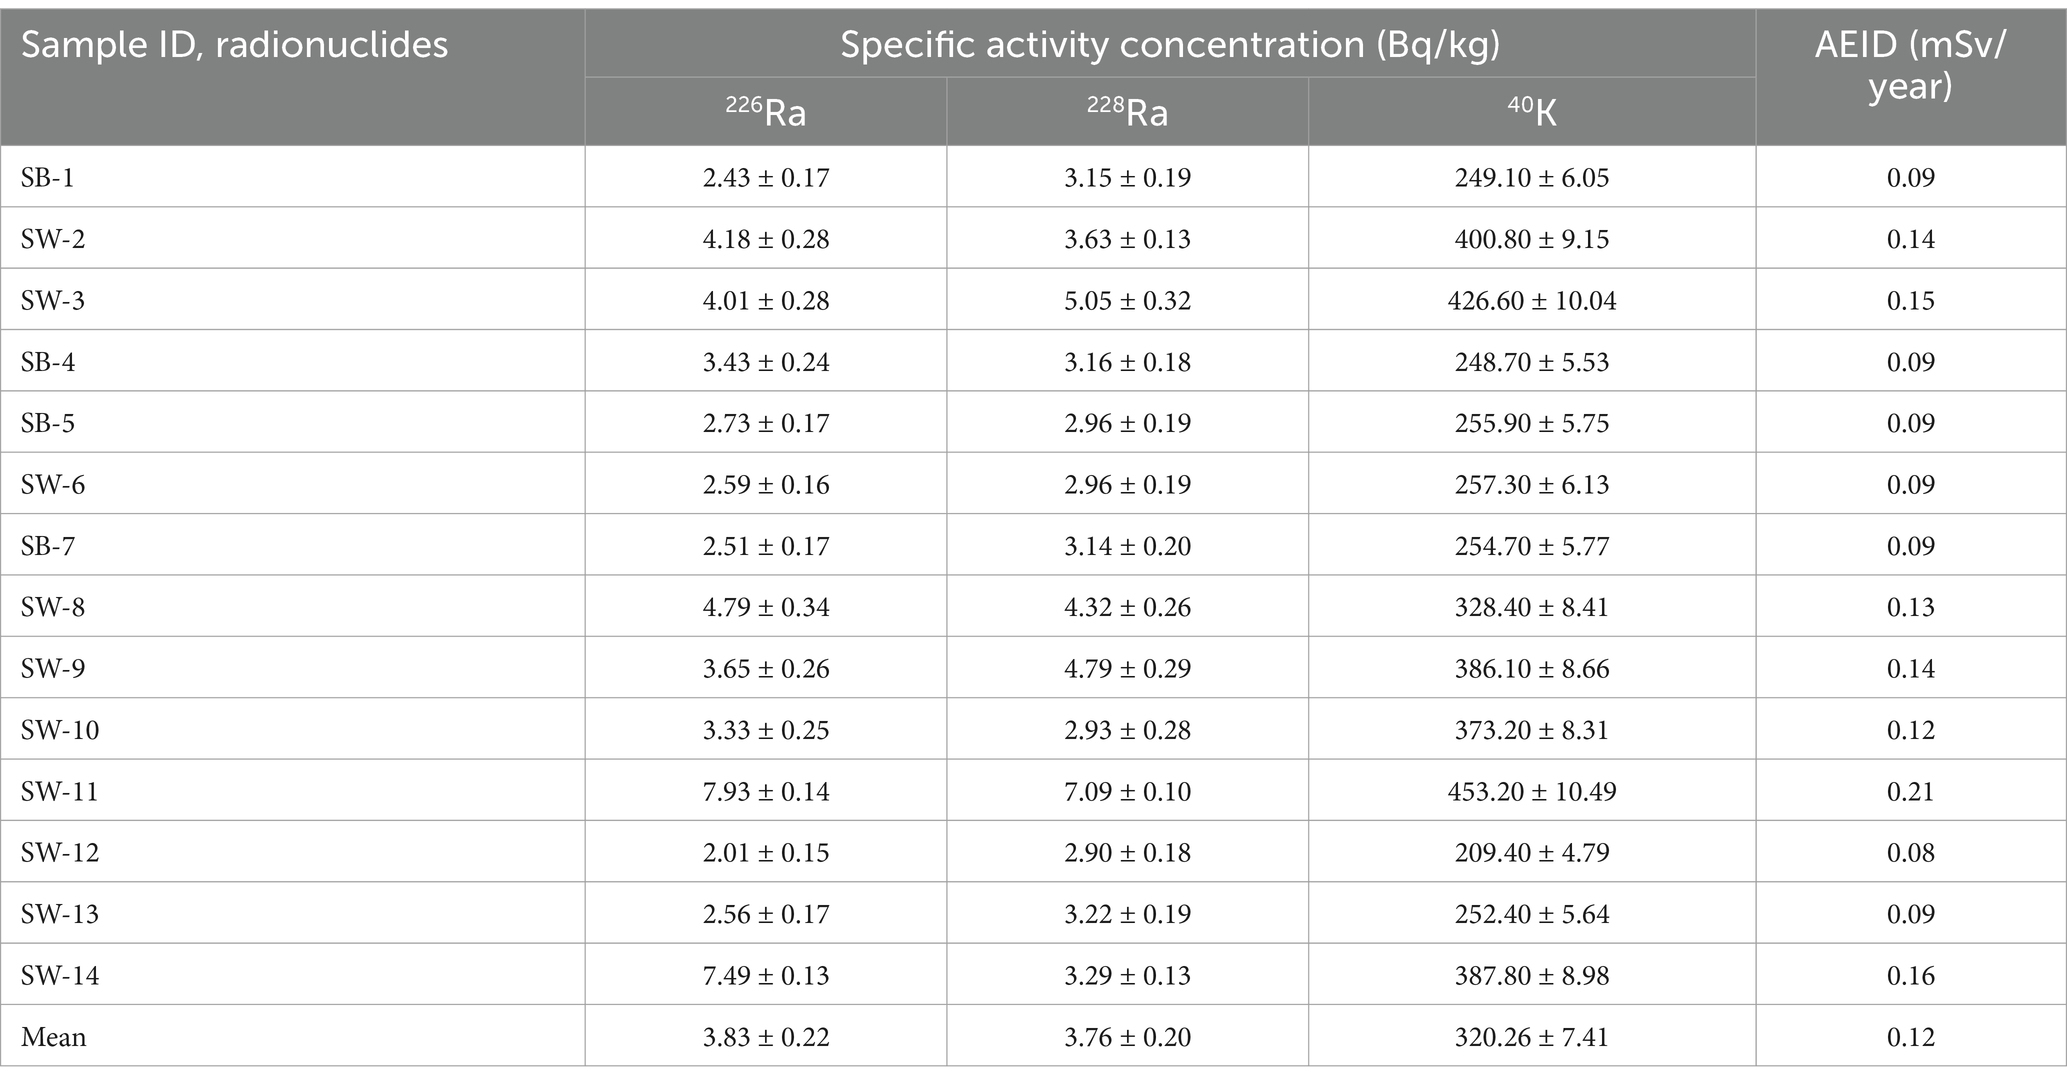
Table 2. Specific activity concentrations (Bq/kg) of NORMs in sugar samples consumed in South Africa.
The distribution of the specific activity concentrations of the sugar samples shows that the activity concentration of 40K is higher in all the samples compared to the other radionuclides, following the order: 40K > 228Ra > 226Ra. The higher activity concentration of 40K in comparison to other radionuclides, reflects its natural abundance, with a specific activity of 2.6 × 10⁸ Bq/kg, which is greater than that of the other radionuclides (1). There is also variation in the activity concentrations among the samples studied, as shown in Figures 2, 3, with brown sugar samples displaying lower activity levels than white sugar samples. This variation may be attributed to the geological formation conditions and processes of the area where the raw materials were produced (40) and the industrial production processes. Notably, the activity concentration levels of the radionuclides in the sugar from this study are higher than those reported by sources (37–39), which could be due to regional variation.
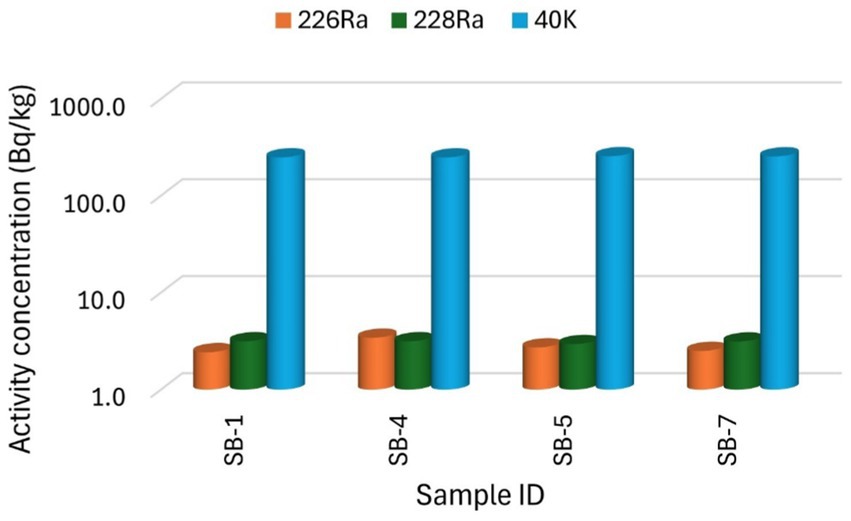
Figure 2. The specific activity concentration of radionuclides 226Ra, 228Ra, and 40K for the brown sugar samples.
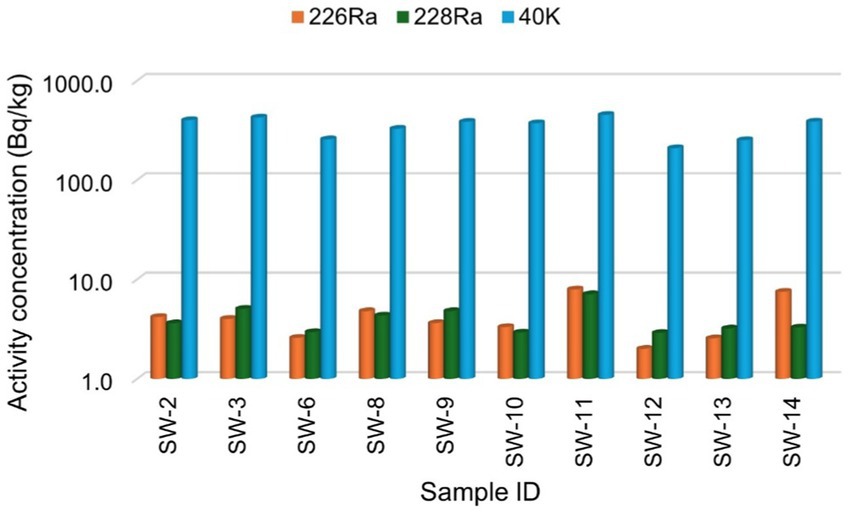
Figure 3. The specific activity concentration of radionuclides 226Ra, 228Ra, and 40K for the white sugar samples.
Figures 2, 3 present the specific activity concentrations of the radionuclides 226Ra, 228Ra, and 40K in the brown and white sugar samples. Figure 2 shows the activity concentrations of radionuclides in brown sugar brands, while Figure 3 presents the concentrations of radionuclides in white sugar samples. Table 3 displays the comparison results of the range and mean activity concentrations of the radionuclides in the two types of the sugar samples. For 226Ra, the activity concentration range and mean values are 0.99 ± 0.08 Bq/kg and 2.78 ± 0.19 Bq/kg, respectively, for brown sugar samples, and 5.92 ± 0.22 Bq/kg and 4.25 ± 0.22 Bq/kg, for white sugar samples. For 228Ra, the activity concentration range and mean values are 0.19 ± 0.02 Bq/kg and 3.10 ± 0.19 Bq/kg, respectively, for brown sugar samples, and 4.20 ± 0.22 Bq/kg and 4.02 ± 0.21 Bq/kg, respectively, for white sugar samples. For 40K, the activity concentration range and mean values are 7.20 ± 0.52 Bq/kg and 252.10 ± 5.78 Bq/kg for brown samples, and 243.80 ± 5.70 Bq/kg and 347.52 ± 8.06 Bq/kg for white samples, respectively. The variation in the range and mean activity concentrations between the two types of sugar samples suggests that brown sugar has lower values than white sugar.
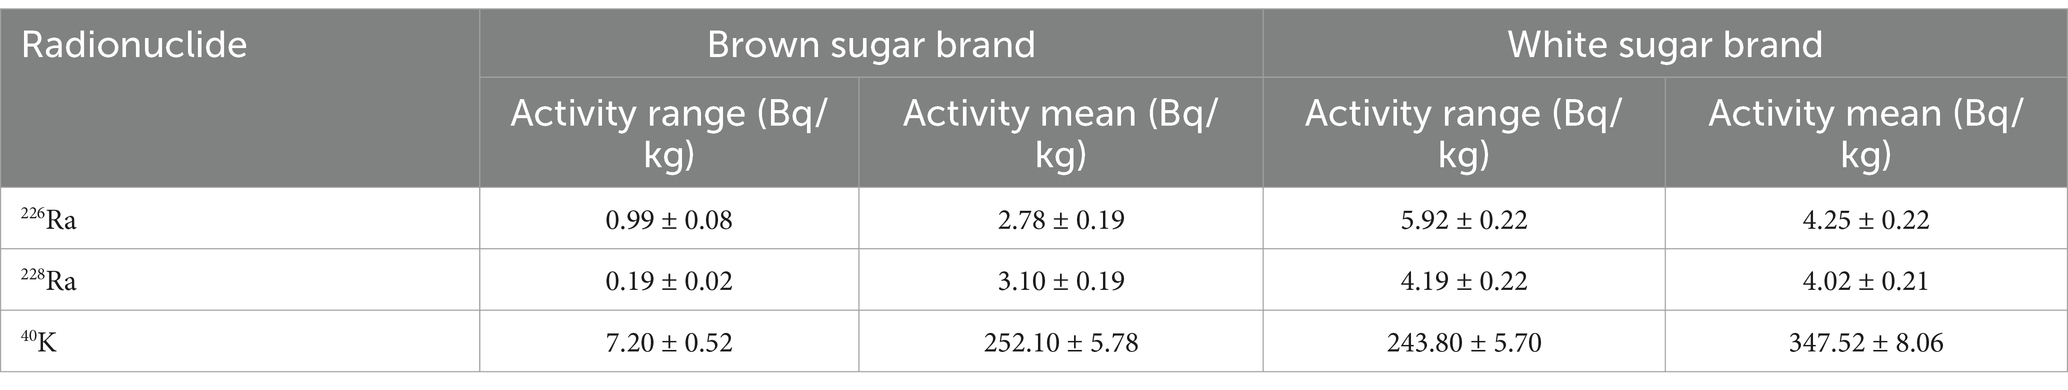
Table 3. Range and mean activity concentration values for the two sugar brands in this study.
The variation in the activity concentrations between the brown and white sugar samples could be related to the sources of the raw materials. Sugar cane—primarily produced in the KwaZulu-Natal and Mpumalanga provinces—is grown in areas with varying levels of natural radionuclides in the soil, which can affect the final product of sugar (16). Additionally, industrial refining processes and the presence of molasses may contribute to the variation between the different sugar sample types.
The estimated annual effective ingestion dose for the analysed sugar samples is presented in Table 2, column 5. The values obtained ranged from 0.08 to 0.22 mSv/year, with a mean value of 0.12 ± 0.04 mSv/year. These values fall below the recommended limit of 0.20–0.80 mSv (1, 14), suggesting that the levels of natural radionuclides in sugar samples are within a safe range for human consumption. Furthermore, these values are lower than those reported by a previous study (20), reinforcing the notion that the sugar products analysed in this study pose a minimal radiological risk to consumers. However, further analysis based on age variability, as outlined by UNSCEAR (1, 41) and using Equation 5, provided additional insight. Specifically, because the cells of children divide rapidly, they are more sensitive to radiation than adults, and as they live longer, chances are that cancer will have a reducing effect on their quality of life (42, 43), as presented in Table 4.
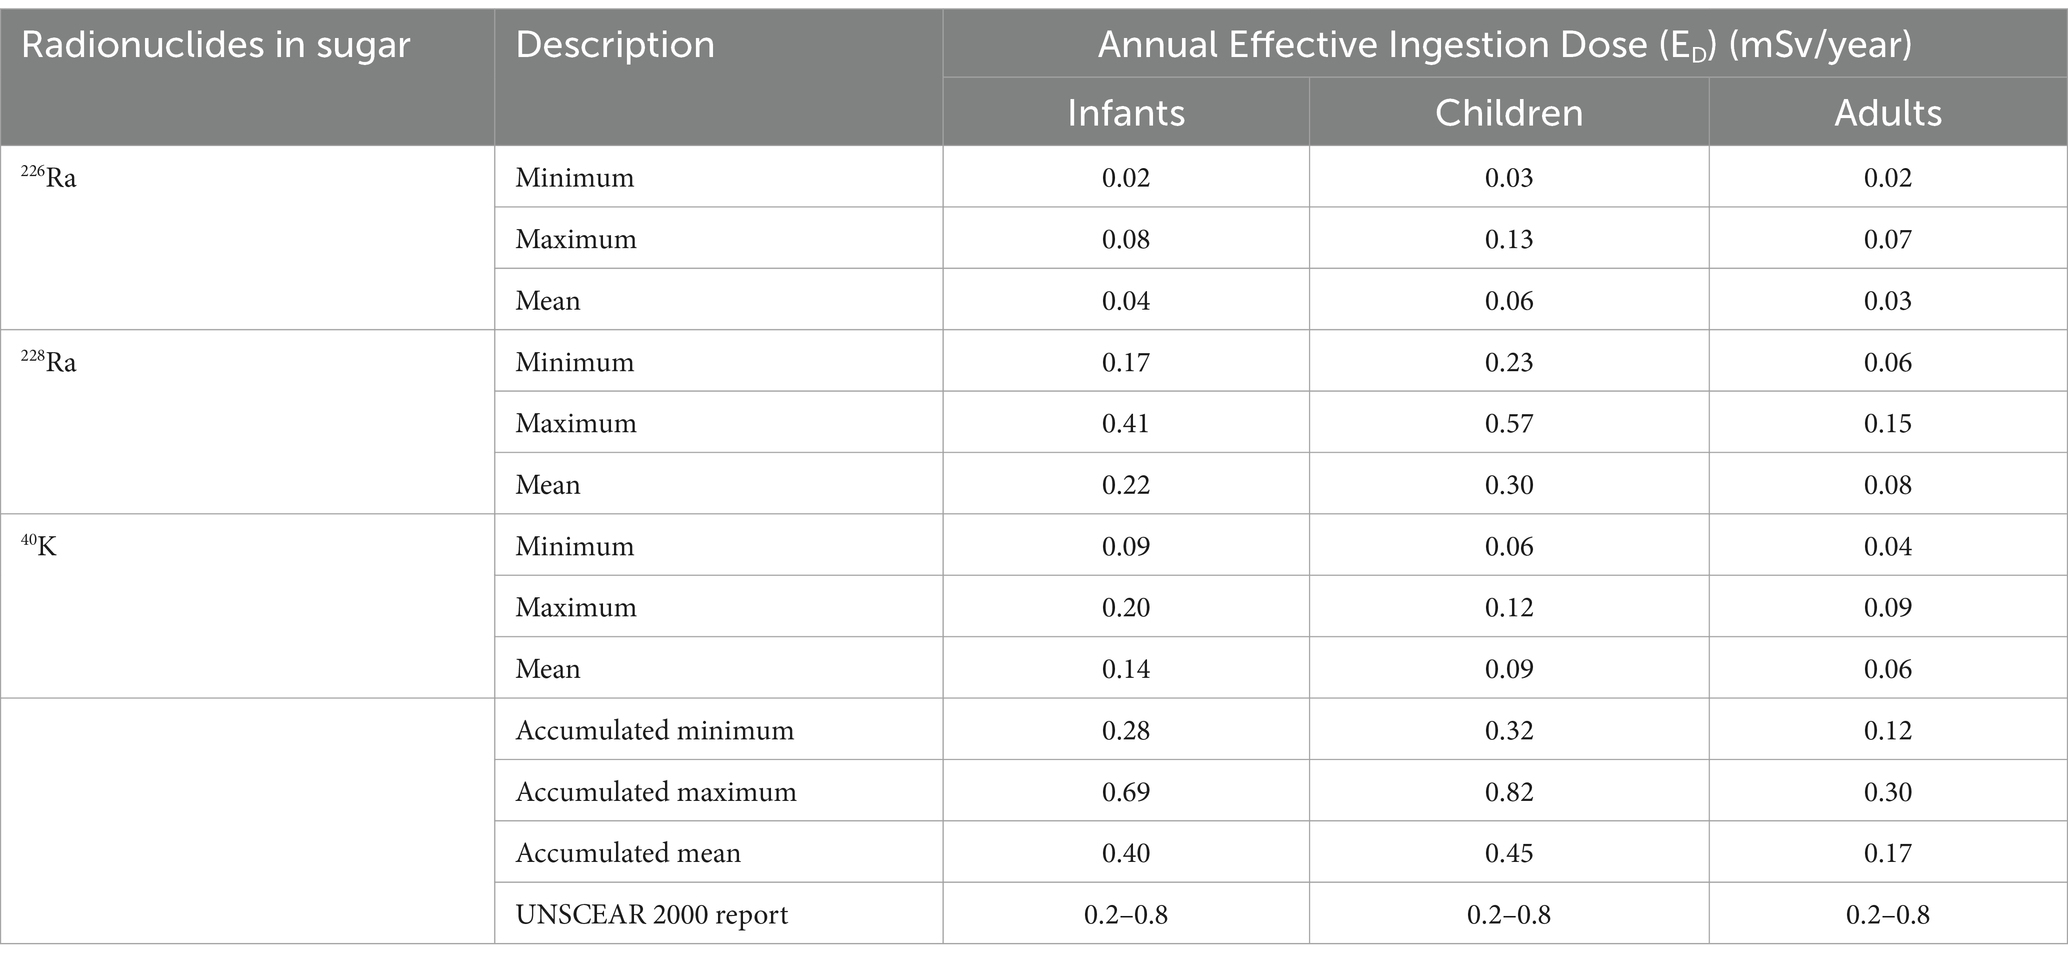
Table 4. Annual effective ingestion dose for different age groups (infants 1–2 years), children (7–12 years) and adults (>17 years) due to 226Ra, 228Ra, and 40K radionuclides in sugar samples in South Africa in this study.
Table 4 presents the annual effective ingestion dose (ED) categorised by age group for individuals consuming sugar, focusing on the contributions from the radionuclides 226Ra, 228Ra, and 40K. The age groups considered include infants (1–2 years), Children (7–12 years), and adults (>17 years). For infants, the accumulated ED values ranged from 0.28 to 0.69 mSv/year, with a mean of 0.40 ± 0.11 mSv/year, and are below the acceptable limit, indicating that sugar consumption for this group is radiologically safe. The accumulated ED values for children varied between 0.32 and 0.82 mSv/year, with a mean of 0.45 ± 0.14 mSv/year. This range is below the recommended limits, suggesting that the risk for this age group is relatively low. For adults, the accumulated ED values ranged from 0.12 to 0.30 mSv/year, with a mean of 0.17 ± 0.05 mSv/year, indicating a minimal risk associated with radiation exposure from sugar consumption. While all ED values across the age groups are below the recommended limits, it is noteworthy that the maximum accumulated ED for children exceeds the acceptable range limit by 2.50%. This finding suggests that children may be at risk of exposure to ionizing radiation through sugar consumption in South Africa. Therefore, it is essential to monitor and assess dietary intake of sugar in the vulnerable age group to mitigate potential health risks.
The average percentage contribution of the individual natural radionuclides 226Ra, 228Ra, and 40K to the overall annual effective ingestion dose from the consumption of the sugar samples was computed, as shown in Figures 4–6. The average percentage contribution of 226Ra, 228Ra, and 40K in the sugar samples for the infants is 9, 55, and 36%, respectively (Figure 3); for the children is 14, 67, and 19% for 226Ra, 228Ra, and 40K, respectively (Figure 4); for the adults is 18, 46, and 36% for 226Ra, 228Ra, and 40K, respectively (Figure 5). The natural radionuclide 228Ra contributed the highest radiation dose to the sugar samples, with the higher contribution in the children category. 226Ra contributed the lowest dose, with the least contribution observed in the infant category. 40K lies between the two, with the highest value in both the infant and adult categories, consistent with the findings from (3, 41). The isotopes 226Ra and 228Ra tend to concentrate in the skeleton, replacing calcium in bones and teeth (1, 12). The findings in this study imply that, with 226Ra contributing the most to the radiation dose, there is risk of radiation damage to vital organs, such as bone marrow (10), highlighting the need for regular monitoring of foodstuffs. On the contrary, 40K is an essential element that is homeostatically controlled within human cells; therefore, its presence and determination are more related to physiological characteristics than dietary intake. Therefore, its contribution to radiation dose in sugar has less radiological health impact (1, 12). However, it is worth noting that the radionuclides 226Ra and 228Ra have been reported to contribute most significantly to the foodstuff dose, as indicated by previous studies (20, 21, 29).
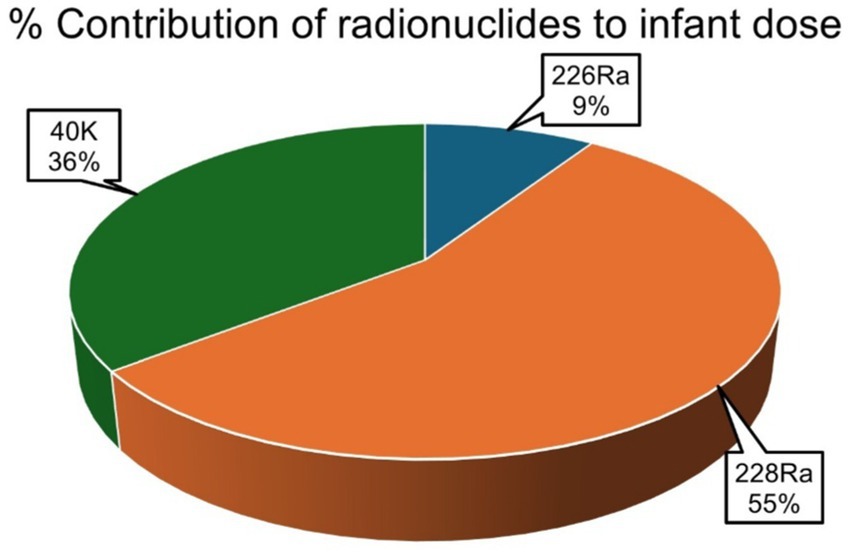
Figure 4. Percentage contributions of natural radionuclides 226Ra, 228Ra, and 40K to annual effective ingestion dose for the infants due to sugar consumption in South Africa.
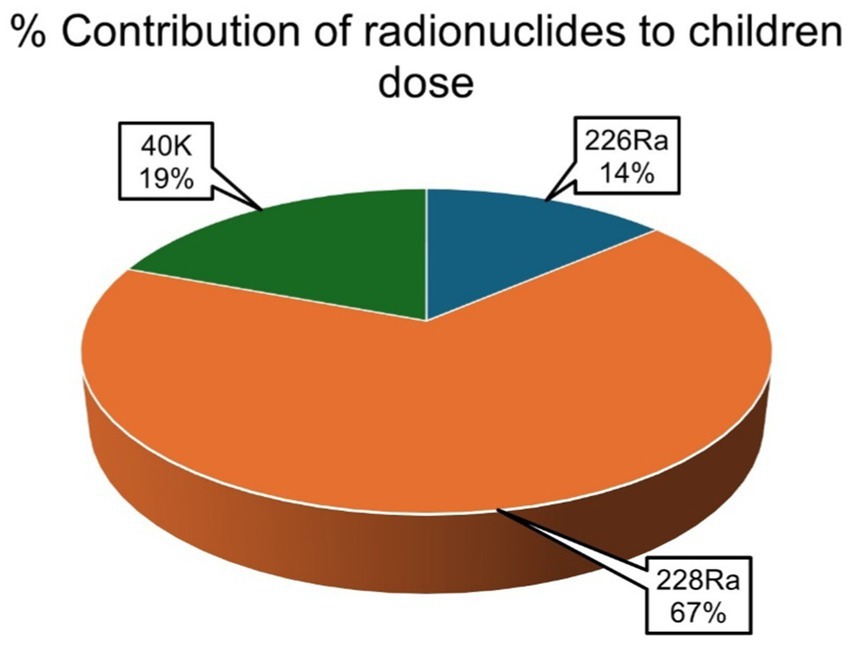
Figure 5. Percentage contributions of natural radionuclides 226Ra, 228Ra, and 40K to annual effective ingestion dose for the children due to sugar consumption in South Africa.
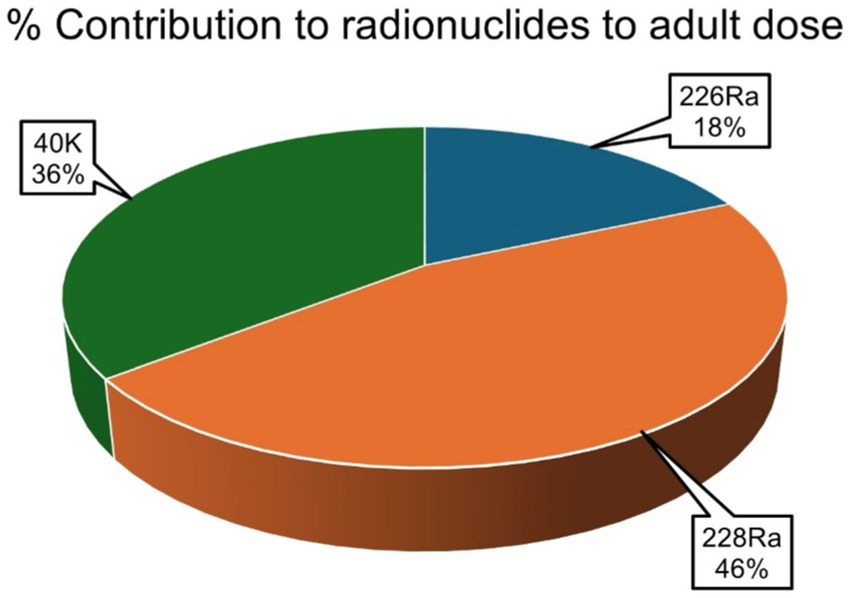
Figure 6. Percentage contributions of natural radionuclides 226Ra, 228Ra, and 40K to annual effective ingestion dose for the adults due to sugar consumption in South Africa.
Figure 7 presents the chronic daily intake (CDI) (mg/kg-day), averaged over a lifetime (usually assumed to be 70 years), of each contaminant (226Ra, 228Ra, and 40K) through the ingestion pathway via food consumption. The results show that the CDI for 226Ra varied from 2.41 × 10⁻³ to 9.52 × 10⁻³ with a mean of 4.60 × 10⁻³ ± 2.19 × 10⁻³. The CDI values for 228Ra ranged between 3.49 × 10⁻³ and 8.5 × 10⁻³, with a mean of 4.51 × 10⁻³ ± 1.44 × 10⁻³, while that of 40K varied between 0.25 and 0.54, with a mean of 0.38 ± 0.09. In summary, the total CDI ranged from 0.26 to 0.56, with a mean value of 0.39 ± 0.10. The CDI values in descending order are 40K > 226Ra > 228Ra, implying that sugar ingestion is associated with a high content of 40K.
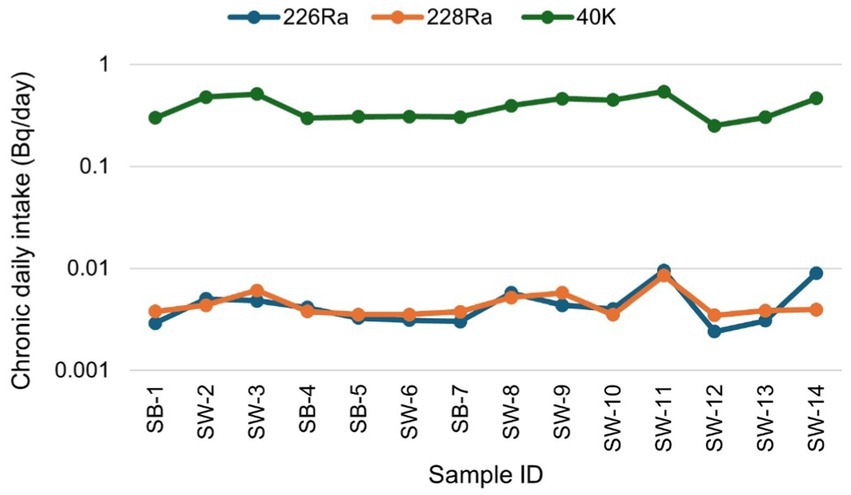
Figure 7. Chronic daily intake due to natural radionuclides 226Ra, 228Ra, and 40K for sugar consumption in South Africa.
The excess lifetime cancer risk (ELCR) calculated in this study ranges from 1.25 × 10⁻⁸ to 4.95 × 10⁻⁸ with a mean of 2.39 × 10⁻⁸ ± 1.14 × 10⁻⁸ for 226Ra, from 1.95 × 10⁻⁸ to 4.77 × 10⁻⁸ with a mean of 2.53 × 10⁻⁸ ± 8.03 × 10⁻⁹ for 228Ra, and from 5.53 × 10⁻⁷ to 1.19 × 10⁻⁶ with a mean of 8.46 × 10⁻⁷ ± 2.16 × 10⁻⁷ for 40K, respectively. The total ELCR is presented in Figure 8, ranging from 5.86 × 10⁻⁷ to 1.30 × 10⁻⁶, with a mean value of 8.96 × 10⁻⁷ ± 2.31 × 10⁻⁷. This mean value is significantly below the acceptable ELCR threshold of approximately 1 × 10⁻³ (29), indicating that the radiological health risk associated with consuming sugar samples in this study is relatively low. Furthermore, the observed ELCR values are less than those reported by (25, 29), suggesting that the sugar products analysed in this study present a lower risk of inducting cancer over a lifetime than those previously assessed. This finding reinforces the conclusion that sugar samples consumed in South Africa are not only within acceptable radiological safety limits but also contribute minimally to long-term cancer risk, thereby supporting public health safety and dietary choices.
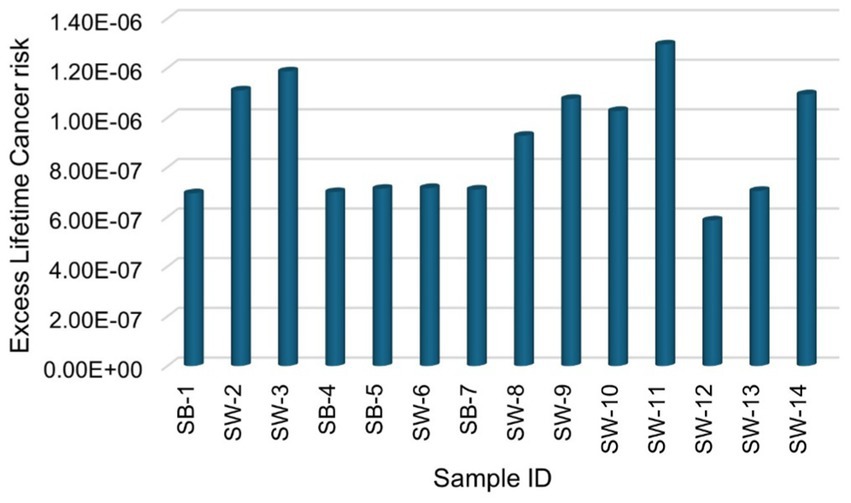
Figure 8. Total excess lifetime cancer risk due to natural radionuclides 226Ra, 228Ra, and 40K for sugar consumption in South Africa.
Table 5 presents the essential descriptive statistics for the natural radionuclides 226Ra, 228Ra, and 40K analysed in this study, including range, minimum, maximum, mean, standard deviation (STD), variance, skewness, and kurtosis. The mean values for these radionuclides are higher than their corresponding standard deviation values, indicating a high degree of uniformity in their distribution across the samples (40). The data exhibit positive skewness and kurtosis, suggesting that the distribution tails lean towards positive values. Notably, 40K has a negative skewness value and shows the highest variance among the radionuclides, indicating an uneven distribution of natural radioisotopes in the samples. This variance likely reflects the geological characteristics of raw material sources used in sugar production. Furthermore, the statistical analysis supports the observed order of activity concentration: 40K > 232Th > 238U.
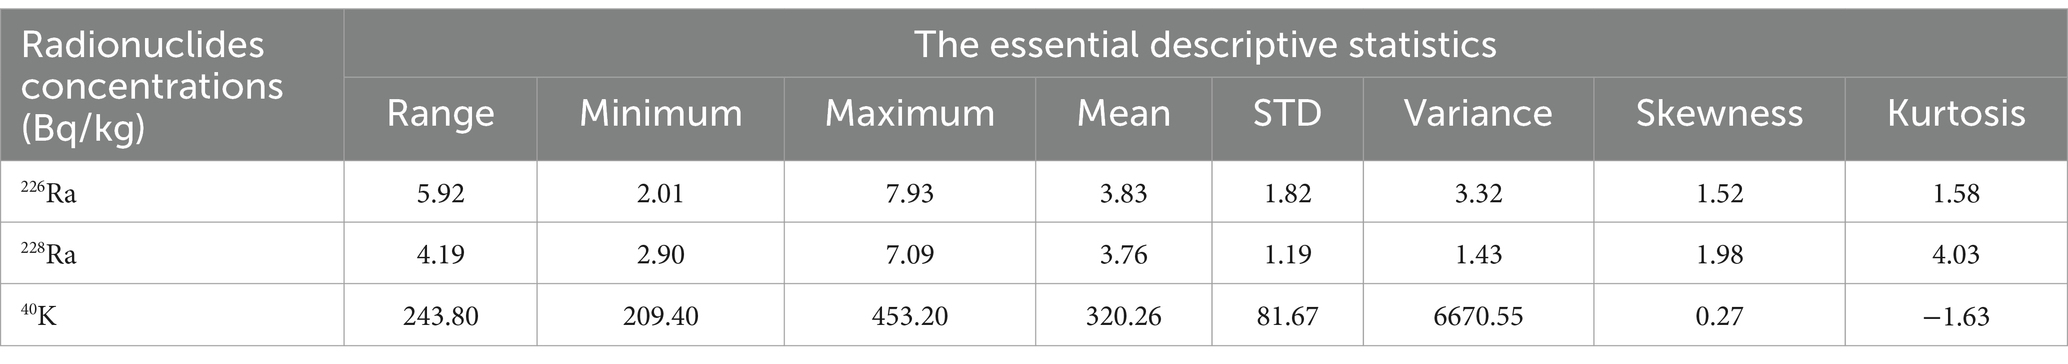
Table 5. Statistical description of the specific activity concentration of the radionuclides 226Ra, 228Ra, and 40K in the sugar samples.
Table 6 presents a comparative analysis of the mean activity concentrations of natural radionuclides (226Ra, 228Ra, and 40K) found in sugar samples and other related foodstuffs from this study and data from other countries, as well as global reference values provided by a previous study (1). From the results of this study, South Africa’s sugar samples exhibited a mean activity concentration of 3.83 ± 0.28 Bq/kg for 226Ra, 3.76 ± 0.20 Bq/kg for 228Ra, and a significantly higher concentration of 320.26 ± 7.41 Bq/kg for 40K. In comparison, Brazil showed a much higher concentration of 226Ra, at 21.91 ± 0.34 Bq/kg, but minimal levels of 228Ra (0.02 ± 0.58 Bq/kg) and 40K (0.66 ± 0.32 Bq/kg) (20). Iraq’s data indicates the absence of 226Ra measurements but reveals a substantial presence of 226Ra (5.92 ± 0.72 Bq/kg) and 40K (138.66 ± 0.83 Bq/kg) (9, 36), suggesting varying geological influences in these regions. Poland provides limited data, only reporting 40K at 4.58 Bq/kg (24), indicating relatively low levels of this radionuclide compared to this study. Other countries presented values comparable to those of this study while some are either less than or higher, accordingly (25, 37, 39, 44). When juxtaposed with the global reference values for foodstuffs, of 22 Bq/kg for 226Ra, and 15 Bq/kg for 228Ra, while no reference value for 40K (1), all the reported activity concentration values from this study and other countries are below the international thresholds for the natural radionuclides studied. This finding implies that the foodstuffs reported have low activity concentration levels, and their consumption is safe and may not cause exposure to radiation dose. In addition, based on these results, public health initiatives could consider offering guidelines for safe radiation levels in consumables such as sugar, especially for vulnerable populations such as infants and children.
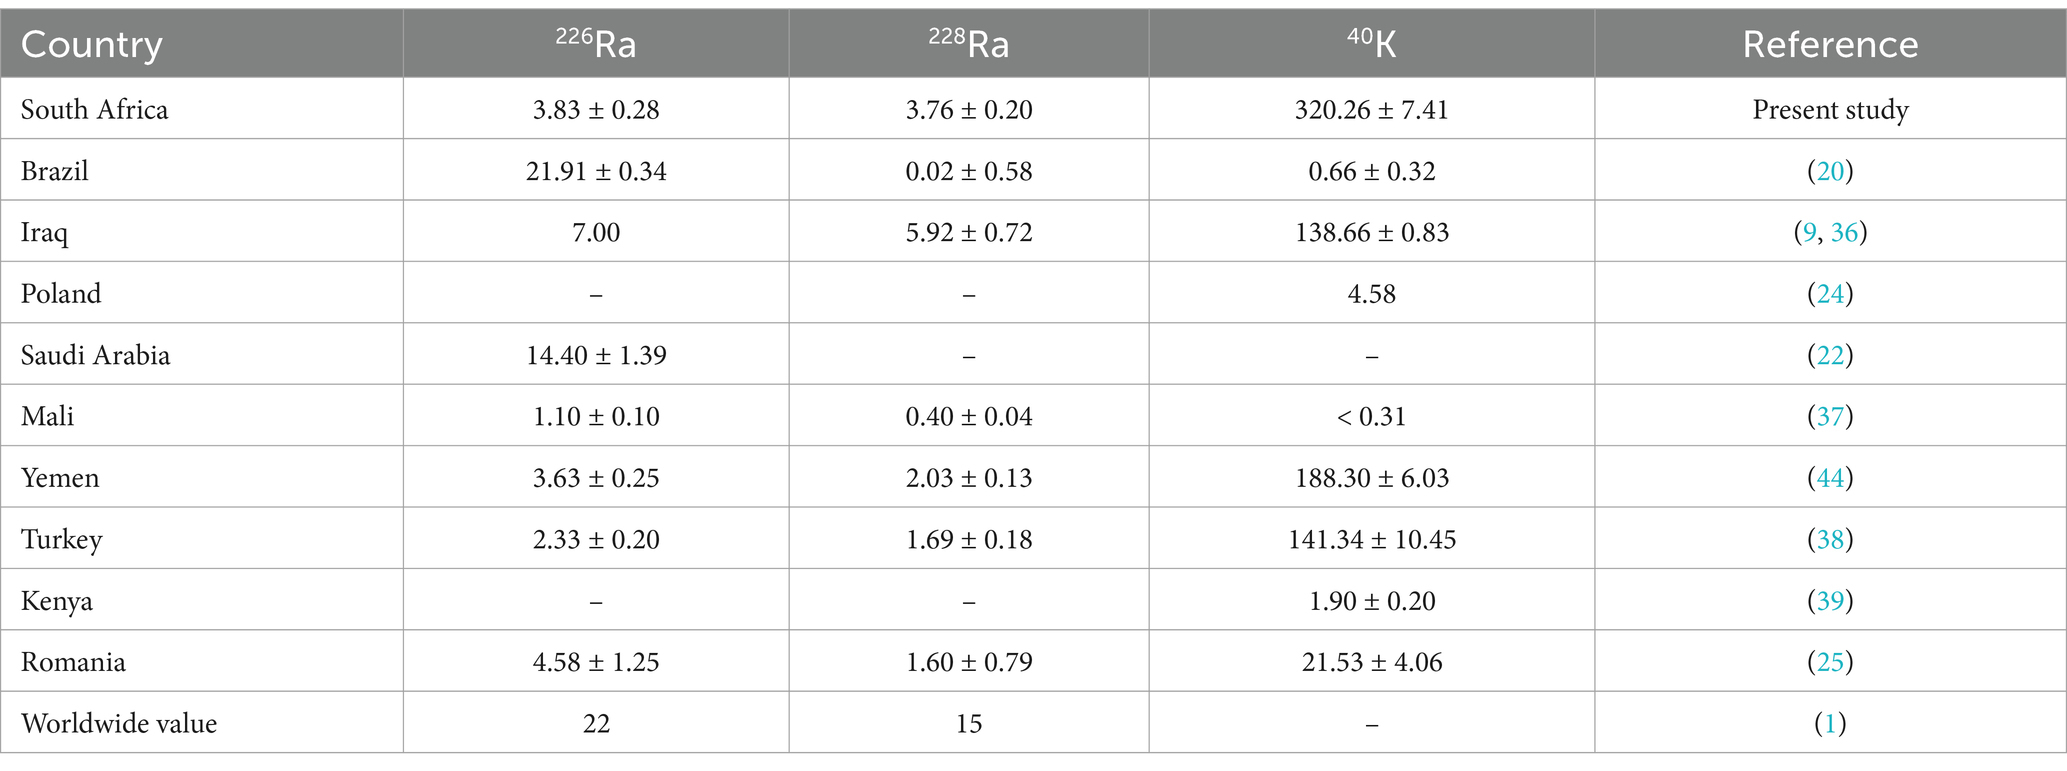
Table 6. Comparison of mean specific activity concentration (Bq/kg) in sugar and related foodstuff samples from South Africa and other countries around the world.
Conclusion
The activity concentration levels of the natural radionuclides 226Ra, 228Ra, and 40K in 14 brands of sugar samples from South Africa were determined using HPGe gamma spectrometry in this study. The results obtained were used to estimate the effective ingestion dose and lifetime cancer risk from sugar intake, based on models prescribed by UNSCEAR and USEPA. It was found that radioisotopes 226Ra, 228Ra, and 40K were detected in all the samples at varying concentrations, in the order of 40K > 228Ra > 226Ra, with brown sugar having lower values than white sugar. The activity concentrations of all the radionuclides in the sugar samples are below the reference values set by the United Nations Scientific Committee on the Effects of Atomic Radiation, indicating that consuming sugar is safe and may not cause radiation exposure. The analysis of the effective ingestion dose suggests values within the recommended limits, with children receiving the highest dose. Notably, 228Ra contributes the highest dose, which may pose a potential risk of radiation exposure to the bones. The total chronic daily intake due to the radionuclides is minimal, with 40K contributing the highest value. At the same time, the estimated excess lifetime cancer risk remains within the acceptable limit, indicating a lower radiological health risk associated with sugar intake. Additionally, the findings of this study are comparable to those reported in other countries.
Based on the evaluated health risk parameters, it can be concluded that consuming sugar from South Africa is safe and does not pose any significant radiological health risks. This study provides radiometric baseline data on natural radionuclides in sugar and the associated hazard indices. It also emphasizes the importance of continuously monitoring radionuclide levels in foodstuffs to ensure consumer safety, compliance with standard regulations, and to contribute to ongoing discussions about the radiological health risks of dietary habits. Further research is recommended to assess the long-term effects of radiation exposure on growth, development, and disease prevention, especially in children and infants. Additionally, examining the heavy metal content in sugar from South Africa would be valuable for a more comprehensive risk assessment.
Data availability statement
The original contributions presented in the study are included in the article/supplementary material, further inquiries can be directed to the corresponding author.
Author contributions
SJ: Conceptualization, Data curation, Formal analysis, Investigation, Methodology, Project administration, Software, Writing – original draft, Writing – review & editing. SO: Data curation, Formal analysis, Investigation, Methodology, Writing – review & editing. MR: Data curation, Writing – review & editing. MM: Funding acquisition, Methodology, Resources, Supervision, Validation, Visualization, Writing – review & editing.
Funding
The author(s) declare that financial support was received for the research, authorship, and/or publication of this article. This research was funded by the Postdoctoral Research Fund of the North-West University, South Africa; Research fund No. NW 1G01487; 1D 01986.
Acknowledgments
The authors wish to thank the director of CARST Prof. Helen Drummond, Admin Officer Ms. Monde Kakula, and Senior Laboratory Technician Ms. Tsholofelo Mokgele for their support.
Conflict of interest
The authors declare that the research was conducted in the absence of any commercial or financial relationships that could be construed as a potential conflict of interest.
Generative AI statement
The authors declare that Generative AI was used in the creation of this manuscript. To check the grammar.
Publisher’s note
All claims expressed in this article are solely those of the authors and do not necessarily represent those of their affiliated organizations, or those of the publisher, the editors and the reviewers. Any product that may be evaluated in this article, or claim that may be made by its manufacturer, is not guaranteed or endorsed by the publisher.
References
2. John, SOO, Usman, IT, Akpa, TC, Abubakar, SA, and Ekong, GB. Natural radionuclides in rock and radiation exposure index from uranium mine sites in parts of northern Nigeria. Radiat Prot Environ. (2020) 43:36–43. doi: 10.4103/rpe.RPE_7_20
3. Desideri, D, Meli, MA, Roselli, C, Forini, N, Rongoni, A, and Feduzi, L. Natural radionuclides in Italian diet and their annual intake. J Radioanal Nucl Chem. (2014) 299:1461–7. doi: 10.1007/s10967-013-2860-9
4. El Mestikou, R, Jemii, E, Mazouz, M, Benali, M, and Ghedira, L. Determination of the activity level in powdered milk available in Tunisia and assessment of the radiological risks. J Radioanal Nucl Chem. (2018) 317:991–6. doi: 10.1007/s10967-018-5965-3
5. Priharti, W, Samat, S, Yasir, M, and Garba, N. Assessment of radiation hazard indices arising from natural radionuclides content of powdered milk in Malaysia. J Radioanal Nucl Chem. (2016) 307:297–303. doi: 10.1007/s10967-015-4172-8
6. Sahar, A, Rana, A, and Al-Ani, R. Assessment of natural radionuclides in powdered milk consumed in Iraq. Assessment. (2016) 13:112–115.
7. Awudu, A, Faanu, A, Darko, E, Emi-Reynolds, G, Adukpo, O, Kpeglo, D, et al. Preliminary studies on 226 Ra, 228 Ra, 228 Th and 40 K concentrations in foodstuffs consumed by inhabitants of Accra metropolitan area, Ghana. J Radioanal Nucl Chem. (2012) 291:635–41. doi: 10.1007/s10967-011-1444-9
8. John, SOO, Akpa, TC, and Onoja, RA. Gross alpha and gross beta radioactivity measurements in groundwater from Nasarawa north district Nasarawa state Nigeria. Radiat Prot Environ. (2021) 44:3–11. doi: 10.4103/rpe.RPE_24_20
9. Alhous, SF, Kadhim, SA, Alkufi, AA, and Kadhim, BA, Measuring the level of radioactive contamination of selected samples of sugar and salt available in the local markets in Najaf governorate/Iraq. IOP conference series: Materials science and engineering; (2020).
10. IAEA. Exposure due to radionuclides in food other than during a nuclear or radiological emergency part 1: Technical material. Vienna: IAEA (2023).
11. Abbasi, A, Issa, SA, Mirekhtiary, F, Algethami, M, and Zakaly, HM. Radioactivity concentration levels and potential radiotoxicity risk assessment of aquatic superfoods case study of algae supplements. Mar Pollut Bull. (2024) 205:116610. doi: 10.1016/j.marpolbul.2024.116610
12. Cinelli, G, De Cort, M, and Tollefsen, T. European atlas of natural radiation. Luxembourg: Publications Office of the European Union (2019).
13. Salahel, DK. Assessment of natural and artificial radioactivity in infants’ powdered milk and their associated radiological health risks. J Radioanal Nucl Chem. (2020) 324:977–81. doi: 10.1007/s10967-020-07170-0
14. IAEA. Criteria for radionuclide activity concentrations for food and drinking water. IAEA TECDOC series. Vienna: International Atomic Energy Agency (2016).
15. Makoma Makgopa, KW, and Ali Abdi, KW. Sugar Annual South Africa: United States Department of Agriculture (USDA) and global agricultural information network (GAIN) and South African sugar association (SASA). (2022).
16. Gumsley, A, Rådman, J, Söderlund, U, and Klausen, M. U–Pb baddeleyite geochronology and geochemistry of the white Mfolozi dyke swarm: unravelling the complexities of 2.70–2.66 Ga dyke swarms across the eastern Kaapvaal craton, South Africa. GFF. (2016) 138:115–32. doi: 10.1080/11035897.2015.1122665
17. Adeleye, B, and Chetty, N. Natural radioactivity and associated radiation hazards in samples of maize available to the people of KwaZulu-Natal. South Africa Chem Africa. (2023) 6:2641–7. doi: 10.1007/s42250-023-00663-x
18. IAEA. Measurement of radionuclides in food and the environment. Vienna: International Atomic Energy Agency (1989).
19. ISO. Measurement of radioactivity in the environment - soil -. Part 3: Measurement of gamma-emitting radionuclides. Geneva: International Organization for Standardization (2006).
20. Alcantara, F, Kastrup, I, Kelecom, A, Silva, R, Santos, L, Barbosa, L, et al. Evaluation of radionuclides in sugar samples from different regions of Brazil. MOJ Public Health. (2023) 12:132–5. doi: 10.15406/mojph.2023.12.00422
21. Agbalagba, EO, Agbalagba, HO, and Avwiri, GO. Cost-benefit analysis approach to risk assessment of natural radioactivity in powdered and liquid milk products consumed in Nigeria. Environ Forensic. (2016) 17:191–202. doi: 10.1080/15275922.2016.1177753
22. El-Araby, EH, and Shabaan, DH. Measurement of radioactive concentration in different foodstuffs consumed in Jazan region. Food Chem. (2023) 424:136363. doi: 10.1016/j.foodchem.2023.136363
23. TI, AL-N, and Shabaan, DH. Simple analysis of radioactivity, and assessment of radiological hazards in different types of household foods. Int J Recent Sci Res. (2018) 9:24838–43. doi: 10.24327/ijrsr.2018.0903.1736
24. Dołhańczuk-Śródka, A, and Ziembik, Z. Estimation of radioactivity dose rate absorbed with ingested foods. Ecol Chem Eng A. (2013) 20:555–65. doi: 10.2478/eces-2013-0031
25. Bulubasa, G, Costinel, D, Miu, AF, and Ene, MR. Activity concentrations of 238U, 232Th, 226Ra 137Cs and 40K radionuclides in honey samples from Romania. Lifetime cancer risk estimated. J Environ Radioact. (2021) 234:106626. doi: 10.1016/j.jenvrad.2021.106626
26. Steyn, NP, and Temple, NJ. Evidence to support a food-based dietary guideline on sugar consumption in South Africa. BMC Public Health. (2012) 12:1–8. Available at: http://www.biomedcentral.com/1471-2458/12/502
27. USDA. South African sugar production forecast to grow despite revenue pressures. Global agricultural information network - GAIN report: USDA Foreign Agricultural Service. United State Dept. of Agric - USDA, and Global Agricultural Information Network - GAIN, USA (2019).
28. Challan, MB. Gamma-ray efficiency of a HPGe detector as a function of energy and geometry. Appl Radiat Isot. (2013) 82:166–9. doi: 10.1016/j.apradiso.2013.07.010
29. Abbasi, A, and Bashiry, V. Estimation of cancer risk due to radiation exposure for some daily consumption of foods. J Cancer Res Ther. (2020) 16:64–S7. doi: 10.4103/jcrt.JCRT_259_18
30. Krneta Nikolić, JD, Todorović, D, Janković, MM, Pantelić, GK, and Rajačić, M. Quality assurance and quality control in environmental radioactivity monitoring. Qual Assur Safety Crops Foods. (2014) 6:403–9. doi: 10.3920/QAS2012.0.236
31. Currie, LA. Limits for qualitative detection and quantitative determination. Appl Radiochem Anal Chem. (1968) 40:586–93. doi: 10.1021/ac60259a007
32. IAEA. Exposure due to radionuclides in food other than during a nuclear or radiological emergency. Part 2: Considerations in implementing requirement 51 of IAEA general safety requirements part 3. Vienna, Austria: International Atomic Energy Agency (2022).
33. ICRP. Compendium of dose coefficients based on ICRP publication 60. ICRP PUBLICATION 119, annals of the ICRP 41. International Commission on Radiological Protection (ICRP), Elsevier. (2012).
34. USEPA. Risk assessment guidance for superfund. Volume I: Human health evaluation manual (part a). U.S. Environmental Protection Agency Washington, D.C. 20450. (1989).
36. AL-Jumaily, A, and Jabar, KA. Natural radioactivity in food stuff. J Pure Appl Sci. (2005) 18:60–5.
37. Coulibaly, A, Kpeglo, DO, and Darko, EO. Assessment of radiological hazards in some foods products consumed by the Malian population using gamma spectrometry. J Radiat Prot Res. (2023) 48:84–9. doi: 10.14407/jrpr.2022.00178
38. Altıkulaç, A. Analysis of natural radioactivity and determination of potassium content in foods. Fresenius Environmental Bulletin, (2021) 30:7859–7865.
39. Atogo, M. Assessment of radioactivity levels of foodstuffs entering Mombasa port, Kenya. J Energy Power Eng. (2016) 10:708–11. doi: 10.17265/1934-8975/2016.11.008
40. El-Gamal, H, Sidique, E, El-Haddad, M, and Farid, ME-A. Assessment of the natural radioactivity and radiological hazards in granites of Mueilha area (south Eastern Desert, Egypt). Environ Earth Sci. (2018) 77:1–14. doi: 10.1007/s12665-018-7880-x
41. Ilievski, T, Skoko, B, Karanović, G, Grahek, Ž, Košiček, KM, Coha, I, et al. Radioactivity in food crops from the family farms in Croatia with ingestion dose assessment. Food Control. (2025) 167:110805. doi: 10.1016/j.foodcont.2024.110805
42. Bakhmutsky, MV, Joiner, MC, Jones, TB, and Tucker, JD. Differences in cytogenetic sensitivity to ionizing radiation in newborns and adults. Radiat Res. (2014) 181:605–16. doi: 10.1667/RR13598.1
43. Kutanzi, KR, Lumen, A, Koturbash, I, and Miousse, IR. Pediatric exposures to ionizing radiation: carcinogenic considerations. Int J Environ Res Public Health. (2016) 13:1057. doi: 10.3390/ijerph13111057
Keywords: activity level, effective dose, chronic daily intake, sugar, gamma spectrometry, South Africa, cancer risk
Citation: John SOO, Olukotun SF, Radebe MM and Mathuthu M (2025) Radiological safety assessment of sugar consumption in South Africa—a study of 226Ra, 228Ra, and 40K levels. Front. Public Health. 13:1534383. doi: 10.3389/fpubh.2025.1534383
Edited by:
Mukesh Prasad, Swami Rama Himalayan University, IndiaReviewed by:
Miklós Hegedűs, University of Pannonia, HungaryShams A. M. Issa, Al-Azhar University, Egypt
Copyright © 2025 John, Olukotun, Radebe and Mathuthu. This is an open-access article distributed under the terms of the Creative Commons Attribution License (CC BY). The use, distribution or reproduction in other forums is permitted, provided the original author(s) and the copyright owner(s) are credited and that the original publication in this journal is cited, in accordance with accepted academic practice. No use, distribution or reproduction is permitted which does not comply with these terms.
*Correspondence: Samuel Odumu Ogana John, c2Ftam9oMjAxNEBnbWFpbC5jb20=