 Jufang Song
 Yongxuan Qiao
- School of Urban Design, Wuhan University, Wuhan, China
Background: Rapid urbanization has led to a series of “urban diseases” that have garnered significant social attention. Among these, the urban heat island effect has emerged as one of the most pronounced environmental concerns, presenting formidable challenges for urban planning in terms of sustainable development and environmental livability. In this process, the construction of urban parks is particularly susceptible to discrepancies between supply and demand.
Methods: In this study, urban parks with an area of more than 3hm2 in the main urban area of Wuhan were selected as research objects. Utilizing remote sensing data and urban vector data, this study applied kernel density analysis and Thiessen polygons development to assess the supply capacity of parks’ cold islands from a supply perspective, and the residents’ cold island demand level index from a demand perspective.
Results: The findings revealed that ① The spatial distribution of cold island supply and demand exhibited significant heterogeneity. High-supply units were strongly correlated with water body distribution, while high-demand units aligned closely with population density and POI density centers, displaying a “scattered overall, locally concentrated” pattern. ② A significant supply–demand mismatch in cold island effects was observed, with 19 units (accounting for approximately 40%) exhibiting insufficient supply relative to demand. These units were predominantly concentrated in areas with complex building environments, high population density, low vegetation coverage, and poor landscape connectivity.
Discussion and conclusions: Drawing on these results, the study established an interplay between supply and demand perspectives by applying the theory of locational entropy and proposed optimization strategy for urban parks in Wuhan, aiming to achieve “a match between supply and demand in cold islands” across varying equilibrium stages of the research units. Specific measures include: optimizing the scale and layout of existing parks, reserving green spaces for ecological restoration, strengthening the protection of blue-green ecological foundations, and establishing a blue-green cold island corridor network to enhance ecological connectivity. Our work extends the understanding of the cold island effect of urban parks, assisting urban planners in proposing more targeted and effective management strategy and measures to improve the urban thermal environment, thereby contributing to the creation of healthy, equitable, and sustainable cities.
1 Introduction
In recent years, the global climate has exhibited significant fluctuations, leading to a rise in the frequency of extreme weather events, thereby posing formidable challenges to urban development and human survival. Of particular concern is the urban heat island problem, which has garnered widespread attention due to its strain on various aspects of the urban system, including urban construction space, urban ecology, and urban energy supply (1, 2). Meanwhile, the emergence of the urban heat island effect, characterized by elevated summer temperatures, has been found to be linked to increased greenhouse gas emissions, exacerbation of air pollution, and adverse effects on public health and living comfort (3, 4), which warn against sustainable urban development. As an essential part of the urban system, urban parks exhibit a noticeable cold island effect (5, 6). They play an essential role in maintaining ecosystems (7) and safeguarding residents’ physical and mental health by providing quality landscapes and activity spaces (8).
Extensive studies on the urban parks’ cold island effect home and abroad can be summarized as follows: ① Research on influencing factors from the perspective of cold island supply: Numerous studies have demonstrated that the cooling effects of parks are closely associated with their area and shape (9–11). Generally, larger parks with more compact shapes exhibit superior cooling effect. Additionally, the internal landscape composition of parks, including water bodies, green vegetation, etc., has been widely recognized as critical factors influencing cooling performance. Kong et al. highlighted that vegetation coverage is a primary factor affecting the intensity and distribution of cold islands, showing a significant positive correlation (12). However, Xie et al. found that water bodies contribute most significantly to the park cold island effect, while vegetation coverage shows no significant correlation with the average land surface temperature within parks (13). In cases where water body coverage is high, the cooling effect of vegetation may be attenuated due to the interactive influences of multiple variables on the cold island effect. Furthermore, the internal green space structure of parks also plays a role in mitigating the urban heat island effect, albeit with variations (14). Chen et al. suggested that tree-shrub-grass communities exhibit the most effective cooling performance (15), whereas Zhang et al. experimentally demonstrated that tree-grass-dominated green spaces achieve the greatest temperature reduction (16). These differences may stem from variations in vegetation types and their spatial configurations. However, the cooling effects of parks are not only influenced by their internal landscape features but also by surrounding environmental conditions such as impervious surfaces, building morphology, and composition (e.g., building density (BD) and building height (BH)) (17–19). Additionally, the cooling effects of urban parks are closely associated with the spatial aggregation of green spaces and resident visitation patterns. Research indicates that the intensity of the park cold island effect is significantly positively correlated with the average proximity of green spaces, i.e., the more concentrated the distribution of green spaces, the stronger the intensity of the cold islands (20). Simultaneously, the cooling effects are inversely proportional to the frequency and distance of park visits by residents (21). ② Research on residents’ physical and mental health from the perspective of cold island demand: Living close to recreation-friendly urban parks is conducive to improving residents’ physical fitness and self-rated health (22). Residents’ frequent use of parks can effectively reduce their risk of cardiovascular disease (23). Additionally, the park’s vegetation environment has a positive impact on people’s emotional recovery (24). Above all, existing research only discusses the influencing factors of the cold island effect in urban parks or explores the positive benefits on people’s physical and mental health. However, there are very few studies on alleviating the heat island effect from the perspective of urban cold and heat island supply–demand equilibrium. There is also a lack of research on park planning in spatial decision-making that considers human needs and insufficient comprehensive quantitative research on the integration of “demand subjects” (residents) and “supply subjects” (urban parks). This deficiency makes it challenging to formulate comprehensive solutions to address urban heat environment issues.
The relationship between supply and demand generally refers to the dynamic and relative relationship between production and consumption in the commodity market economy. Correspondingly, at the level of urban park systems, it denotes the equilibrium pursued between the cold island supply capacity of urban parks and the targeted needs of residents for living and production. In the context of high-quality development and the awakening of national health awareness, it is of significant theoretical and practical importance to quantitatively analyze the cool island effect of urban parks from the perspective of supply and demand in order to plan and utilize it reasonably to maximize its ecological service functions. This is crucial for mitigating the urban heat environment and promoting the construction of ecologically livable cities (25).
As a prototypical “furnace city,” Wuhan has faced increasingly prominent thermal environment problem issues in recent years due to the city’s rapid expansion and the sharp growth of its population. Therefore, this study focuses on the main urban area of Wuhan, where the urban heat island (UHI) effect is most pronounced. By integrating multi-source data and establishing a dual-perspective evaluation system from both supply and demand sides, the research aims to ① reveal the spatial distribution characteristics and patterns of the urban parks’ cold island effect from both supply and demand perspectives; ② analyze the degree of supply–demand matching for the cold islands of the urban parks and their spatial differentiation patterns; ③ propose targeted park planning optimization strategies based on the supply–demand matching results, providing scientific and reasonable suggestions to the construction sequence and optimization emphasis of the urban parks in a point-to-point way.
2 Materials and methods
2.1 Description of the study area
Situated in the eastern part of the Jianghan Plain, Wuhan (29°58′ ~ 31°22′N, 113°41′ ~ 115°05′E) is at the confluence of the Yangtze River and Han River. It serves as the capital city of Hubei Province and the core city of the city cluster in the middle reaches of the Yangtze River. The city covers an area of 8,494 km2 and includes 13 municipal districts, among which Jiang’an District, Jianghan District, Qiaokou District, Hanyang District, Wuchang District, Hongshan District, and Qingshan District are the main urban areas, with an area of 678km2. Characterized by a subtropical monsoon climate, Wuhan experiences an annual average temperature ranging from 15.8 to 17.5°C, with summer extreme temperatures reaching up to 41.3°C (26), creating significant thermal environment challenges. This paper selected 60 urban parks with an area of more than 3hm2 in the above-mentioned seven main urban areas as the research objects to conduct the supply and demand evaluation of the urban parks’ cold island effect in the main urban area of Wuhan (Figure 1).
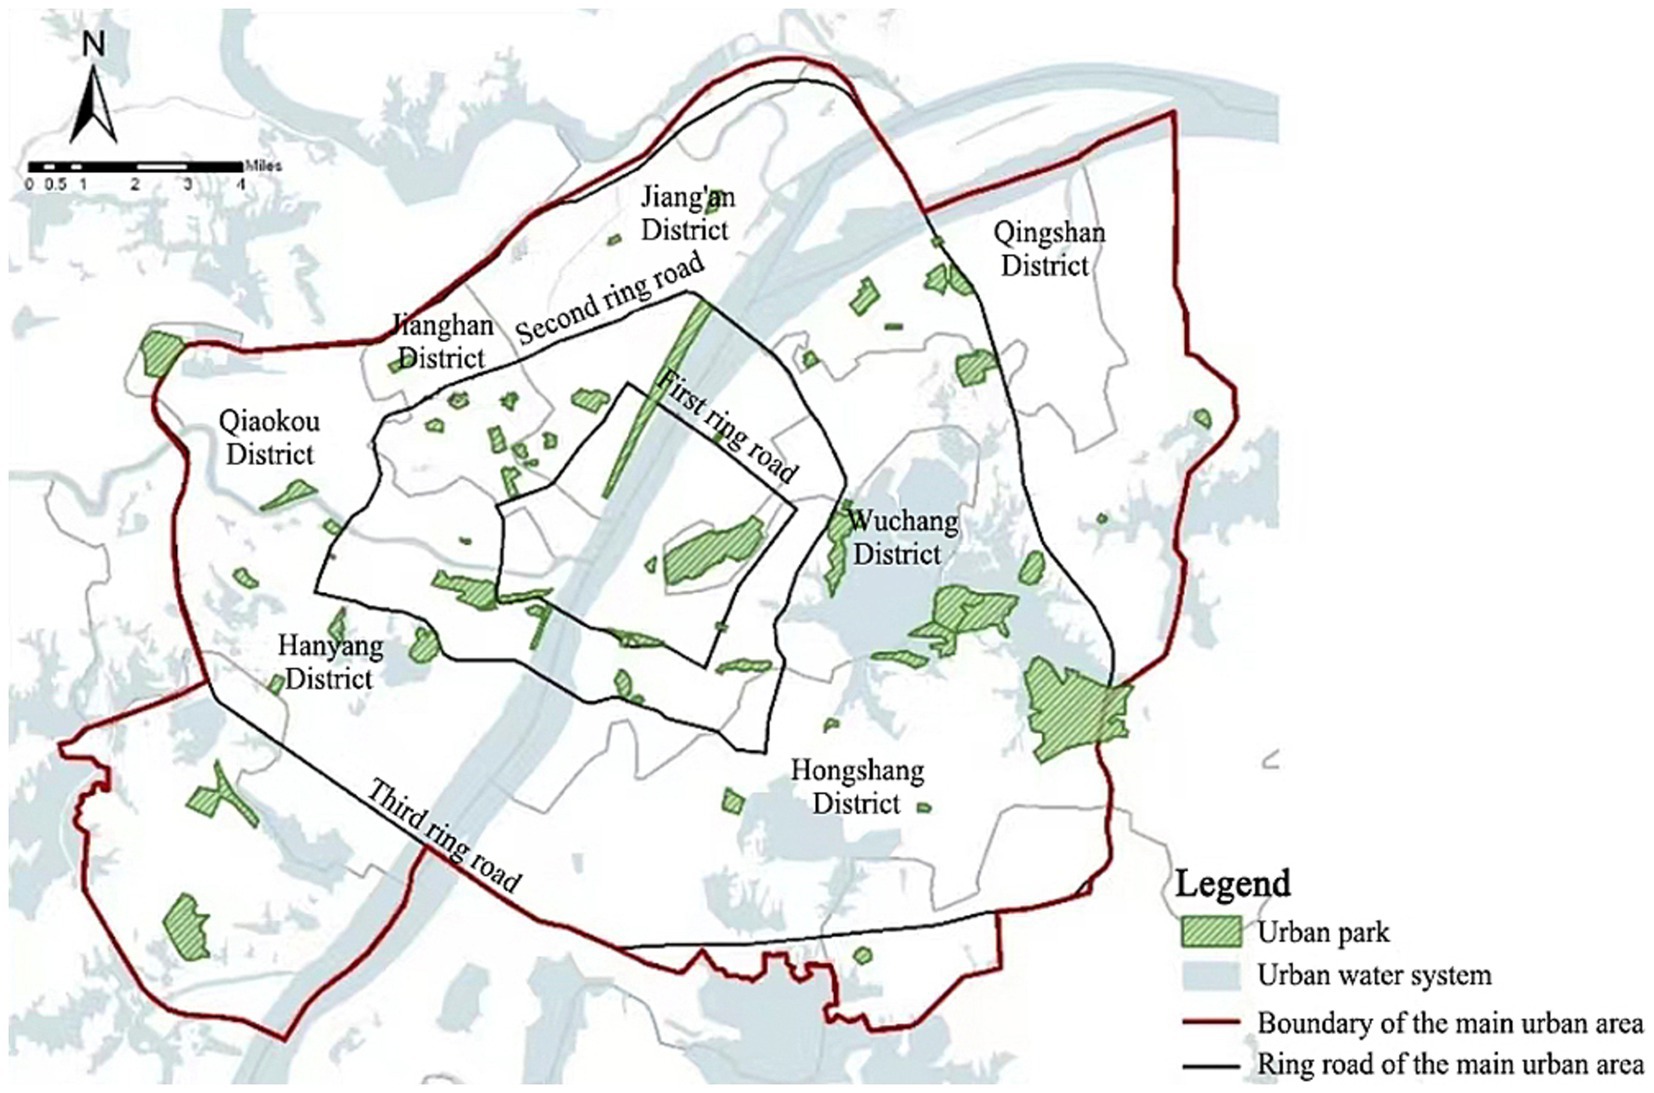
Figure 1. Distribution of the urban parks with an area of more than 3hm2 in the main urban area of Wuhan.
2.2 Data sources and processing
The remote sensing data source in this paper is the Landsat 8 satellite image on 29 July 2018 with orbit number 123/39, obtained from the official website of the United States Geological Survey (USGS).1 The reasons for choosing this image are as follows: ① On this day, the maximum temperature reached 37°C, significantly intensifying the urban heat island effect and increasing residents’ demand for the cooling effects of urban parks. This provides a clearer reflection of the supply–demand relationship of urban parks’ cold island effects, particularly in identifying areas with supply–demand imbalances. ② The Landsat image for this day was cloud-free and of high quality, ensuring reliable analysis of land surface temperature and other parameters. ③ Studies show that under breezy conditions with little prior precipitation, air and land surface temperatures correlate more closely. Wuhan had no rainfall for 10 consecutive days prior to July 29, 2018, with a wind speed of force 2 (breezy) recorded on that day, further validating the suitability of this date for reliable thermal analysis.
The image data were processed through the remote sensing image processing software platform ENVI and the GIS (Geographic Information System) software platform ArcGIS 10.3. The urban vector data included the road network data of the main urban area of Wuhan,2 POI (Points of Interest) data,3 Chinese population spatial distribution raster data,4 and urban park data obtained from information released by Wuhan Municipal Landscape Gardens and Forestry Bureau, and 2018 Wuhan Statistical Yearbook and corresponding socio-economic statistics and so on.
2.3 Analytical workflow
Figure 2 illustrates the operational process of the model for evaluating the cold island effect of the urban parks from the perspective of supply and demand:① define the objectives and targets of the planning; ② conduct a comprehensive assessment of the current situation and problems by taking into account the resource base and regional status of the parks; ③ develop an index system from both the supply and demand perspectives; ④ formulate the evaluation process to presuppose the relationship between supply and demand; ⑤ determine optimization strategies for different supply–demand patterns; ⑥ plan for implementation and recycle this route for the next planning stage.
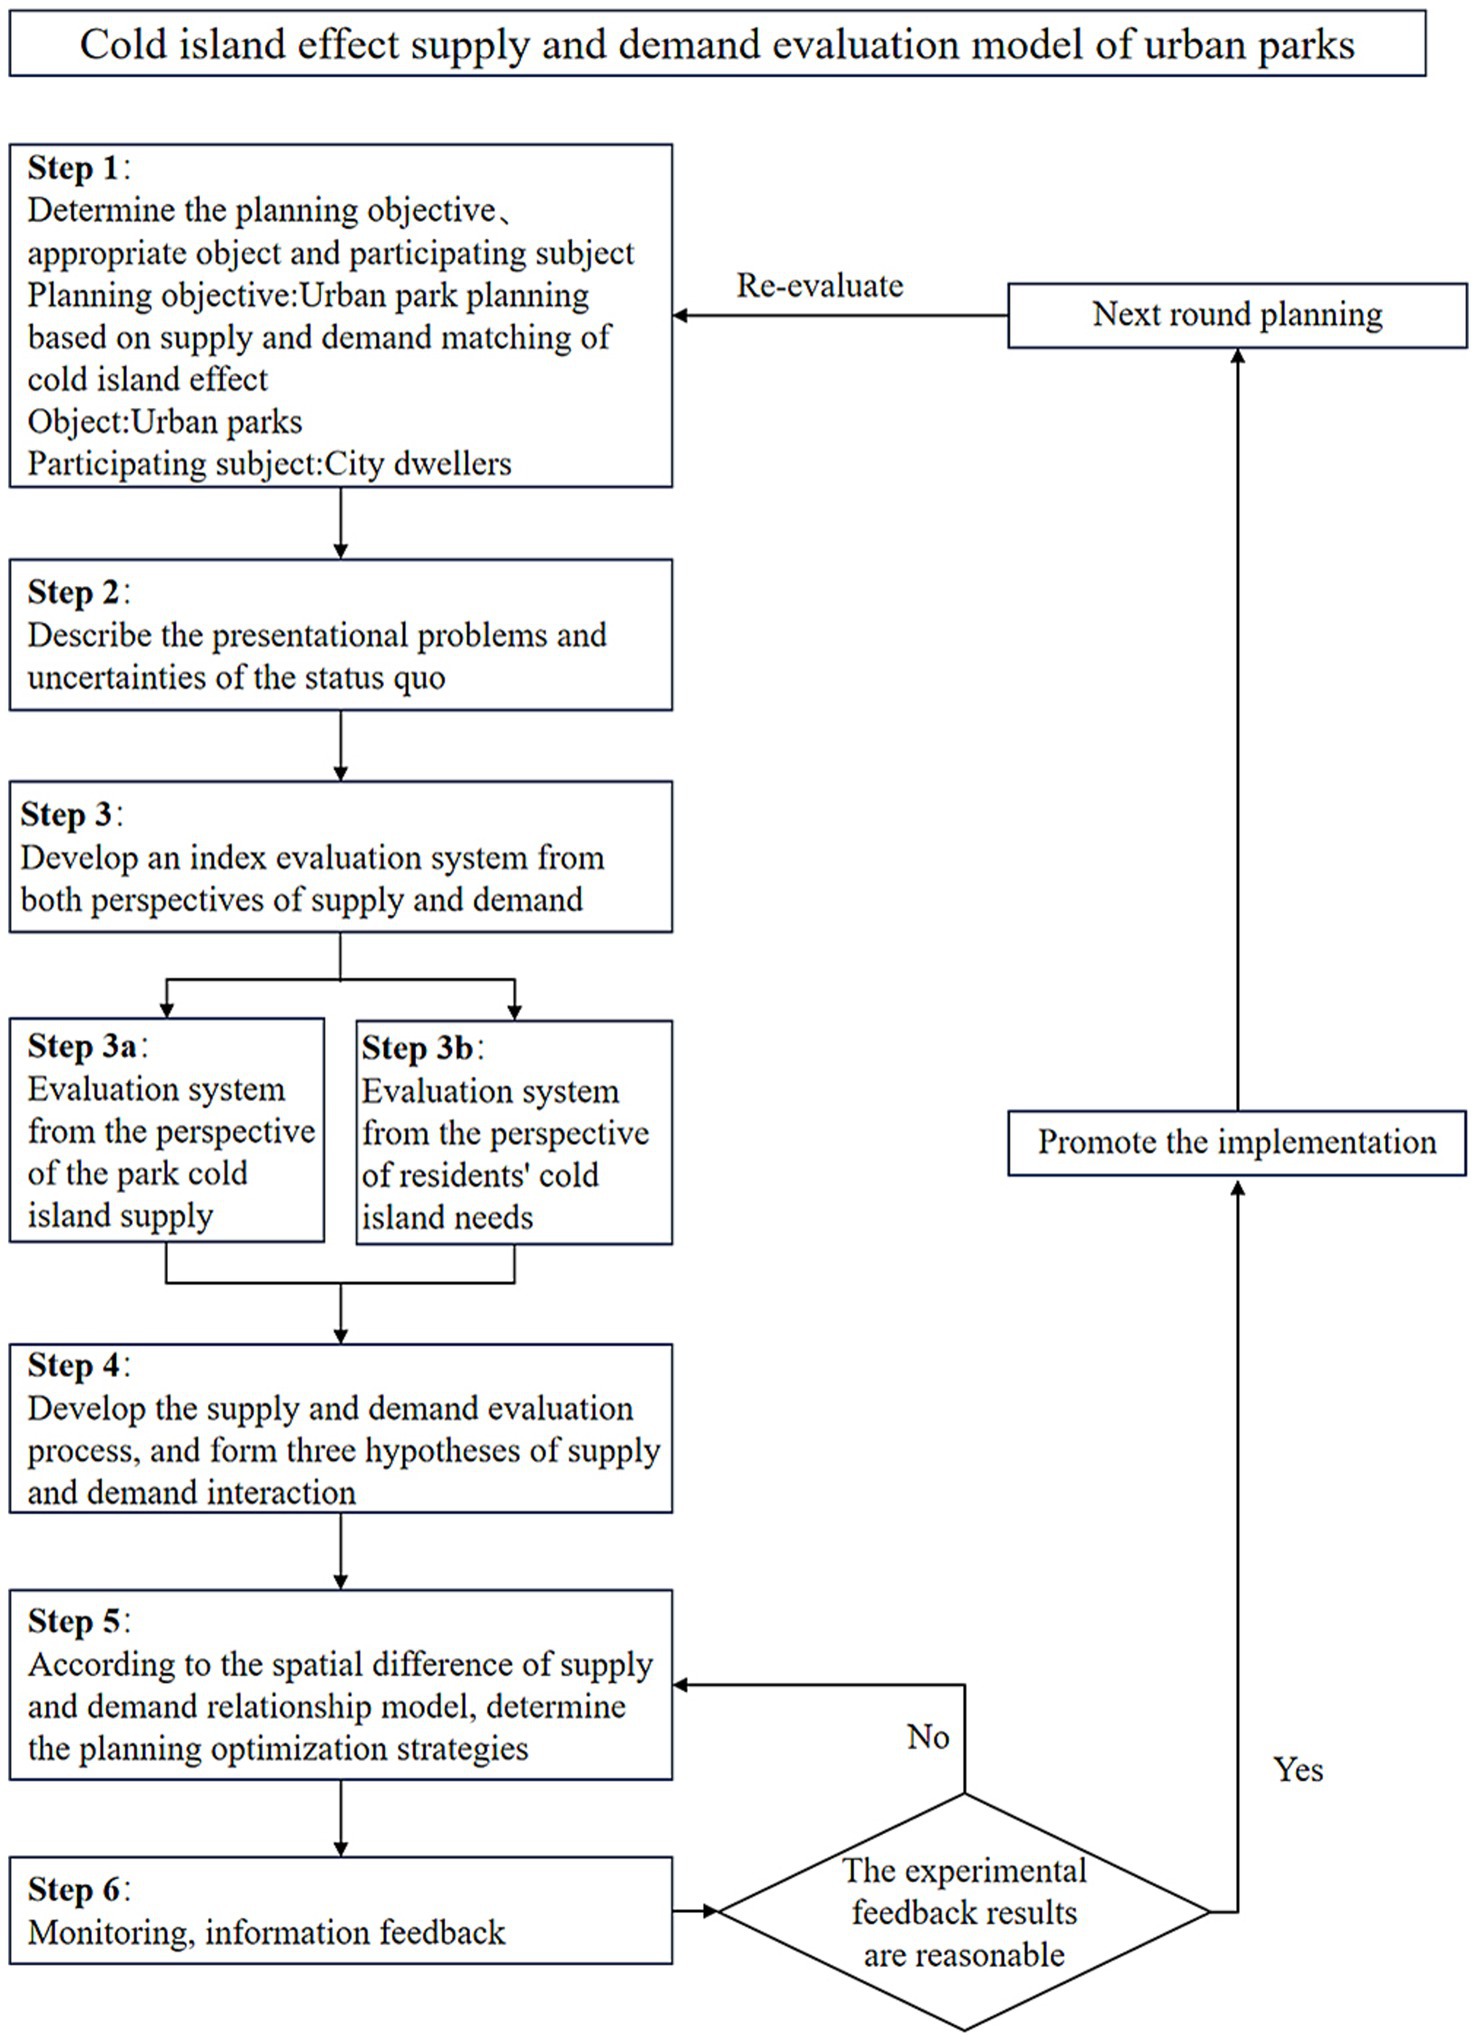
Figure 2. Logic diagram of the supply and demand evaluation model of the urban parks’ cold island effect.
2.4 Delineation of park service units
Traditional cold island effect measurements often rely on buffer analysis, but this method has two main limitations: first, it requires predefined buffer distances, leading to subjective results; second, it struggles to accurately reflect spatial competition between parks, particularly in complex urban environments with irregular park distributions. In contrast, Thiessen polygons automatically assign available space to the nearest point element based on spatial distance, without predefined parameters. It not only removes subjectivity but also more objectively reflects spatial competition between elements. Therefore, this study divided the city into several park cold island service areas centered on urban parks by constructing Thiessen polygons. Using these service areas as spatial units, the supply and demand of the urban parks’ cold island effect were evaluated and identified. Since the city park is a polygon element, the procedure involves several steps (Figure 3). The first step is to use the “Feature Vertices to Points” tool to convert the vertices of the polygon elements into point elements. Subsequently, the “Create Thiessen Polygons” tool is utilized, followed by the “Dissolve” tool to merge the Thiessen polygons with common fields, thereby accomplishing the creation of Thiessen polygons for polygon elements.
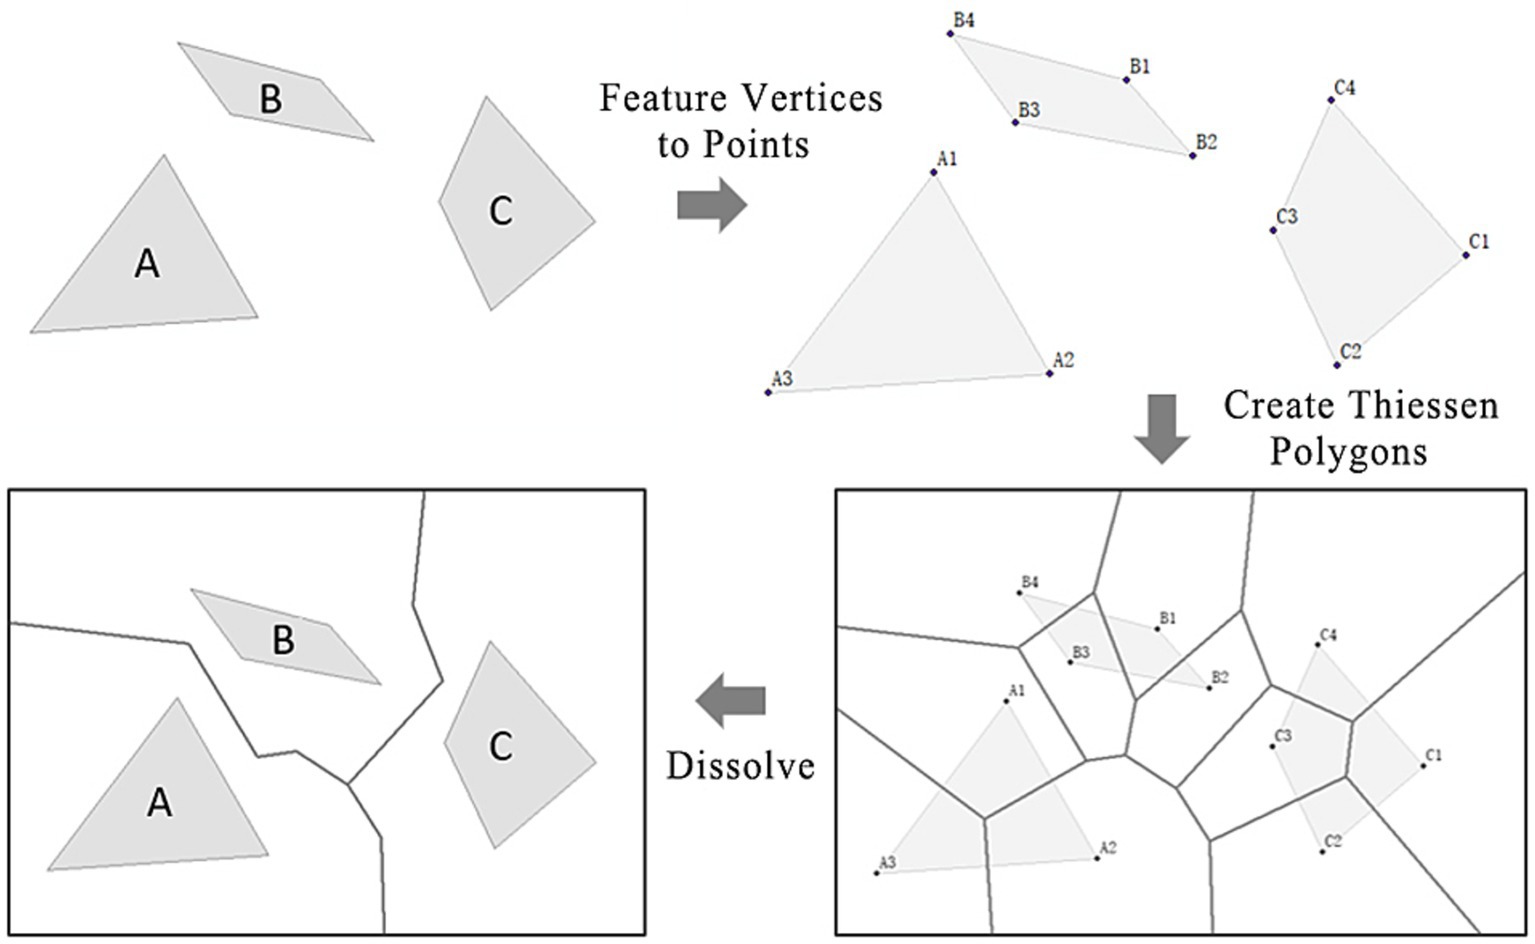
Figure 3. Process of generating Thiessen polygons from polygon elements.
However, the urban spatial texture is complicated, thus lacking correspondence with the urban space in actual urban research. Hence, when delineating the park service units, the Thiessen polygons of geometrical significance was combined with the regulatory planning units taking into account the spatial fabric of the city to enhance the accuracy of research.
2.5 Evaluation model for park cold island supply
2.5.1 Evaluation index system construction from the supply perspective
The park cold island evaluation index system from the supply perspective mainly focuses on: ecological supply and social supply (Table 1). Among them, the core carrier of ecological supply is blue-green spaces, which refer to a spatial system composed of various types of water bodies, wetlands, green spaces, and other open areas (27, 28). As an essential component of urban ecosystems, blue-green spaces not only provide critical ecological services to urban residents but also significantly reduce local temperatures and create cold island effects through mechanisms such as evapotranspiration, shading effects, and water body cooling (29–31). These mechanisms play a key role in regulating urban climate and mitigating thermal environments (28). Based on this, this study focuses on three types of blue-green spaces with significant cold island effects: the park itself, vegetation, and water bodies (32, 33). Their scale and quality are crucial indicators for measuring the supply capacity of park cold islands (34, 35). Social supply can be further subdivided into access methods and per capita availability. There are two ways in which the cold island effect of urban parks is transmitted to the users, one is directly through the air, and the other requires the users to arrive within the radiation range of the park’s cold island. Given the limited spatial extent of urban parks, the per capita park area accessible to residents within its service range and the park’s accessibility have become significant factors that cannot be ignored when evaluating the supply capacity of the cool island effect (36).

Table 1. Evaluation index system of the park cold island effect from the supply perspective.
2.5.2 Calculation of evaluation indicators from the supply perspective
2.5.2.1 Fractional vegetation cover
The downloaded Landsat 8 series images were loaded into ENVI (The Environment for Visualizing Images) for initial processing, including radiometric calibration, FLAASH atmospheric correction, image fusion, stitching, and cropping. The fractional vegetation cover (FVC) of the study area was calculated using the pixel dichotomy model. This model assumes that each pixel’s surface consists of two components: vegetated and non-vegetated areas. The FVC value for a pixel is defined as the proportion of its area covered by vegetation. The formula is as follows:
In Equation 1, represents the NDVI value of bare soil pixels, and represents the NDVI value of pure vegetation pixels. The upper and lower thresholds of NDVI were selected at a 5% confidence level, and the NDVI values within the threshold range were averaged to obtain and .
2.5.2.2 Accessibility
The two-step floating catchment area method (2SFCA) was applied to calculate the accessibility within the study area, with city parks as the supply side and residents of residential quarters as the demand side. The traditional 2SFCA ignores the importance of distance --the urban parks’ cold island supply capacity weakens as users move further away from them (37). Consequently, a Gaussian function is introduced as the distance attenuation function for 2SFCA. The Gaussian two-step floating catchment area approach (Ga2SFCA) incorporates distance as a factor in its reachability calculation, hence enhancing the realism of the results (38). The search radius calculated in this study based on the 15-min living circle definition of accessibility was 1 km. The formulas are as follows:
In Equation 2, is the per capita park size (m2/person) for the potential demanders within the search range of the urban park; i is the residential quarters within the search radius ; j is the city park; m is the number of the residential quarters within the search distance ; is the number of the inhabitants in the residential quarter i (person); is the distance between the centroid of the residential quarter i and the boundary of the city park j; is the size of the park j (m2).
Equation 3 is the distance decay function – the Gaussian function.
In Equation 4, is the accessibility of the residential quarter i (m2/person); n is the number of the urban parks j within the search radius ; is the per capita park size of the demander within as required by Equation 2.
2.5.2.3 Per capita park size
The number of people in demand within the park service unit is filled, i.e., the number of people living within the park’s service area is summed up and used as the basis for calculating the per capita area of the corresponding park, to measure the per capita provisioning capacity allocated to the park in the spatial layout planning process. The formula for this calculation is as follows:
In Equation 5, k is the urban park service unit k; is the per capita park size within the park service unit k; j is the urban park within the service unit k; is the size of the park j (m2); t is the residential quarter within the park service unit k; e is the total number of the residential quarters within the park service unit k; and is the number of the inhabitants in the residential quarter t (person).
2.5.3 Park cold island supply index calculation
The comprehensive cold island supply index was determined based on six key factors: the dominant park area within the service unit (parkS), vegetation cover within the park (FVC), water area (wS), per capita park size within the service unit (perS), accessibility (A) and each index’s weight calculated using the subjective-objective composite weighting method. To enhance the accuracy of the weighting process, this study employed a combined weighting method that integrates the subjective Analytic Hierarchy Process (AHP) and the objective entropy weight method, thereby addressing the limitations of relying on a single weighting approach. Specifically, the AHP method was used to calculate subjective weights, while the entropy weight method was applied to determine objective weights. The final combined weights were derived based on the principle of minimum information entropy (39). Based on the weights and scores of the five indicators (Table 2), the park cold island supply index was obtained by weighted summation in Arcgis10.3 using the raster calculation tool. The calculation formulas are as follows:
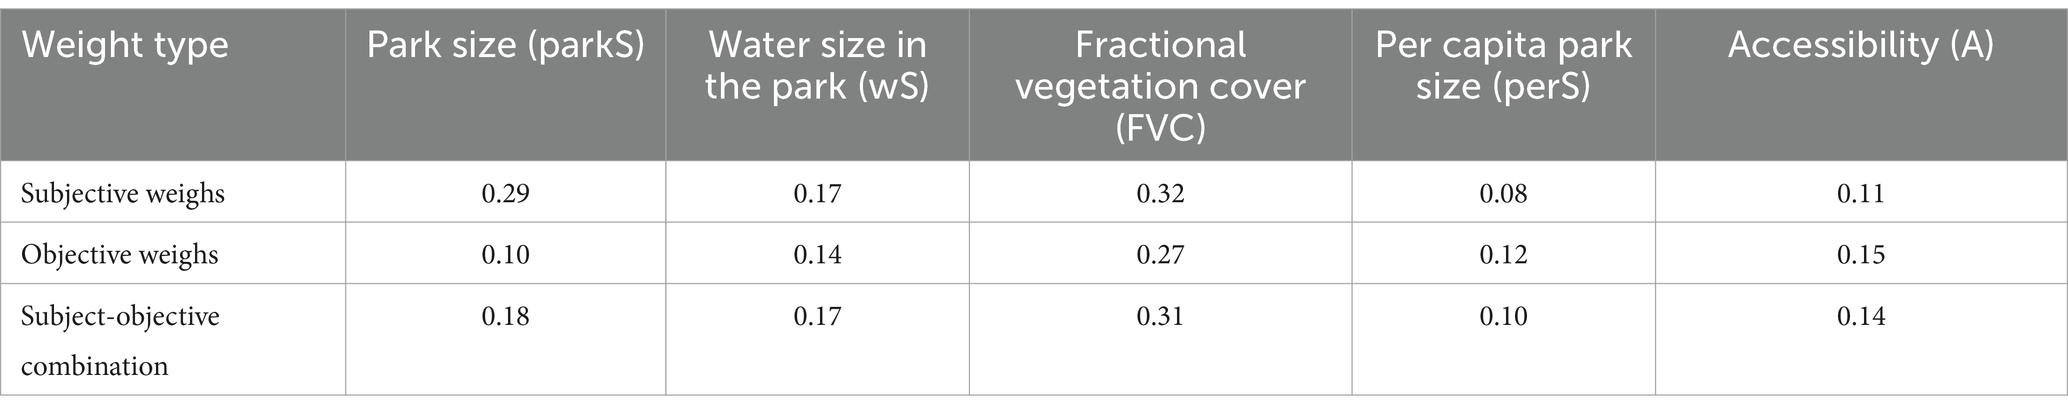
Table 2. Combined subjective and objective weighs from the supply perspective.
In Equations 6 and 7, is the comprehensive weight of the nth supply indicator, denotes its subjective weight, and signifies its objective weight; SIk is the park cold island supply index of the unit k, and there are 48 park service units, numbered from 1 to 48; is the nth park cold island supply capacity index; n is a natural number from 1 to 5.
2.6 Evaluation model for residents’ cold island demand
2.6.1 Construction of evaluation index system from the demand perspective
The construction of the park cold island evaluation index system (Table 3) from the demand perspective is based on the multi-level needs of urban residents, specifically including the following two aspects: ① At the physiological demand level, the focus lies on residents’ physiological health conditions and their correlation with the thermal environment. With the frequent occurrence of global high-temperature weather, urban residents face an increased risk of heat-related illnesses, cardiovascular and cerebrovascular diseases, respiratory diseases, and other health hazards (40, 41). Research has demonstrated that land surface temperature (LST) directly influences human thermal comfort and serves as a critical indicator of the urban thermal environment (42), while the spatial extent of heat island patches identifies the scale of impacted areas and pinpoints regions requiring targeted mitigation efforts (43). Therefore, land surface temperature and heat island patch size have been selected as key indicators to intuitively reveal the presence and distribution of thermal environmental risks. The higher the thermal environmental risk, the more urgent residents’ demand for park cold islands becomes. ② The psychological needs dimension focuses both on the potential impact of the hot environment on residents’ mental health and on the environmental justice issues. Studies have shown that prolonged exposure to hot environments may lead to psychological stress (44) and negative emotions among residents, which in turn reduces their life satisfaction (45). At the same time, it is emphasized that every individual should enjoy equal access to high-quality park cold island services (46, 47). The essence of spatial equity in urban parks lies in the rational allocation of space, and although the total amount of park cold island services is determined by the supply side, the quality of cold island services available per capita is influenced by the number of demanders on the demand side. For this reason, population density and POI density are introduced as key indicators for assessing exposure. Among them, the density of resident population reflects the local static demand dominated by the residential function (48); while POI (Points of Interest), as an important characterization of the functional nodes of the city, the degree of aggregation directly reflects the intensity of human activities, i.e., the nonlocal dynamic demand (49, 50).
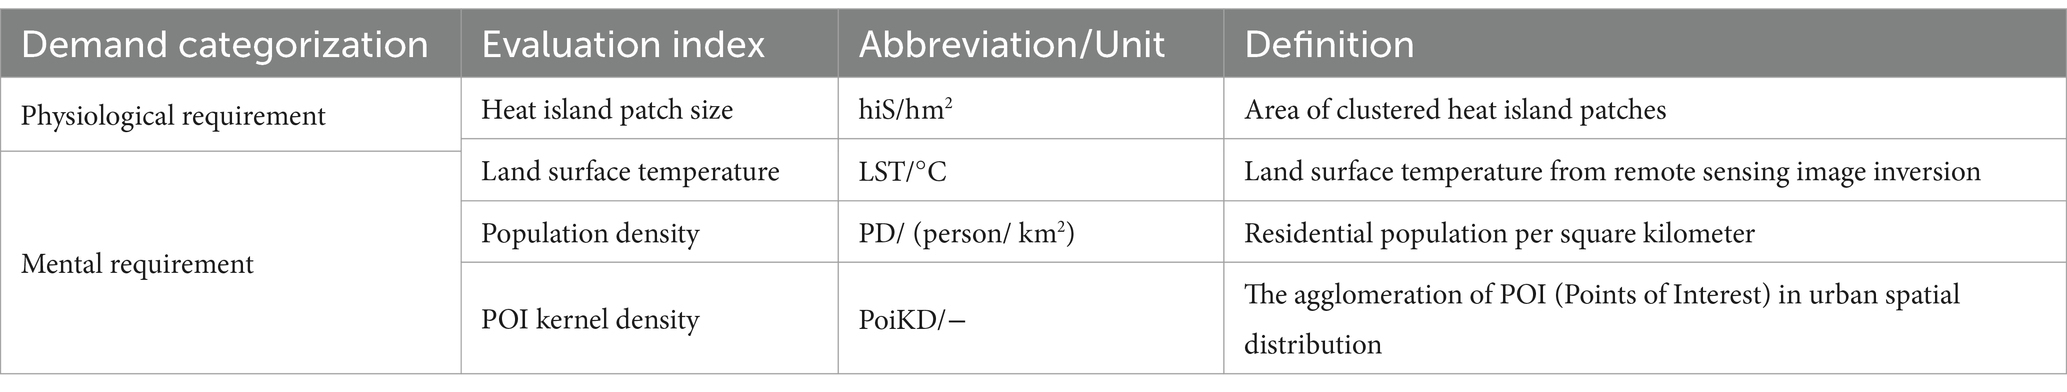
Table 3. Evaluation index system of the park cold island effect from the demand perspective.
2.6.2 Calculation of evaluation indicators from the demand perspective
2.6.2.1 Population density
Regions with high population density suggest a more extensive and intensive number of users, implying a higher demand for cold islands. Through the population raster data obtained from WorldPop, the population density distribution of the computational units within the study area was acquired with the following formula.
In Equation 8, k is the urban park service unit k; is the per capita park size of the park service unit k; is the size of the park service unit k (km2); and is the total number of people living in the service unit k (person).
2.6.2.2 POI kernel density
The kernel density of POI (Points of Interest) can characterize urban social activity levels. Regions with high POI kernel density suggest that residents engage in social activities more frequently and actively there, implying a higher demand index. Initially, the captured POI data underwent a cleaning and filtering process. Subsequently, the data coordinates were characterized as the GCS_WGS_1984 coordinate system and projected for the subsequent calculation and analysis. Then, the “Kernel Density” tool within the ArcGIS software was employed to calculate the kernel density of points of interest. The calculation of the kernel density of points in space is given in Equation 9:
In Equation 9, n is the number of point samples; R is the radius of the search window; is the kernel function.
2.6.2.3 Land surface temperature
Evidently, LST (Land Surface Temperature) is an essential index in the study of urban heat island effect. Especially with the gradual application of remote sensing data, various algorithms, including split-window, single-channel, and single-window algorithms, have become the most commonly used LST retrieval algorithms (51). Compared with the traditional radiative transfer equation, the single-channel algorithm has several benefits including a straightforward model, enhanced computational efficiency, and fewer required parameters. Hence, this paper chose the single-channel algorithm to calculate the land surface temperature using the following equations, ultimately yielding the land surface temperature (LST) raster image:
In Equations 10–12, is the land surface emissivity; is the atmospheric transmittance and can be queried on the NASA official website for the corresponding region; and can be calculated.
2.6.2.4 Heat island patch size
The mean-standard deviation method was applied to classify the surface temperature obtained from the inversion (Table 4). Then, the heat island patches were extracted and subsequently quantified in terms of their respective actual sizes with the following formula. Due to the difference in patch sizes and the discontinuous nature of these values, the assignment of values for the real size of heat island patches was conducted to ensure the validity of data calculations. The specific assignment criteria are shown in Table 5.

Table 4. Classification of the land surface temperature.

Table 5. Criteria for assigning heat island patch size.
In Equation 13, is the heat island patch score for the park service unit k; k is the urban park service unit k; h is the heat island patch within the service unit k; is the size-assigned score for the heat island patch h; and a is the total number of the heat island patches within the service unit k.
2.6.3 Residential cold island demand index calculation
Following the same method as described in section 2.5.3, the park cool island demand index was calculated using the following formula, based on the weights and scores of the four demand indicators (Table 6).
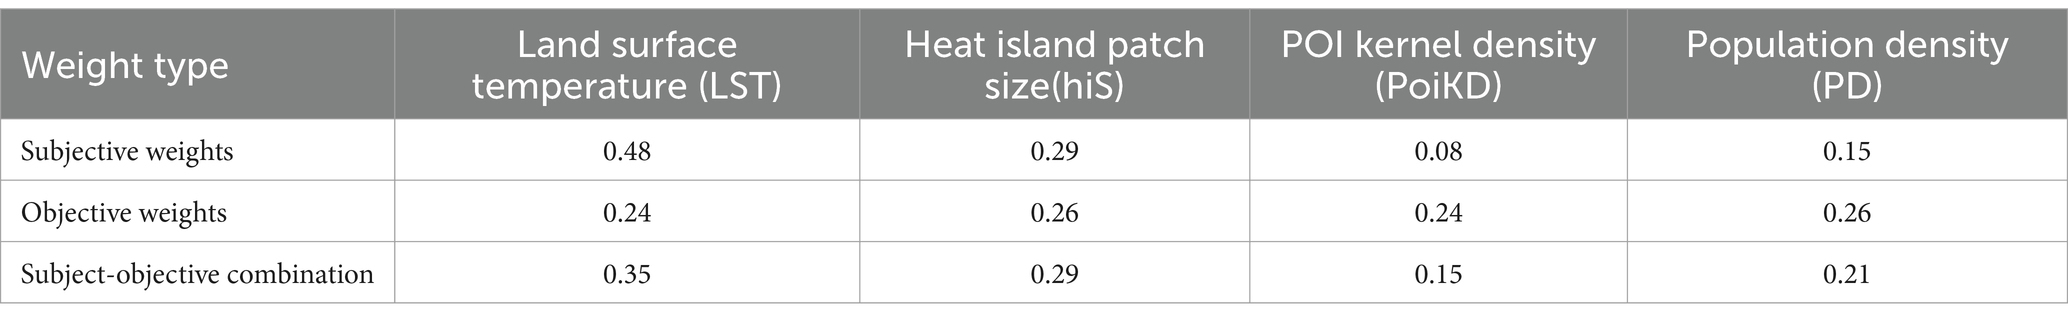
Table 6. Combined subjective and objective weighs from the demand perspective.
In Equations 14 and 15, is the comprehensive weight of the nth demand indicator, denotes its subjective weight, and signifies its objective weight; is the residential cold island demand index of the unit k, and there are 48 park service units, numbered from 1 to 48; is the nth residential cold island demand index; n is a natural number from 1 to 4.
2.7 Identification and evaluation of supply and demand balance relationship of cold islands in urban parks
The interaction between supply and demand perspectives means the superposition, differentiation, and comparison of supply capacity and demand targets in the regional space. To achieve this, this paper introduces the location entropy used to measure and evaluate the state of spatial distribution characteristics of factors within a given region, as a path to establish the relationship:
In Equation 16, is the park cold island supply index for the region k, is the residents’ cold island demand index for the region k, is the average supply index for the cold island effect within the study area, and is the average demand index for the cold island effect within the study area.
The values of are discussed in terms of mean-standard deviation (A is the mean value of in the study area, while sd is the standard deviation of ), from which three kinds of relative relationships between supply and demand can be obtained:
If the value of is less than A-0.5sd, it indicates an unsatisfied demand in the region, implying that the supply is insufficient compared to the demand. Conversely, if exceeds A + 0.5sd, it suggests a relatively sufficient supply in the region, indicating that the supply exceeds the demand. In the case where falls within the range of A-0.5sd to A + 0.5sd, it signifies the supply and demand capacity ratio of the cold island effect in the region is within a specific range, meaning a state of “relative balance.”
3 Results
3.1 Delineation of park service units
According to the method of 2.4, the 60 urban parks in the main urban area of Wuhan got 48 park service units. The spatial distribution map of these park service units (Figure 4) reveals that the size of service units gradually increases from the core of the study area (within the first ring road) to its outskirts (the third ring road). The urban parks in the central area along the riverbanks were mostly embedded in the urban space in the way of “small areas with multiple dots,” resulting in smaller overall service units. In the suburbs, larger patches of parkland existed, yet there were also instances where the area of the service unit was large despite the dominant urban park within it being very small, such as in the Guanshan Unit, South Lake Unit, Yunhu Unit, and Houhu Unit. The information for park service units can be queried from Supplementary Table 1.
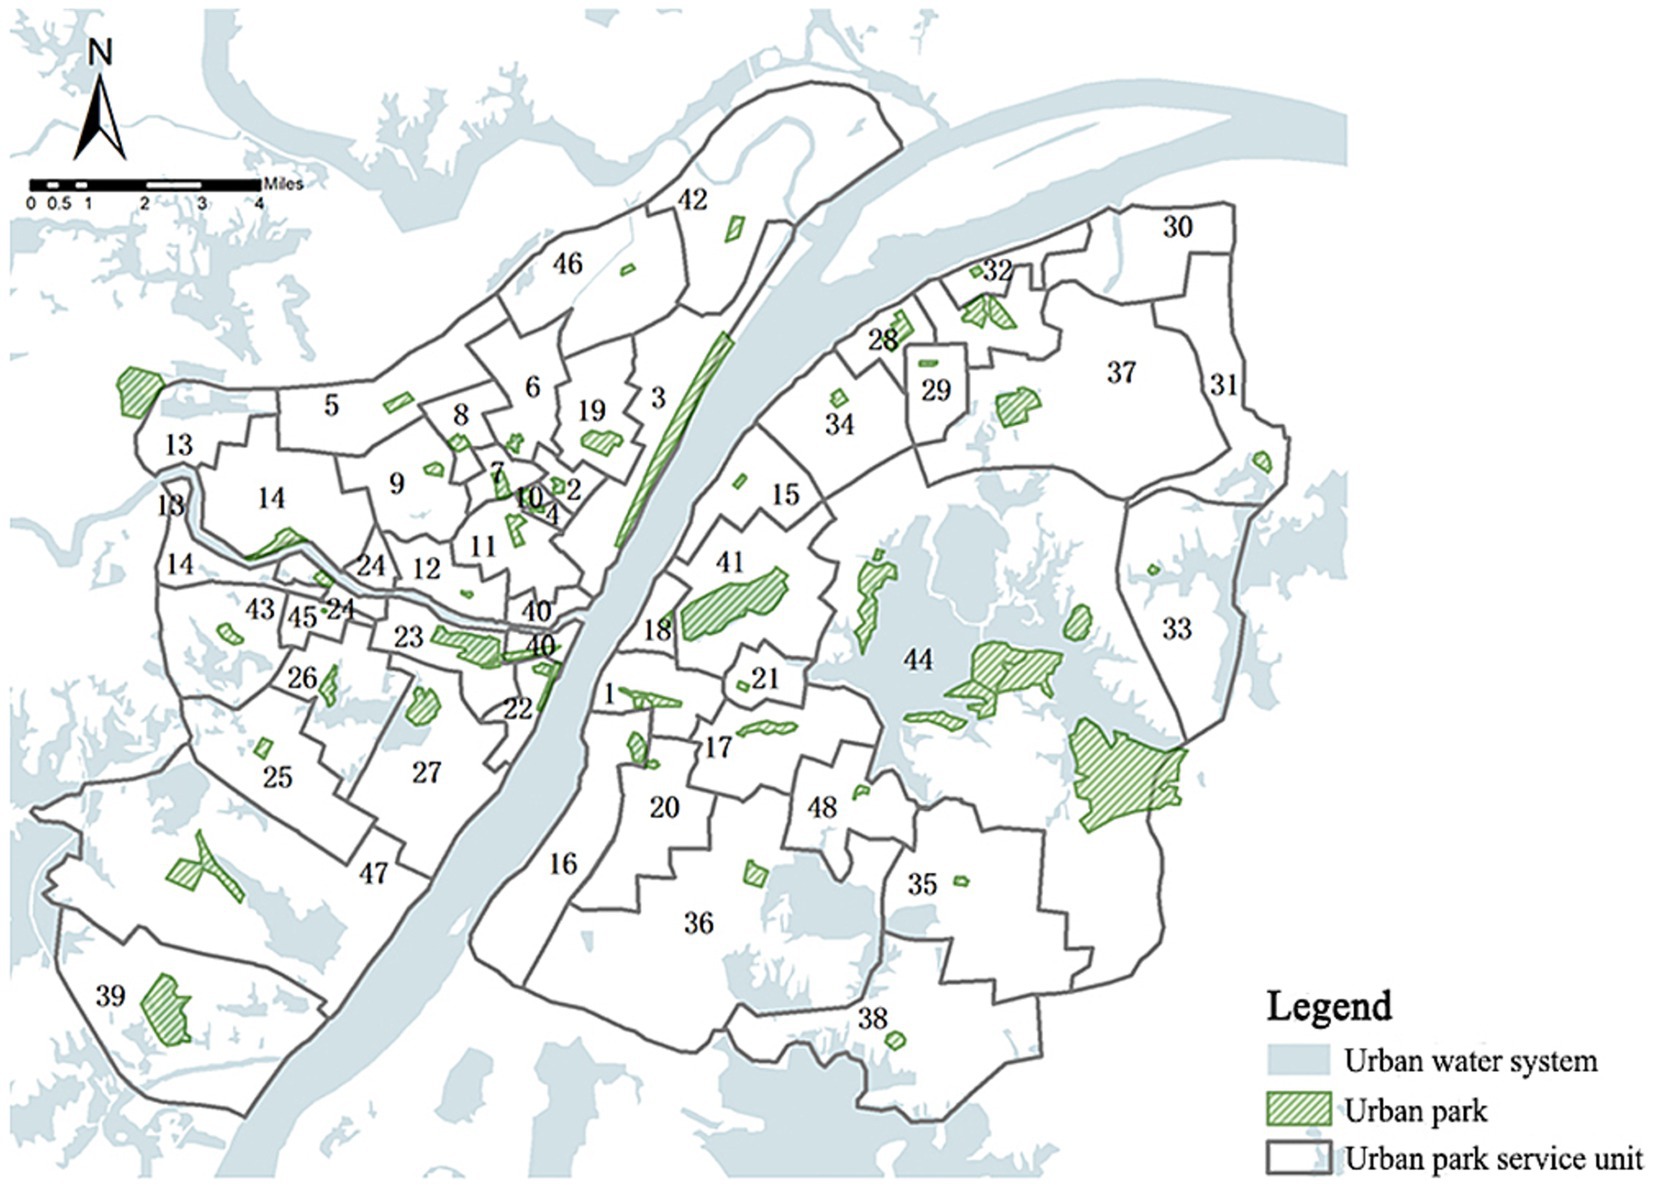
Figure 4. Spatial distribution of the urban park service units in the main urban area of Wuhan; The numbers 1–48 represent the park service unit number.
3.2 Evaluation of the park cold island supply capacity from the supply perspective
3.2.1 Visual analysis of park cold island supply
3.2.1.1 Fractional vegetation cover
The raster image of vegetation cover in the study area (Figure 5) shows that the region’s global average vegetation coverage is 0.44, with a general gradual increase in the vegetation coverage from the center to the periphery, which is significantly higher on the eastern side of the study area than in the rest of the region. Several water bodies in the main urban area were with high vegetation coverage, and the “blue space” and “green space” could be effectively connected through vegetation. The East Lake Scenic Area was the area with the most extensive area of high vegetation coverage in the main urban area, while Hankou River Beach Park, Turtle Mountain Scenic Area, etc., all had a discernible concentration of clusters with high vegetation coverage.
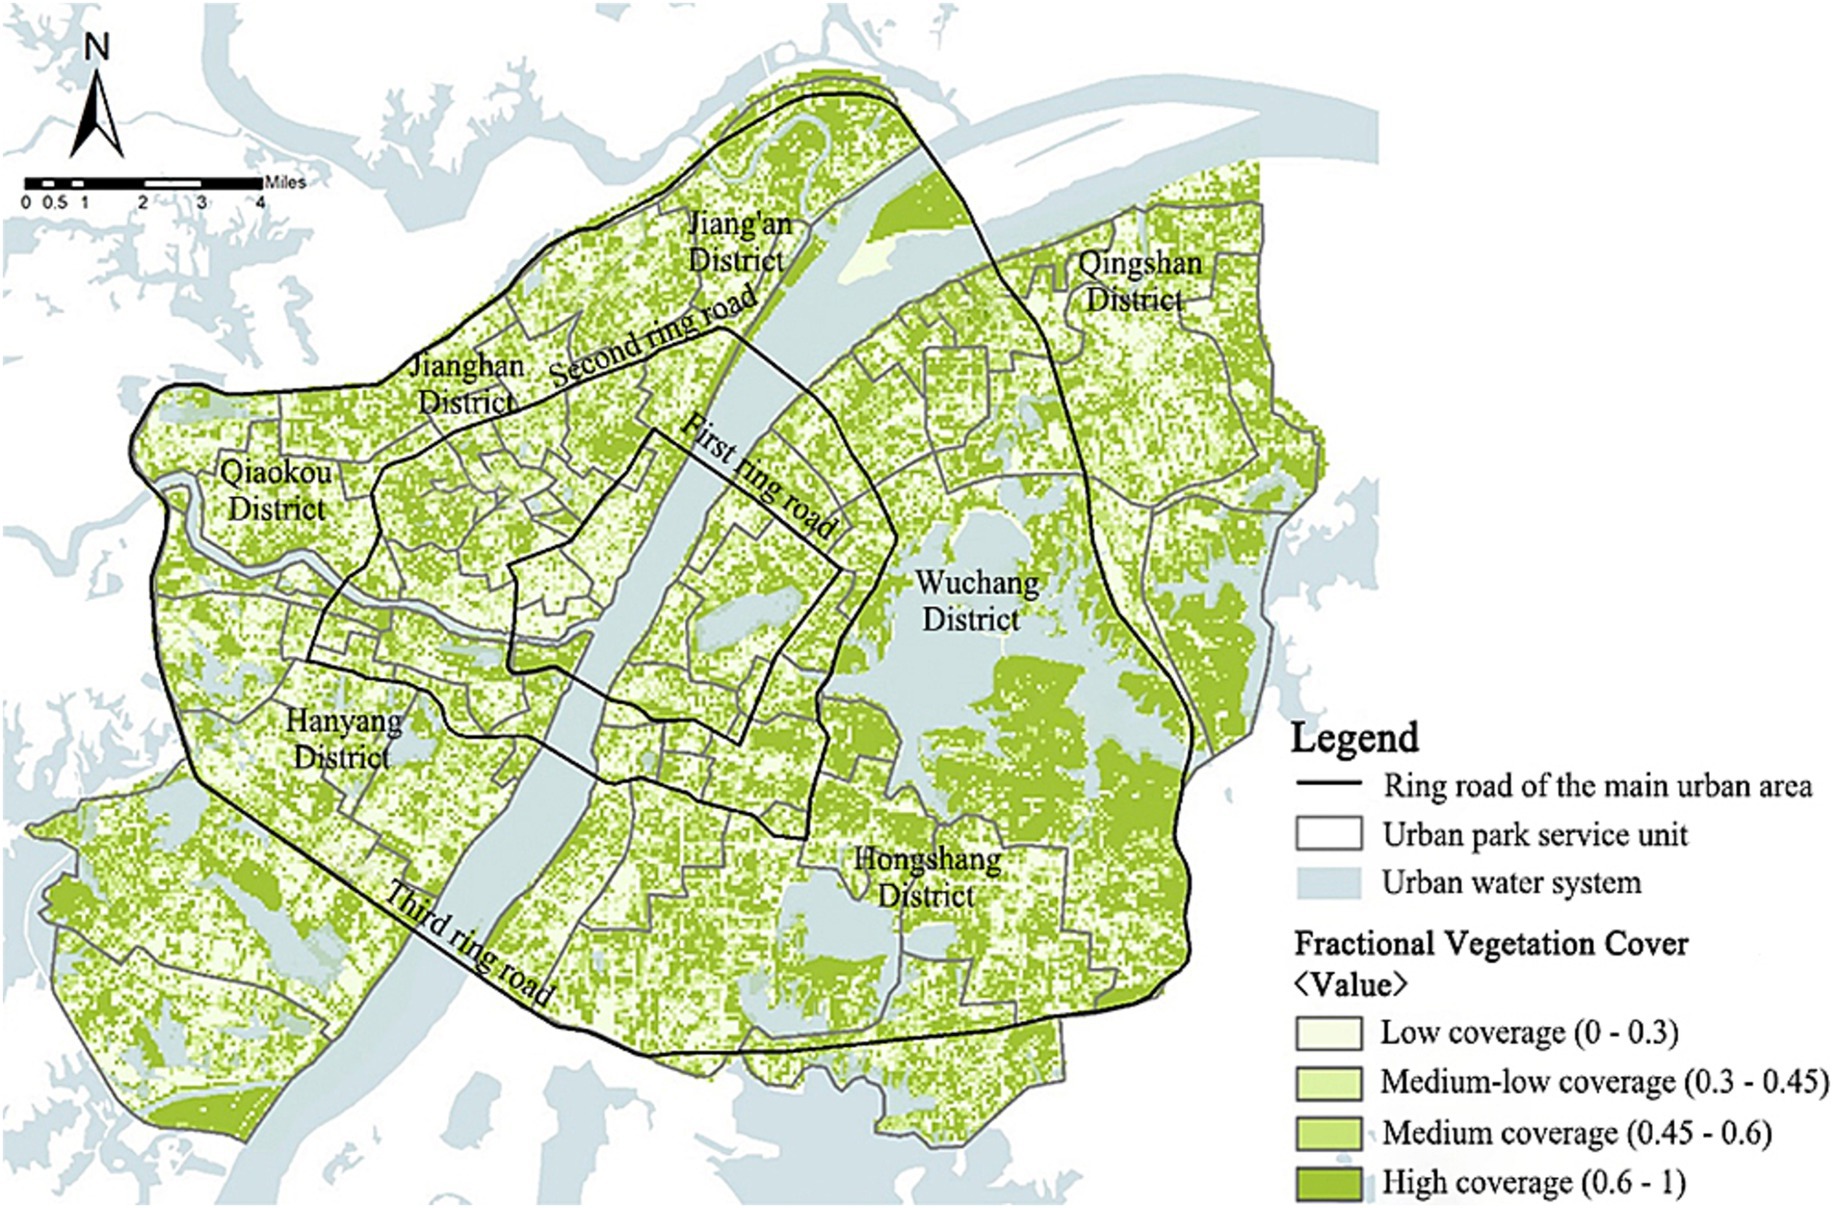
Figure 5. Spatial distribution of the vegetation coverage in the main urban area of Wuhan.
3.2.1.2 Accessibility
The accessibility distribution map of each park service unit (Figure 6) shows that, in general, the accessibility in the eastern region of the Yangtze River is significantly better than the western region. According to the “Series of Standards for National Garden Cities” (after this referred to as “the Standards”), the basic indicator for per capita public green space in Wuhan is 7.5 m2. The “Wuhan Main Urban Area Green Space System Plan (2011–2020)” (after this referred to as “the Plan”) proposes that by 2020, the planned indicator for per capita park green space in the urban core of Wuhan should reach 16.8 m2. In 2018, there were 10 park service units within the main urban area of Wuhan that met the standard requirements of “the Plan.” These parks were mainly located in Wuchang and Hongshan Districts, with the Shahu Park and the East Lake Scenic Area assuming the leading roles. Seven service units met the requirements of the “the Standards” but were lower than those of “the Plan.” These units were primarily situated in the northeastern tip of the study area. The distribution of a larger number of urban parks of a certain size and with fewer inhabitants are the main reasons for their exceptional accessibility.
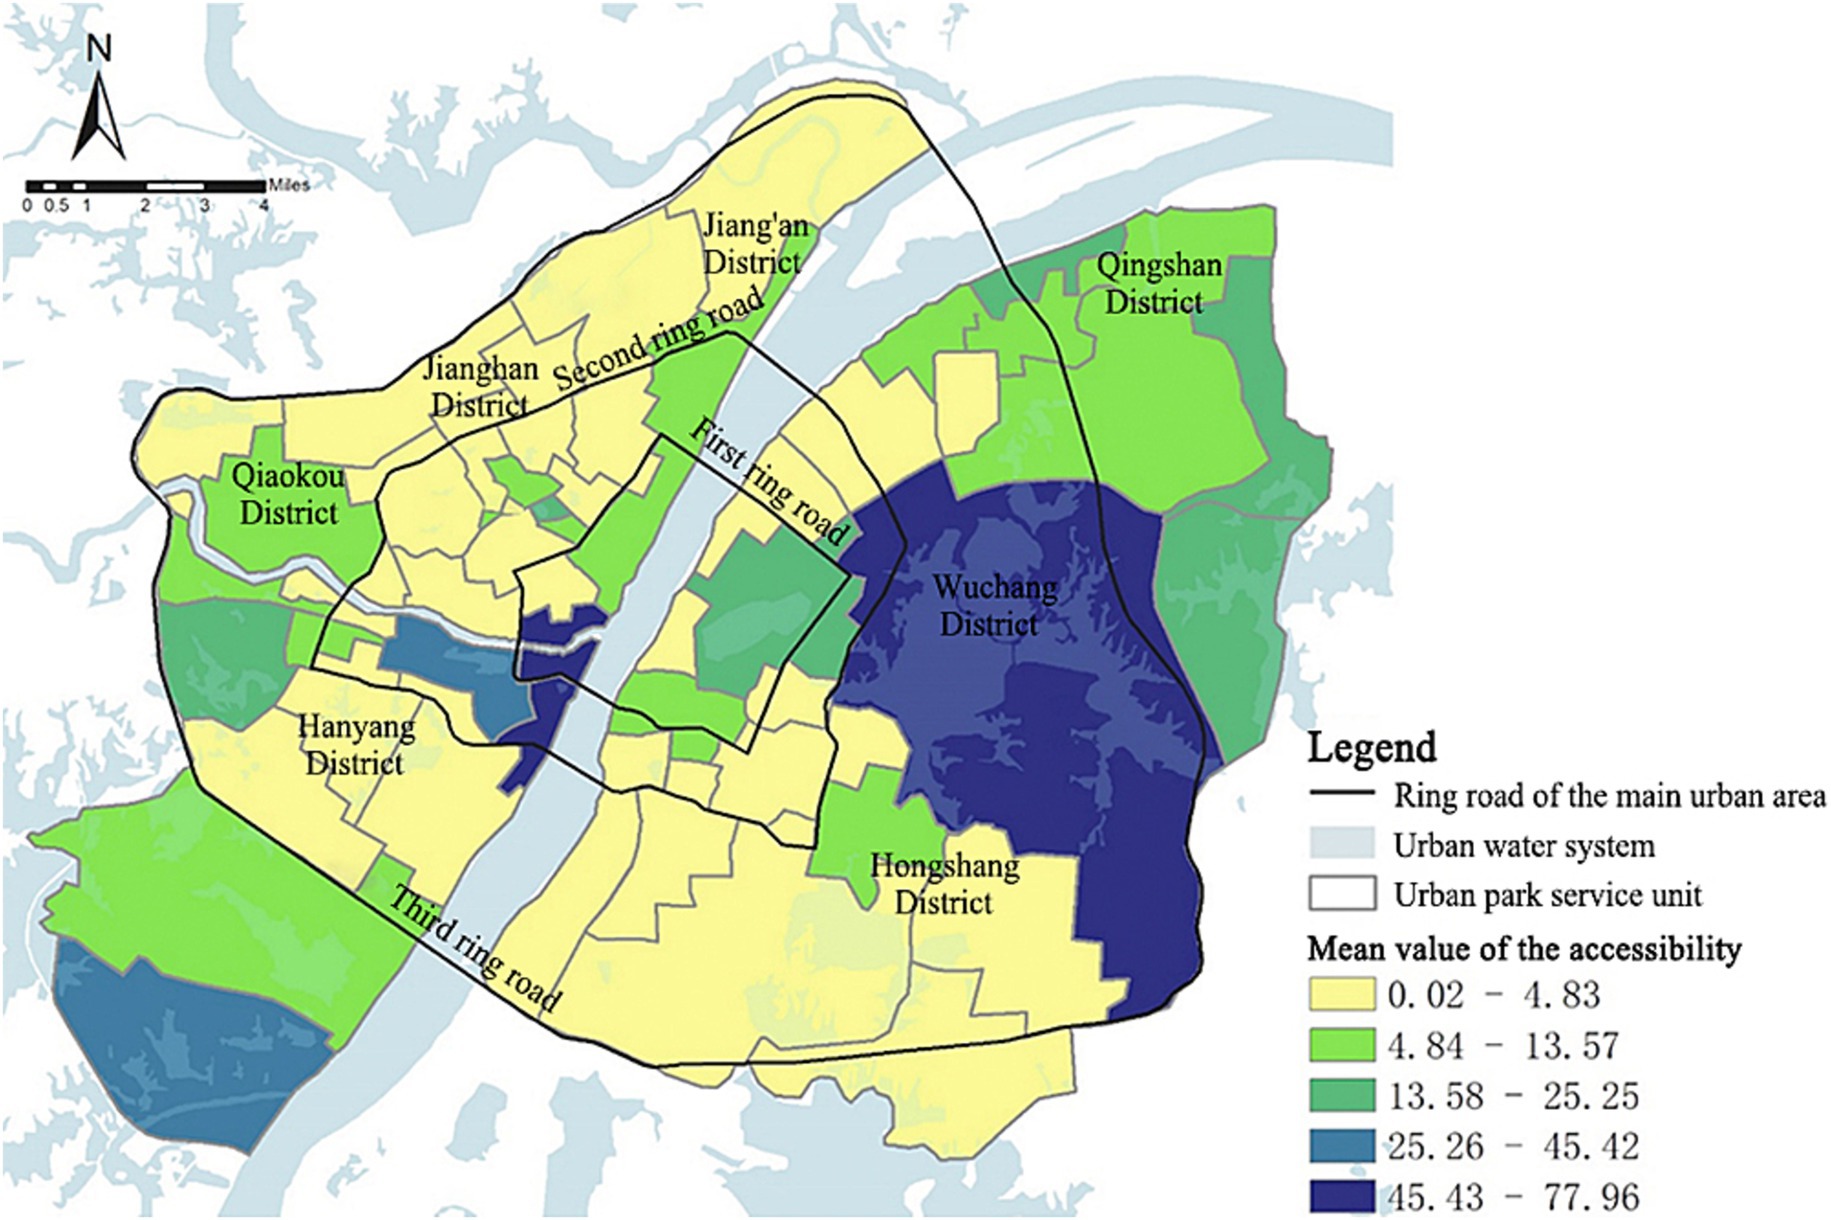
Figure 6. Spatial distribution of the park accessibility in the main urban area of Wuhan.
3.2.1.3 Per capita park size
Figure 7 shows the distribution pattern of per capita park size in the study area. East Lake Scenic Area, Yangchun Lake, Qingshan Park, White Jade Park, and Bamboo Leaf Sea units had high per capita park areas, all of which reached 32.03 m2 or more. There were 25 service units with per capita park area lower than 1.87 m2, accounting for 52.08% of the total number of service units. The results indicate that some parts of the city experience an overwhelmed park supply capacity, resulting in a shortage in per capita park size. Hence, many residents in these underserved area still lack access to parks (52).
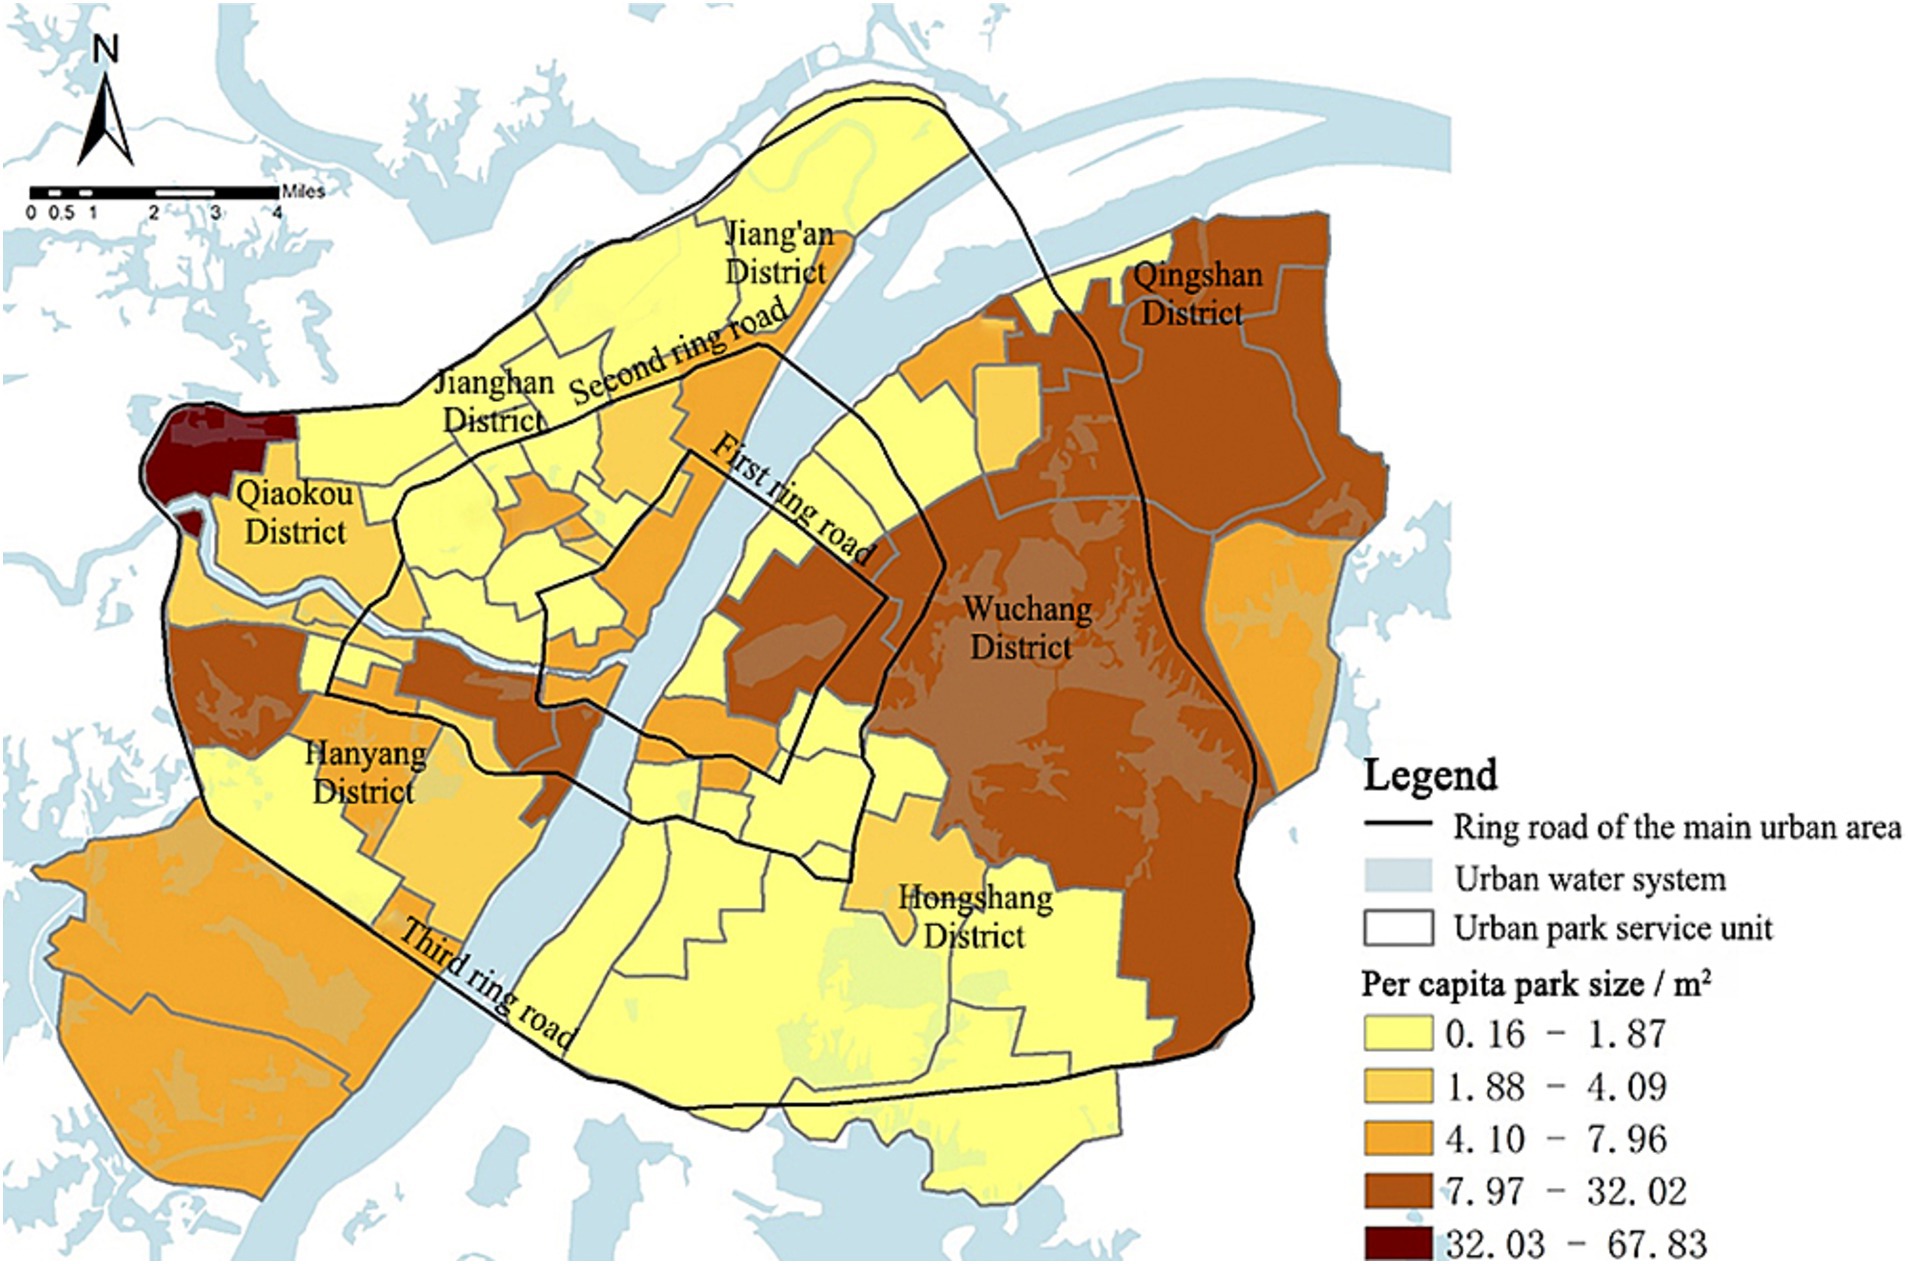
Figure 7. Per capita park size in each park service unit in the main urban area of Wuhan.
3.2.2 Overall characterization of the park cold island supply capacity
The calculated park cold island supply index SI was assigned to the corresponding spatial location. Then the spatial distribution map of the cold island supply capacity of urban parks in the main urban area of Wuhan was obtained (Figure 8A). By analyzing the map, the following characteristics were presented: ① The supply index of various units within the study area ranges from 0.05 to 0.69, demonstrating significant spatial heterogeneity. High-supply-capacity units are primarily concentrated around urban water systems, with the East Lake Scenic Area unit exhibiting the highest supply index, ranging from 0.53 to 0.69. In contrast, low-value areas are predominantly located in regions with lower vegetation coverage, such as the New District Park unit, South Lake unit, Houhu unit, and Zhuodaoquan Park unit within the second-third ring road of the study area, where the supply index is only 0.05–0.19. ② Furthermore, the average supply capacity of cold islands across different layers ranges from 0.32 to 0.36, indicating relatively minor overall variation (as shown in Figure 8B). The highest average cooling island supply capacity is observed within the first ring, followed by a gradual decrease and subsequent increase as the ring layers expand. Within the first-second ring road, the development and construction intensity are high, resulting in limited available space for park construction. Consequently, the cold island supply capacity is lower than that of other rings. Inside the second-third ring road are large areal lakes and parks, such as East Lake Scenic Area, Moon Lake Scenic Area, Wuhan Zoo, Ink Lake, etc. Despite that the intensity of urban construction is similar to that of the second ring road, a relatively high cold island supply is still maintained. Outside the third ring road, because of its proximity to the city’s outskirts, the intensity of development is diminishing. Consequently, there is more space to maintain its natural ecology in its original state, and the supply capacity of cold islands has been improved compared with that of the second ring road.
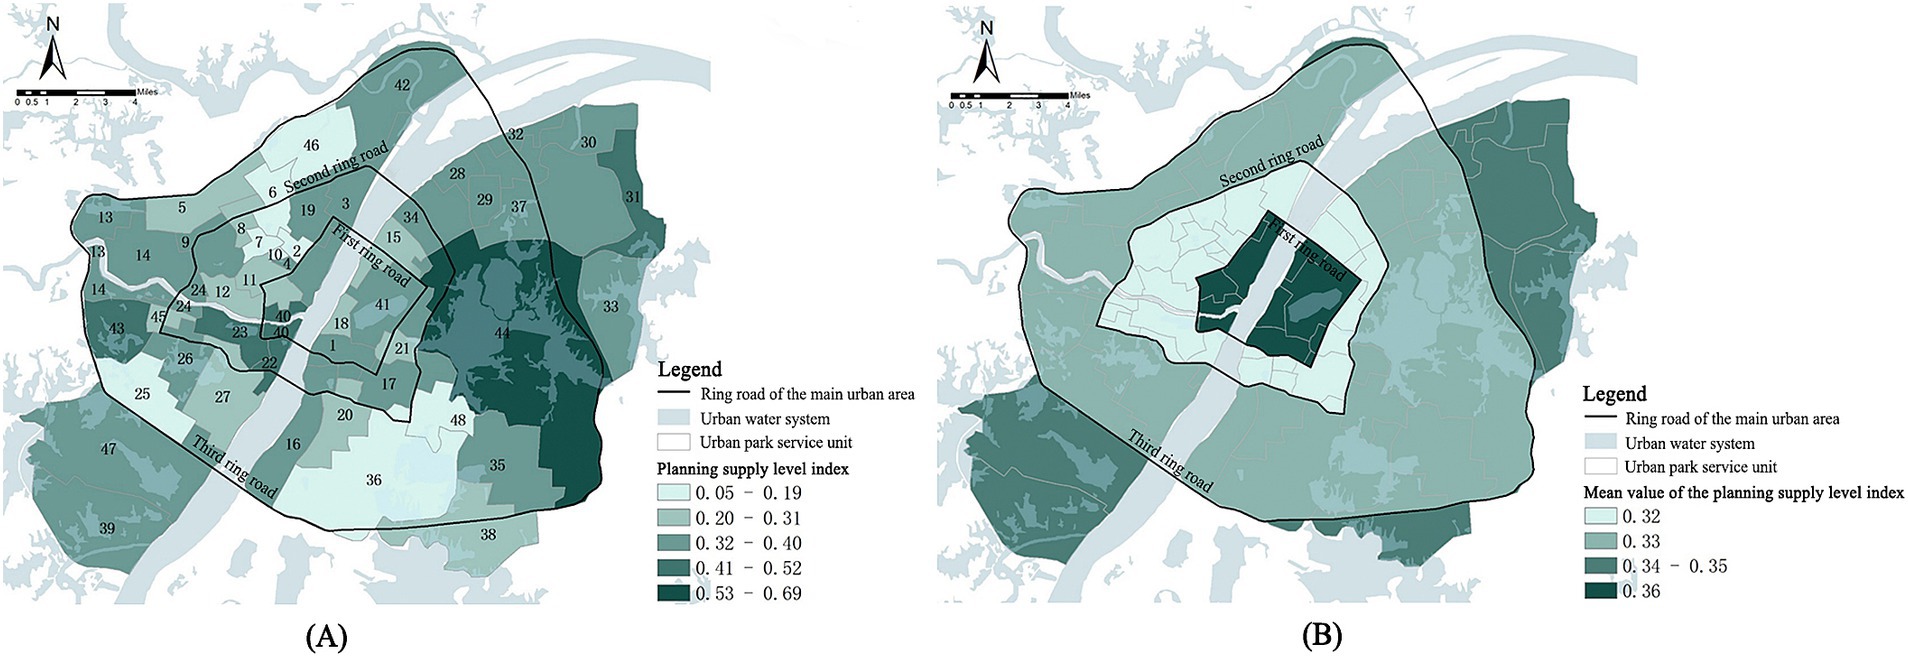
Figure 8. (A) Spatial distribution of the cold island supply capacity; (B) The cold island supply capacity within each ring road in the study area.
The findings of this study corroborate existing research on the critical role of water bodies in amplifying park cooling effects, as high-supply units typically feature a higher proportion of internal or adjacent water bodies. Notably, water bodies exhibit higher cooling intensity and magnitude compared to tree-dominated green spaces (53–55), particularly when exceeding 30% coverage within parks (28, 56). Furthermore, the synergistic interaction of blue-green spaces enhances cooling ranges and spatial impacts: water bodies improve thermal convection efficiency, while vegetation regulates radiative balance through shading and air circulation, collectively accelerating urban convection systems to establish localized cooling zones that surpass the performance of isolated landscape elements (57, 58). These mechanisms align precisely with the observed spatial distribution patterns, solidifying the robustness of our conclusions.
3.3 Evaluation of the residential cold island demand index from the demand perspective
3.3.1 Visual analysis of residential cold island demand
3.3.1.1 Population density
Figure 9 illustrates that the population density in the main urban area of Wuhan shows an overall trend of decreasing distribution with the Yangtze River serving as the central axis extending to the east and west wings. There were 8 high population density areas (PD > 8,000 people/km2), accounting for 16.67% of the total number of service units. These areas were mainly distributed in service units such as Yellow Crane Tower, Neisha Lake, Turtle Mountain Scenic Area, Zhongshan Park, Qiaokou Park, and Treasure Island Park, located at the confluence of the Yangtze River and the Han River. There were 10 low-value zones (PD < 2,861 people/km2), accounting for 20.83% of the total number of service units. These zones were concentrated in the northeastern, northwestern, and southwestern parts of the region, including Qingshan Park, White Jade Park, Yangchun Lake Park, Dijiao Park, Tang Lake Park, and other service units.
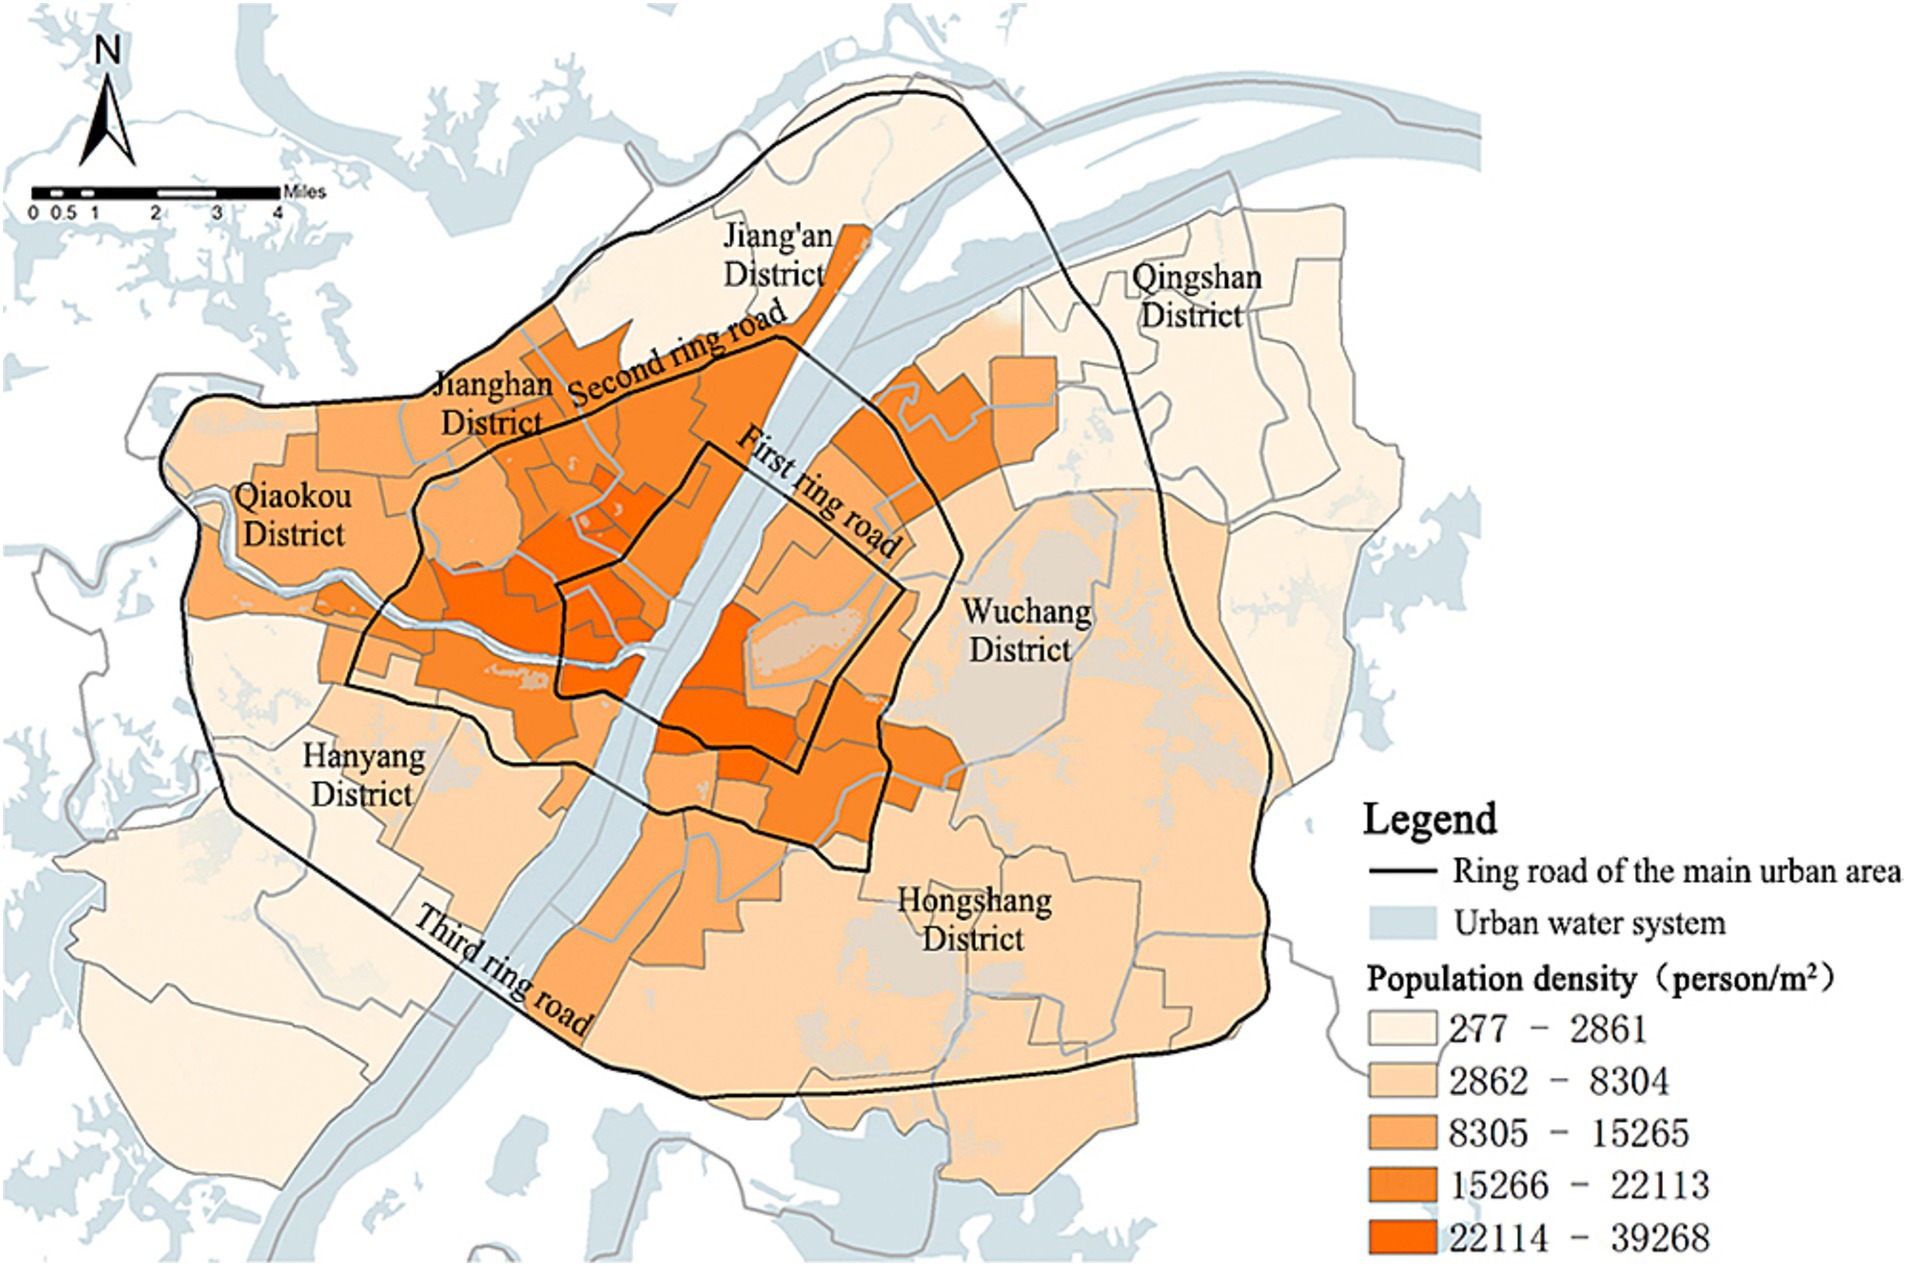
Figure 9. Population density distribution in the main urban area of Wuhan.
3.3.1.2 POI kernel density
The kernel density of social activity POIs exhibited a geographical distribution pattern that aligned with the kernel density of the population (Figure 10). Within the first ring road is the core area of urban activities, and the POI density gradually decreased from the first ring road to the outside. The high-value areas (PoiKD >880) were mainly located in service units such as Zhongshan Park, Minor South Lake Park, Yellow Crane Tower, and Simei Tang Park along the banks of the river in the central region, as well as in the service units such as Guanshan Park, Ziyang Park, and Hongshan Park in the eastern Hongshan District. While the low-value areas (PoiKD <98) were centrally located in the outer part of the study area in the service units of White Jade Park, Yangchun Lake Park, Tang Lake, and Dijiao Park.
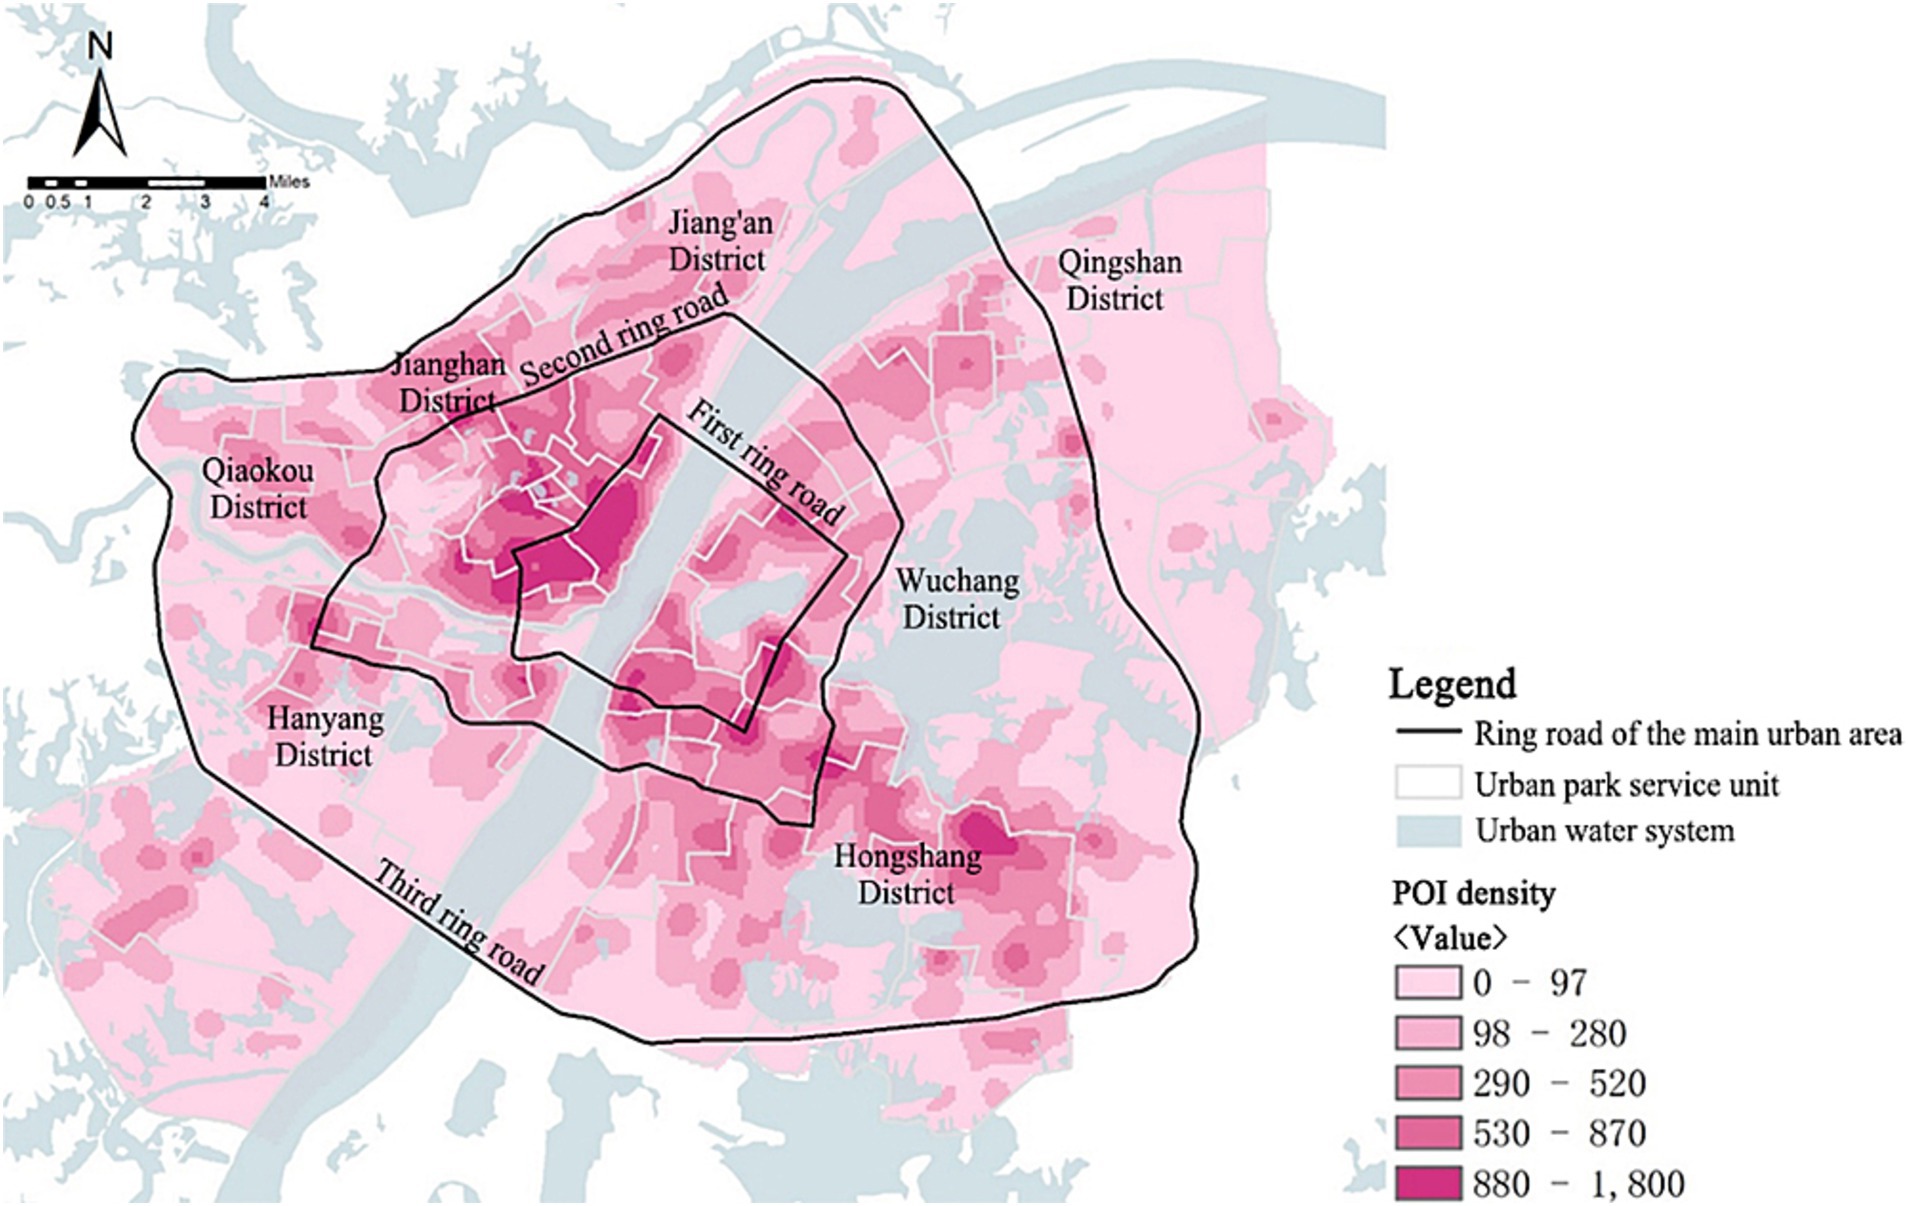
Figure 10. POI kernel density in the main urban area of Wuhan.
3.3.1.3 Land surface temperature
The results of land surface temperature retrieval indicated that the land surface temperature in the main urban area of Wuhan ranged from 23.5°C to 56.1°, highlighting a significant temperature difference within the region (Table 4). The cold and heat islands in the study area exhibited a mosaic distribution pattern, with the cold island space mostly showing point and line distribution, while the heat island space shows a large and widely distributed pattern (Figure 11). Specifically, units adjacent to water bodies or containing large water areas have lower average temperatures, such as East Lake Scenic Area, the Yangtze River, Han River, South Prince Edward Lake, Longyang Lake, and Ink Lake, suggesting that large water bodies have a significant mitigating effect on high-temperature environments. The average temperatures within park service units at the northeastern and southeastern ends of the study area were higher, indicating a high risk of thermal environment and a high demand for cold islands among residents.
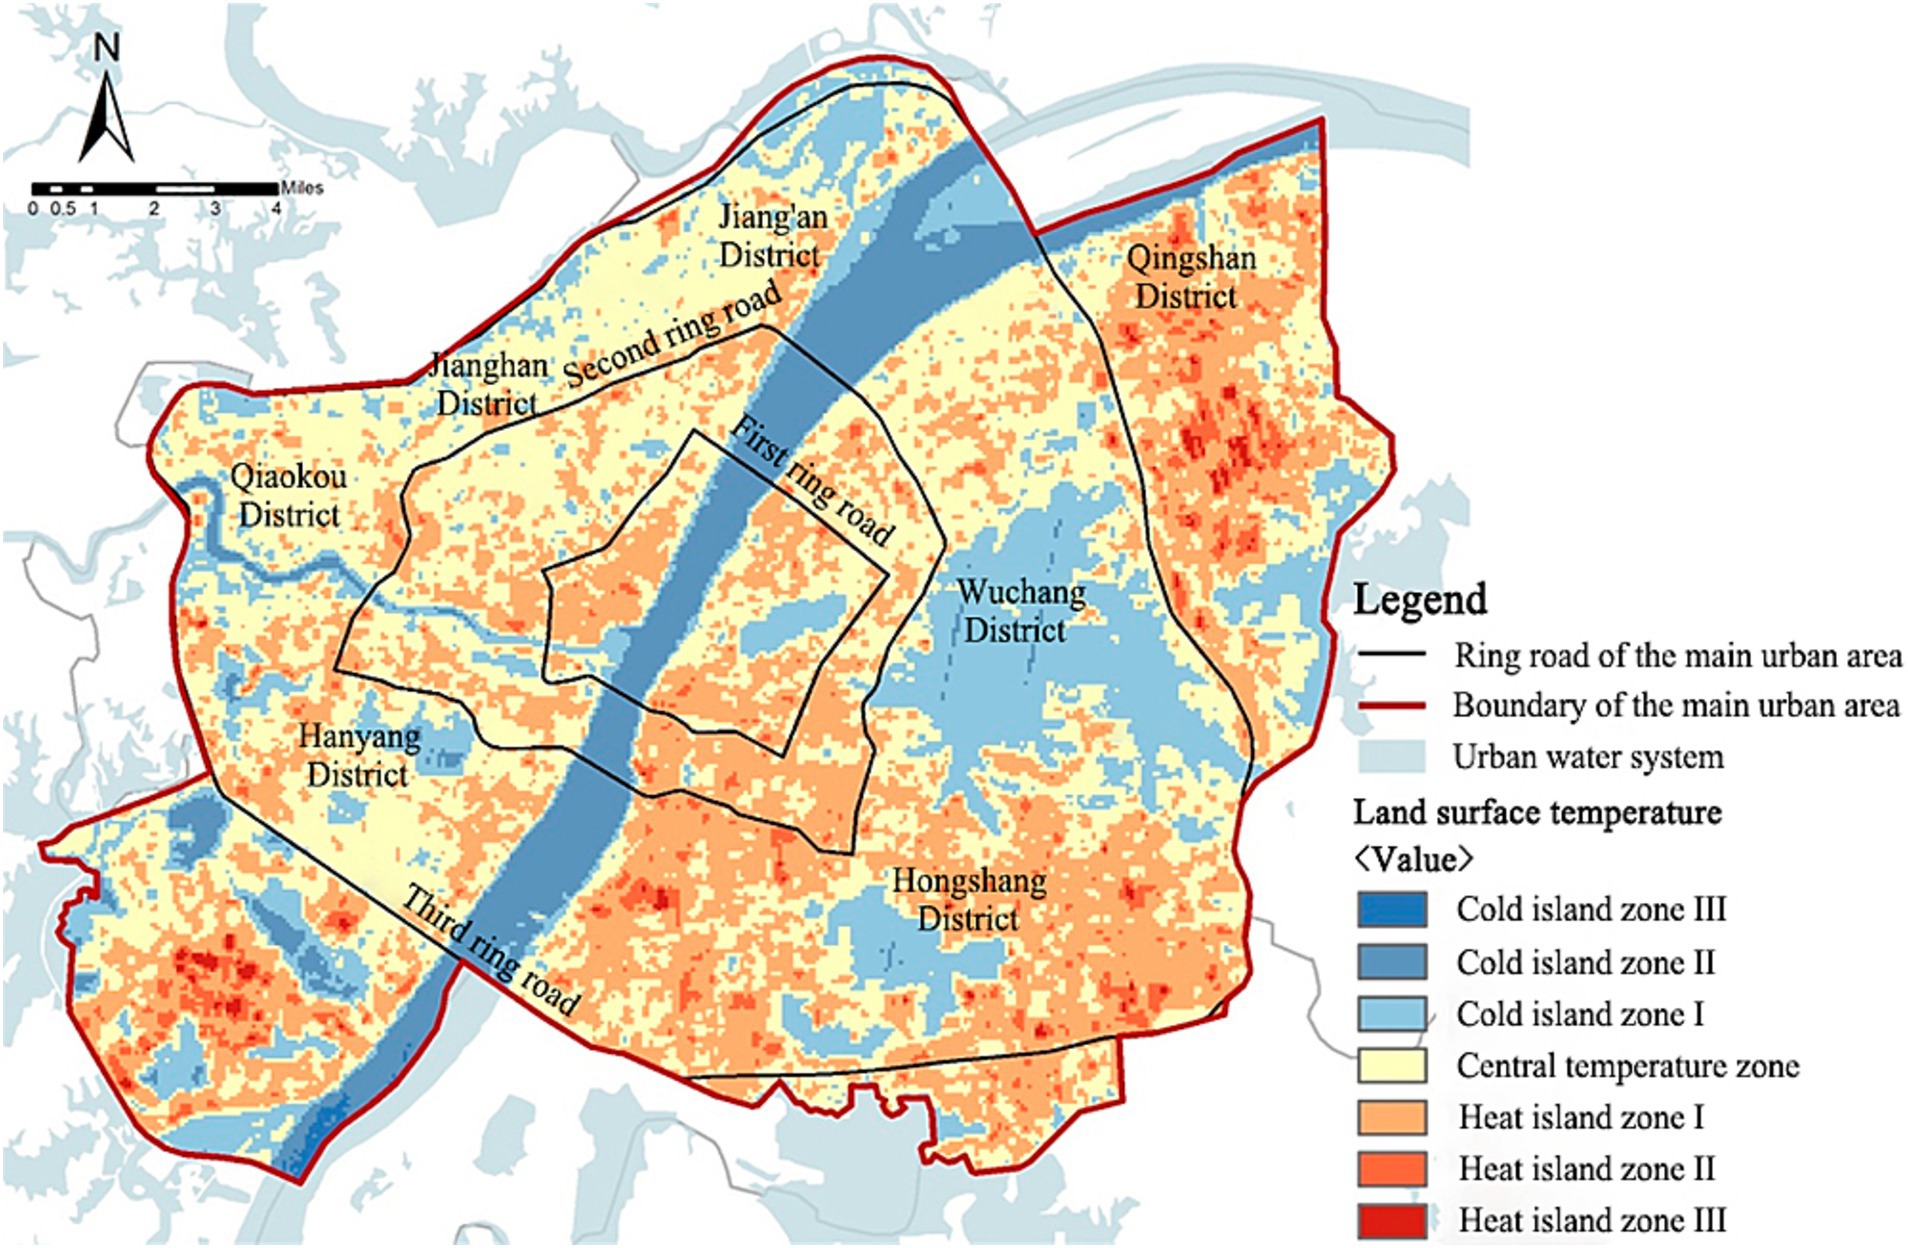
Figure 11. Inversion of land surface temperature in the main urban area of Wuhan.
3.3.1.4 Heat island patch size
The score distribution map of heat island patches was obtained by counting the size of each heat island patch within each park service unit and assigning the corresponding value (Figure 12). The unit with the highest heat island patch score was No. 40 East Lake Scenic Area unit, with 24.6% of the range covered by heat islands. Among it, the largest heat island patch had a size of about 1,100 hm2, located in the East Lake High-tech Development Zone (Optics Valley). It suggests that the cold island effect of the East Lake Scenic Area exerts a limited influence, while the active development of the high-tech zone also generates significant heat. The unit with the highest percentage of heat island coverage was the No. 20 Chuwangtai unit, at 83.8 percent. As the unit is located along Baishazhou Avenue, the development intensity is high. This unit faces a challenge in terms of the scarcity of expansive, environmentally sustainable parks and green spaces within its boundaries. Consequently, it encounters difficulties in mitigating the effects of the urban heat island phenomenon, particularly during the summer season.
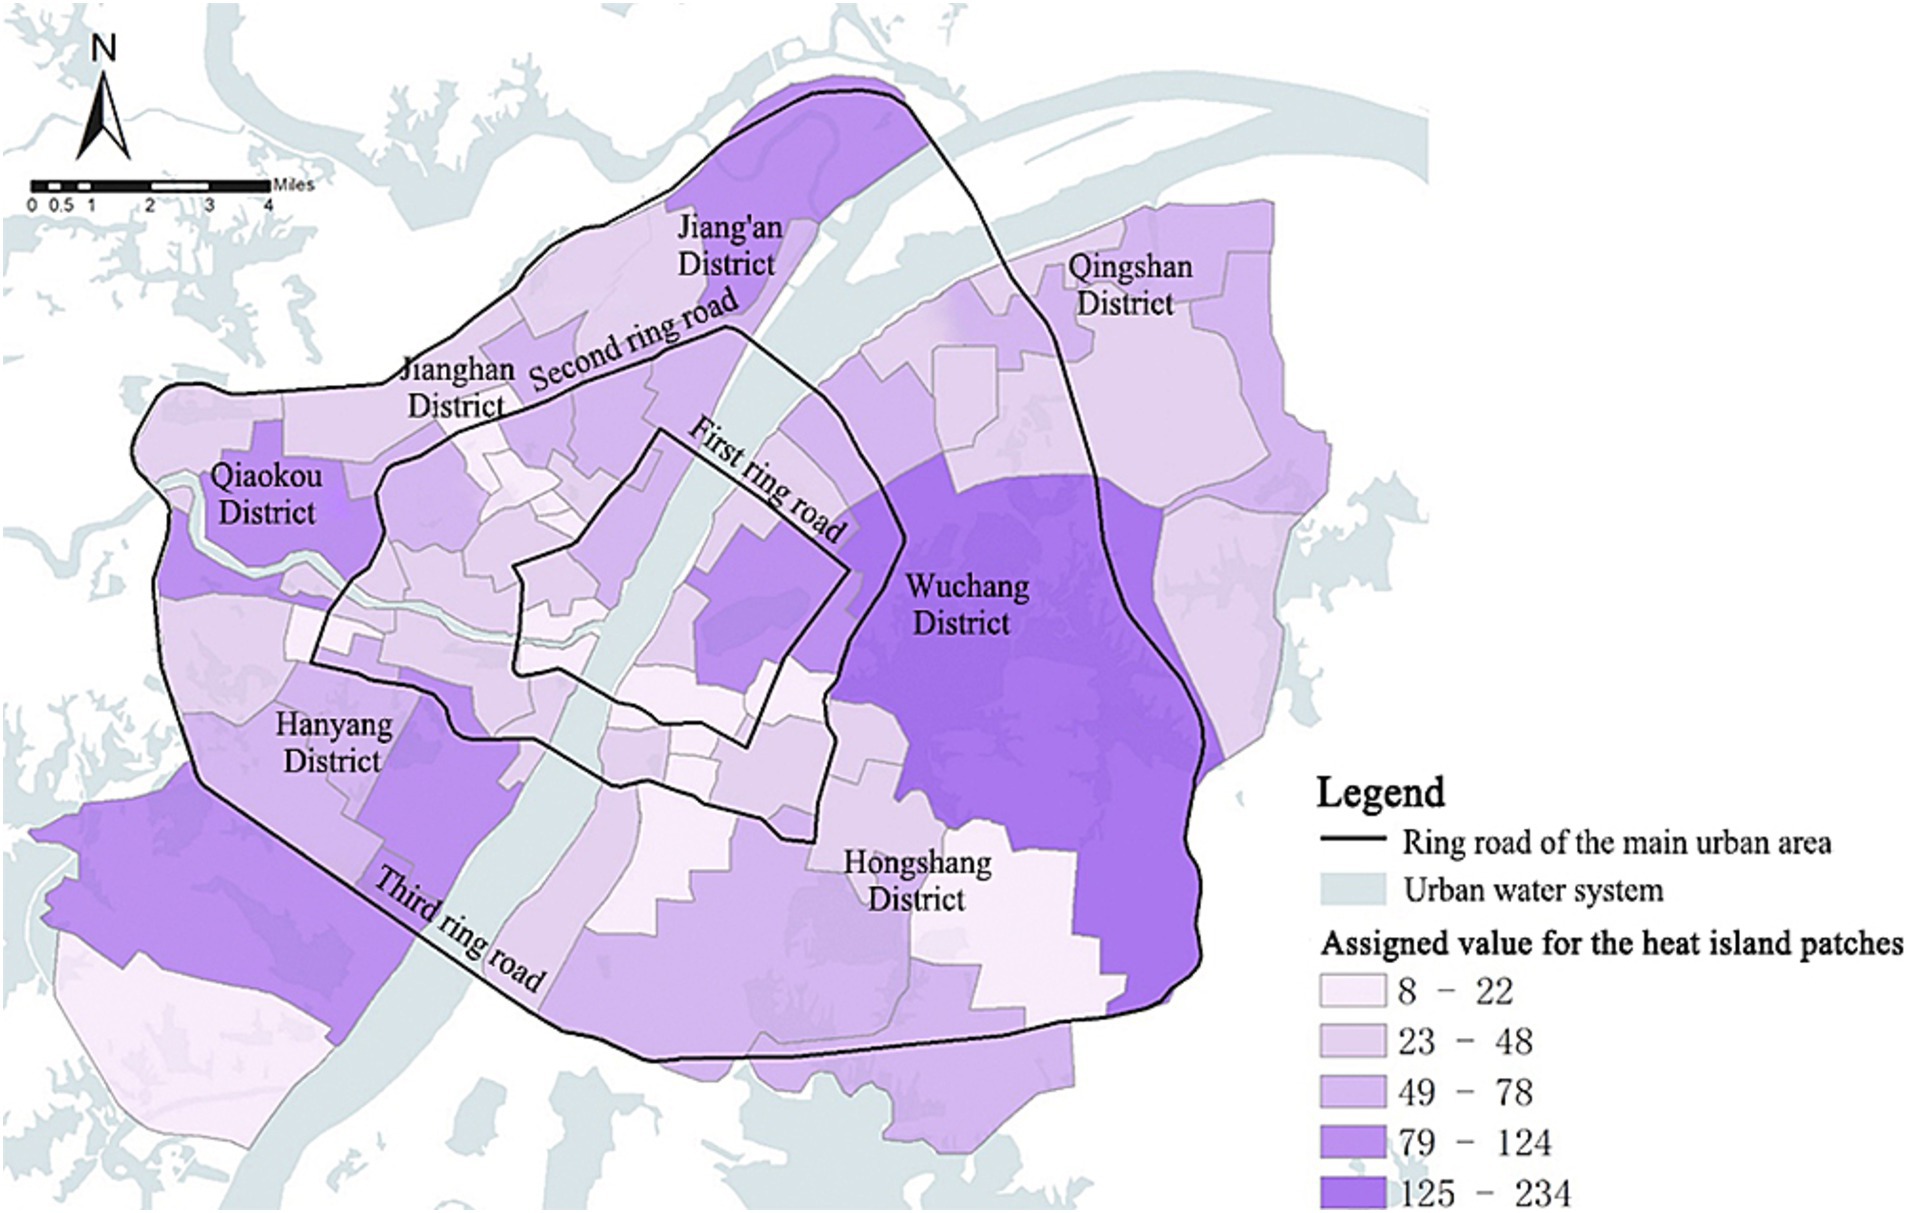
Figure 12. Spatial distribution of assigned values for heat island patches in the main urban area of Wuhan.
3.3.2 Overall characterization of the residential cold island demand index
The calculated residents’ cold island demand index DI was assigned to the corresponding spatial location. Then the spatial distribution map of the residents’ cold island demand index in urban park units in the main urban area of Wuhan was obtained (Figure 13A). The darker the color of the unit color block, the stronger the demand for cold islands for residents. The following characteristics were presented: ① The demand level for cold islands in urban parks within the main urban area of Wuhan exhibits a spatial distribution characterized by “scattered across the entire region with localized concentrations.” The high-demand units match with the center of distribution of population density and POI density. Seven units, including Ziyang Park Unit, Hongshan Park Unit, Chuwangtai Unit, Hongshan Square Unit, Rhyme Lake Unit, Wangjiadun Unit, and Zhongshan Park Unit, had residential demand indexes ranging from 0.44 to 0.54, indicating a higher level of urgency in terms of resident demand. ② The average demand index is spatially linked to the first, second, and third ring circles of the main urban area of Wuhan (Figure 13B). The demand values of each circle decreased from the core area outwards. This suggests that in general, the demand-side indicators have a certain correlation with the intensity of urban development and construction. Furthermore, the first ring of Wuhan’s main urban area carries more functions of urban activities and attracts a large number of people to gather, resulting in elevated cooling island demand.
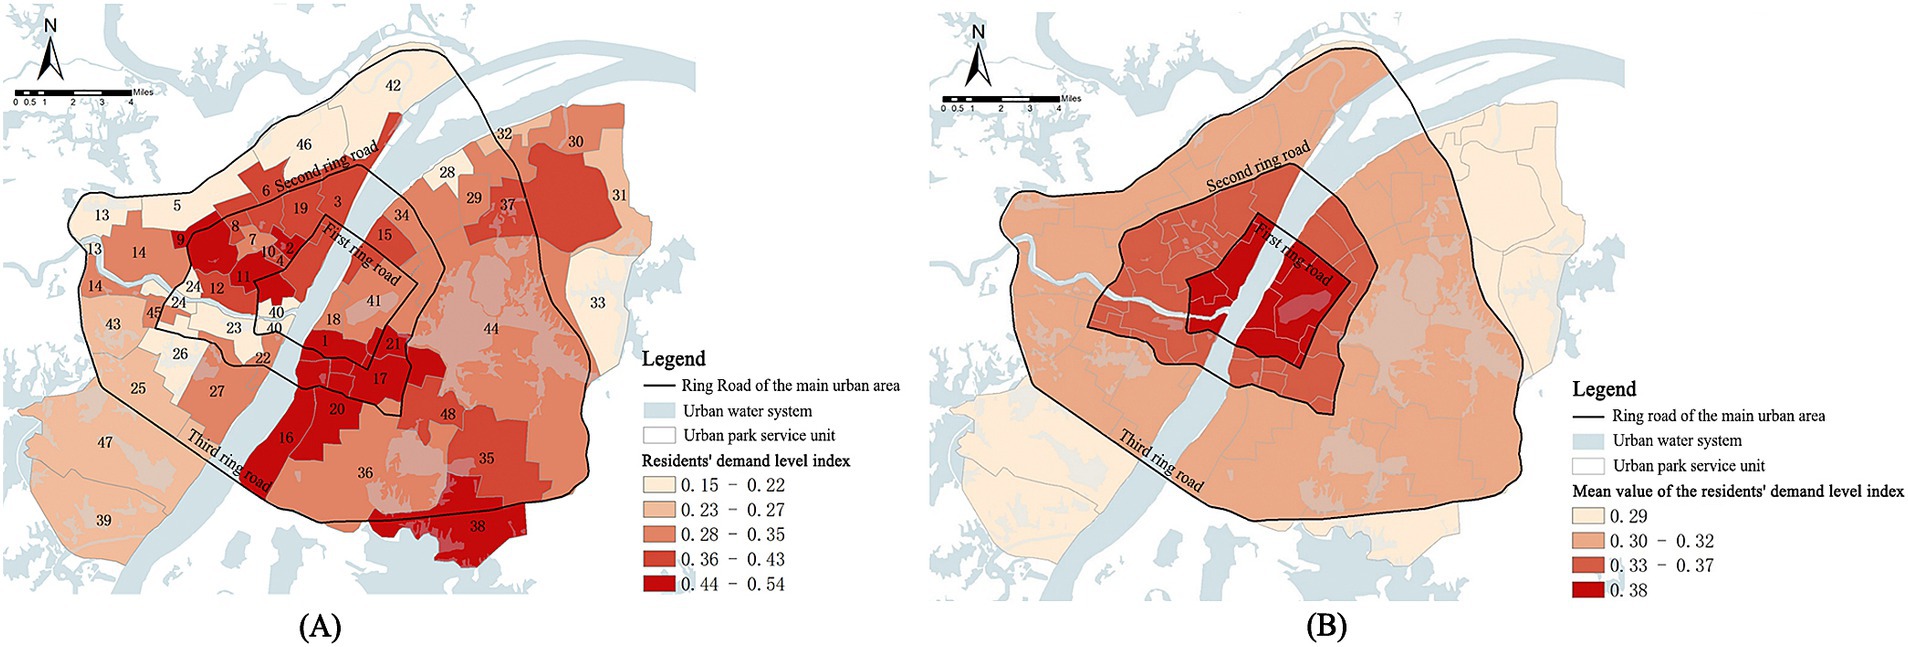
Figure 13. (A) Spatial distribution of the cold island demand index; (B) The cold island demand capacity within each ring road in the study area.
This finding aligns with Xin Ruhong et al.’s research on urban thermal regulation service demand, where communities with higher resident population density and POI density tend to face higher thermal environment risks, and thus have a higher level of cold island demand (59). The spatial distribution of population density and POI density, as an indirect characterization of the intensity of socio-economic activities, is closely related to the level of cold island demand. Studies have shown that anthropogenic heat generated by high-intensity socio-economic activities significantly raises surface and air temperatures in the region and surrounding (60). In areas with high urban development intensity, on the one hand, the rise in the proportion of impervious surfaces leads to a reduction in heat capacity, exacerbating the heat island effect and elevating the surface base temperature (61–63); on the other hand, dense high-rise buildings seriously impede air circulation and inhibit the spread of the cold island effect (64, 65). Therefore, the correlation mechanism between urban development intensity and the level of cold island demand is mainly reflected in the expansion of impervious surfaces and the deterioration of ventilation conditions, which provides scientific support for the regulation of urban thermal environment and the optimization of park planning.
3.4 Identification and evaluation of supply and demand balance relationship of cold islands in urban parks
From the park cold island supply indicator (SI) and resident cold island demand indicator (DI) of the 48 park service units in the study area, the location entropy theory was introduced to evaluate the level of balance between supply and demand. The spatial distribution map of the cold island effect supply and demand was obtained by connecting the supply and demand relationship with the spatial location of the units (Figure 14A).
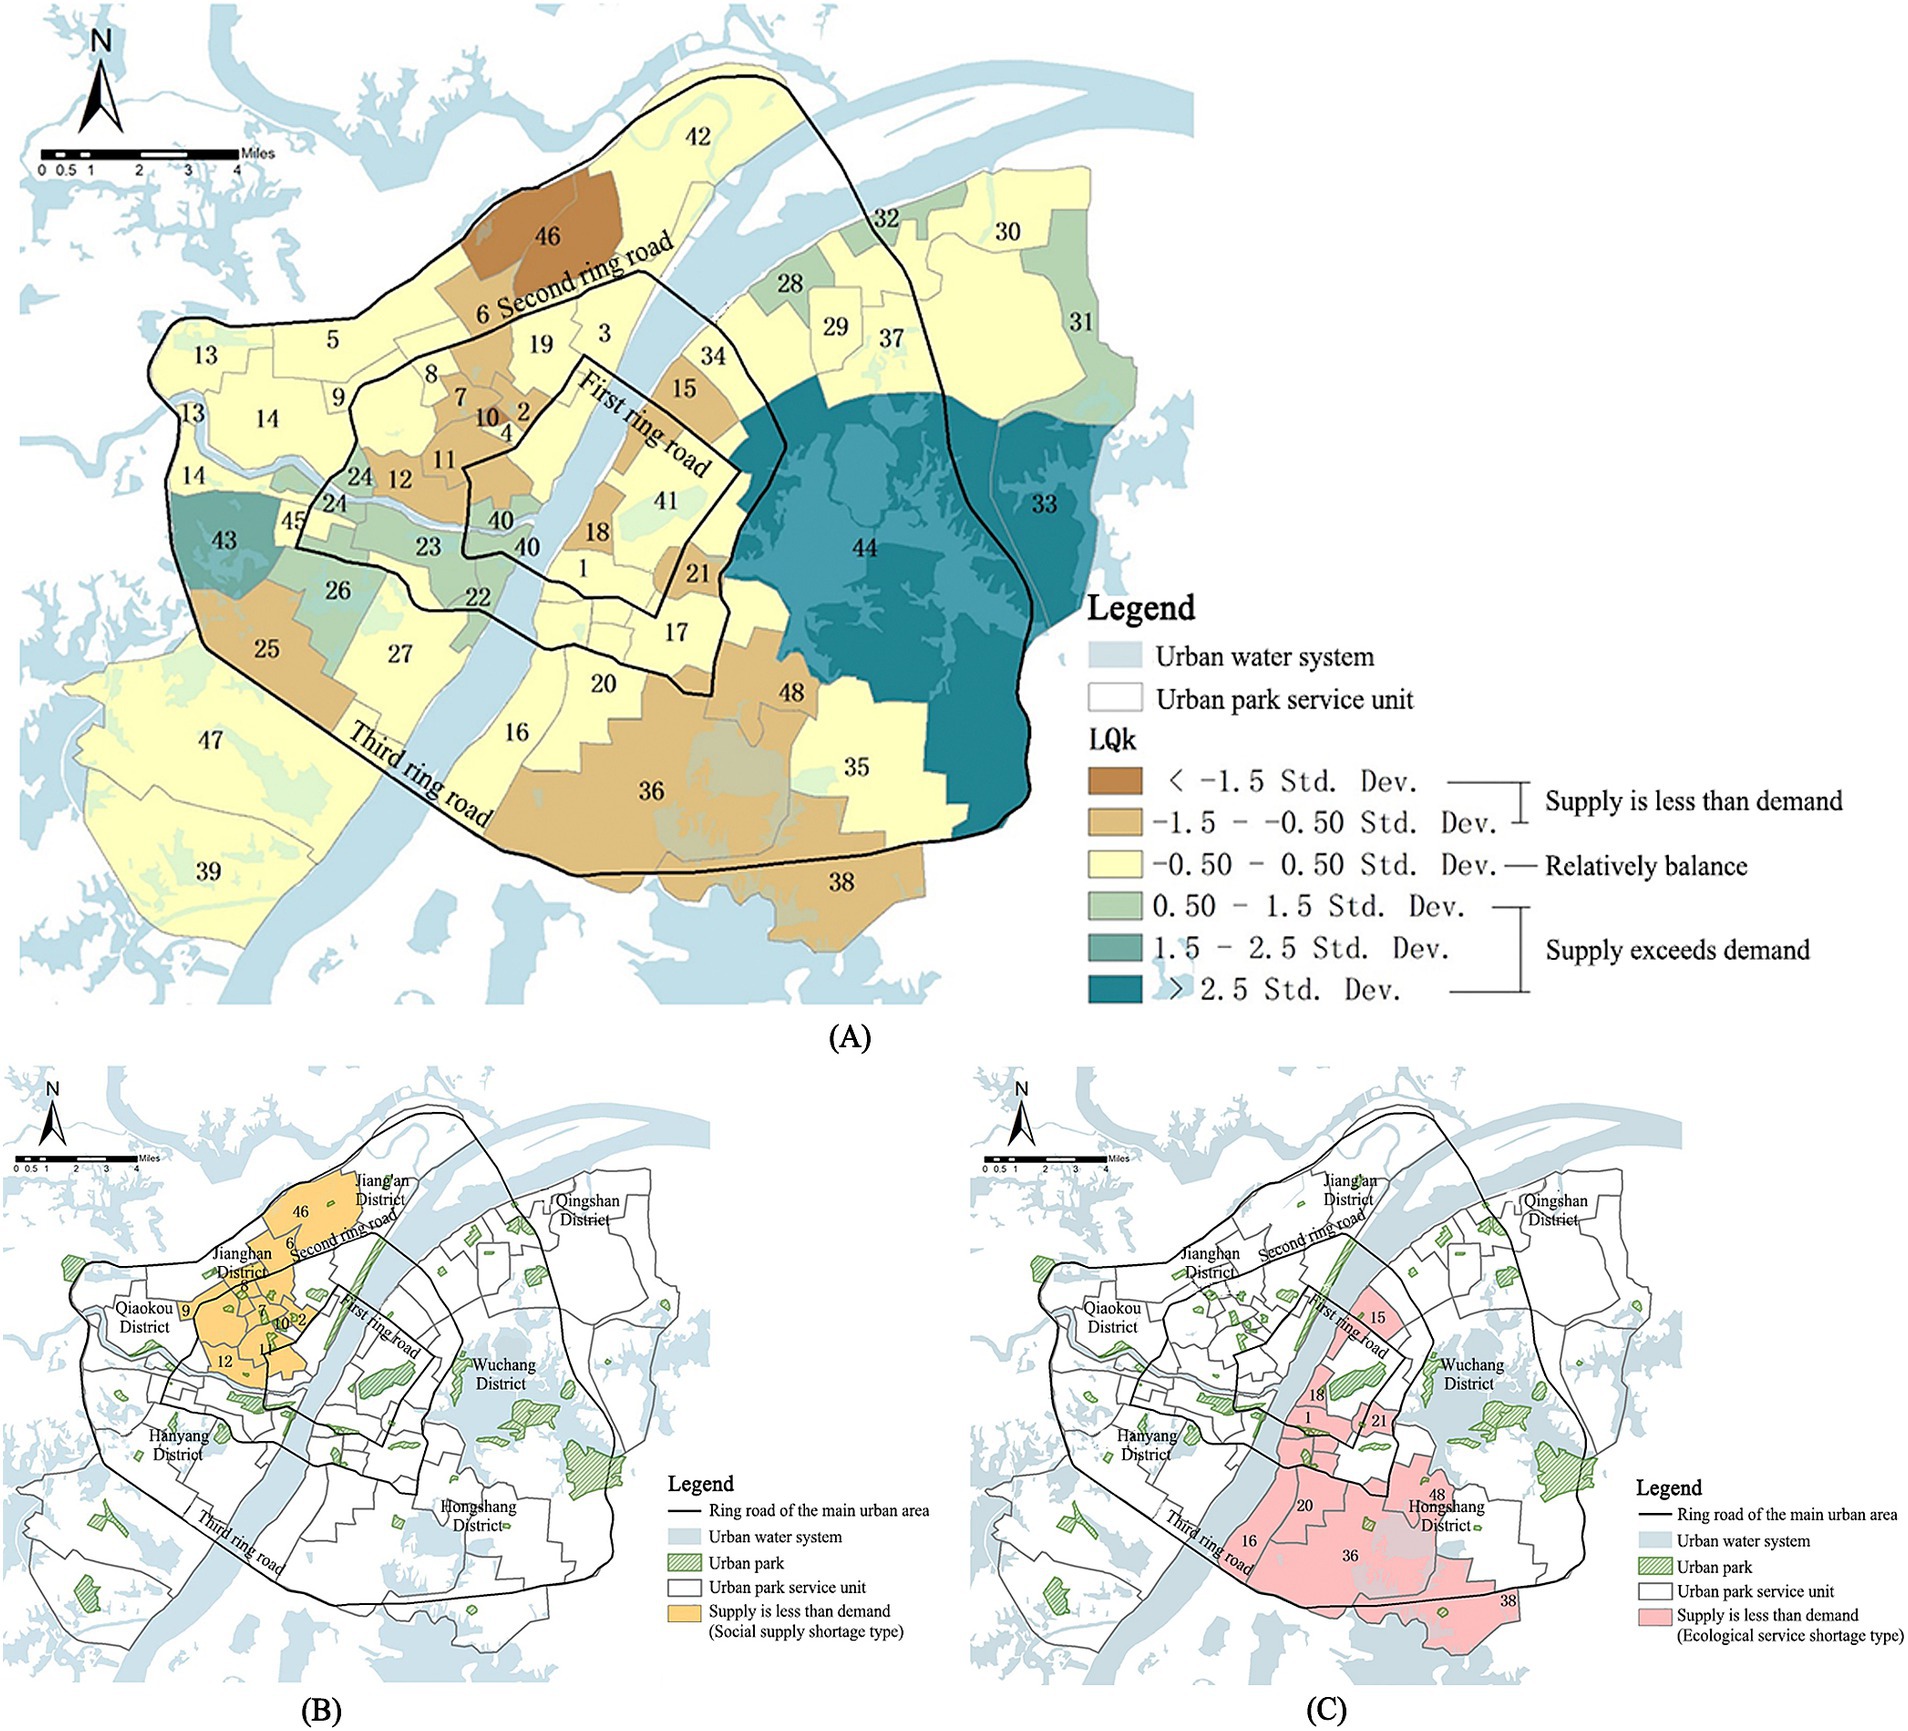
Figure 14. (A) Spatial distribution of the supply–demand relationship of cold island effect in the main urban area of Wuhan; (B) Spatial distribution of the social supply-shortage type units; (C) Spatial distribution of the ecological service-shortage type units.
3.4.1 Supply and demand I: less supply but more demand
There are 19 units in total, showing a spatially clustered distribution in the study area, belonging to regions with high residential density and lacking vegetation cover. Two types are analyzed: the social supply-shortage type (Figure 14B) and the ecological service-shortage type (Figure 14C).
Social supply-shortage type (9 units): The main manifestations of this type lie in the residents’ impeded access to the cold island effect, the excessive people cold island supply of urban parks carries, and the not sufficiently complementary built environment around the dominant parks in the unit to the cold island supply. These regions are in the middle of Qiaokou District, Jianghan District, and Jiang’an District. The confluence of the Yangtze River and the Han River has facilitated the gradual development of this area into the commercial and financial center of Wuhan, and a heavily populated zone in the main urban area, which mainly explains its high social demand value. Simultaneously, the existing neighborhoods exhibit a high level of density, resulting in “numerous but small parks” in the region, hence presenting the overloaded supply capacity phenomenon.
Ecological service-shortage type (10 units): The cold island supply of urban parks within the units is insufficient to mitigate the summer heat and the heat island effect caused by urbanization, resulting in extreme heat. Additionally, the continuous distribution of high-temperature heat island patches in some units exacerbates the negative impacts of the heat island effect. These regions are located in Hongshan District and Wuchang District, which include rapidly developing zones such as the East Lake High-Tech Development Zone, Hongshan Square, Zhongnan Road Business District, and Optics Valley University Town. The parks in these units are small and dispersed, resulting in a very weak cooling effect on land surface temperature. Although adjacent to three water bodies-East Lake, South Lake, and the Yangtze River, the connectivity among them is weak, resulting in inadequate dispersion of the cold island effect. This demonstrates that, in addition to park size, landscape connectivity is also a critical factor influencing cold island supply. This finding aligns with previous research, confirming that the mosaic distribution of cold and heat islands and the connectivity of cold island networks play a crucial role in improving thermal environmental issues. A spatially complete and well-structured cooling network can significantly reduce the continuity of negative impacts associated with high-intensity urban development (66–68).
3.4.2 Supply and demand II: relative balance between supply and demand
There are 18 units in total (Figure 14A). These units exhibit a balanced relationship between park cold island supply and residential cold island demand within a specific range. However, given the constant development of the city and the corresponding changes in residents’ demands, it is imperative to analyze these units in conjunction with the urban land use plan in order to detect any difficulties possibly requiring early warning.
3.4.3 Supply and demand III: more supply but less demand
There are 11 units in total (Figure 14A), each exhibiting a park vegetation coverage of 0.75 or higher. Additionally, all of these units either contain water bodies or are situated in close proximity to them. The supply capacity of cold islands is strong enough to meet the residents’ demand for cold islands within the unit. For example, the East Lake Scenic Area, Longyang Lake-Ink Lake Scenic Area, Moon Lake Scenic Area, Fuhe Ecological Green Wedge, Hanjiang River Ecological Axis, etc., collectively form the ecological framework of the main urban area of Wuhan and designated in the planning as the low development intensity or ecological landscape control zones, which is conducive to the sustainable development of the city and the healthy life of its inhabitants “benign balance.
4 Discussion
4.1 Urban park planning strategy for matching supply and demand of cold islands
4.1.1 Overall strategy–adaptive planning
Adaptive planning is a spatial feedback process aiming to dynamically adjust planning strategies in response to the evolving requirements of the users (69). To ensure a relative equilibrium between the supply and demand of cold islands in urban parks in the future, it is imperative to introduce the concept of adaptive planning and conduct prognostic assessments. The operational mechanism of the adaptive planning structure employed in this study is visually depicted in Figure 15. It analyses the intrinsic linkage between urban parks, cold island effects, and people. This analysis is to reveal the problems of the current space in terms of supply and demand and to assess the development potential of the future space. It can guide the adaptive planning process of urban parks, the object of adaptation, and characterize the dynamic demand changes of urban residents, the subject of adaptation (70).
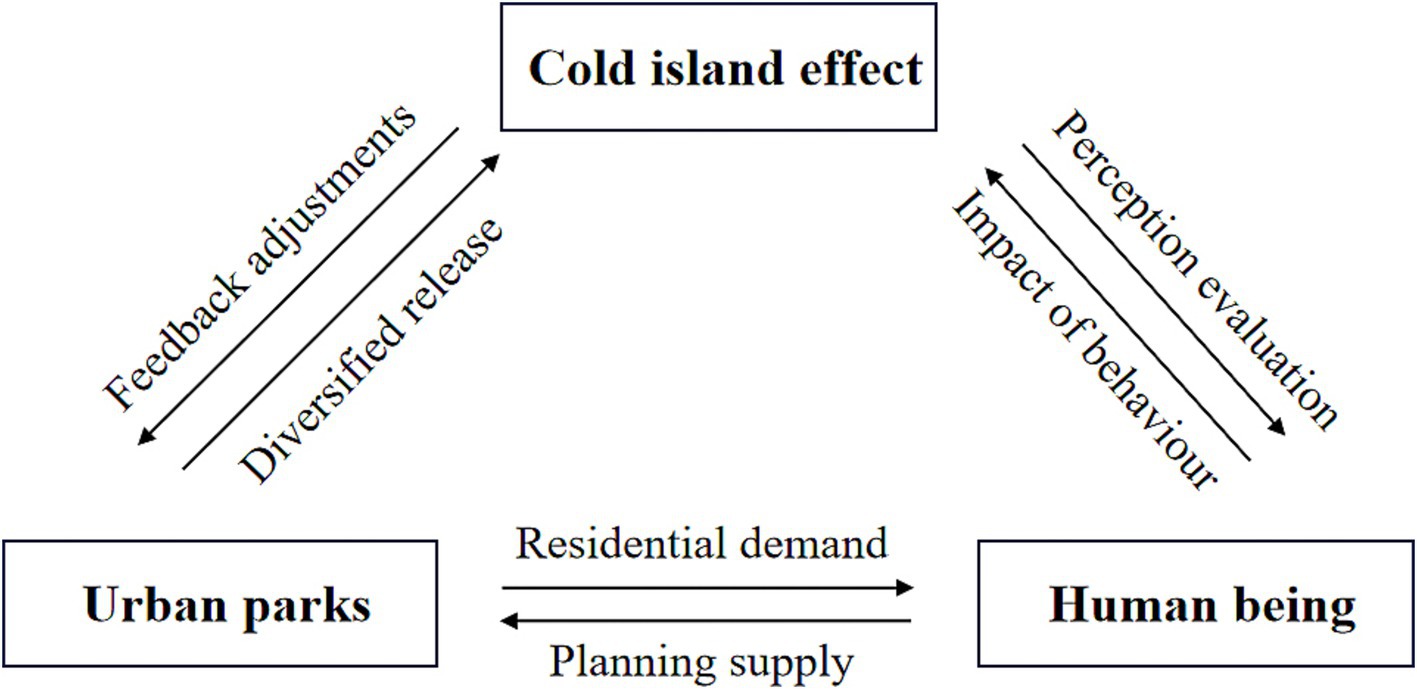
Figure 15. Operational mechanism of adaptive planning structures.
4.1.2 Typology planning strategy
Taking the evaluated supply and demand relationship as the guide for action, this study presents a set of sub-strategy that exhibit strong feasibility and serve as valuable references. These strategies aim to enhance the cold island supply level of urban parks, bolster their adaptive capacity in the future development process and allocate the limited ecological resources and service functions to the individuals and regions that require them the most.
Strategy 1: During the process of old city reconstruction, it is advisable to plan for wedge-shaped parks and expand the existing parks, thereby enhancing the accessibility to urban parks (for less supply but more demand--social supply-shortage type). Currently, Wuhan is continuously promoting old city reconstruction and gradually and piecewise carrying out scientific planning. Emphasis should be placed on incorporating the consideration of the parks’ cold island effect into the renewal planning for Hankou, Qiaokou, and Jiang’an Districts. Liudu Bridge and Unity Street can consider planning city wedge parks to connect with the Yangtze River, when carrying out old city reconstruction. Some neighborhoods in Hanzhong Street, the Friendship Neighborhood, or other neighboring areas can consider connecting with Qiaokou Park to expand the size of Qiaokou Park when undergoing renovation and renewal. Moreover, they should reserve sufficient space for the expansion of city parks to meet the future demand for cold islands in the high-density residential neighborhoods. By controlling the building density and architectural form of old renovation communities, and using more point buildings at air intakes, it can promote breeze circulation and effectively form their own fresh air systems. Through the accessibility analysis, the urban-facing joints and pedestrian entrances are increased to achieve the goal that city parks are accessible to more urban residents. For example, Northwest Lake Park, Zhongshan Park, Fountain Park, Minor South Lake Park, Treasure Island Park, Wuhan Youth Palace, and other parks and green spaces are relatively close to each other and they can consider planning the “string of pearls into a chain” of greenways. Planning greenways from residential neighborhoods to parks allows residents to reach urban parks more conveniently, improving the comfort and accessibility of paths leading to the parks. In the old city renovation, green space should be inserted in gaps or white space, and “pocket parks” with recreational and ornamental functions should be established to cover greenfield cold island service blind spots and enhance the cooling radiation effect on the neighborhood.
Strategy 2: Cold island connectivity should be enhanced and blue-green cold island corridors should be built (for less supply but more demand--ecological service-shortage type). Numerous studies have shown that cold island connectivity can improve cooling efficiency. From the southern suburbs of Wuhan along Tangxun Lake, South Lake, and East Lake to Tianxing Sandbar, a cold island corridor running through the north and south of Wuhan is constructed, passing through many heat island areas in the Wuchang and Hongshan Districts. It can cut down on the negative impacts of the heat island effect and alleviate the physical and mental discomfort due to the high temperature in summer. East Lake, South Lake, and Yezhi Lake are several essential waters in Wuchang District. They should reserve the open green space around the waters, enrich the vegetation community level, and play the synergistic cooling effect of the blue-green space to boost the overall cooling of the city.
Strategy 3: The blue-green intertwined ecological background should be restored and protected (for relative balance). It’s imperative to restore and protect the blue and green natural ecological background of the parks and to control and prevent the trend of encroachment on green spaces and water areas during urbanization. The blue-green intertwined urban parks, such as Tang Lake Unit, Sand Lake Unit, Yangchun Lake Unit, Wuhan Zoo Unit, etc., should optimize the edge shape of the blue-green space patches and keep the waterfront space with a high degree of vegetation coverage. It can not only better realize the cooling effect of the parks’ cold islands, but also provide citizens with better social and sports space thus to cope with the inevitable increase in the demand value of the cold islands in the process of urban development and to maintain the balance of supply and demand as long as possible.
Strategy4: Adequate green space should be reserved (for relative balance). Based on the early warning problems of each research unit in the relative balance zone, combined with Wuhan’s territorial spatial planning, the planning early warning strategy for the disorder of supply and demand in the development process are targeted to be proposed. The units with pieces of residential neighborhoods in the future plan, such as Jiangtan Sports Unit, Science Park Unit, Guanshan Unit, etc., should pay more attention to the budget for the number of potential residents, and analyze the accessibility of parks’ sites in the planning of urban parks. These units also are required to design community-level parks as a supplement and reserve a sufficient amount of land for green space development. This will prevent future urban area development from attracting too many residents and excessive social demand arising from socio-economic activities which will upset the existing relative balance, and enhance accurate prevention and control capability of urban thermal environmental risks.
4.2 Limitations and insights
This study represents a positive attempt to investigate the cold island effect of urban parks from a dual perspective of supply and demand. However, there are still challenges that require resolution. First of all, the cold island effect of urban parks exhibits significant spatiotemporal complexity; however, due to the inherent limitations of Landsat data, existing research predominantly focused on spatial analysis. Future studies can further investigate daily and seasonal variations in the supply and demand of the urban parks’ cold island effect by utilizing data sources with shorter revisit periods, such as MODIS (Moderate Resolution Imaging Spectroradiometer). This would help uncover the interaction mechanisms between park characteristics and meteorological factors across multiple temporal scales. Secondly, the supply and demand of the park cold island effect are influenced by multiple factors, such as internal landscape composition (71) and surrounding urban morphology (18), which were not comprehensively incorporated in the current evaluation system. Additionally, the selected indicators primarily explored urban thermal environment patterns at a two-dimensional level, lacking investigation into three-dimensional factors such as building height (BH), sky view factor (SVF), and frontal area index (FAI) (18). Future research should establish a more holistic evaluation framework for supply and demand to better analyze the complex environmental interactions surrounding urban parks. Finally, with the development of information technology, further investigation of urban parks can be conducted at a more detailed level, which should incorporate the integration of microscopic, mesoscopic, and macroscopic scales. This entails grasping the overall layout at the macroscopic scale, emphasizing the precise adjustments made at the micro level and considering the transitional function of the mesoscopic level. Future research can examine each unit on the grid scale to find the implementation points more precisely.
5 Conclusion
In the process of rapid urban development, the planning and construction of urban parks are prone to be a mismatch between supply and demand. In light of this, this paper selected 60 urban parks in the main urban area of Wuhan that effectively exert the cold island effect as the research subjects. By integrating the Thiessen polygons with the detailed regulatory planning units to delineate research units and developing the supply and demand evaluation model of the cold island effect of urban parks, this research conducted a comprehensive quantitative assessment of cooling services from both supply and demand perspectives. The interaction between the supply and demand perspectives was established by applying the location entropy theory, enabling the proposal of targeted optimization strategy for urban parks in Wuhan to achieve better supply–demand alignment. The main findings are as follows: ① The spatial distribution of cold island supply and demand exhibited significant heterogeneity. High-supply units were strongly correlated with water body distribution, while high-demand units aligned closely with population density and POI density centers, displaying a “scattered overall, locally concentrated” pattern. ② A significant supply–demand mismatch in cold island effects was observed, with 19 units (accounting for approximately 40%) exhibiting insufficient supply relative to demand. These units were predominantly concentrated in areas with complex building environments, high population density, low vegetation coverage, and poor landscape connectivity. To address these challenges, this study proposed the following optimization strategy: optimizing the scale and layout of existing parks, reserving green spaces for ecological restoration, strengthening the protection of blue-green ecological foundations, and establishing a blue-green cold island corridor network to enhance ecological connectivity.
By quantifying the residential cold island demand and the park cold island supply capacity, this study advances research on the cold island effect of urban parks at regional and city scales, offering new insights for sustainable urban development and climate adaptation planning. The findings not only provide a scientific basis for mitigating urban heat island effects but also offer decision-making support for the precise allocation of urban park resources. This research holds significant practical implications for improving urban living environments and enhancing ecological benefits with precision.
Data availability statement
The original contributions presented in the study are included in the article/Supplementary material, further inquiries can be directed to the corresponding author/s.
Author contributions
JS: Conceptualization, Data curation, Formal analysis, Funding acquisition, Methodology, Supervision, Writing – original draft, Writing – review & editing. YQ: Conceptualization, Formal analysis, Methodology, Visualization, Writing – original draft, Writing – review & editing. YL: Data curation, Formal analysis, Visualization, Writing – original draft.
Funding
The author(s) declare that financial support was received for the research and/or publication of this article. This article was supported by the National Natural Science Foundation of China (no. 72241414)—“Countermeasures and Recommendations to Promote the Reform of the National Park System”.
Conflict of interest
The authors declare that the research was conducted in the absence of any commercial or financial relationships that could be construed as a potential conflict of interest.
Generative AI statement
The authors declare that no Gen AI was used in the creation of this manuscript.
Publisher’s note
All claims expressed in this article are solely those of the authors and do not necessarily represent those of their affiliated organizations, or those of the publisher, the editors and the reviewers. Any product that may be evaluated in this article, or claim that may be made by its manufacturer, is not guaranteed or endorsed by the publisher.
Supplementary material
The Supplementary material for this article can be found online at: https://www.frontiersin.org/articles/10.3389/fpubh.2025.1523210/full#supplementary-material
Footnotes
2. ^data source: https://www.openstreetmap.org/, acquired in 2018
3. ^data source: https://lbs.amap.com/, accessed in 2018
4. ^data source: https://www.worldpop.org/, accessed in 2018
References
1. Ouyang, WL, Morakinyo, TE, Ren, C, and Ng, E. The cooling efficiency of variable greenery coverage ratios in different urban densities: a study in a subtropical climate. Build Environ. (2020) 174:106772. doi: 10.1016/j.buildenv.2020.106772
2. Li, XM, Zhou, YY, Asrar, GR, Imhoff, M, and Li, XC. The surface urban Heat Island response to urban expansion: a panel analysis for the conterminous United States. Sci Total Environ. (2017) 605-606:426–35. doi: 10.1016/j.scitotenv.2017.06.229
3. Garrett, JK, White, MP, Huang, J, Ng, S, Hui, Z, Leung, C, et al. Urban blue space and health and wellbeing in Hong Kong: results from a survey of older adults. Health Place. (2019) 55:100–10. doi: 10.1016/j.healthplace.2018.11.003
4. Liu, HM, Huang, B, Zhan, QM, Gao, SH, Li, RR, and Fan, ZY. The influence of urban form on surface urban Heat Island and its planning implications: evidence from 1288 urban clusters in China. Sustain Cities Soc. (2021) 71:102987. doi: 10.1016/j.scs.2021.102987
5. Amani-Beni, M, Zhang, B, Xie, GD, and Xu, J. Impact of Urban Park’s tree, grass and waterbody on microclimate in hot summer days: a case study of Olympic Park in Beijing, China. Urban For Urban Green. (2018) 32:1–6. doi: 10.1016/j.ufug.2018.03.016
6. Park, YJ, Guldmann, JM, and Liu, DS. Impacts of tree and building shades on the urban Heat Island: combining remote sensing, 3D Digital City and spatial regression approaches. Comput Environ Urban Syst. (2021) 88:101655. doi: 10.1016/j.compenvurbsys.2021.101655
7. Xiong, JH. An investigation of the impact of ecological landscape shaping in urban public spaces on urban climate. Chin Bull Bot. (2023) 58:671.
8. You, HY. Characterizing the inequalities in urban public green space provision in Shenzhen, China. Habitat Int. (2016) 56:176–80. doi: 10.1016/j.habitatint.2016.05.006
9. Zhong, XH, Jin, HX, Li, S, Ji, R, and Bao, ZH. Cold Island effect of Park green space and its influencing factors in Hangzhou. Chin Landsc Archit. (2022) 38:75–80. doi: 10.19775/j.cla.2022.09.0075
10. Algretawee, H. The effect of graduated Urban Park size on Park Cooling Island and distance relative to land surface temperature (LST). Urban Clim. (2022) 45:101255. doi: 10.1016/j.uclim.2022.101255
11. Yao, X, Yu, KY, Zeng, XJ, Lin, YB, Ye, BJ, Shen, XB, et al. How can urban parks be planned to mitigate urban Heat Island effect in “furnace cities”? An accumulation perspective. J Clean Prod. (2022) 330:129852. doi: 10.1016/j.jclepro.2021.129852
12. Kong, FH, Yin, HW, James, P, Hutyra, LR, and He, HS. Effects of spatial pattern of greenspace on urban cooling in a large metropolitan area of eastern China. Landsc Urban Plan. (2014) 128:35–47. doi: 10.1016/j.landurbplan.2014.04.018
13. Xie, QJ, and Li, J. Detecting the cool island effect of urban parks in Wuhan: a City on Rivers. Int J Environ Res Public Health. (2021) 18:15. doi: 10.3390/ijerph18010132
14. Di, JN, Su, T, Lei, B, Liu, XB, Meng, C, Xu, LQ, et al. Analysis of urban Heat Island effect and influencing factors based on the “source-sink” landscape pattern: a case study of Hefei. China Environ Sci. (2023) 43:6039–50. doi: 10.19674/j.cnki.issn1000-6923.20230609.001
15. Chen, Z, Chen, FM, Zhu, FG, Cao, L, Shen, XH, and Li, JX. Effects of Park size and plant community structure on Urban Park air temperature. Chin J Ecol. (2011) 30:2590–6. doi: 10.13292/j.1000-4890.2011.0377
16. Zhang, CS, Xie, GD, Lu, CX, Liu, CL, Li, N, Wang, S, et al. The mitigating effects of different urban green lands on the Heat Island effect in Beijing. Resour Sci. (2015) 37:1156–65.
17. Qiu, KB, and Jia, BQ. The roles of landscape both inside the Park and the surroundings in Park cooling effect. Sustain Cities Soc. (2020) 52:101864. doi: 10.1016/j.scs.2019.101864
18. Han, DR, Xu, XL, Qiao, Z, Wang, F, Cai, HY, An, HM, et al. The roles of surrounding 2D/3D landscapes in Park cooling effect: analysis from extreme hot and Normal weather perspectives. Build Environ. (2023) 231:110053. doi: 10.1016/j.buildenv.2023.110053
19. Aram, F, Solgi, E, García, EH, Mosavi, A, and Várkonyi-Kóczy, AR. The cooling effect of large-scale urban parks on surrounding area thermal comfort. Energies. (2019) 12:21. doi: 10.3390/en12203904
20. Shi, LJ, and Zhao, MD. Cool island effect of urban parks and impact factors in summer: a case study of Xi’ An. J Arid Land Resour Environ. (2020) 34:154–61. doi: 10.13448/j.cnki.jalre.2020.139
21. Li, MT, Yang, LB, and Wei, Y. Improved Gaussian based 2-step floating catchment area method:a case study of green space accessibility in Shanghai. Prog Geogr. (2016) 35:990–6. doi: 10.18306/dlkxjz.2016.08.008
22. Pietil, M, Neuvonen, M, Borodulin, K, Korpela, K, and Tyrvinen, L. Relationships between exposure to urban green spaces, physical activity and self-rated health. J Outdoor Recreat Tour. (2015) 10:44–54. doi: 10.1016/j.jort.2015.06.006
23. Tamosiunas, A, Grazuleviciene, R, Luksiene, D, Dedele, A, Reklaitiene, R, Baceviciene, M, et al. Accessibility and use of urban green spaces, and cardiovascular health: findings from a Kaunas cohort study. Environ Health. (2014) 13:1–11. doi: 10.1186/1476-069X-13-20
24. Sun, YW, Tan, SH, and Shen, JZ. Research on influence of Park green coverage rate on crowds emotional recovery. Landsc Archit. (2021) 28:85–91. doi: 10.14085/j.fjyl.2021.04.0085.07
25. Zhang, Q, Zhou, D, Xu, D, and Rogora, A. Correlation between cooling effect of green space and surrounding urban spatial form: evidence from 36 urban green spaces. Build Environ. (2022) 222:109375. doi: 10.1016/j.buildenv.2022.109375
26. Xie, QJ, Yang, CZ, and Ren, L. Scale effect of regulating mechanism of urban water bodies in improving thermal environment in Wuhan, China. Chin J Ecol. (2024) 43:2325–33. doi: 10.13292/j.1000-4890.202408.003
27. Fan, HY, Yu, ZW, Yang, GY, Liu, TY, Liu, TY, Hung, CH, et al. How to cool hot-humid (Asian) cities with urban trees? An optimal landscape size perspective. Agric For Meteorol. (2019) 265:338–48. doi: 10.1016/j.agrformet.2018.11.027
28. Gunawardena, KR, Wells, MJ, and Kershaw, T. Utilising green and Bluespace to mitigate urban Heat Island intensity. Sci Total Environ. (2017) 584-585:1040–55. doi: 10.1016/j.scitotenv.2017.01.158
29. Weng, QH, Rajasekar, U, and Hu, XF. Modeling urban Heat Islands and their relationship with impervious surface and vegetation abundance by using Aster images. IEEE Trans Geosci Remote Sensing. (2011) 49:4080–9. doi: 10.1109/tgrs.2011.2128874
30. Wilson, JS, Clay, M, Martin, E, Stuckey, D, and Vedder-Risch, K. Evaluating environmental influences of zoning in urban ecosystems with remote sensing. Remote Sens Environ. (2003) 86:303–21. doi: 10.1016/s0034-4257(03)00084-1
31. Bowler, DE, Buyung-Ali, L, Knight, TM, and Pullin, AS. Urban greening to cool towns and cities: a systematic review of the empirical evidence. Landsc Urban Plan. (2010) 97:147–55. doi: 10.1016/j.landurbplan.2010.05.006
32. Chen, HY, Deng, QL, Zhou, Z, Ren, ZG, and Shan, XF. Influence of land cover change on Spatio-temporal distribution of urban Heat Island -a case in Wuhan Main urban area. Sustain Cities Soc. (2022) 79:103715. doi: 10.1016/j.scs.2022.103715
33. Li, XX, Li, WW, Middel, A, Harlan, SL, Brazel, AJ, and Turner, BL. Remote sensing of the surface urban Heat Island and land architecture in Phoenix, Arizona: combined effects of land composition and configuration and cadastral-demographic-economic factors. Remote Sens Environ. (2016) 174:233–43. doi: 10.1016/j.rse.2015.12.022
34. Santamouris, M, Ban-Weiss, G, Osmond, P, Paolini, R, Synnefa, A, Cartalis, C, et al. Progress in urban greenery mitigation science - assessment methodologies advanced technologies and impact on cities. J Civ Eng Manag. (2018) 24:638–71. doi: 10.3846/jcem.2018.6604
35. Zhou, W, Shen, X, Cao, FL, and Sun, Y. Effects of area and shape of greenspace on urban cooling in Nanjing, China. J Urban Plan Dev. (2019) 145:9. doi: 10.1061/(asce)up.1943-5444.0000520
36. Yue, WZ, Qiu, SS, Xu, H, Xu, LH, and Zhang, LL. Polycentric urban development and urban thermal environment: a case of Hangzhou, China. Landsc Urban Plan. (2019) 189:58–70. doi: 10.1016/j.landurbplan.2019.04.008
37. Tao, ZL, and Cheng, Y. Research Progress of the two-step floating catchment area method and extensions. Prog Geogr. (2016) 35:589–99. doi: 10.18306/dlkxjz.2016.05.006
38. Chen, X, Dong, YK, and Wang, QS. Evaluation of seasonal supply and demand for urban parks based on improved 2SFCA model. J Shenyang Jianzhu Univ Nat Sci. (2022) 38:504–11. doi: 10.11717/j.issn:2095-1922.2022.03.15
39. Wu, KY, and Jin, JL. Attribute recognition method of regional ecological security evaluation based on combined weight on principle of relative entropy. Geogr Sci. (2008) 28:754–8. doi: 10.3969/j.issn.1000-0690.2008.06.007
40. Feng, L, and Ll, XD. Effects of heat waves on human health:a review of recent study. J Environ Health. (2016) 33:182–8. doi: 10.16241/j.cnki.1001-5914.2016.02.025
41. Mavrogianni, A, Davies, M, Batty, M, Belcher, SE, Bohnenstengel, SI, Carruthers, D, et al. The comfort, energy and health implications of London’s urban Heat Island. Build Serv Eng Res Technol. (2011) 32:35–52. doi: 10.1177/0143624410394530
42. Bokaie, M, Zarkesh, MK, Arasteh, PD, and Hosseini, A. Assessment of urban Heat Island based on the relationship between land surface temperature and land use/land cover in Tehran. Sustain Cities Soc. (2016) 23:94–104. doi: 10.1016/j.scs.2016.03.009
43. Zhao, HB, Zhang, H, Miao, CH, Ye, XY, and Min, M. Linking heat source-sink landscape patterns with analysis of urban Heat Islands: study on the fast-growing Zhengzhou City in Central China. Remote Sens. (2018) 10:22. doi: 10.3390/rs10081268
44. Yu, GL, Chen, TT, and Zhao, FQ. The influence of air temperature and temperature variability on mental health. Adv Psychol Sci. (2020) 28:1282–92. doi: 10.3724/SP.J.1042.2020.01282
45. Yue, YF, Zhan, QM, and Wang, J. Optimizing the urban thermal environment: a case study in Wuhan, China. Resour Environ Yangtze Basin. (2018) 27:286–95. doi: 10.11870/cjlyzyyhj201802007
46. Li, X. Recognition of urban polycentric structure based on spatial aggregation characteristics of poi elements: a case of Zhengzhou City. Acta Sci Nat Univ Pekin. (2020) 56:692–702. doi: 10.13209/j.0479-8023.2020.044
47. Tang, ZL, and Chen, S. An evaluation of social justice performance in the distribution of metro networks in the Central City of Shanghai. Shanghai Urban Plann Rev. (2016) 1:102–8. doi: 10.3969/j.issn.1673-8985.2016.02.020
48. Estoque, RC, Ooba, M, Seposo, XT, Togawa, T, Hijioka, Y, Takahashi, K, et al. Heat health risk assessment in Philippine cities using remotely sensed data and social-ecological indicators. Nat Commun. (2020) 11:12. doi: 10.1038/s41467-020-15218-8
49. Dou, WS, Wang, CX, Xue, MY, and Wang, ZH. Ldentification and evaluation of urban functional land based on pol data–a case study of five districts in Jinan. World Reg Stud. (2020) 29:804–13. doi: 10.3969/j.issn.1004-9479.2020.04.2019186
50. Luan, XL, Wei, S, Han, SR, Li, XT, Yang, WY, Liu, MS, et al. A multi-scale study on the formation mechanism and Main controlling factors of urban thermal field based on urban big data. Chin J Appl Ecol. (2018) 29:2861–8. doi: 10.13287/j.1001-9332.201809.015
51. Yang, AS, Juan, YH, Wen, CY, and Chang, CJ. Numerical simulation of cooling effect of vegetation enhancement in a subtropical Urban Park. Appl Energy. (2017) 192:178–200. doi: 10.1016/j.apenergy.2017.01.079
52. Zhao, B, Ll, LL, and Cao, L. Gis-based analysis of City Park green space service range and layout optimization–a case study in Huaqiao international Business City. Chin Landsc Archit. (2015) 31:95–9. doi: 10.3969/j.issn.1000-6664.2015.06.024
53. Du, HY, Cai, YL, Zhou, FQ, Jian, H, Jiang, WY, and Xu, YQ. Urban blue-green space planning based on thermal environment simulation: a case study of Shanghai, China. Ecol Indic. (2019) 106:105501. doi: 10.1016/j.ecolind.2019.105501
54. Wu, D, Wang, YF, Fan, C, and Xia, BC. Thermal environment effects and interactions of reservoirs and forests as urban blue-green infrastructures. Ecol Indic. (2018) 91:657–63. doi: 10.1016/j.ecolind.2018.04.054
55. Lin, WQ, Yu, T, Chang, XQ, Wu, WJ, and Zhang, Y. Calculating cooling extents of green parks using remote sensing: method and test. Landsc Urban Plan. (2015) 134:66–75. doi: 10.1016/j.landurbplan.2014.10.012
56. Tan, XY, Sun, X, Huang, CD, Yuan, Y, and Hou, DL. Comparison of cooling effect between green space and water body. Sustain Cities Soc. (2021) 67:102711. doi: 10.1016/j.scs.2021.102711
57. Shi, DC, Song, JY, Huang, JX, Zhuang, CQ, Guo, R, and Gao, YF. Synergistic cooling effects (Sces) of urban green-blue spaces on local thermal environment: a case study in Chongqing, China. Sustain Cities Soc. (2020) 55:102065. doi: 10.1016/j.scs.2020.102065
58. Zhou, WQ, Huang, GL, and Cadenasso, ML. Does spatial configuration matter? Understanding the effects of land cover pattern on land surface temperature in urban landscapes. Landsc Urban Plan. (2011) 102:54–63. doi: 10.1016/j.landurbplan.2011.03.009
59. Xin, RH, Zeng, J, Li, K, and Shen, ZJ. Identifying the key areas and management priorities of the imbalance between supply and demand in urban thermal environment regulation. Geogr Res. (2022) 41:3124–42. doi: 10.11821/dlyj020210757
60. Oke, TR. The energetic basis of the urban Heat-Island. Q J R Meteorol Soc. (1982) 108:1–24. doi: 10.1002/qj.49710845502
61. Feyisa, GL, Dons, K, and Meilby, H. Efficiency of parks in mitigating urban Heat Island effect: An example from Addis Ababa. Landsc Urban Plan. (2014) 123:87–95. doi: 10.1016/j.landurbplan.2013.12.008
62. Cheela, VRS, John, M, Biswas, W, and Sarker, P. Combating urban Heat Island effect-a review of reflective pavements and tree shading strategies. Buildings. (2021) 11:24. doi: 10.3390/buildings11030093
63. Yao, L, Sun, S, Song, CX, Wang, YX, and Xu, Y. Recognizing surface urban heat ‘Island’ effect and its urbanization Association in Terms of intensity, footprint, and capacity: a case study with multi-dimensional analysis in northern China. J Clean Prod. (2022) 372:18. doi: 10.1016/j.jclepro.2022.133720
64. Yu, XY, Liu, Y, Zhang, ZH, and Xiao, R. Influences of buildings on urban Heat Island based on 3d landscape metrics: An investigation of China’s 30 megacities at Micro grid-cell scale and Macro City scale. Landsc Ecol. (2021) 36:2743–62. doi: 10.1007/s10980-021-01275-x
65. Huang, JM, Chang, HY, Chen, LC, and Wang, YS. Canopy-scale built-environment characteristics and urban Heat Island effect in a tropical medium-Sized City. Sustain For. (2021) 13:17. doi: 10.3390/su13020868
66. Zhang, WP, Zhuang, ZX, Xie, MQ, Hu, Y, and Wang, QN. Construction and pattern optimization of multiscale urban Thermalenvironment network based on circuit theory: a case study of the central urban area of Chengdu. Chin Landsc Archit. (2023) 39:103–8. doi: 10.19775/j.cla.2023.04.0103
67. Peng, J, Cheng, XY, Hu, YX, and Corcoran, J. A landscape connectivity approach to mitigating the urban Heat Island effect. Landsc Ecol. (2022) 37:1707–19. doi: 10.1007/s10980-022-01439-3
68. Debbage, N, and Shepherd, JM. The urban Heat Island effect and City contiguity. Comput Environ Urban Syst. (2015) 54:181–94. doi: 10.1016/j.compenvurbsys.2015.08.002
69. Li, YH, Fan, XY, and Ma, QW. Adaptive planning of recreational space from the view of the balance of supply and demand: a case study of Xixi National Wetland Park in Hangzhou City. Econ Geogr. (2018) 38:204–11. doi: 10.15957/j.cnki.jjdl.2018.01.026
70. Fan, XY. Adaptive planning of Wetland Park from the perspective of supply and demand [Master’s degree]. Zhejiang, China: Zhejiang University (2018).
Keywords: supply and demand evaluation, cold island effect, urban parks, planning strategy, urban heat and cold islands
Citation: Song J, Qiao Y and Liu Y (2025) Evaluation of the cold island effect of the urban parks in the main urban area of Wuhan from the perspective of supply and demand. Front. Public Health. 13:1523210. doi: 10.3389/fpubh.2025.1523210
Edited by:
Xin Li, Guangxi University, ChinaReviewed by:
Ying Zhu, Xi’an University of Architecture and Technology, ChinaHuali Xiang, Zhongnan University of Economics and Law, China
Dongrui Han, Shandong Academy of Agricultural Sciences, China
Copyright © 2025 Song, Qiao and Liu. This is an open-access article distributed under the terms of the Creative Commons Attribution License (CC BY). The use, distribution or reproduction in other forums is permitted, provided the original author(s) and the copyright owner(s) are credited and that the original publication in this journal is cited, in accordance with accepted academic practice. No use, distribution or reproduction is permitted which does not comply with these terms.
*Correspondence: Jufang Song, c2p1ZmFuZ0B3aHUuZWR1LmNu