 Sara Ebrahimi
 Farideh Shiraseb
 Maryam Ladaninezhad
 Azimeh Izadi3
95% of researchers rate our articles as excellent or good
Learn more about the work of our research integrity team to safeguard the quality of each article we publish.
Find out more
ORIGINAL RESEARCH article
Front. Public Health , 14 February 2025
Sec. Public Health and Nutrition
Volume 13 - 2025 | https://doi.org/10.3389/fpubh.2025.1490937
This article is part of the Research Topic Holistic Approaches to Understanding Obesity and Metabolic Diseases in Urban Environments View all 9 articles
Background: The evidence shows that all women with obesity do not develop metabolic complications thus, they may be metabolically healthy. The lifestyle factors in combination may influence obesity phenotypes including metabolically healthy and unhealthy obesity. While previous studies examined associations between single lifestyle factors and obesity phenotype, no previous study has examined associations between lifestyle risk score (LRS) and obesity phenotypes. This study for the first time created the LRS which is a combination of lifestyle factors and investigated the LRS in relation to various obesity phenotypes among women with overweight and obesity.
Methods: This cross-sectional study analyzed 278 women referred to health centers of the Tehran University of Medical Sciences. A multistage sampling method was used to recruit the participants. The LRS was created based on diet, physical activity (PA), sleep, obesity, and sociodemographic characteristics. A binary logistic regression analysis was used to evaluate the association between obesity phenotypes and LRS.
Results: Women with higher LRS had higher body mass index (BMI) and high-sensitivity C-reactive protein (hs-CRP) while had lower high-density lipoprotein cholesterol (HDL-C), PA, education levels, sleep quality, vegetables, grains and legumes intake. Furthermore, women with higher LRS were more likely to experience metabolically unhealthy obesity (MUO).
Conclusion: This study found significant associations between higher LRS and an increased likelihood of MUO. Further prospective studies are needed to advance our understanding of the relationship between lifestyle and obesity.
The global prevalence of overweight and obesity has risen steadily since 1975, affecting all regions (1). In particular, the Eastern Mediterranean Region (EMR) has undergone a significant nutrition transition in recent decades. Obesity stands out as a major health concern in EMR countries, including Iran (2). A systematic review and meta-analysis 2021, reported that the prevalence of overweight and obesity in Iranian adults was 35 and 21%, respectively (3). Notably, obesity rates are higher among Iranian women compared to men (4). Obesity is associated with metabolic disorders and non-communicable diseases (NCDs) such as diabetes, cardiovascular diseases, non-alcoholic fatty liver disease, and cancer (5). NCDs prevalence is increasing in the EMR countries, with NCDs being the major cause of 82% of deaths in Iran in 2020 (6). However, not all people with obesity develop metabolic complications (7). Some people with obesity are not experiencing dyslipidemia, hyperglycemia, and hypertension (8). This obesity phenotype is called metabolically healthy obesity (MHO). On the other hand, the metabolically unhealthy obesity (MUO) phenotype is the state of having at least two or more metabolic disorders (9). Based on the Karelis criteria, triglyceride (TG), low-density lipoprotein cholesterol (LDL-C), high-density lipoprotein cholesterol (HDL-C), hs-CRP, and homeostatic model assessment for insulin resistance (HOMA-IR) are involved in determining MHO (10, 11).
There is limited evidence on the determinant factors of MHO and MUO. The evidence shows that higher compliance with a healthier diet and higher physical activity (PA) levels are associated with a healthier metabolic state (12, 13). Furthermore, shorter sleepers are at a higher risk of developing metabolic complications (14).
The existing evidence shows that lifestyle-related factor including adiposity is associated with a higher risk of chronic diseases (15). Central body fat distribution and impaired adipose tissue function have been shown to be the predictors of obesity-related metabolic abnormalities (16). Also, a study reported that adults with lower levels of education and income are more likely to experience MUO (17).
Obesity is related to various lifestyle factors such as diet, PA, and sleep. As a result, several factors may simultaneously affect obesity. Lifestyle factors are often interconnected, with individuals typically adopting related lifestyle patterns (18, 19). As a result, lifestyle factors should be examined together to more effectively assess their impact on health (18, 19). A priori approach provides Information on a variety of lifestyle factors that can be described by a single score. This score could be used for assessing associations between healthy and unhealthy lifestyles and health outcomes (19, 20). While previous studies have explored the relationship between individual lifestyle factors and MHO and MUO, understanding how a combination of various lifestyle factors collectively influences obesity phenotypes remains limited. Holistic approaches such as a priori and posteriori methodologies offer a comprehensive perspective by examining lifestyle factors concurrently (21). Despite the importance of exploring the combined impact of different factors on MHO and MUO, there is a paucity of evidence in this area. A study on Lebanese adults with overweight and obesity in 2020 applied the factor analysis approach for the first time and assessed the association between lifestyle patterns and MHO and MUO and found a positive link between a healthy lifestyle pattern and MHO (22). Nevertheless, no prior study has employed an a priori approach to investigate the correlations between lifestyle scores and MHO and MUO. Consequently, this study is designed to explore the associations between lifestyle risk scores (LRS) and various obesity phenotypes among Iranian women with overweight and obesity. While Middle Eastern populations including Iranians have a particular type of obesity which is characterized by abdominal fat accumulation and greater waist circumference, the evidence on the lifestyle factors in relation to obesity phenotype is scant in this population. As a result, it is of significance to advance knowledge about this region (23).
This cross-sectional study was conducted on 278 Iranian women with overweight and obesity who were referred to health centers of the Tehran University of Medical Sciences (TUMS). A multistage random sampling method was used to recruit participants from the health centers in Tehran which were affiliated with TUMS. The inclusion criteria included adult women with a BMI of ≥25 kg/m2. Individuals with a history of cardiovascular diseases, stroke, kidney disorders, liver diseases, thyroid disease, inflammatory illnesses, cancer, pregnancy, lactation, and menopause were excluded. Menopause could significantly change body composition, metabolic and hormonal changes (24, 25). Furthermore, based on the previous studies, under and over reporters of energy intakes below 800 or exceeding 4,200 kcal/day along with those with ongoing weight loss programs or taking weight loss supplements, were excluded (26–28). Women who did not respond to more than 70 questions on the food frequency questionnaire (FFQ) were excluded from participating in this study (29). A trained nutritionist conducted all the face to face interviews on one visit. This study was approved by the Ethical Committee of the Tehran University of Medical Sciences (ethics number: IR.TUMS.VCR.REC.1398.142) (30, 31). All methods were performed in accordance with the relevant guidelines and regulations. This article is prepared based on the Strengthening the Reporting of Observational Studies in Epidemiology—Nutritional Epidemiology (STROBE-Nut) reporting checklist (32).
A trained nutritionist collected the data on sociodemographic characteristics including age, education level, marital status, occupation, and income, using a questionnaire in an interview. Participants were grouped based on their education levels and employment status: high education level (bachelor degree and higher), low education level (diploma and lower), employed and non-employed. Participants were categorized into high-income (above the poverty line) and low-income (below the poverty line) based on the poverty line in Iran which was determined as 11 million and 500 thousand rials for each person in 2018. The variables including occupation, education and income, were used to measure the socioeconomic status (SES) (33). Based on the SES median score, participants were categorized into two groups: high SES (≥2) and low SES (<2). The Pittsburgh Sleep Quality Index (PSQI) was used to assess participants’ sleep quality including subjective sleep quality, sleep latency, sleep duration, habitual sleep efficiency, sleep disturbances, use of sleep medications, and daytime dysfunction. The PSQI score ranges between 0 and 21, and a total score over five indicates poor sleep quality (34). The International Physical Activity Questionnaire (IPAQ) was used to collect participants’ PA (35). PA >20 the metabolic equivalent of task (MET-h/week) and PA ≤ 20 MET-h/week, were considered high and low levels of PA, respectively.
A Seca digital scale (Germany) was used to measure participants’ body weight while the height was measured using a Seca 206 stadiometer (Germany) with a precision of 0.2 cm. Waist circumference (WC) and hip circumference (HC) were measured to the nearest 0.2 cm. The waist-to-height ratio (WHtR) was calculated as WC (cm) divided by height (cm). Given that WHtR is an indicator of early health risk linked to central obesity, two obesity categories were created; WHtR≤0.5 cm (non-obesity) and WHtR>0.5 (obesity), respectively (36, 37). Body composition was measured using a bioelectrical impedance analyzer (BIA; Inbody 770 Co., Seoul, Korea). Fat mass was measured using Dual Energy X-ray Absorptiometry (DXA) and bioelectrical Impedance Analysis.
The frequency of each food consumed over the past year was collected using a 147-item semi-quantitative FFQ by a trained nutritionist. Participants reported the frequency of consumption for a given serving of each food item over the last year on a daily, weekly, monthly, or yearly basis. Portion size for the consumed food was converted to grams per day using household measurements (38). The NUTRITIONIST-IV (version 7.0; N Squared Computing, Salem, OR, United States) was used to measure the nutrients and energy intake. Considering the strong link between obesity and cardiovascular diseases, the American Heart Association (AHA) diet score was calculated for each participant (39, 40). The AHA components include fruits and vegetables, fish and shellfish, sodium, sugar-sweetened beverages, whole grains, nuts, seeds and legumes, processed meats, and saturated fats. Scores for each component ranged from 0 to 10, with a total score ranging from 0 to 80. Participants were categorized into two groups: those with lower adherence to dietary recommendations (< 40) and those with higher adherence to dietary recommendations (≥40) (41, 42) (Supplementary Table 1).
The blood test was taken after 10–12 h of fasting in the nutrition laboratory of the Tehran University of Medical Sciences. Fasting blood glucose (FBS), triglycerides (TG), and total cholesterol (TC) were measured using the glucose oxidase-phenol 4-amino antipyrine peroxidase (GOD-PAP) and glycerol-3-phosphate oxidase–phenol 4-amino antipyrine peroxidase (GPO-PAP) methods. Low-density lipoprotein (LDL) and high-density lipoprotein (HDL) cholesterol levels were determined through direct enzymatic clearance. The evaluation was based on the ratio of triglycerides (TG) to high-density lipoprotein cholesterol (HDL-C). Aspartate transaminase (AST) and Alanine transaminase (ALT) levels were measured based on the International Federation of Clinical Chemistry and Laboratory procedures. An immunoturbidimetric test with the Pars Azmoon kit (Pars Azmoon Inc. Tehran) was used to measure hs-CRP levels. Fasting blood sugar (FBS) was evaluated using the glucose Oxidase Phenol 4-Aminoantipyrine Peroxidase method. Insulin resistance (IR) was assessed based on the Homeostatic Model Assessment-Insulin Resistance (HOMA-IR) formula: fasting serum insulin (mIU/L) * FBS (mmol/L) / 22.5. The insulin levels were measured using a radio-immune assay method (28).
Based on the previous studies, lifestyle-related factors relevant to Iranians were selected (23, 43). The variables including sleep quality, SES, WHtR, dietary behavior and PA were used to create the LRS based on the previous studies (23, 43). Participants were scored 1 if the AHA diet score was <40, PA ≤ 20 MET-h/week, PSQI>5, WHtR>0.5, SES < 2, otherwise, there were scored 0.Participants were categorized as the high LRS group if the total LRS was higher than the median (score > 2). However, participants were classified as the low LRS group if the total LRS was lower than the median (score ≤ 2) (Supplementary Table 2).
The metabolic healthy and unhealthy obesity were described based on the Karelis criteria which were used in the previous Iranian studies (28, 44, 45). The Karelis criteria have been utilized as they incorporate both insulin resistance and inflammation as practical indicators for assessing health in individuals with obesity (46). The participants were considered metabolically healthy subjects if they had four or more of the following components: triglycerides ≤1.7 mmol/L or use of lipid-lowering drugs, HDL ≥ 1.3 mmol/L, LDL ≤2.6 mmol/L, HOMA ≤2.7, and hs-CRP ≤3.0 mg/L. Otherwise, they were classified as metabolically unhealthy subjects (10, 11).
The sample size was measured using the formula below: With α = 0.05, β = 0.95, and r = 0.25, n = [(Z 1 − α + Z 1 − β) × √1 − r2]/r 2 + 2). SPSS software version 26 was used to perform the data analysis. The Kolmogorov–Smirnov test was utilized to confirm the normal distribution of dependent variables. Continuous variables were presented as mean and standard deviation while categorical variables were presented as the number and percentage. The continuous variables between the two groups were compared using a one-way analysis of variance (ANOVA), while categorical variables were compared using the chi-square test. Analysis of covariance (ANCOVA) was used to adjust the analysis for potential confounders including age, energy intake, and BMI. A binary logistic regression analysis was used to evaluate the association between obesity phenotype categories (binary dependent variable) and LRS (continuous independent variable). The analysis was adjusted for age and energy intake. The 0.05 level of significance was considered as minimal statistical significance. A p-value <0.05 was considered statistically significant.
The mean age of participants was 36.2 years (± 8.4), with an average weight of 79.4 kg (± 10.8), a BMI of 30.5 kg/m2 (± 3.6), and a WC of 94.9 cm (± 15.6). The majority of participants were married (72%), had supplementation intake (58%), had moderate SES (46%), had high LRS (65%), and were MUO (73%).
The association between the characteristics of participants over the median of LRS is presented in Table 1. After adjusting for age, energy intake, BMI, women with higher LRS had lower PA (p = 0.035), lower HDL (p = 0.041) and higher hs-CRP (p = 0.040) than women with lower LRS. The majority of women with higher LRS had lower education levels (p < 0.001) and poor sleep quality (p < 0.001).

Table 1. Characteristics of participants over the median of LRS (n = 278).
Participants’ dietary intake over the median of LRS is presented in Table 2. Women with higher LRS had a lower intake of vegetables (p = 0.038), whole grains (p = 0.007), and legumes (p = 0.006) than women with lower LRS.
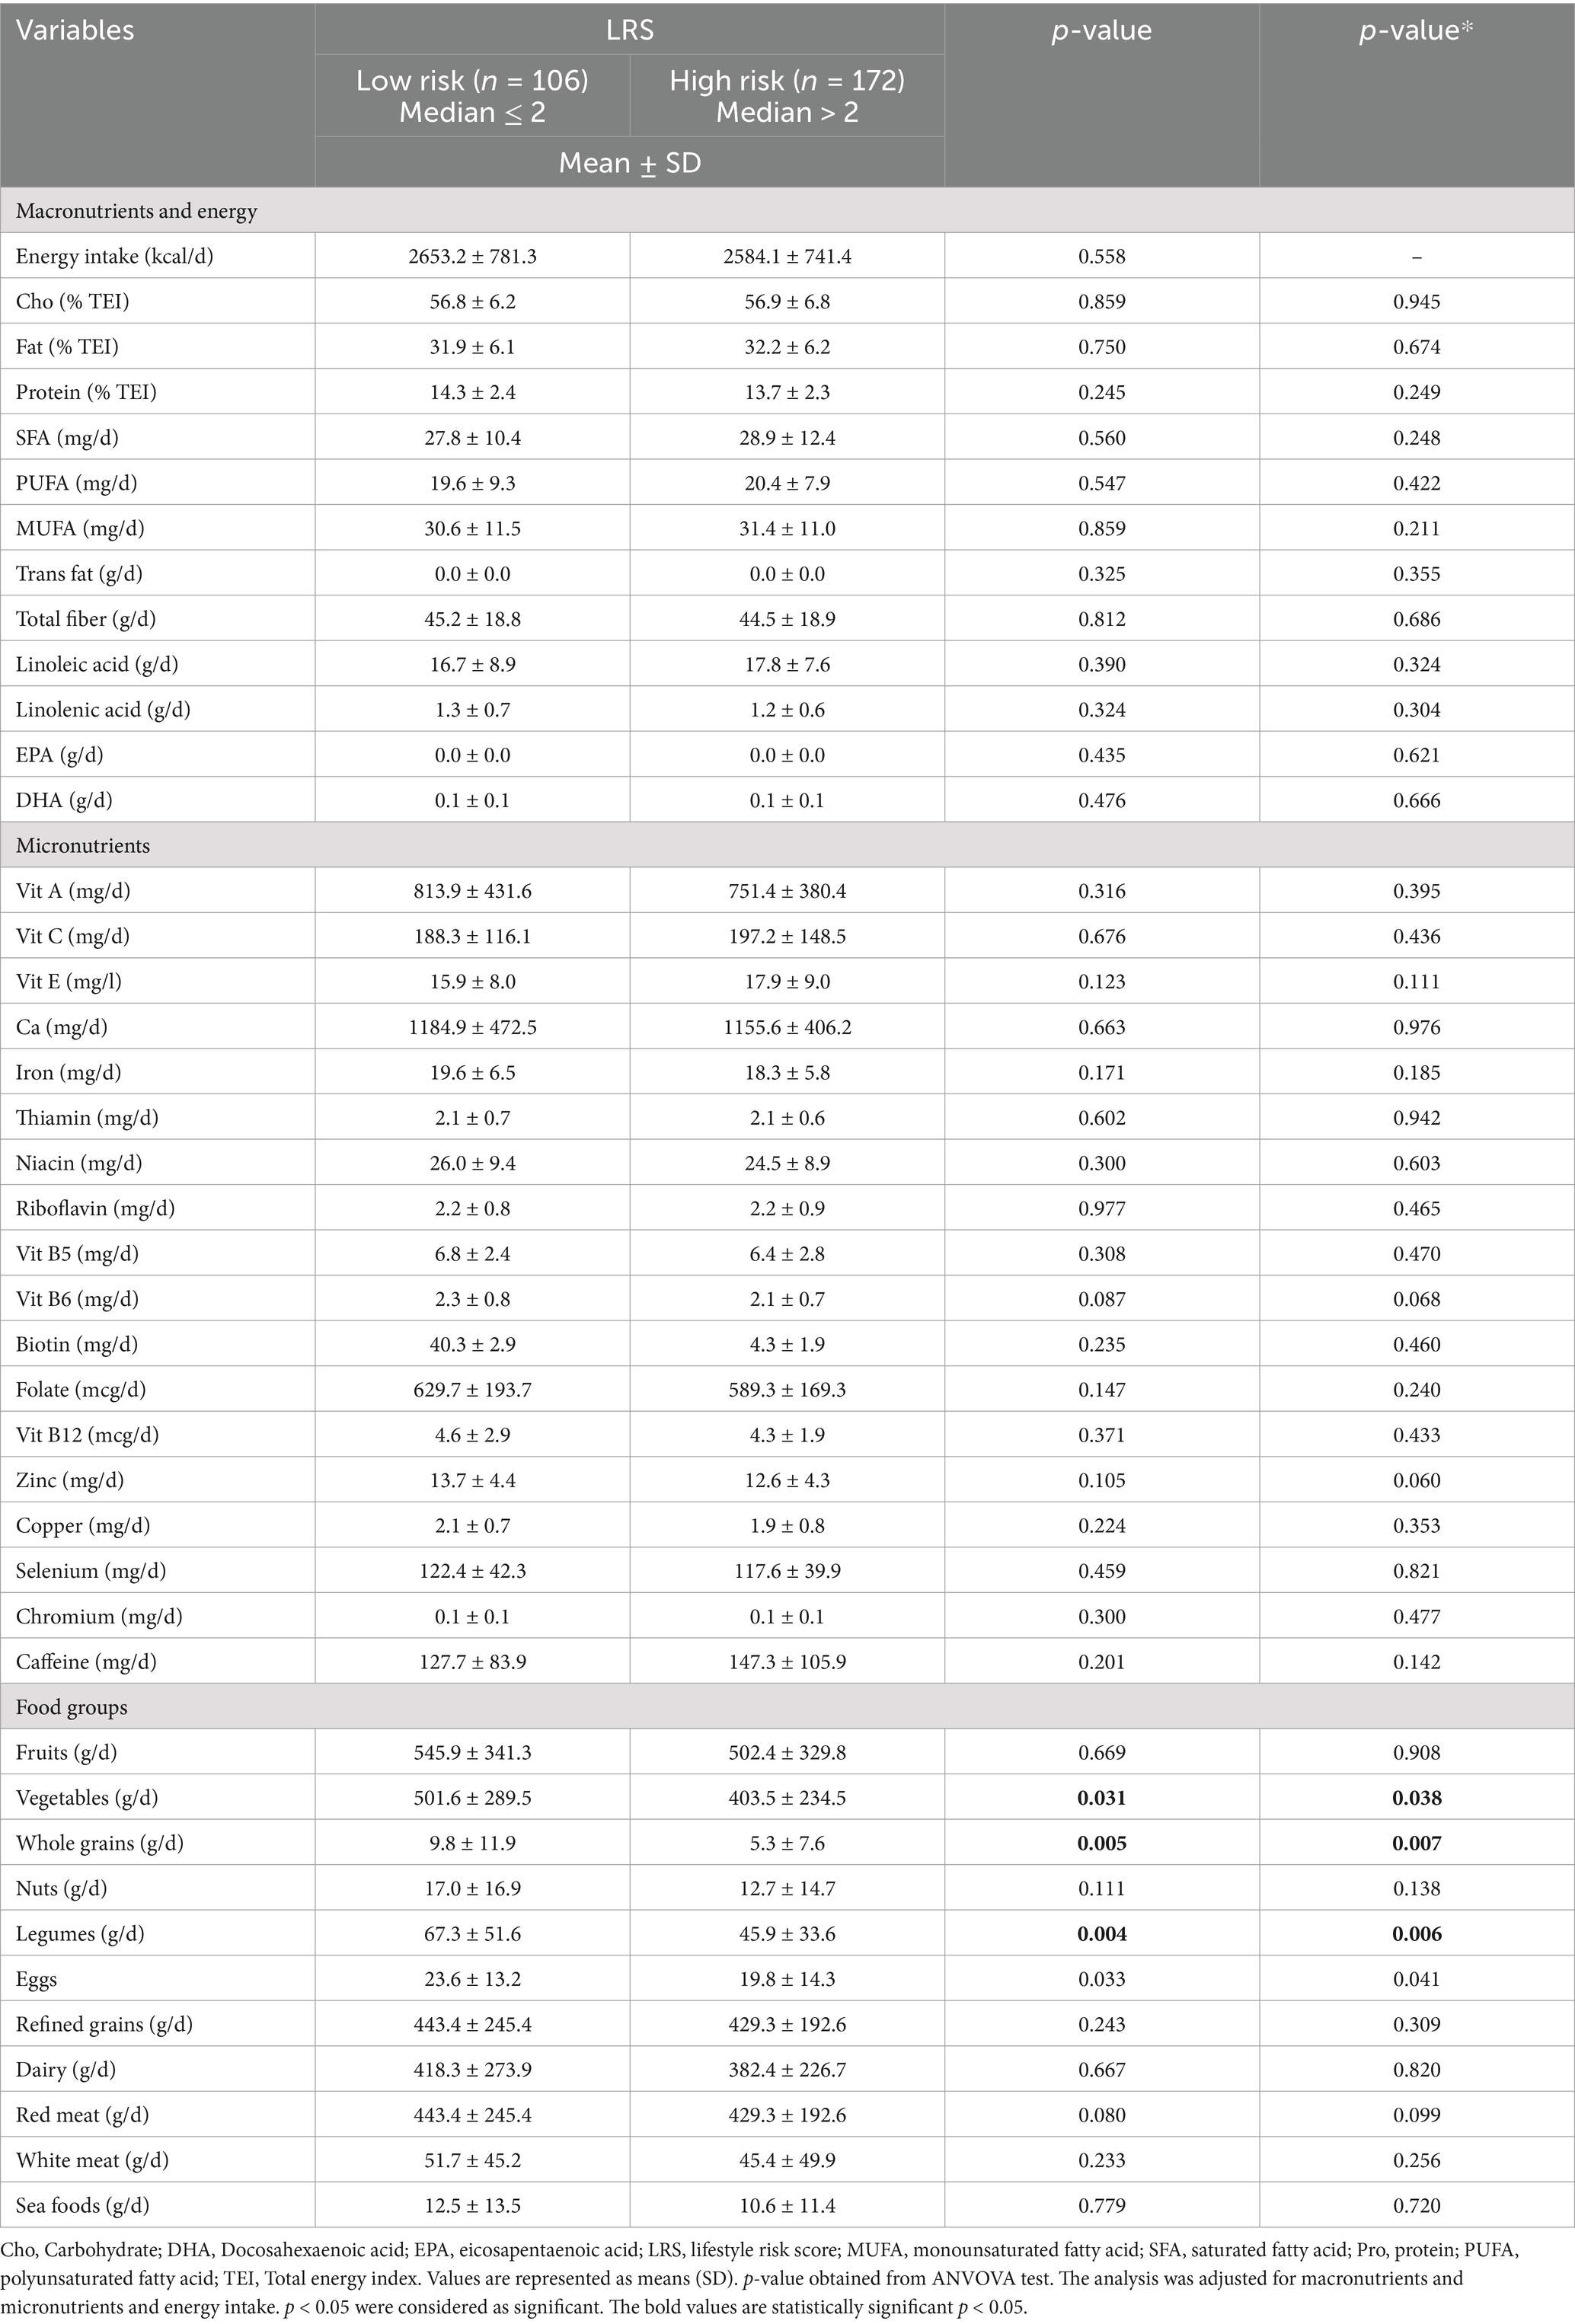
Table 2. Dietary intake over the median of LRS (n = 278).
The association between LRS and obesity phenotype is found in Table 3. Women with higher LRS were more likely to be MUO (OR = 2.5, 95% CI = 1.3, 4.9, p = 0.01). After controlling for age and energy intake, there was a significant positive association between higher LRS and MUO (OR = 2.4, 95% CI = 1.2, 4.7, p = 0.01).
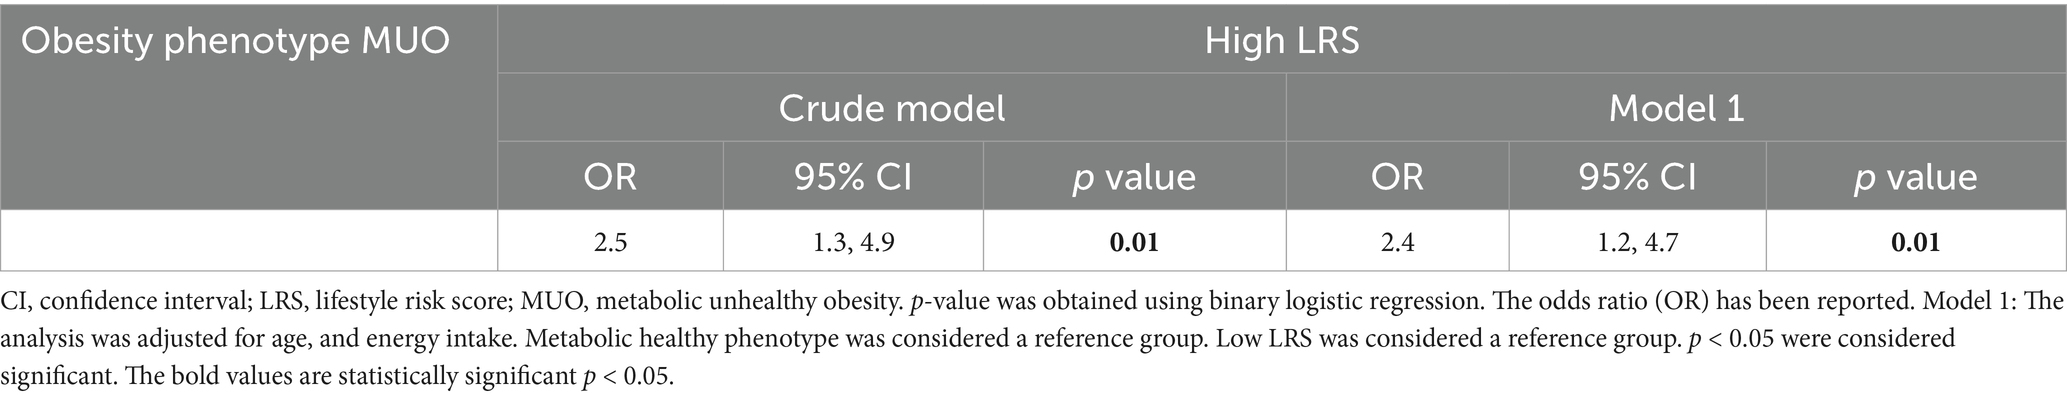
Table 3. Associations between obesity phenotypes and LRS (n = 278).
To the best of our knowledge, this study, for the first time, applied a priori approach to examine the LRS in relation to obesity phenotype. For developing the LRS, dietary intake, PA, sleep quality, WHtR, and SES were involved. The primary finding indicates that women with higher LRS are more likely to experience MUO.
This study demonstrated that women with higher LRS were at a greater risk of developing MUO. Our findings underscore the impact of lifestyle factors on obesity, particularly the role of PA. Women with higher LRS, indicative of unhealthier lifestyles, demonstrated lower levels of PA. The evidence consistently supports the positive influence of PA on metabolic health, with benefits including improved lipid profiles, insulin sensitivity, glucose uptake, and reduced blood pressure and inflammation (13, 47, 48). Furthermore, PA levels are found to be inversely associated with CRP levels (49). While no previous study assessed the LRS in relation to obesity phenotype, only one study employed an empirical approach and examined a combination of lifestyle factors in relation to obesity phenotype. (22) In accordance with our findings, a cross-sectional study by Naja et al. investigated 350 Lebanese adults and found a positive association between a healthier lifestyle pattern and MHO. This healthier lifestyle pattern was characterized by increased levels of PA (22). However, findings from studies examining the relationship between PA and obesity phenotype are inconsistent. While Farabi et al. and Lopez-Garcia et al. on 99 and 11,520 adults from America and Spain found that the MHO group had higher levels of PA than the MUO group (50, 51). A study on 3,807 adults from Irland did not find any difference in the levels of PA between MUO and MHO groups (52).
The positive association between higher LRS or unhealthier lifestyle and MUO might be due to dietary intake. Participants with lower LRS had a higher intake of whole grains, legumes and vegetables. Vegetables, whole grains and legumes have a high content of fibers, vitamin C, vitamin A, carotenoids, and phytochemicals, which are protective compounds against inflammation and oxidative stress (53). Consistent with our findings, Naja et al.2020 showed that a healthier lifestyle pattern characterized by a higher intake of fruits, vegetables, and legumes was positively linked to MHO (22). Furthermore, a study on 203 Iranian adolescents with overweight and obesity found that higher vegetable intake was negatively associated with MUO risk (54). Also a study on 137 adults with obesity from Brazil found that participants with MHO had a higher diet quality index (55).
A direct link between higher LRS and MUO may be explained by the sociodemgraphic characteristics of study participants. The majority of women with higher LRS had lower levels of education. There is limited evidence on the association between education levels and MHO and MUO. In line with our findings, two studies on 20,430 US adults and 11,520 Spanish adults found that participants with obesity and MUO had lower levels of education (17, 51). A study on 1,073 students from a Mexican university reported that higher education levels were associated with better metabolic health (56). There is abundant evidence indicating that a higher level of education is associated with improved health results and people with higher levels of education are more likely to follow the healthier behavior (56–59). Furthermore, the majority of participants with higher LRS had poor sleep quality. A study on 1,777 US adults reported that participants with sleep complications were less likely to be MHO. While the relationship between sleep and obesity phenotype is still unclear, the evidence shows that chronic lack of sleep results in weight gain through endocrine pathways including leptin and ghrelin which regulate appetite. Poor sleep quality is also associated with higher inflammation, increased sympathetic nervous system activity, insulin resistance, cardiometabolic dysfunction and obesity (60–62).
This study has several limitations that need to be taken into consideration. Firstly, the study design is cross-sectional which is susceptible to reverse causality when examining associations between the LRS and obesity phenotypes. Secondly, dietary intake was assessed through the FFQ, which introduces the potential for memory bias. Thirdly, it is important to note that the study participants were exclusively women from Tehran, making the sample non-representative of the entire Iranian population. Fourthly, this study used the Karelis criteria which does not account for blood pressure. This limitation should be taken into account while comparing the findings of this study with the studies that considered blood pressure to define obesity phenotype. Fifthly, this study used a priori approach to create LRS which has limitations. The indices are created based on the current knowledge and the evidence. As a result, this approach is limited by the existing evidence (20). Lastly, the majority of participants were MUO which could influence the findings of this study. This study has a number of strengths. To the best of our knowledge, for the first time, this study applied an a priori approach, created the LRS and examined associations between the LRS and obesity phenotypes. The analysis of this study was controlled for several confounding factors. Given the obesity is more prevalent in the women from the EMR than men, this study included Iranian women with overweight and obesity.
This study, used a novel a priori approach through the creation of LRS, showed significant associations between an unhealthier lifestyle, as indicated by a higher LRS, and an increased likelihood of MUO in Iranian women with overweight and obesity. The study highlights the intricate interplay between lifestyle elements and obesity phenotypes, emphasizing the need for comprehensive interventions addressing multiple factors to promote metabolic health. However, the study’s cross-sectional nature introduces limitations, and further research, ideally incorporating longitudinal designs and diverse populations, is warranted to validate these associations and enhance our understanding of the complex relationship between lifestyle and obesity.
The raw data supporting the conclusions of this article will be made available by the authors, without undue reservation.
The studies involving humans were approved by the Human Ethics Committee of Tehran University of Medical Sciences (Ethics Number: IR.TUMS.VCR.REC.1398.142). The studies were conducted in accordance with the local legislation and institutional requirements. The participants provided their written informed consent to participate in this study.
SE: Writing – original draft, Writing – review & editing. FS: Writing – review & editing. ML: Writing – review & editing. AI: Writing – review & editing. NN: Writing – review & editing. KM: Writing – review & editing.
The author(s) declare that financial support was received for the research, authorship, and/or publication of this article. This study is funded by grants from the Tehran University of Medical Sciences (TUMS; grant ID:97–03–161-41017).
We are grateful to all of the participants for their contribution to this research study.
The authors declare that the research was conducted in the absence of any commercial or financial relationships that could be construed as a potential conflict of interest.
All claims expressed in this article are solely those of the authors and do not necessarily represent those of their affiliated organizations, or those of the publisher, the editors and the reviewers. Any product that may be evaluated in this article, or claim that may be made by its manufacturer, is not guaranteed or endorsed by the publisher.
The Supplementary material for this article can be found online at: https://www.frontiersin.org/articles/10.3389/fpubh.2025.1490937/full#supplementary-material
1. World Health Organization. Obesity and overweight (2024); Available from: https://www.who.int/news-room/fact-sheets/detail/obesity-and-overweight (Accessed November 21, 2024).
2. World Health Organization. Regional strategy on nutrition 2010–2019.(2019); Available from: https://applications.emro.who.int/docs/EM_RC57_4_en.pdf (Accessed November 21, 2024).
3. Abiri, B, Ahmadi, AR, Amini, S, Akbari, M, Hosseinpanah, F, Madinehzad, SA, et al. Prevalence of overweight and obesity among Iranian population: a systematic review and meta-analysis. J Health Popul Nutr. (2023) 42:70. doi: 10.1186/s41043-023-00419-w
4. Djalalinia, S, Saeedi Moghaddam, S, Sheidaei, A, Rezaei, N, Naghibi Iravani, SS, Modirian, M, et al. Patterns of obesity and overweight in the Iranian population: findings of STEPs 2016. Front Endocrinol. (2020) 11:42. doi: 10.3389/fendo.2020.00042
5. Yang, M, Liu, S, and Zhang, C. The related metabolic diseases and treatments of obesity. Health. (2022) 10:616. doi: 10.3390/healthcare10091616
6. World Health Organization. Noncommunicable diseases: progress monitor 2022. (2022). Available at: https://iris.who.int/bitstream/handle/10665/353048/9789240047761-eng.pdf?sequence=1
7. Oh, CM, Park, JH, Chung, HS, Yu, JM, Chung, W, Kang, JG, et al. Effect of body shape on the development of cardiovascular disease in individuals with metabolically healthy obesity. Medicine (Baltimore). (2020) 99:e22036. doi: 10.1097/MD.0000000000022036
9. Tang, HN. Higher serum neuropeptide Y levels are associated with metabolically unhealthy obesity in obese Chinese adults: a cross-sectional study. Mediat Inflamm. (2020) 2020:7903140. doi: 10.1155/2020/7903140
10. Karelis, AD, and Rabasa-Lhoret, R. Inclusion of C-reactive protein in the identification of metabolically healthy but obese (MHO) individuals. Diabetes Metab. (2008) 34:183–4. doi: 10.1016/j.diabet.2007.11.004
11. Karelis, AD, Brochu, M, and Rabasa-Lhoret, R. Can we identify metabolically healthy but obese individuals (MHO)? Diabetes Metab. (2004) 30:569–72. doi: 10.1016/S1262-3636(07)70156-8
12. Leone, A, de Amicis, R, Battezzati, A, and Bertoli, S. Adherence to the Mediterranean diet and risk of metabolically unhealthy obesity in women: a cross-sectional study. Front Nutr. (2022) 9:858206. doi: 10.3389/fnut.2022.858206
13. Murlasits, Z, Kupai, K, and Kneffel, Z. Role of physical activity and cardiorespiratory fitness in metabolically healthy obesity: a narrative review. BMJ Open Sport Exerc Med. (2022) 8:e001458. doi: 10.1136/bmjsem-2022-001458
14. Torres-Castillo, N, Martinez-Lopez, E, Vizmanos-Lamotte, B, and Garaulet, M. Healthy obese subjects differ in Chronotype, sleep habits, and adipose tissue fatty acid composition from their non-healthy counterparts. Nutrients. (2021) 13:119. doi: 10.3390/nu13010119
15. Loef, M, and Walach, H. The combined effects of healthy lifestyle behaviors on all cause mortality: a systematic review and meta-analysis. Prev Med. (2012) 55:163–70. doi: 10.1016/j.ypmed.2012.06.017
16. Iacobini, C, Pugliese, G, Blasetti Fantauzzi, C, Federici, M, and Menini, S. Metabolically healthy versus metabolically unhealthy obesity. Metabolism. (2019) 92:51–60. doi: 10.1016/j.metabol.2018.11.009
17. Wang, J-S, Xia, PF, Ma, MN, Li, Y, Geng, TT, Zhang, YB, et al. Trends in the prevalence of metabolically healthy obesity among US adults, 1999-2018. JAMA Netw Open. (2023) 6:e232145–5. doi: 10.1001/jamanetworkopen.2023.2145
18. Rassy, N, van Straaten, A, Carette, C, Hamer, M, Rives-Lange, C, and Czernichow, S. Association of Healthy Lifestyle Factors and Obesity-Related Diseases in adults in the UK. JAMA Netw Open. (2023) 6:e2314741. doi: 10.1001/jamanetworkopen.2023.14741
19. Sultana, S, Rahman, MM, Sigel, B, and Hashizume, M. Associations of lifestyle risk factors with overweight or obesity among adolescents: a multicountry analysis. Am J Clin Nutr. (2021) 113:742–50. doi: 10.1093/ajcn/nqaa337
20. Schulze, MB, Martínez-González, MA, Fung, TT, Lichtenstein, AH, and Forouhi, NG. Food based dietary patterns and chronic disease prevention. BMJ. (2018) 361:k2396. doi: 10.1136/bmj.k2396
21. Al Thani, M. A ‘high risk’ lifestyle pattern is associated with metabolic syndrome among Qatari women of reproductive age: a cross-sectional national study. Int J Mol Sci. (2016) 17:698. doi: 10.3390/ijms17060698
22. Naja, F, Itani, L, Nasrallah, MP, Chami, H, Tamim, H, and Nasreddine, L. A healthy lifestyle pattern is associated with a metabolically healthy phenotype in overweight and obese adults: a cross-sectional study. Eur J Nutr. (2020) 59:2145–58. doi: 10.1007/s00394-019-02063-9
23. Sadeghi, O, Eshaghian, N, Keshteli, AH, Askari, G, Esmaillzadeh, A, and Adibi, P. Association of combined healthy lifestyle with general and abdominal obesity. Frontiers. Nutrition. (2024) 10:10. doi: 10.3389/fnut.2023.1332234
24. Fenton, A. Weight, shape, and body composition changes at menopause. J Midlife Health. (2021) 12:187–92. doi: 10.4103/jmh.jmh_123_21
25. Ahmed, HS. Metabolic and hormonal changes associated with menopause. Mustansiriya Medical J. (2017) 16:77. doi: 10.4103/2070-1128.249497
26. Esmaillzadeh, A, and Azadbakht, L. Major dietary patterns in relation to general obesity and central adiposity among Iranian women. J Nutr. (2008) 138:358–63. doi: 10.1093/jn/138.2.358
27. Mohammadshahi, M. A randomized clinical trial of nutrition education for improvement of diet quality and inflammation in Iranian obese women. J Nutr Metab. (2014) 2014:605782. doi: 10.1155/2014/605782
28. Pourreza, S, Mirzababaei, A, Naeini, F, Naghshi, S, and Mirzaei, K. Association of dietary phytochemical index with metabolically unhealthy overweight/obesity phenotype among Iranian women: a cross-sectional study. Front Nutr. (2022) 9:959341. doi: 10.3389/fnut.2022.959341
29. Azizi, F, Ghanbarian, A, Madjid, M, and Rahmani, M. Distribution of blood pressure and prevalence of hypertension in Tehran adult population: Tehran lipid and glucose study (TLGS), 1999-2000. J Hum Hypertens. (2002) 16:305–12. doi: 10.1038/sj.jhh.1001399
30. Golmohammadi, A, Ebrahimi, S, Shiraseb, F, Asjodi, F, Hosseini, AM, and Mirzaei, K. The association between dietary polyphenols intake and sleep quality, and mental health in overweight and obese women. PharmaNutrition. (2023) 24:100338. doi: 10.1016/j.phanu.2023.100338
31. Hajmir, MM, Shiraseb, F, Ebrahimi, S, Noori, S, Ghaffarian-Ensaf, R, and Mirzaei, K. Interaction between ultra-processed food intake and genetic risk score on mental health and sleep quality. Eat Weight Disord. (2022) 27:3609–25. doi: 10.1007/s40519-022-01501-8
32. Lachat, C, Hawwash, D, Ocké, MC, Berg, C, Forsum, E, Hörnell, A, et al. Strengthening the reporting of observational studies in epidemiology–nutritional epidemiology (STROBE-nut): an extension of the STROBE statement. Nutr Bull. (2016) 41:240–51. doi: 10.1111/nbu.12217
33. Shafiei, S, Yazdani, S, Jadidfard, MP, and Zafarmand, AH. Measurement components of socioeconomic status in health-related studies in Iran. BMC Res Notes. (2019) 12:70. doi: 10.1186/s13104-019-4101-y
34. Buysse, DJ, Reynolds, CF III, Monk, TH, Berman, SR, and Kupfer, DJ. The Pittsburgh sleep quality index: a new instrument for psychiatric practice and research. Psychiatry Res. (1989) 28:193–213. doi: 10.1016/0165-1781(89)90047-4
35. Craig, CL. International physical activity questionnaire: 12-country reliability and validity. Med Sci Sports Exerc. (2003) 35:1381–95. doi: 10.1249/01.MSS.0000078924.61453.FB
36. Yoo, EG. Waist-to-height ratio as a screening tool for obesity and cardiometabolic risk. Korean J Pediatr. (2016) 59:425–31. doi: 10.3345/kjp.2016.59.11.425
37. Ashwell, M, and Gibson, S. Waist-to-height ratio as an indicator of 'early health risk': simpler and more predictive than using a 'matrix' based on BMI and waist circumference. BMJ Open. (2016) 6:e010159. doi: 10.1136/bmjopen-2015-010159
38. Toorang, F, Sasanfar, B, Esmaillzadeh, A, Ebrahimpour-Koujan, S, and Zendehdel, K. Comparison of validity of the food frequency questionnaire and the diet history questionnaire for assessment of energy and nutrients intakes in an Iranian population. East Mediterr Health J. (2020) 26:1062–9. doi: 10.26719/emhj.19.099
39. Van Horn, L. Recommended dietary pattern to achieve adherence to the American Heart Association/American College of Cardiology (AHA/ACC) guidelines: a scientific statement from the American Heart Association. Circulation. (2016) 134:e505–29. doi: 10.1161/CIR.0000000000000462
40. Dwivedi, AK, Dubey, P, Cistola, DP, and Reddy, SY. Association between obesity and cardiovascular outcomes: updated evidence from Meta-analysis studies. Curr Cardiol Rep. (2020) 22:25. doi: 10.1007/s11886-020-1273-y
41. Benjamin, EJ, Blaha, MJ, Chiuve, SE, Cushman, M, das, S, Deo, R, et al. Heart disease and stroke Statistics-2017 update: a report from the American Heart Association. Circulation. (2017) 135:e146–603. doi: 10.1161/CIR.0000000000000485
42. Lloyd-Jones, DM, Hong, Y, Labarthe, D, Mozaffarian, D, Appel, LJ, van Horn, L, et al. Defining and setting national goals for cardiovascular health promotion and disease reduction: the American Heart Association's strategic impact goal through 2020 and beyond. Circulation. (2010) 121:586–613. doi: 10.1161/CIRCULATIONAHA.109.192703
43. Nechuta, SJ, Shu, XO, Li, HL, Yang, G, Xiang, YB, Cai, H, et al. Combined impact of lifestyle-related factors on total and cause-specific mortality among Chinese women: prospective cohort study. PLoS Med. (2010) 7:e1000339. doi: 10.1371/journal.pmed.1000339
44. Rasaei, N, Mirzababaei, A, Arghavani, H, Tajik, S, Keshavarz, SA, Yekaninejad, MS, et al. A comparison of the sensitivity and specificity of anthropometric measurements to predict unhealthy metabolic phenotype in overweight and obese women. Diabetes Metab Syndr. (2018) 12:1147–53. doi: 10.1016/j.dsx.2018.06.023
45. Mirzababaei, A, Sajjadi, SF, Ghodoosi, N, Pooyan, S, Arghavani, H, Yekaninejad, MS, et al. Relations of major dietary patterns and metabolically unhealthy overweight/obesity phenotypes among Iranian women. Diabetes Metab Syndr. (2019) 13:322–31. doi: 10.1016/j.dsx.2018.09.012
46. Hinnouho, GM, Czernichow, S, Dugravot, A, Batty, GD, Kivimaki, M, and Singh-Manoux, A. Metabolically healthy obesity and risk of mortality: does the definition of metabolic health matter? Diabetes Care. (2013) 36:2294–300. doi: 10.2337/dc12-1654
47. Egan, B, and Zierath, JR. Exercise metabolism and the molecular regulation of skeletal muscle adaptation. Cell Metab. (2013) 17:162–84. doi: 10.1016/j.cmet.2012.12.012
48. Martínez-Montoro, JI, Benítez-Porres, J, Tinahones, FJ, Ortega-Gómez, A, and Murri, M. Effects of exercise timing on metabolic health. Obes Rev. (2023) 24:e13599. doi: 10.1111/obr.13599
49. Kokkinos, P, and Myers, J. Exercise and physical activity: clinical outcomes and applications. Circulation. (2010) 122:1637–48. doi: 10.1161/CIRCULATIONAHA.110.948349
50. Farabi, SS, Smith, GI, Schweitzer, GG, Stein, RI, and Klein, S. Do lifestyle factors and quality of life differ in people with metabolically healthy and unhealthy obesity? Int J Obes. (2022) 46:1778–85. doi: 10.1038/s41366-022-01180-6
51. Lopez-Garcia, E, Guallar-Castillon, P, Leon-Muñoz, L, and Rodriguez-Artalejo, F. Prevalence and determinants of metabolically healthy obesity in Spain. Atherosclerosis. (2013) 231:152–7. doi: 10.1016/j.atherosclerosis.2013.09.003
52. Phillips, CM, Dillon, C, Harrington, JM, McCarthy, VJC, Kearney, PM, Fitzgerald, AP, et al. Defining metabolically healthy obesity: role of dietary and lifestyle factors. PLoS One. (2013) 8:e76188. doi: 10.1371/journal.pone.0076188
53. Holt, EM, Steffen, LM, Moran, A, Basu, S, Steinberger, J, Ross, JA, et al. Fruit and vegetable consumption and its relation to markers of inflammation and oxidative stress in adolescents. J Am Diet Assoc. (2009) 109:414–21. doi: 10.1016/j.jada.2008.11.036
54. Tirani, SA, Mirzaei, S, Asadi, A, Asjodi, F, Iravani, O, Akhlaghi, M, et al. Associations of fruit and vegetable intake with metabolic health status in overweight and obese youth. Ann Nutr Metab. (2023) 79:361–71. doi: 10.1159/000533343
55. Açik, M, and Çakiroğlu, FP. Comparison of dietary quality (healthy eating Index-2010) according to metabolic health status in obesity: a cross-sectional study. Prog Nutr. (2019) 21:347–55. doi: 10.23751/pn.v21i2.7689
56. Stephens, CR, Easton, JF, Robles-Cabrera, A, Fossion, R, de la Cruz, L, Martínez-Tapia, R, et al. The impact of education and age on metabolic disorders. Front Public Health. (2020) 8:180. doi: 10.3389/fpubh.2020.00180
57. Braveman, P, Egerter, S, and Williams, DR. The social determinants of health: coming of age. Annu Rev Public Health. (2011) 32:381–98. doi: 10.1146/annurev-publhealth-031210-101218
58. Bann, D, Hamer, M, Parsons, S, Ploubidis, GB, and Sullivan, A. Does an elite education benefit health? Findings from the 1970 British cohort study. Int J Epidemiol. (2017) 46:293–302. doi: 10.1093/ije/dyw045
59. Lawrence, EM. Why do College graduates behave more healthfully than those who are less educated? J Health Soc Behav. (2017) 58:291–306. doi: 10.1177/0022146517715671
60. Kanagasabai, T. Association between sleep habits and metabolically healthy obesity in adults: a cross-sectional study. J Obes. (2017) 2017:5272984. doi: 10.1155/2017/527298
61. Spiegel, K, Knutson, K, Leproult, R, Tasali, E, and Cauter, EV. Sleep loss: a novel risk factor for insulin resistance and type 2 diabetes. J Appl Physiol. (1985) 99:2008–19. doi: 10.1152/japplphysiol.00660.2005
Keywords: lifestyle risk score, obesity phenotypes, metabolically healthy obesity, metabolically unhealthy obesity, healthy lifestyle
Citation: Ebrahimi S, Shiraseb F, Ladaninezhad M, Izadi A, Navaei N and Mirzaei K (2025) The association between the lifestyle risk score and metabolically healthy and unhealthy obesity phenotype in Iranian women with overweight and obesity: a cross-sectional study. Front. Public Health. 13:1490937. doi: 10.3389/fpubh.2025.1490937
Edited by:
Emmanuel Cohen, UMR7206 Eco Anthropologie et Ethnobiologie (EAE), FranceReviewed by:
Ghadeer S. Aljuraiban, King Saud University, Saudi ArabiaCopyright © 2025 Ebrahimi, Shiraseb, Ladaninezhad, Izadi, Navaei and Mirzaei. This is an open-access article distributed under the terms of the Creative Commons Attribution License (CC BY). The use, distribution or reproduction in other forums is permitted, provided the original author(s) and the copyright owner(s) are credited and that the original publication in this journal is cited, in accordance with accepted academic practice. No use, distribution or reproduction is permitted which does not comply with these terms.
*Correspondence: Khadijeh Mirzaei, bWlyemFlaV9raEB0dW1zLmFjLmly
Disclaimer: All claims expressed in this article are solely those of the authors and do not necessarily represent those of their affiliated organizations, or those of the publisher, the editors and the reviewers. Any product that may be evaluated in this article or claim that may be made by its manufacturer is not guaranteed or endorsed by the publisher.
Research integrity at Frontiers
Learn more about the work of our research integrity team to safeguard the quality of each article we publish.