- 1Department of Gastroenterology, First Hospital of Quanzhou Affiliated to Fujian Medical University, Quanzhou, Fujian, China
- 2McConnell Brain Imaging Centre, Montreal Neurological Institute, McGill University, Montreal, QC, Canada
Objective: This study investigates the association between phenotypic age acceleration (PAA) and all-cause and cause-specific mortality in obese individuals.
Methods: Data were drawn from the National Health and Nutrition Examination Survey (NHANES) between 1999 and 2018, including 9,925 obese adults (BMI ≥ 30 kg/m2). PAA, defined as phenotypic age exceeding chronological age, was assessed using clinical biomarkers. Kaplan-Meier survival analysis and Cox proportional hazards models were used to assess the relationship between PAA and all-cause, cardiovascular, and cancer mortality, adjusting for covariates such as age, gender, race, lifestyle, and health status. Subgroup and sensitivity analyses were performed to ensure the robustness of the findings.
Results: During a median follow-up of 10.6 years, 1,537 deaths were recorded, including 419 from cardiovascular disease and 357 from cancer. PAA was significantly associated with all-cause mortality (HR = 1.84, 95% CI: 1.64–2.06), cardiovascular mortality (HR = 1.86, 95% CI: 1.50–2.31), and cancer mortality (HR = 1.47, 95% CI: 1.17–1.85). These associations remained significant after adjusting for multiple variables, and sensitivity analyses confirmed the robustness of the results.
Conclusion: PAA is an independent predictor of all-cause, cardiovascular, and cancer mortality in obese individuals. This study highlights the importance of PAA in mortality risk assessment and health management in the obese population.
1 Introduction
Obesity is a complex metabolic disease and has become a significant global public health issue, placing a heavy burden on healthcare systems (1, 2). Obesity is closely associated with the development of various chronic diseases, such as diabetes, cardiovascular diseases, and cancer, and it is also a major cause of premature death (3, 4). Despite considerable advancements in understanding the pathophysiology of obesity and its treatment strategies, mortality rates among obese individuals remain high (5). Therefore, identifying biomarkers that are closely associated with mortality risk in obese individuals is critical for timely identification of high-risk groups and the implementation of effective interventions.
Biological aging, a process characterized by a gradual decline in the body's homeostatic capabilities, is considered a key factor in the worsened prognosis associated with obesity (6, 7). However, the rate of aging varies significantly among individuals, and traditional risk assessments based solely on chronological age (CA) often fail to accurately capture an individual's true physiological condition (8). Phenotypic age acceleration (PAA) refers to the extent of biological aging beyond CA, with a positive value indicating that an individual's biological age (BA) exceeds their actual age (9). Previous studies have demonstrated that PAA is strongly associated with all-cause and cardiovascular-related mortality in patients with various chronic diseases, such as coronary artery disease and diabetes (10, 11). However, it remains unclear whether PAA is associated with mortality risk in obese individuals.
This study aims to explore the association between PAA and both all-cause mortality as well as cause-specific mortality, such as cardiovascular and cancer-related deaths, in obese individuals. By analyzing these BA markers, we hope to provide clinicians with more effective tools to help identify high-risk individuals within the obese population and optimize the implementation of related interventions.
2 Methods
2.1 Study population
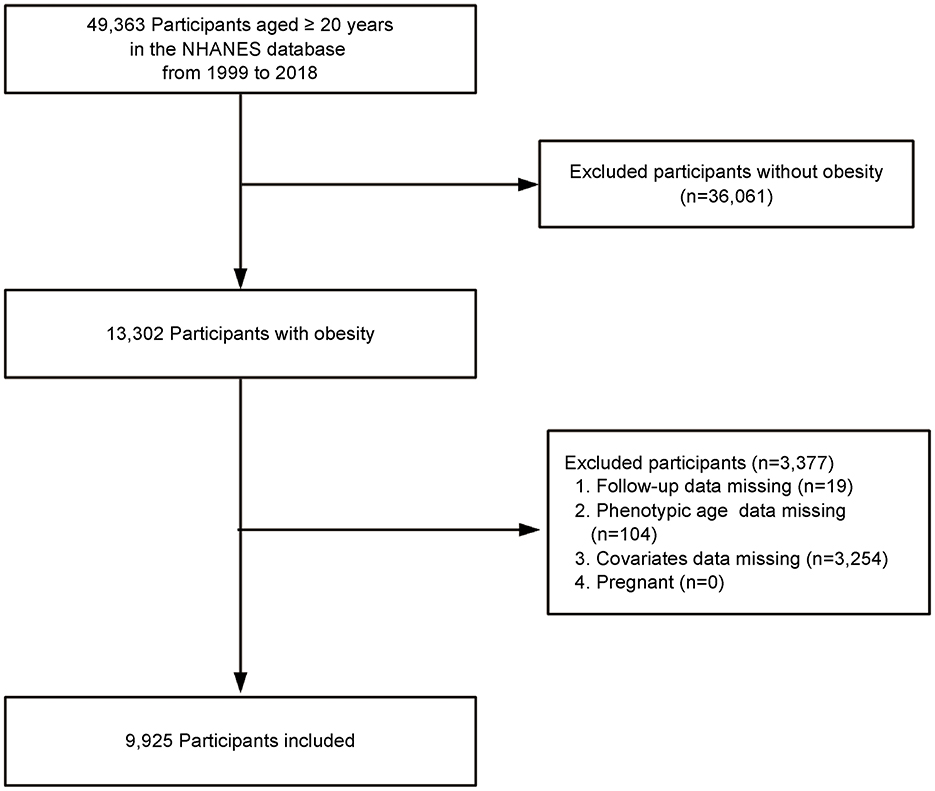
This study utilized data from obese adult participants in the National Health and Nutrition Examination Survey (NHANES) conducted between 1999 and 2018. NHANES is a nationally representative survey conducted by the National Center for Health Statistics (NCHS), using a stratified, multistage probability sampling method to assess the health and nutritional status of the non-institutionalized U.S. population. Adults aged ≥20 years with obesity, defined as a body mass index (BMI) ≥30 kg/m2, were included in the study. Exclusions were made for participants who were lost to follow-up, those with missing laboratory data required to calculate phenotypic age (PA), those with missing covariate data, and pregnant women. Ultimately, the study sample included 9,925 obese adults (Figure 1). The NHANES study protocol was approved by the NCHS Research Ethics Review Board, and all participants provided written informed consent at enrollment. This study followed the Strengthening the Reporting of Observational Studies in Epidemiology (STROBE) guidelines for reporting observational studies. The Ethics Committee of First Hospital of Quanzhou Affiliated to Fujian Medical University approved the study (decision no. 2024-184).
2.2 Measurement of PAA
PA was estimated using multiple physiological markers obtained from laboratory analysis of blood samples, including 10 aging-related variables: chronological age (CA), albumin, creatinine, glucose, C-Reactive Protein (CRP), lymphocyte percentage, mean cell volume, red cell distribution width, alkaline phosphatase, and white blood cell count (12). The detailed method for calculating PA is provided in Supplementary material. The residual of PAA was calculated through linear regression of PA on CA. PAA reflects the difference between an individual's BA and CA, with those having a positive residual classified as experiencing “PAA,” and those with a negative residual classified as having “without PAA” (13).
2.3 Mortality determination
The survival status of participants was determined through the NHANES publicly available linked mortality files, with a cutoff date of December 31, 2019. Causes of death were classified based on the International Classification of Diseases, 10th Revision (ICD-10), focusing on all-cause mortality, cardiovascular disease mortality (ICD-10: I00-I09, I11, I13, I20-I51), and cancer mortality (ICD-10: C00-C97).
2.4 Covariate assessment
Based on previous studies, the potential covariates included age, gender, race, marital status, poverty income ratio (PIR), educational level, Healthy Eating Index (HEI-2015), physical activity, smoking status, alcohol intake, cardiovascular disease (CVD), hypertension, hyperlipidemia, diabetes, and cancer diagnosis (9, 14, 15). Specific definitions were as follows: age was treated as a continuous variable, recording the participants' actual age. Gender was self-reported; race was categorized as non-Hispanic White, others (non-Hispanic Black, Mexican American, other Hispanic, and other races). Marital status was categorized as married/cohabitating or unmarried/other (including widowed, divorced, or separated); PIR was divided into 1–1.3, 1.31–3.50, and >3.50 (16). Educational levels were divided into less than high school, high school or equivalent, and more than high school; HEI-2015 score evaluated diet quality based on 13 components, summing to a 100-point score indicating adherence to 2015–2020 Dietary Guidelines (17). Physical activity time was a continuous variable indicating time spent on activities such as walking, cycling, work, and recreational activities in a week, and PA was categorized into three levels: inactive (0 MET-min/week), insufficiently active (1-599 MET-min/week), and sufficiently active (≥600 MET-min/week) (18).Smoking status was categorized as never smokers (fewer than 100 cigarettes in their lifetime), former smokers (over 100 cigarettes but not currently smoking), and current smokers (over 100 cigarettes and currently smoking sometimes or daily) (19). Participants were categorized by alcohol intake into never drinkers (< 12 drinks in a lifetime), former drinkers (≥12 drinks in a year but not in the past year), and current drinkers (≥12 drinks in any given year and drank in the past year) (20). CVD is defined as a self-reported diagnosis of coronary heart disease, angina, stroke, myocardial infarction, or congestive heart failure (21). Hypertension was defined as a mean systolic blood pressure ≥140 mmHg and/or diastolic blood pressure ≥90 mmHg, self-reported diagnosis, or use of antihypertensive medications (19). Hyperlipidemia was defined by any of the following: (1) use of lipid-lowering drugs; (2) triglycerides ≥150 mg/dl; or (3) high cholesterol (total cholesterol ≥200 mg/dl, or LDL ≥130 mg/dl, or HDL < 40 mg/dl) (22). Diabetes was defined by a doctor's diagnosis, HbA1c ≥6.5%, fasting glucose ≥7.0 mmol/L, random glucose/Oral Glucose Tolerance Test (OGTT) ≥11.1 mmol/L, or use of diabetes medication/insulin (23). Cancer diagnosis was based on an affirmative response to the question, “Have you ever been told by a doctor or other health professional that you had cancer or any type of malignancy?” (18).
2.5 Statistical analysis
All analyses were conducted using R statistical software (version 4.2.1; http://www.R-project.org, The R Foundation) and Free Statistics software (version 1.7; Beijing, China, http://www.clinicalscientists. cn/freestatistics). Categorical variables were expressed as percentages, and continuous variables as means (standard deviation). Group differences were compared using the Chi-square test and two-sample independent t-test. Survival analyses were conducted using Kaplan-Meier survival curves to estimate all-cause, CVD, and cancer mortality in different PAA groups, with group differences assessed by the Log-rank test. To further analyze the relationship between PAA and mortality, Cox proportional hazards regression models were used to calculate hazard ratios (HRs) and their 95% confidence intervals (CIs). The covariates included in the model were determined based on clinical expertise, univariate screening results (P-value < 0.05), or whether they led to a change in the effect estimate >10%. The multivariable models were progressively adjusted for covariates: Model 1 adjusted for age and gender; Model 2 further adjusted for race, marital status, PIR, educational level, HEI-2015, physical activity, smoking status, and alcohol intake; Model 3 further adjusted for CVD, hypertension, hyperlipidemia, diabetes, and cancer. Restricted cubic spline (RCS) models were used to estimate and visualize the dose-response relationship between age acceleration residual and risks of all-cause and cause-specific mortality.
To assess the consistency of the relationship between PAA and all-cause mortality across different populations, subgroup analyses were performed for age, gender, smoking, alcohol intake, CVD, hypertension, hyperlipidemia, and diabetes. Sensitivity analyses were conducted to validate the robustness of the results: (1) excluding participants who died within 2 years of follow-up; (2) excluding participants with a baseline history of CVD; and (3) excluding participants with a baseline history of cancer. Cox regression models were re-fitted for each sensitivity analysis to evaluate the relationship between PAA and all-cause mortality; (4) Following NHANES analytic guidelines, we incorporated the complex sampling design and mobile examination center (MEC) exam sample weights into our study. Detailed information regarding the weighted analysis can be found in the Supplementary material. Specifically, in the Cox regression analysis, we used a weighted data model to conduct an in-depth analysis of the relationship between PAA and all-cause mortality, as well as cause-specific mortality, in the obese population.
3 Results
3.1 Participant characteristics
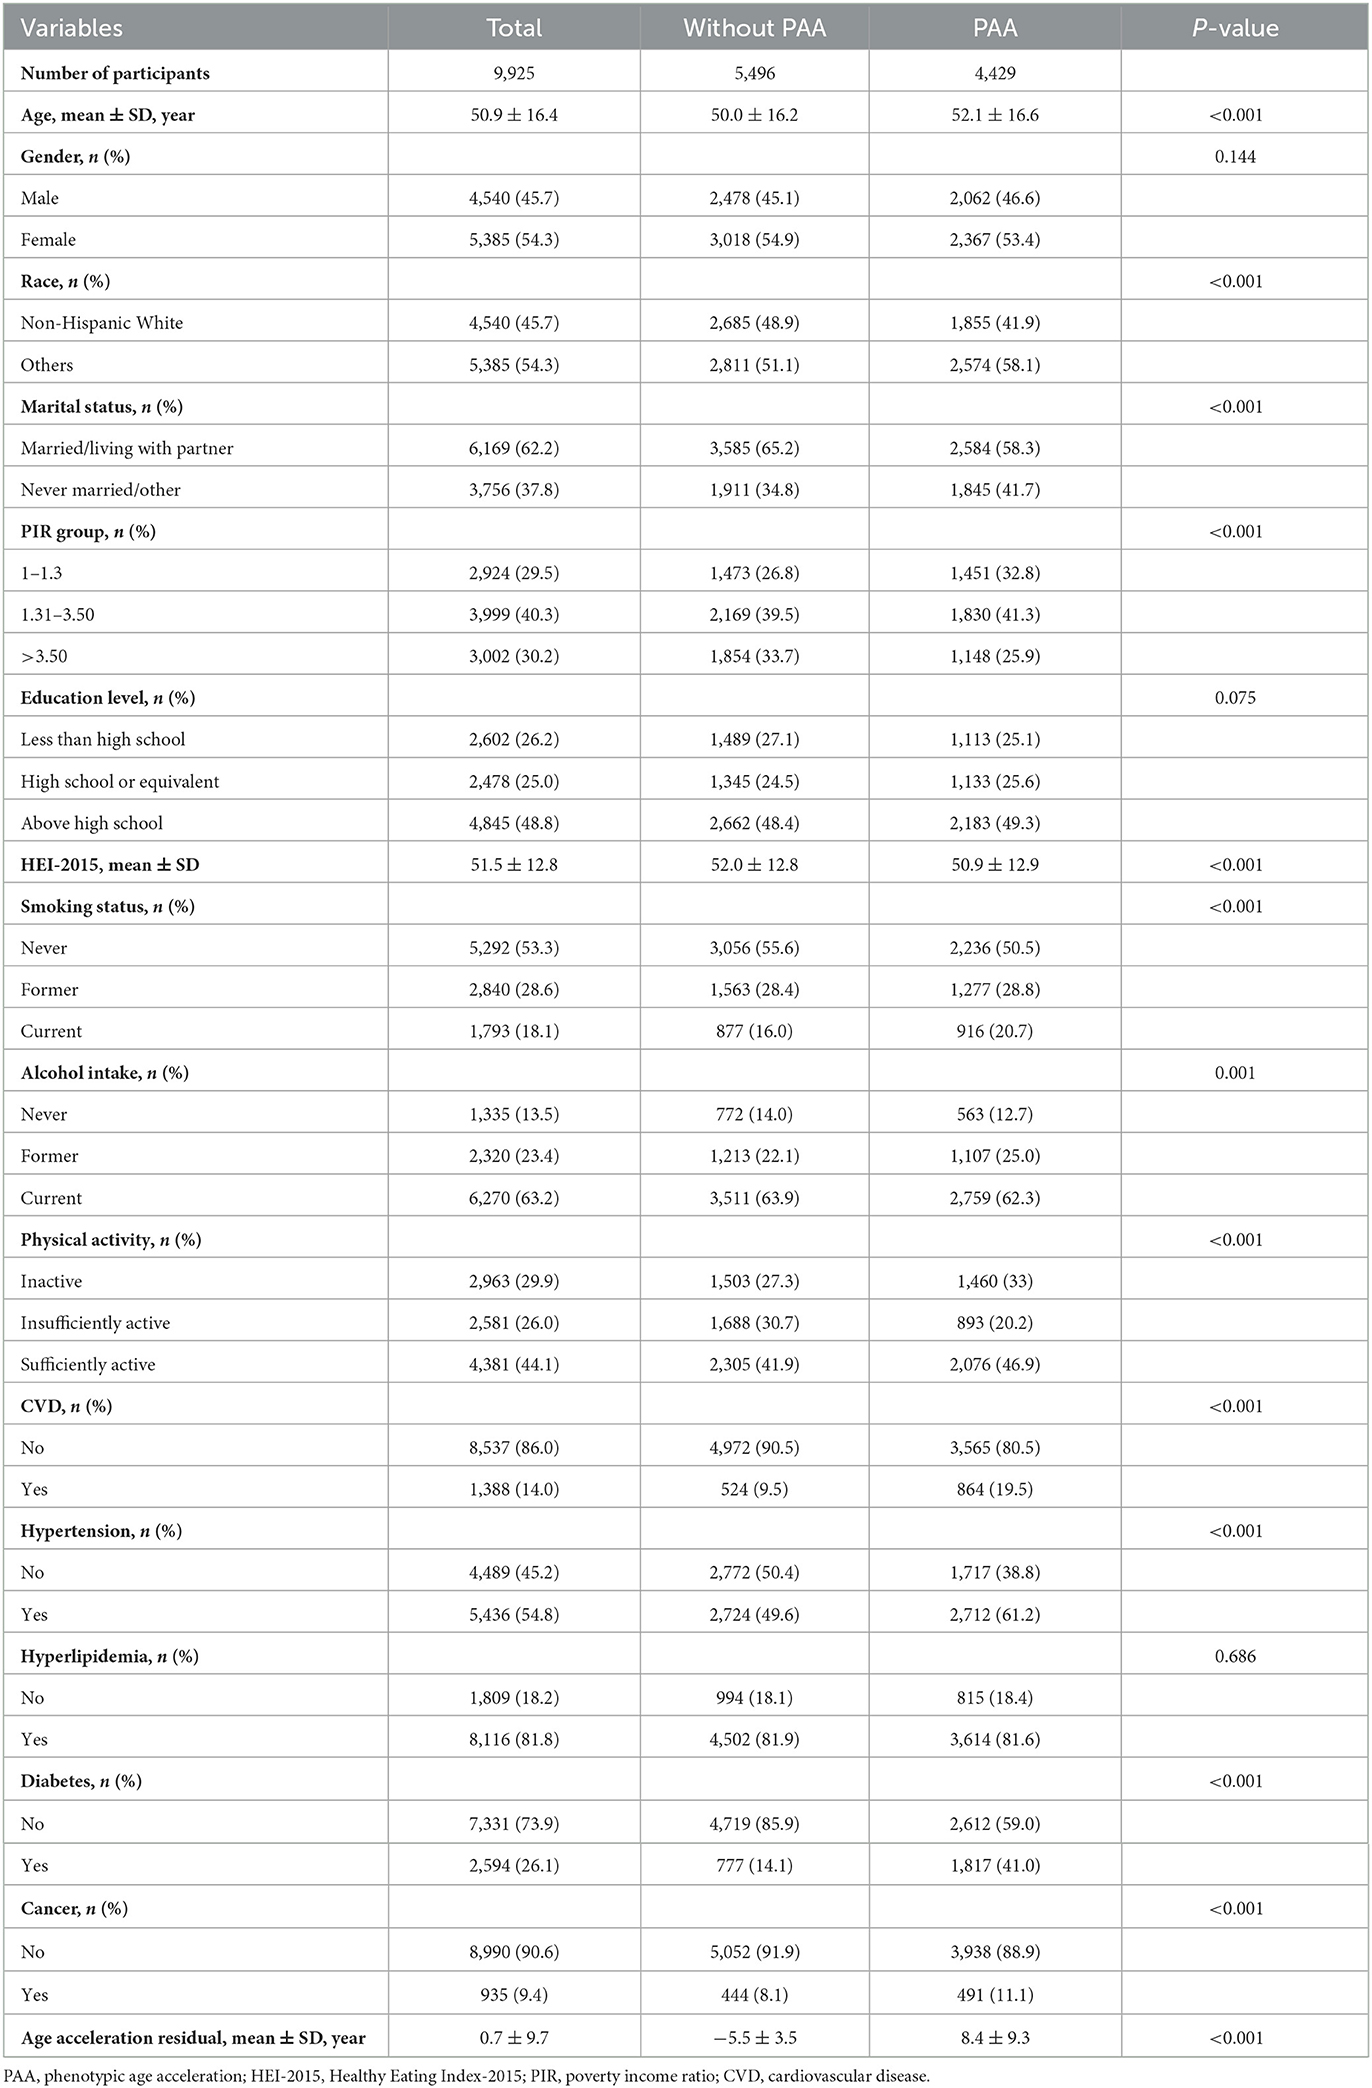
In Table 1, among the 9,925 obese participants, 5,496 (55.4%) were classified as the without PAA group, while 4,429 (44.6%) were in the PAA group. The age acceleration residual for the without PAA group was −5.5 ± 3.5, compared to 8.4 ± 9.3 in the PAA group (P < 0.001). In terms of covariates, the PAA group had a higher mean age (52.1 vs. 50.0 years, P < 0.001). The proportion of non-Hispanic Whites was higher in the without PAA group (48.9 vs. 41.9%, P < 0.001), and a greater percentage of individuals in the without PAA group were married or cohabiting with a partner (65.2 vs. 58.3%, P < 0.001). Additionally, the PAA group had a higher proportion of low-income individuals and current smokers, while the without PAA group had a higher Healthy Eating Index score (P < 0.001).
3.2 Relationship between PAA and mortality
During the median follow-up of 10.6 years (interquartile range: 4–14.7 years), a total of 1,537 participants died, including 419 deaths from CVD and 357 deaths from cancer. Kaplan-Meier survival analysis showed that participants with PAA had significantly higher all-cause mortality, CVD mortality, and cancer mortality compared to those without PAA (Figure 2, all P-values < 0.001). Table 2 shows that, after adjusting for age, gender, race, marital status, PIR, educational level, physical activity, smoking status, alcohol intake, CVD, hypertension, diabetes, and cancer, PAA remained significantly associated with all-cause mortality, CVD mortality, and cancer mortality. Compared to participants without PAA, those with PAA had an 84% increased risk of all-cause mortality (Model 3, HR = 1.84, 95%CI: 1.64–2.06, P < 0.001), an 86% increased risk of CVD mortality (Model 3, HR = 1.86, 95%CI: 1.50–2.31, P < 0.001), and a 47% increased risk of cancer mortality (Model 3, HR = 1.47, 95%CI: 1.17–1.85, P < 0.001). Age acceleration residual (measured in years) significantly increased the risk of all-cause mortality (HR = 1.04 per 1-year increase), CVD mortality (HR = 1.04–1.05 per 1-year increase), and cancer mortality (HR = 1.02–1.03 per 1-year increase), with all models reaching statistical significance (P < 0.001). As shown in Figure 3, the restricted cubic spline regression model indicated a linear positive correlation between PAA and all-cause mortality, CVD mortality, and cancer mortality (all P-values > 0.05).
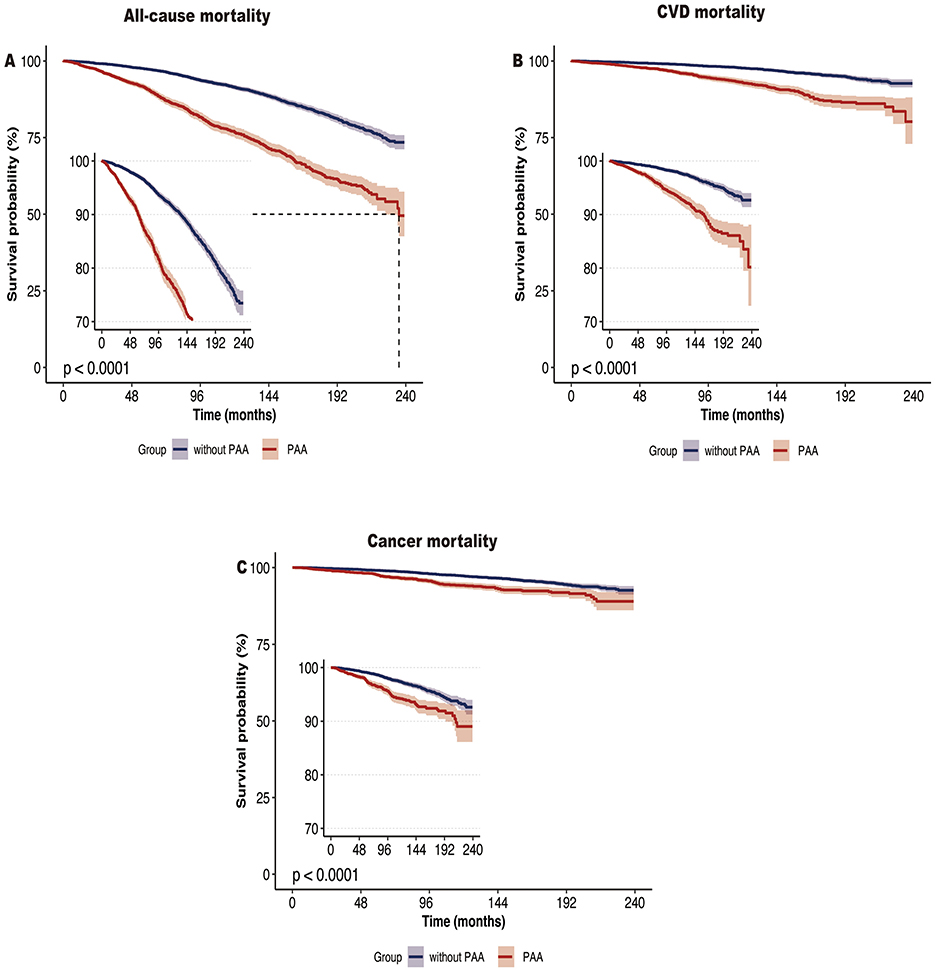
Figure 2. Kaplan-Meier survival curve of all-cause mortality (A), CVD mortality (B), and cancer mortality (C) according to phenotypic age acceleration among obese adults. CVD, cardiovascular disease.
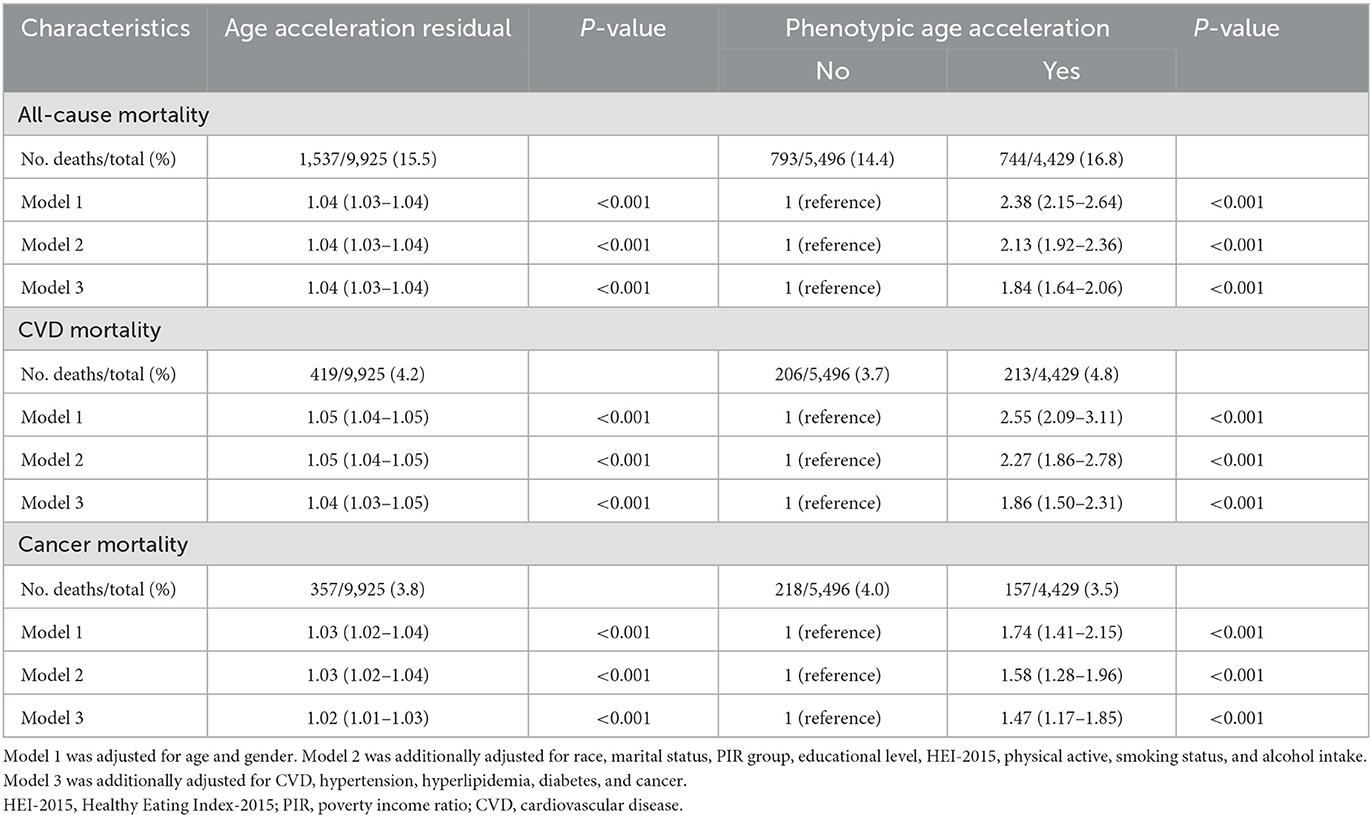
Table 2. Adjusted hazard ratios of phenotypic age acceleration with risk of all-cause mortality and cause-specific mortality.
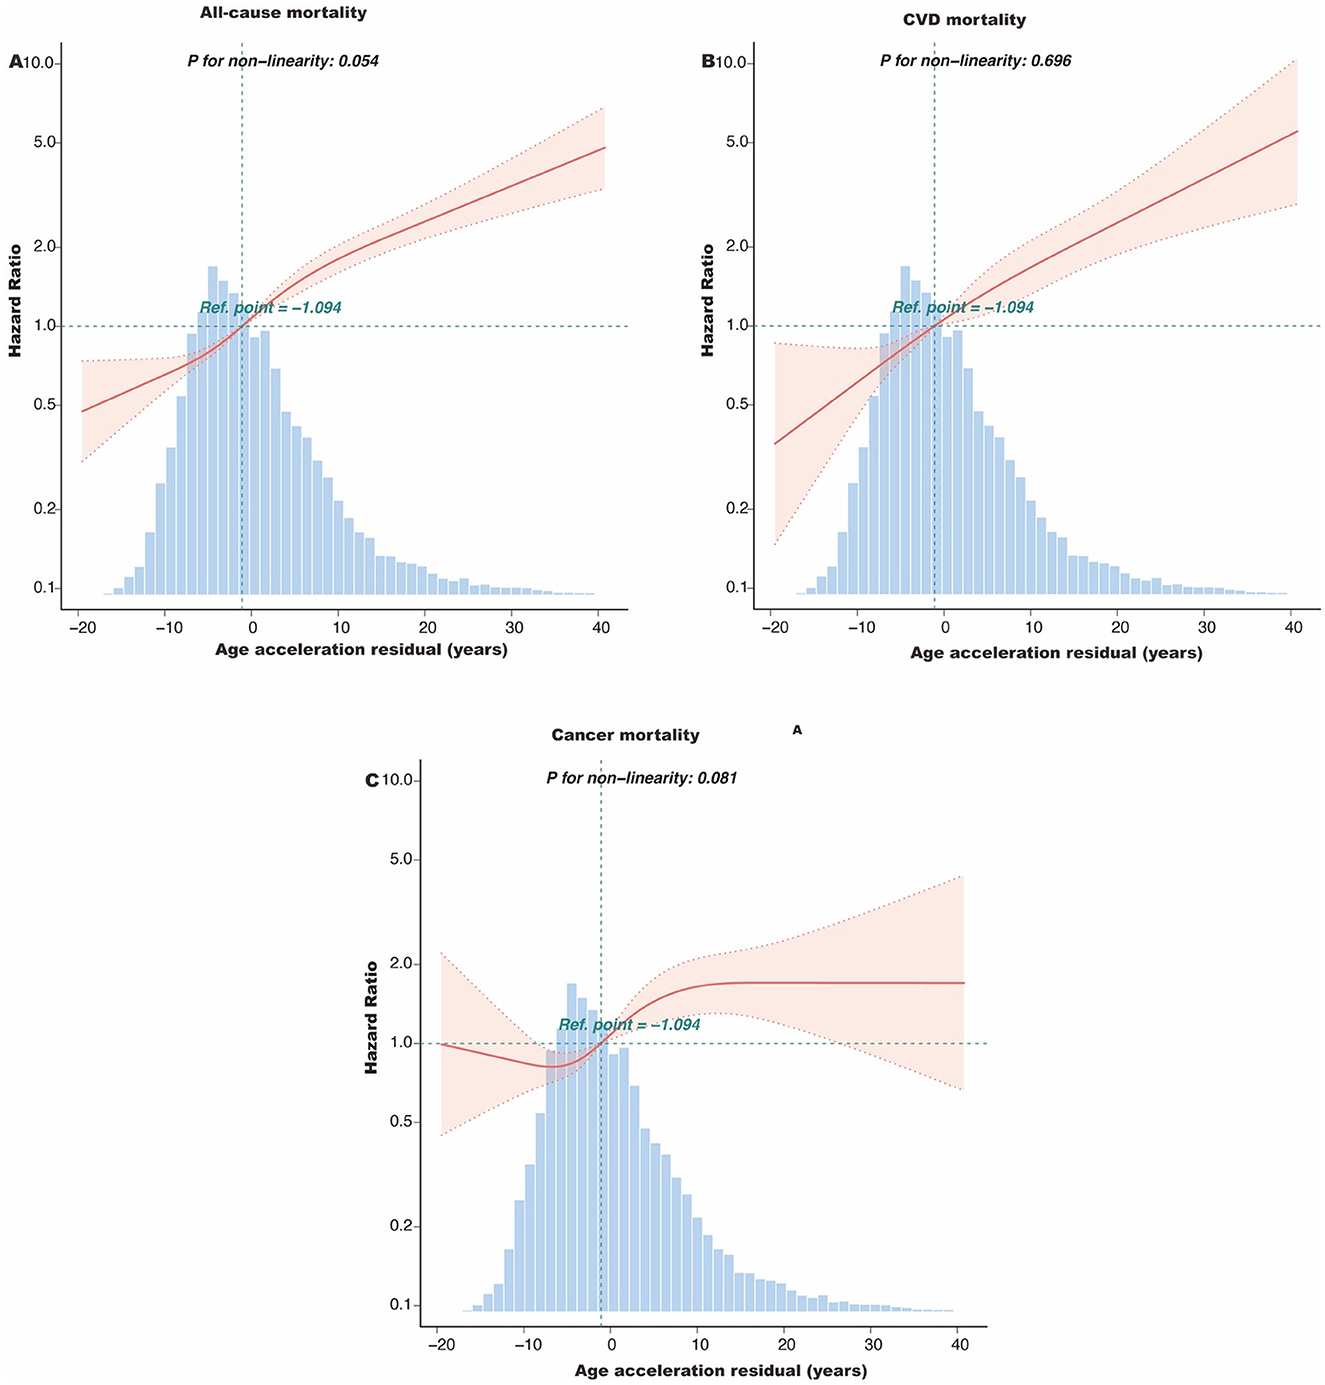
Figure 3. The dose-response association of the age acceleration residual with all-cause mortality (A), CVD mortality (B), and cancer mortality (C) among obese adults. This spline model was adjusted for age, gender, race, marital status, PIR group, educational level, HEI-2015, physical active, smoking status, and alcohol intake, CVD, hypertension, hyperlipidemia, diabetes, and cancer. HEI-2015, Healthy Eating Index-2015; PIR, poverty income ratio; CVD, cardiovascular disease.
3.3 Subgroup analysis
Figure 4 shows that the association between PAA and all-cause mortality was consistent across different subgroups based on age, gender, smoking, alcohol intake, CVD, hypertension, hyperlipidemia, and diabetes. Specifically, the all-cause mortality rate was significantly higher in the PAA group across all subgroups. A significant interaction was observed in the age subgroup and gender subgroup.
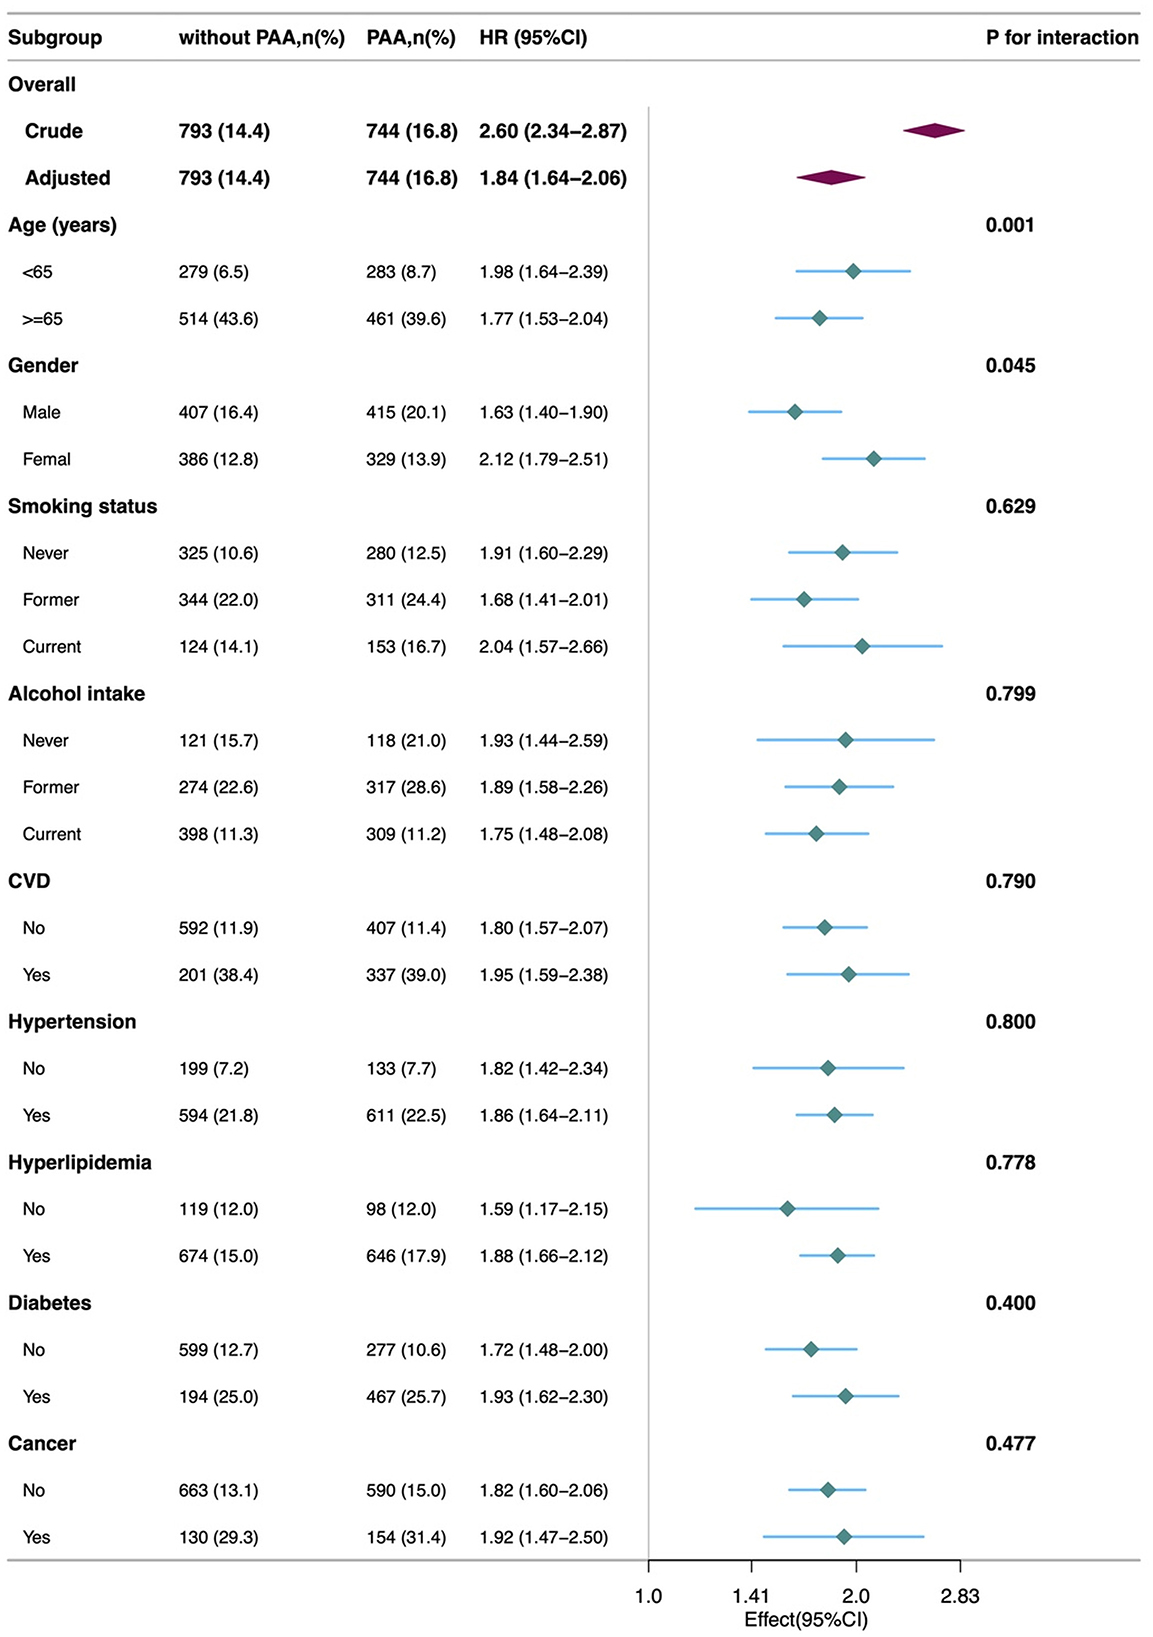
Figure 4. Subgroup analyses of the association of the phenotypic age acceleration with all-cause mortality among obese adults. CVD, cardiovascular disease; PAA, phenotypic age acceleration.
3.4 Sensitivity analysis
Several sensitivity analyses were conducted to validate the robustness of the results. First, after excluding participants who died within the first 2 years of follow-up, the association between PAA and all-cause mortality remained significant (HR = 1.80, 95% CI: 1.60–2.03, P < 0.001). Second, after excluding participants with a baseline history of CVD or cancer, the relationship between PAA and all-cause mortality remained stable (CVD exclusion group: HR = 1.80, 95% CI: 1.57–2.07, P < 0.001; cancer exclusion group: HR = 1.84, 95% CI: 1.58–2.14, P < 0.001, Table 3). In Supplementary Table 1, weighted analysis showed that PAA significantly increased the risk of all-cause mortality (HR = 1.90), CVD mortality (HR = 2.03), and cancer mortality (HR = 1.47).
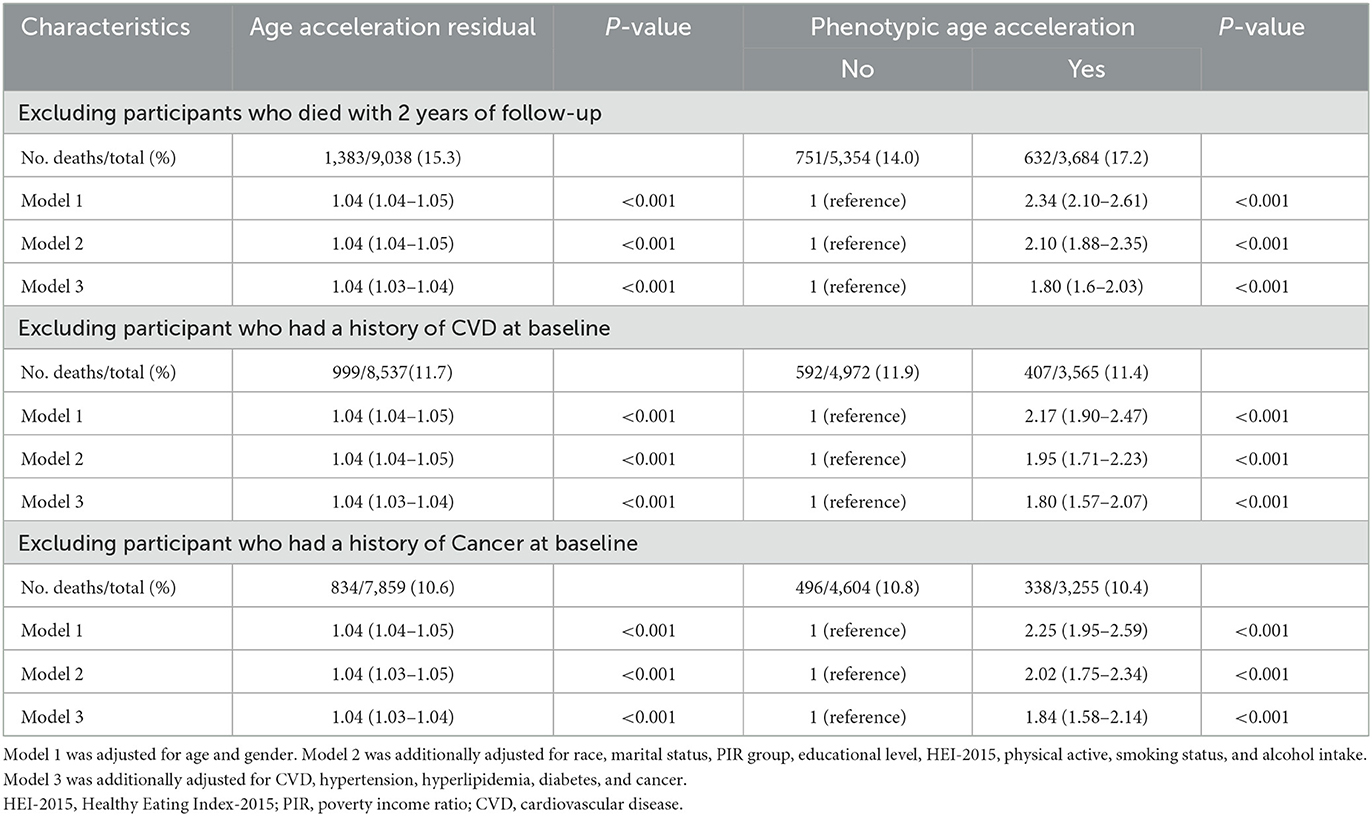
Table 3. Sensitivity analyses: HRs (95% CIs) for all-cause mortality among obese adults according to phenotypic age acceleration.
4 Discussion
To our knowledge, this study is the first to explore the relationship between PAA and all-cause mortality, CVD mortality, and cancer mortality in the obese population using data from the NHANES. The study found that individuals with PAA exhibited significantly higher risks of all-cause mortality, CVD mortality, and cancer mortality compared to those without PAA. These associations remained significant after adjusting for multiple covariates, indicating that PAA is an independent predictor of mortality in obese individuals. Sensitivity analyses further confirmed the robustness of these findings, providing strong support for the conclusions of this study.
Different BA measurement methods, such as DNA methylation age, telomere length, and Klotho protein levels, have become important tools for assessing BA. Studies on DNA methylation age have shown that it can accurately reflect an individual's biological aging and is closely linked to disease risk (24). Telomere shortening is considered one of the markers of aging and is frequently used to assess an individual's aging state (25). Klotho, an anti-aging protein, has been shown to decrease in concentration with age, and its reduction is linked to various age-related diseases (26). PA, as a novel BA marker, integrates various physiological and biological indicators, offering a more comprehensive prediction of an individual's health status and disease risk (27).
Several previous studies have shown that PAA is an important BA marker in general and disease-specific populations, capable of predicting all-cause and disease-specific mortality. However, most of these studies did not focus on the obese population as a distinct group. A large study of the general adult population revealed a significant positive correlation between PAA and all-cause, cardiovascular, and cancer mortality. The study pointed out that unhealthy lifestyles, such as smoking and lack of physical activity, can accelerate BA and increase mortality risk (28). In disease-specific populations, the role of PAA has also been validated. A study found that PAA significantly predicted long-term mortality in patients with multi-vessel coronary artery disease, serving as a critical prognostic indicator for CVD (10). Similarly, Chen et al. demonstrated that PAA was significantly associated with all-cause and CVD mortality in patients with diabetes, further highlighting its potential value in managing chronic diseases (29). Studies in cancer populations have shown similar results. Wang et al., in a study of cancer survivors, found that PAA significantly increased all-cause mortality, particularly in breast and colorectal cancer survivors. Using a proteomic aging clock (PAC) to assess BA acceleration in cancer survivors, the study showed that faster BA was associated with higher mortality risk (30).
Unlike these studies, the uniqueness of the current study lies in its specific focus on the relationship between PAA and mortality in the obese population. Obesity itself is a major risk factor for chronic diseases such as CVD, diabetes, and cancer. PAA, as a comprehensive BA indicator, can better capture the aging process in obese individuals. While most previous studies have treated obesity as a covariate or subgroup, this study focused on the obese population, revealing the independent predictive value of PAA for mortality in this group. Lundgren et al. examined the relationship between BMI and epigenetic age acceleration, finding that obesity, associated with insulin resistance, accelerated BA (31). This study further demonstrated a strong correlation between PAA and all-cause and cause-specific mortality in obese individuals, expanding the scope of research in this field.
The relationship between PAA and mortality can be explained by several biological mechanisms. First, obesity is considered a trigger for chronic inflammation, and prolonged chronic inflammation can accelerate cellular aging and tissue damage, closely linking it to accelerated aging and increased mortality risk. Zhang et al. pointed out that obesity-induced oxidative stress and inflammatory responses accelerate cellular aging, thereby increasing the incidence of CVD and cancer (32). Second, a study found that the association between obesity and insulin resistance could accelerate BA through metabolic dysregulation, increasing mortality risk in obese individuals (33). Additionally, telomeres, the protective structures at the ends of chromosomes, are known to shorten as a marker of aging. Studies have shown that obesity accelerates telomere shortening, promoting BA. As inflammation and oxidative stress intensify in obese individuals, the rate of telomere shortening may increase further, leading to PAA (34). These mechanisms suggest that obesity accelerates aging through multiple metabolic and biological pathways, which in turn impacts mortality.
This study has several notable strengths. First, it focuses on the obese population, which has important public health implications. Obesity is a global health issue, and clarifying the role of PAA in obese individuals helps better understand the complex relationship between obesity and mortality. Second, this study utilized a large, representative sample with rich covariates, ensuring the robustness and external validity of the findings. Additionally, by adjusting for multiple variables and performing sensitivity analyses, this study confirmed the significant association between PAA and mortality. However, this study also has some limitations. First, the calculation of PAA was based on a one-time measurement and did not capture dynamic changes in an individual's physiological state. Second, despite adjusting for multiple potential confounders, unmeasured confounders may still influence the results. Furthermore, as an observational study, it cannot establish causality between PAA and mortality, and future longitudinal intervention studies are needed to further validate these findings. Finally, grouping multiple ethnicities as “other” may obscure intergroup differences, as varying health risks and socioeconomic factors across ethnic groups could affect the PAA-mortality association. Future research should use more detailed racial classifications to better assess this relationship.
Based on our findings, PAA can serve as a risk assessment tool for obese individuals. Possible interventions include lifestyle modifications, such as increasing physical activity, adopting a healthy diet, and reducing smoking and alcohol intake. Additionally, medical interventions aimed at managing metabolic risk factors and controlling inflammation may help slow biological age acceleration. Clinicians could use PAA as a tool to identify high-risk individuals and develop personalized interventions to reduce mortality risk.
5 Conclusion
This study identified PAA as a strong predictor of all-cause, cardiovascular, and cancer mortality in obese individuals, highlighting its importance for the first time in this population. These findings offer new insights for health management and mortality risk assessment in obesity, urging further research into the mechanisms linking PAA to obesity-related diseases.
Data availability statement
The original contributions presented in the study are included in the article/Supplementary material, further inquiries can be directed to the corresponding authors.
Ethics statement
Ethical review and approval was not required for the study on human participants in accordance with the local legislation and institutional requirements. Written informed consent from the patients/participants or the patients'/participants' legal guardian/next of kin was not required to participate in this study in accordance with the national legislation and the institutional requirements.
Author contributions
YinH: Conceptualization, Data curation, Formal analysis, Methodology, Supervision, Writing – original draft. AZ: Conceptualization, Data curation, Formal analysis, Methodology, Supervision, Writing – original draft. YisH: Formal analysis, Writing – original draft. YW: Software, Writing – original draft. XiaobL: Supervision, Writing – review & editing. XiaoqL: Supervision, Writing – review & editing.
Funding
The author(s) declare financial support was received for the research, authorship, and/or publication of this article. This study was supported by China Scholarship Council (Grant No. 201906070289) and Startup Fund for Scientific Research, Fujian Medical University (Grant No. 2022QH1268). The funders had no role in the study design, analysis, decision to publish, nor preparation of the manuscript.
Acknowledgments
We thank Huanxian Liu (Department of Neurology, Chinese PLA General Hospital, Beijing, China) and Haoxian Tang (Department of Clinical Medicine, Shantou University Medical College, Shantou, Guangdong, China) for their valuable comments on the study design and manuscript.
Conflict of interest
The authors declare that the research was conducted in the absence of any commercial or financial relationships that could be construed as a potential conflict of interest.
Generative AI statement
The authors declare that no Generative AI was used in the creation of this manuscript.
Publisher's note
All claims expressed in this article are solely those of the authors and do not necessarily represent those of their affiliated organizations, or those of the publisher, the editors and the reviewers. Any product that may be evaluated in this article, or claim that may be made by its manufacturer, is not guaranteed or endorsed by the publisher.
Supplementary material
The Supplementary Material for this article can be found online at: https://www.frontiersin.org/articles/10.3389/fpubh.2024.1505066/full#supplementary-material
References
1. Blüher M. Obesity: global epidemiology and pathogenesis. Nat Rev Endocrinol. (2019) 15:288–98. doi: 10.1038/s41574-019-0176-8
2. Paczkowska-Abdulsalam M, Kretowski A. Obesity, metabolic health and omics: Current status and future directions. WJD. (2021) 12:420–36. doi: 10.4239/wjd.v12.i4.420
3. Okolo I, Mahmood AT. Obesity and cardiovascular disease in reproductive health. Obes Gynecol. (2020) 28:255–63. doi: 10.1016/B978-0-12-817919-2.00028-0
4. Gutiérrez-Cuevas J, Santos A, Armendariz-Borunda J. Pathophysiological molecular mechanisms of obesity: a link between MAFLD and NASH with cardiovascular diseases. IJMS. (2021) 22:11629. doi: 10.3390/ijms222111629
5. Pati S, Irfan W, Jameel A, Ahmed S, Shahid RK. Obesity and cancer: a current overview of epidemiology, pathogenesis, outcomes, and management. Cancers. (2023) 15:485. doi: 10.3390/cancers15020485
6. Franzago M, Pilenzi L, Di Rado S, Vitacolonna E, Stuppia L. The epigenetic aging, obesity, and lifestyle. Front Cell Dev Biol. (2022) 10:985274. doi: 10.3389/fcell.2022.985274
7. Horvath S, Erhart W, Brosch M, Ammerpohl O, von Schönfels W, Ahrens M, et al. Obesity accelerates epigenetic aging of human liver. Proc Natl Acad Sci USA. (2014) 111:15538–43. doi: 10.1073/pnas.1412759111
8. Elliott ML, Caspi A, Houts RM, Ambler A, Broadbent JM, Hancox RJ, et al. Disparities in the pace of biological aging among midlife adults of the same chronological age have implications for future frailty risk and policy. Nat Aging. (2021) 1:295–308. doi: 10.1038/s43587-021-00044-4
9. Feng Y, Lin H, Tan H, Liu X. Heterogeneity of aging and mortality risk among individuals with hypertension: Insights from phenotypic age and phenotypic age acceleration. J Nutr Health Aging. (2024) 28:100203. doi: 10.1016/j.jnha.2024.100203
10. Ma Q, Li BL, Yang L, Zhang M, Feng XX, Li Q, et al. Association between phenotypic age and mortality in patients with multivessel coronary artery disease. Disease Markers. (2022) 2022:1–11. doi: 10.1155/2022/4524032
11. Liu W, Wang J, Wang M, Hou H, Ding X, Ma L, et al. Oxidative stress factors mediate the association between life's essential 8 and accelerated phenotypic aging: NHANES 2005-2018. J Gerontol Ser. A. (2024) 79:glad240. doi: 10.1093/gerona/glad240
12. Levine ME, Lu AT, Quach A, Chen BH, Assimes TL, Bandinelli S, et al. An epigenetic biomarker of aging for lifespan and healthspan. Aging. (2018) 10:573–91. doi: 10.18632/aging.101414
13. Chen H, Tang H, Zhang X, Huang J, Luo N, Guo Q, et al. Adherence to Life's Essential 8 is associated with delayed biological aging: a population-based cross-sectional study. Revista Española de Cardiología. (2024) 4:S1885585724001427. doi: 10.1016/j.rec.2024.04.004
14. Liu Z, Kuo PL, Horvath S, Crimmins E, Ferrucci L, Levine M. A new aging measure captures morbidity and mortality risk across diverse subpopulations from NHANES IV: A cohort study. PLoS Med. (2018) 15:e1002718. doi: 10.1371/journal.pmed.1002718
15. Xu X, Xu Z. Association between phenotypic age and the risk of mortality in patients with heart failure: a retrospective cohort study. Clin Cardiol. (2024) 47:e24321. doi: 10.1002/clc.24321
16. Pan T, Zhang Z, He T, Zhang C, Liang J, Wang X, et al. The association between urinary incontinence and suicidal ideation: findings from the National Health and Nutrition Examination Survey. PLoS ONE. (2024) 19:e0301553. doi: 10.1371/journal.pone.0301553
17. Reedy J, Lerman JL, Krebs-Smith SM, Kirkpatrick SI, Pannucci TE, Wilson MM, et al. Evaluation of the healthy eating index-2015. J Acad Nutr Dietet. (2018) 118:1622–33. doi: 10.1016/j.jand.2018.05.019
18. Wei X, Min Y, Xiang Z, Zeng Y, Wang J, Liu L. Joint association of physical activity and dietary quality with survival among US cancer survivors: a population-based cohort study. Int J Surg. (2024) 2024:1636. doi: 10.1097/JS9.0000000000001636
19. Tang H, Zhang X, Luo N, Huang J, Zhu Y. Association of dietary live microbes and nondietary. prebiotic/probiotic intake with cognitive function in older adults: evidence from NHANES. J Gerontol A Biol Sci Med Sci. (2024) 79:glad175. doi: 10.1093/gerona/glad175
20. Rattan P, Penrice DD, Ahn JC, Ferrer A, Patnaik M, Shah VH, et al. Inverse association of telomere length with liver disease and mortality in the US. Population Hepatol Commun. (2022) 6:399–410. doi: 10.1002/hep4.1803
21. Wang P, Wang Y, Jia X. Association between fecal incontinence and suicidal ideation in adult Americans: evidence from NHANES 2005-2010. J Psychosomat Res. (2023) 170:111377. doi: 10.1016/j.jpsychores.2023.111377
22. Mahemuti N, Jing X, Zhang N, Liu C, Li C, Cui Z, et al. Association between systemic immunity-inflammation index and hyperlipidemia: a population-based study from the NHANES (2015-2020). Nutrients. (2023) 15:1177. doi: 10.3390/nu15051177
23. Liu H, Zhang S, Gong Z, Zhao W, Lin X, Liu Y, et al. Association between migraine and cardiovascular disease mortality: a prospective population-based cohort study. Headache. (2023) 63:1109–18. doi: 10.1111/head.14616
24. Pearce EE, Montesanto A, De Rango F, Guarasci F, Passarino G, Bellizzi D. DNA-methylation-based telomere length estimator: comparisons with measurements from flow FISH and qPCR. Aging. (2021) 13:14675–86. doi: 10.18632/aging.203126
25. Banszerus VL, Vetter VM, Salewsky B, König M, Demuth I. Exploring the relationship of relative telomere length and the epigenetic clock in the lipidcardio cohort. IJMS. (2019) 20:3032. doi: 10.3390/ijms20123032
26. Wolf EJ, Morrison FG, Sullivan DR, Logue MW, Guetta RE, Stone A, et al. The goddess who spins the thread of life: Klotho, psychiatric stress, and accelerated aging. Brain Behav Immun. (2019) 80:193–203. doi: 10.1016/j.bbi.2019.03.007
27. Wu JW, Yaqub A, Ma Y, Koudstaal W, Hofman A, Ikram MA, et al. Biological age in healthy elderly predicts aging-related diseases including dementia. Sci Rep. (2021) 11:15929. doi: 10.1038/s41598-021-95425-5
28. Li X, Cao X, Zhang J, Fu J, Mohedaner M, Danzengzhuoga A, et al. Accelerated aging mediates the associations of unhealthy lifestyles with cardiovascular. disease, cancer, and mortality: two large prospective cohort studies. medRxiv. (2022) 2022:22275184. doi: 10.1101/2022.05.18.22275184
29. Chen L, Yin X, Zhao Y, Chen H, Tan T, Yao P, et al. Biological ageing and the risks of all-cause and cause-specific mortality among people with diabetes: a prospective cohort study. J Epidemiol Community Health. (2022) 76:771–8. doi: 10.1136/jech-2022-219142
30. Wang S, Blaes AH, Coresh J, Joshu CE, Pankow JS, Thyagarajan B, et al. Abstract A022: Proteomic age acceleration associated with all-cause mortality in cancer survivors in the Atherosclerosis Risk in Communities (ARIC) Study. Cancer Res. (2023) 83:A022. doi: 10.1158/1538-7445.AGCA22-A022
31. Lundgren S, Kuitunen S, Pietiläinen KH, Hurme M, Kähönen M, Männistö S, et al. BMI is positively associated with accelerated epigenetic aging in twin pairs discordant. BMI. (2021) 2021:21253271. doi: 10.1101/2021.03.11.21253271
32. Zhang Y, Fischer KE, Soto V, Liu Y, Sosnowska D, Richardson A, et al. Obesity-induced oxidative stress, accelerated functional decline with age and increased mortality in mice. Archiv Biochem Biophys. (2015) 576:39–48. doi: 10.1016/j.abb.2014.12.018
33. Jura M, Kozak LP. Obesity and related consequences to ageing. Age. (2016) 38:23. doi: 10.1007/s11357-016-9884-3
Keywords: phenotypic age acceleration, obesity, all-cause mortality, cardiovascular disease, cancer, NHANES
Citation: Huang Y, Zhou A, Huang Y, Wang Y, Liu X and Liu X (2024) Association between phenotypic age and mortality risk in individuals with obesity: a retrospective cohort study. Front. Public Health 12:1505066. doi: 10.3389/fpubh.2024.1505066
Received: 02 October 2024; Accepted: 25 November 2024;
Published: 09 December 2024.
Edited by:
Ljiljana T. Majnaric, Josip Juraj Strossmayer University of Osijek, CroatiaReviewed by:
Gabriel Lai, National Institute on Minority Health and Health Disparities (NIH), United StatesMengyuan Ruan, Brigham and Women's Hospital and Harvard Medical School, United States
Copyright © 2024 Huang, Zhou, Huang, Wang, Liu and Liu. This is an open-access article distributed under the terms of the Creative Commons Attribution License (CC BY). The use, distribution or reproduction in other forums is permitted, provided the original author(s) and the copyright owner(s) are credited and that the original publication in this journal is cited, in accordance with accepted academic practice. No use, distribution or reproduction is permitted which does not comply with these terms.
*Correspondence: Xiaoqiang Liu, bGl1eGlhb3FpYW5naHVzaW5hMTIzQGdtYWlsLmNvbQ==; Xiaobo Liu, eGlhb2JvLmxpdUBtYWlsLm1jZ2lsbC5jYQ==
†These authors have contributed equally to this work and share first authorship
 Yingxuan Huang1†
 Yisen Huang
 Xiaoqiang Liu