- 1Department of Laboratory, West China School of Public Health and West China Fourth Hospital, Sichuan University, Chengdu, China
- 2Sichuan International Travel Health Care Center (Chengdu Customs Port Outpatient Department), Chengdu, China
- 3Department of Laboratory, Akesu Center of Disease Control and Prevention, Akesu, China
- 4Department of Laboratory, Xiping Community Healthcare Center of Longquanyi District, Chengdu, China
- 5Department of Laboratory, Wangjiang Hospital, Sichuan University, Chengdu, China
Objective: Due to the high global prevalence of silicosis and the ongoing challenges in its diagnosis, this pilot study aims to screen biomarkers from routine blood parameters and develop a multi-biomarker model for its early detection.
Methods: A case-control study was conducted to screen biomarkers for the diagnosis of silicosis using LASSO regression, SVM and RF. A sample of 612 subjects (half cases and half controls) were randomly divided into training and test groups in a 2:1 ratio. Logistic regression analysis and receiver operating characteristic (ROC) curves were used to construct a multiple biomarker-based model for the diagnosis of silicosis, which was applied to both the training and the testing datasets.
Results: The training cohort revealed significant statistical differences (P < 0.05) in multiple hematologic parameters between silicosis patients and healthy individuals. Based on machine learning, eight silicosis biomarkers were screened and identified from routine blood cell, biochemical and coagulation parameters. D-dimer (DD), Albumin/Globulin (A/G), lactate dehydrogenase (LDH) and white blood cells (WBC) were selected for constructing the logistic regression model for silicosis diagnostics. This model had a satisfactory performance in the training cohort with an area under the ROC curve (AUC) of 0.982, a diagnostic sensitivity of 95.4%, and a specificity of 92.2%. In addition, the model had a prediction accuracy of 0.936 with an AUC of 0.979 in the independent test cohort. Moreover, the diagnostic accuracies of the logistic model in silicosis stages 1, 2, and 3 were 88.0, 95.4, and 94.3% with an AUC of 0.968, 0.983, and 0.990 for silicosis, respectively.
Conclusion: A diagnostic model based on DD, A/G, LDH and WBC is successfully proposed for silicosis diagnostics. It is cheap, sensitive, specific, and preliminarily offers a potential strategy for the large-scale screening of silicosis.
Introduction
Silicosis is a chronic, debilitating and irreversible fibrotic lung disease resulting from the inhalation of crystalline silica particles, posing a significant occupational health challenge worldwide. Characterized by inflammation, nodular lesions, and pulmonary fibrosis, silicosis leads to severe complications such as tuberculosis, respiratory failure, and increased mortality (1). The mechanism of silica-induced pulmonary lesions is multifaceted, involving direct cytotoxic effects on macrophages, cytokine and chemokine production, cell apoptosis/necrosis, pulmonary fibrosis, lysosomal rupture, macrophage surface receptor activation, generation of reactive oxygen species and inflammasome activation (2–4). Despite all efforts to improve occupational health, silicosis is still one of the most prevalent occupational diseases in the world, afflicts workers in hazardous environments, and kills thousands of people every year (5). Even worse, silicosis cases still increase obviously in some specific industries, such as jewelry, glass production, nanomaterial production, and manufacturing (6, 7). Recent research indicated that over 230,000 workers in China were directly exposed to respirable crystalline silica (RCS). Silicosis has become a huge burden in China, which demonstrated the highest age-standardized rate (ASR) of silicosis (113.149, 95% UI: 92.924–136.700, per 100,000 population, in 2019) (8, 9). A recent study from Xin Liu et al. shows that ASRs due to silicosis vary widely among 204 countries worldwide. Of these, four countries (Italy, Chile, North Korea, and China) had an ASIR of more than 1/100,000, and 101 countries had an ASIR of < 0.1/100,000, with the lowest being Iceland at < 0.001/100,000, and the highest being China at 5.92/100,000. Similarly, Iceland had the lowest ASPR, while China still had the highest (113.15/100,000), followed by North Korea, Chile, Mexico, Italy, Brazil, Palau, Albania and Slovenia (10). Therefore, early diagnostics and therapeutics are critical for slowing disease progression and improving patient quality of life. Currently, the chest X-ray test is the gold standard of silicosis diagnosis. Additional tests, such as a breathing test, chest CT scan, bronchoscopy test, and tissue biopsy of the lungs, may be required to assess silicosis and associated diseases (11, 12). However, these traditional examinations rely heavily on pulmonary functional abnormalities and radiographic changes that occur in the moderate and late stages of silicosis disease. To reduce delays in diagnosis and treatment, liquid biopsy techniques based on various biomarkers are expected to reliably screen and detect the early stages of silicosis without invasive and expensive examinations (13).
Screening and identification of key biomarkers for specific diseases are the most crucial in liquid biopsy (14). In the past decade, various biomarkers have been proposed for the early diagnosis and management of silicosis (15). Tumor necrosis factor–α (TNF–α) and interleukins (ILs) are the first to be discovered as contributors in silicosis progression and potential biomarkers of silicosis diagnostics. After capturing silica particles, alveolar macrophages will release many inflammatory cytokines, such as TNF-α and ILs. These mediators may maintain the inflammatory process, and then damage cells and the extracellular matrix (16). The marked increases in TNF-α and ILs could be observed in silicosis patients before the onset of clinical signs and radiographic changes, making them promising biomarkers for early diagnosis of silicosis (17). In addition to inflammatory markers, some peripheral markers of epithelial destruction have also been regarded as potential biomarkers of silicosis (16). For example, Clara cell protein 16 (CC16) plays vital roles in anti-inflammatory, anti-fibrotic, and immunosuppressive processes. Serum CC16 level was reported to decrease in silicosis patients due to inflammation and cell damage (18, 19). Krebs von den Lungen-6 (KL-6) is a mucin-like glycoprotein on type 2 pneumocytes. The serum level of KL-6 can reflect the extent of alveolar epithelial damage. It is a potential biomarker for lung fibrosis in general, but its value for specific diagnosis of silicosis is not yet defined (20–22). Besides, mucin 5B (MUC5B), neopterin, and matrix metalloproteinases (MMPs) have also been considered as potential biomarkers of silicosis (23–25).
To date, several silicosis-specific biomarkers have been discovered in cohort studies and animal experiments. However, accurate detection of these biomarkers requires delicate instruments, expensive reagents, and professionally trained analysts, making large-scale screening difficult to implement in occupational populations. Since the combination of multiple biomarkers could improve the specificity and sensitivity of early diagnostics (14), this pilot study aims to construct a rapid and cost-effective multiple biomarker-based model for diagnosing silicosis based on routine laboratory results.
Methods
Study design
This retrospective case-control study aims to develop a multiple blood biomarker model for diagnosing silicosis in silica-exposed workers.
Setting
The West China School of Public Health/West China Fourth Hospital of Sichuan University is one of the most famous public health colleges in China and the only tertiary Grade A occupational disease specialist hospital among the 44 commissioned hospitals of the National Health Commission. It features geriatric medicine, occupational disease, and minimally invasive treatment. The West China Fourth Hospital has diagnostic qualifications for pneumoconiosis and all ten major occupational diseases, which can meet the testing needs of all occupational disease projects in the industry.
Participants
We extracted a random sample of patients hospitalized in the West China Fourth Hospital of Sichuan University between 2021 and 2024 who had documented exposure to silica dust in occupational settings. Since silicosis is caused by silica dust exposure and is usually diagnosed as an occupational disease, we controlled for these factors to reduce bias. Cases were defined as patients diagnosed with silicosis based on the revised edition (2011) of the International Labor Office guideline (26). Controls were defined as patients who were silicosis-free. We excluded all patients with severe lung diseases other than silicosis, as well as those with severe or complex systemic conditions that could confound the analysis such as malignant tumors, severe arrhythmias, heart failure, abnormal thyroid function, blood disease, recent surgery, trauma, long-term alcohol abuse, and poisoning. All experiments were approved by the ethics committee at West China Fourth Hospital of Sichuan University (HXSY-EC-2023025). The need for written patient informed consent was waived as this was a retrospective study, which did not affect the welfare and rights of the patients.
Variables
The study outcomes are the diagnosis of silicosis and the classification of the disease into stages 1–3. The predictor variables are:
1. Complete blood count testing such as: basophil count (Bas#, cells/μL), basophil ratio (Bas%, %), eosinophil count (Eos#, cells/μL), eosinophil ratio (Eos%, %), hematocrit (HCT, %), hemoglobin (HGB, g/dL), immature granulocyte count (IMG#, cells/μL), immature granulocyte ratio (IMG%, %), lymphocyte count (Lym#, cells/μL), lymphocyte ratio (Lym%, %), mean cell hemoglobin (MCH, pg), mean cell hemoglobin concentration (MCHC, g/dL), mean corpuscular volume (MCV, fL), monocyte count (Mon#, cells/μL), monocyte ratio (Mon%, %), mean platelet volume (MPV, fL), neutrophil count (Neu#, cells/μL), neutrophil ratio (Neu%, %), neutrophil-to-lymphocyte ratio (NLR, ratio), platelet large cell count (P-LCC, 103/μL), platelet larger cell ratio (P-LCR, %), platelet crit (PCT, %), platelet distribution width (PDW, %), platelets (PLT, 103/μL), red blood cell count (RBC, 106/μL), red blood cell distribution width coefficient of variation (RDW-CV, %), red blood cell distribution width standard deviation (RDW-SD, fL), white blood cell count (WBC, cells/μL). The complete blood counts were performed by the BC-6800PLUS Analysis System (Mindray, China). PLCC, P-LCR, RDW-CV, and RDW-SD were presented as ratios.
2. Biochemical testing such as: albumin/globulin ratio (A/G, ratio), albumin (ALB, g/dL), alanine transaminase (ALT, U/L), aspartate transaminase (AST, U/L), blood urea nitrogen (BUN, mg/dL), cholesterol (CHOL, mg/dL), creatine kinase (CK, U/L), creatine kinase muscle and brain isoenzyme (CKMB, U/L), creatinine (CREA, mg/dL), C-reactive protein (CRP, mg/L), direct bilirubin (DBIL, mg/dL), gamma-glutamyl transferase (GGT, U/L), glucose (GLU, mg/dL), hydroxybutyrate dehydrogenase (HBDH, U/L), high-density lipoprotein-cholesterol (HDL-C, mg/dL), lactate dehydrogenase (LDH, U/L), low-density lipoprotein-cholesterol (LDL-C, mg/dL), total bilirubin (TBIL, mg/dL), triglyceride (TG, mg/dL), total protein (TP, g/dL), and uric acid (UA, mg/dL). The biochemical analysis was performed by Atellica CH930 (Siemens, Germany).
3. Coagulation testing such as: activated partial thromboplastin time (APTT, s), D-dimer (DD, μg/mL), fibrinogen (FIB, g/L), prothrombin time-international normalized ratio (PT-INR, ratio), prothrombin time (PT, s), thrombin time (TT, s). The coagulation analysis was performed by a CS-5100 analyzer (Sysmex, Japan).
Study size
The sample size was estimated using G*Power version 3.1.9.2. The minimum sample size required for power analysis (b-error 95%; effect size 0.5) was 105 samples. An equal number of cases and controls were randomly selected. The control sample was retained if there was no statistically significant difference in age and gender compared to the silicosis. Subsequently, subjects were randomly divided into training and testing cohorts in a 2:1 ratio. Training and testing samples were retained if there was no statistically significant difference in age ranges.
Statistical analysis
Data processing and statistical analysis were conducted using Excel (Version 2016) and R programming (R Foundation for Statistical Computing, Version 4.2). Three machine learning algorithms Random Forest (RF), Least Absolute Shrinkage and Selection Operator (LASSO) regression, and Support Vector Machine-Recursive Feature Elimination (SVM-RFE) were employed for biomarker selection. RF models, implemented using the randomForest package, consist of multiple decision trees constructed from random subsets of predictors. LASSO regression, executed with the glmnet package, is an extension of generalized linear regression that reduces model complexity by penalizing the loglikelihood function. SVM-RFE is a supervised learning method used for classification and feature selection with the e1071 package. To enhance robustness, biomarkers common to all three methods were selected if statistically different in case and control groups. For categorical variables, comparisons between groups were evaluated through the chi-square test. For continuous variables, we used the t-test in case of normally distributed variables and the Mann-Whitney test otherwise. Differences between the two groups in selected biomarkers were further evaluated through the heatmap, the Venn diagrams and line plots generated using the ggplot2 package. Finally, confounding variables were excluded from the potential set of selected predictors and the multicollinearity was studied. The remaining biomarkers were included in a logistic regression model implemented in R using the glm function, refined through stepwise regression (using the step function) and multicollinearity analysis. The receiver operating characteristic (ROC) curves were generated using the pROC package to assess the diagnostic performance of the selected biomarkers individually and in combination. All statistical analyses were two-tailed, and results were considered statistically significant if the P-value was < 0.05. The diagnostic accuracy of the selected model was further evaluated across the different stages (1–3) of the disease.
Results
Participants
We analyzed 306 silicosis cases and 306 controls. Of the 306 patients with a diagnosis of silicosis, 75 had stage 1 silicosis, 65 had stage 2 silicosis, and 166 had stage 3 silicosis. The training cohort included 204 silicosis patients and 204 controls, while the testing cohort included 102 silicosis patients and 102 controls.
Descriptive data
The mean age of the silicosis group and control group was 55.54 and 55.15 years, respectively. Specifically, since high-intensity physical industries such as coal mining and stone tool making have a clear gender preference, the gender of the silicosis group and the control group in this study was male. There was no statistically significant difference in age and gender between the silicosis group and the control group (P > 0.05). Moreover, the mean age of the case and control groups in the training dataset was 55.22 and 55.02 years old, respectively. The mean age of the case and control groups in the test data set was 56.18 and 55.39 years old, respectively. There were no statistically significant differences between the case and control groups in the training dataset and the test dataset in terms of age range or gender (P > 0.05, Supplementary Table S1).
Blood cell parameters, biochemical and coagulation characteristics
As shown in Table 1, the silicosis patients had significantly lower levels of Bas#, Bas%, Eos%, HCT, HGB, Lym#, Lym%, MCH, MCV, MPV, P-LCC, P-LCR, PDW, RBC, and WBC (P < 0.05). Meanwhile, significantly higher levels of IMG#, IMG%, Mon#, Mon%, Neu#, Neu%, PLT, NLR, and RDW-CV were observed in silicosis patients (P < 0.05). However, the blood cell parameters Eos#, MCHC, PCT, and RDW-SD showed no significant differences between the two groups (P > 0.05).
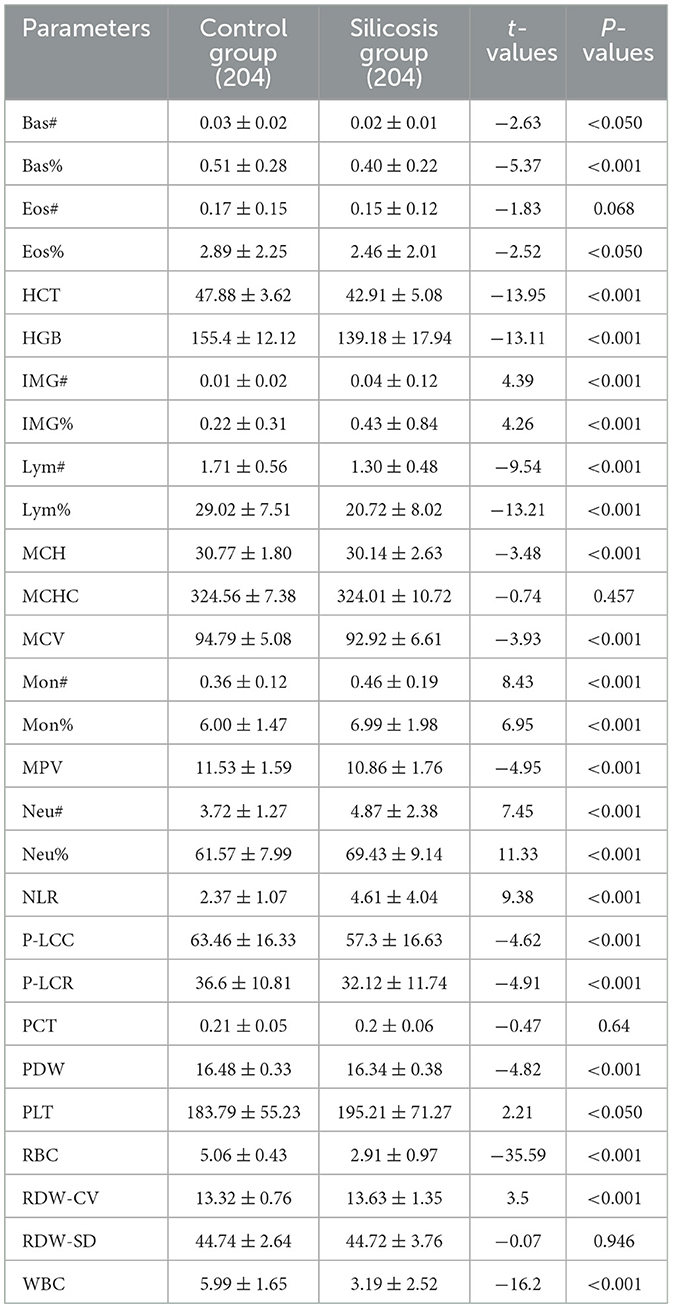
Table 1. Comparison of whole blood cell parameters between the silicosis group and the control group.
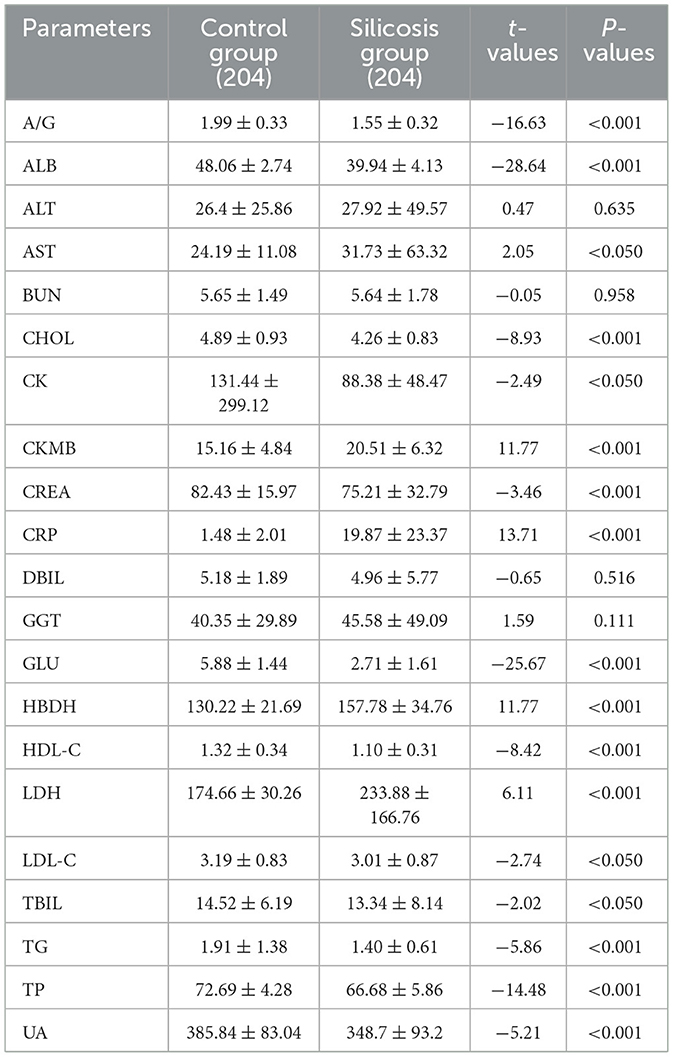
Among the biochemical parameters, there were no significant differences in ALT, BUN, DBIL, and GGT levels between the two groups (P > 0.05). However, other biochemical parameters were altered to varying degrees. Specifically, the levels of A/G, ALB, CHOL, CK, CREA, GLU, HDL-C, LDL-C, TBIL, UA, TG, and TP were significantly lower in the silicosis group, and the levels of AST, CKMB, HBDH, LDH and CRP were significantly higher in the silicosis group (P < 0.05, Table 2).
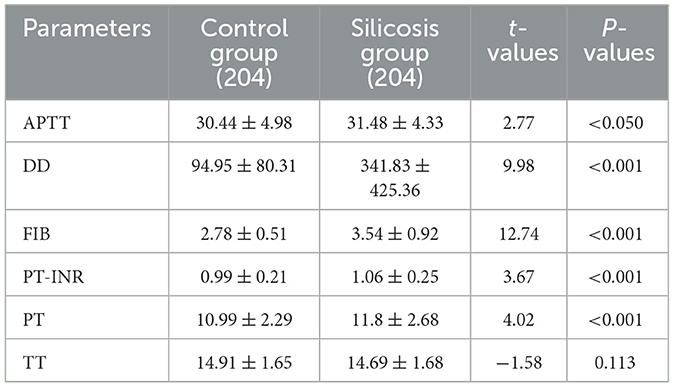
Compared with the control group, coagulation parameters of PT, PT-INR, DD, FIB, and APTT from the silicosis patients were increased (P < 0.05), while there was no significant difference in the level of TT between the two groups (Table 3).
Machine learning for screening silicosis biomarkers
The LASSO regression, SVM-RFE, and RF yielded 18 (Figures 1A, B), 14 (Figures 1C, D), and 13 (Figures 1E, F) biomarkers, respectively. To improve the robustness of the biomarker set, we crossed the biomarkers screened by the three machine learning algorithms, LASSO, SVM, and RF, and finally developed a biomarker set that included eight potential diagnostic biomarkers for silicosis (A/G, ALB, CRP, DD, GLU, LDH, RBC, and WBC).
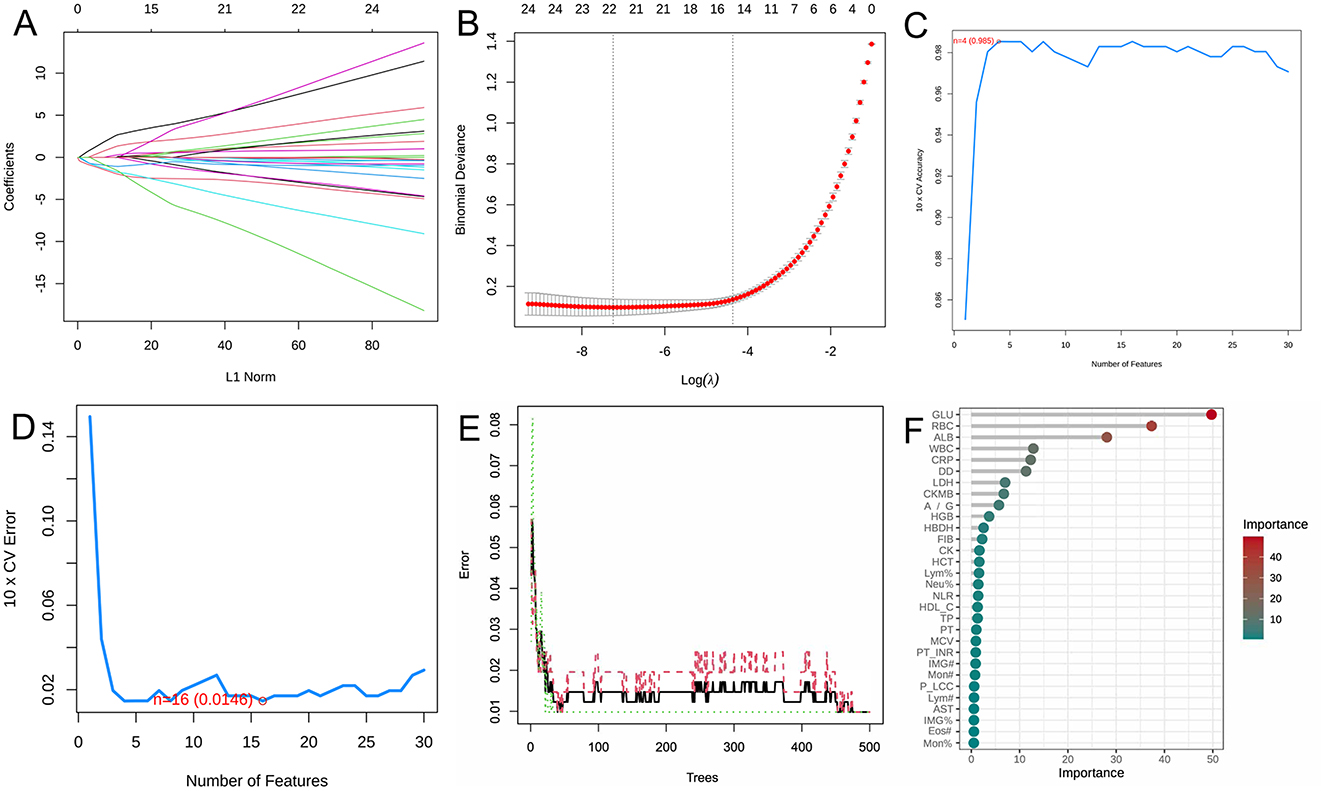
Figure 1. Screening of potential biomarkers with machine learning algorithms. (A) LASSO coefficient profiles of the variables. A vertical line was drawn at the value chosen by 10-fold cross-validation. As the value of λ decreased, the degree of model compression increased and the function of the model to select important variables increased. (B) The cross-validation results. The value in the middle of the two dotted lines is the range of the positive and negative standard deviations of log(λ). The dotted line on the left indicates the value of the harmonic parameter log(λ) when the error of the model is minimized. Nineteen variables were selected when log(λ) = −7.02. (C) Twenty genes were selected based on the SVM-RFE algorithm with the highest accuracy. (D) Twenty genes were selected based on the SVM-RFE algorithm with the lowest error accuracy. (E) The error rate of random survival forest. (F) The top 30 genes were selected and ranked based on the RF algorithm's importance score.
Violin diagrams were further applied to visualize eight potential silicosis biomarkers (Figures 2A–H). Among selected biomarkers, WBC, RBC, ALB, GLU, and A/G showed lower levels in the silicosis group, while LDH, DD and CRP had the opposite trend.
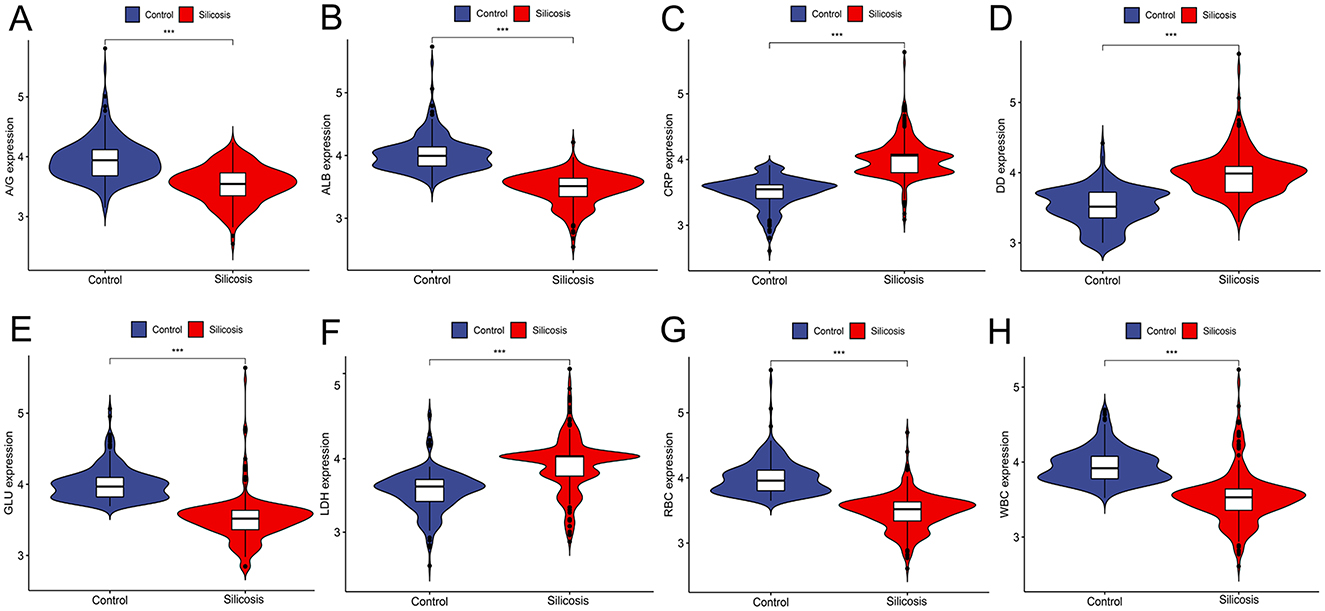
Figure 2. Violin plots of eight biomarker levels from two groups in the training cohort. (A) A/G; (B) ALB; (C) CRP; (D) DD; (E) GLU; (F) LDH; (G) RBC; (H) WBC. *P < 0.05; **P < 0.01; ***P < 0.001; ****P < 0.0001.
Construction of logistic regression model based on selected biomarkers
The heatmap (Figure 3A) showed the distribution of differential parameters between the silicosis group and the control group. The Venn diagram (Figure 3B) showed the intersection of screening results of three machine learning algorithms. Line diagrams (Figure 3C) showed the differences between the two groups for eight potential key biomarkers. Each of these graphs provided valuable information for assessing the diagnostic potential of these biomarkers. Subsequently, a multi-parameter logistic regression model was developed based on the biomarker set. Among eight selected parameters, GLU and ALB are usually influenced by the short/long-term dietary pattern, and CRP is often increased by stochastic factors such as upper respiratory tract infections. Thus, GLU, ALB and CRP were eliminated from the set. The model was further optimized by eliminating non-significant parameters (RBC) through stepwise regression and eliminating parameters with multicollinearity problems. Given the multicollinearity of strongly correlated independent variables in the logistic model, this study analyzed the correlation between eight key biomarkers, and no strong correlation was observed (Figure 3D). A model composed of A/G, DD, LDH and WBC that independently influenced silicosis diagnosis was established by the logistic regression (P < 0.001, Table 4). The logistic regression model is represented as logit P/(1–P) = −1.985 – 3.113*A/G + 7.162*DD + 3.393*LDH – 6.841*WBC. By inputting the predictive indicators into the model, the predicted value (probability P) can be obtained. Encouragingly, the model demonstrated a diagnostic accuracy of 0.931.
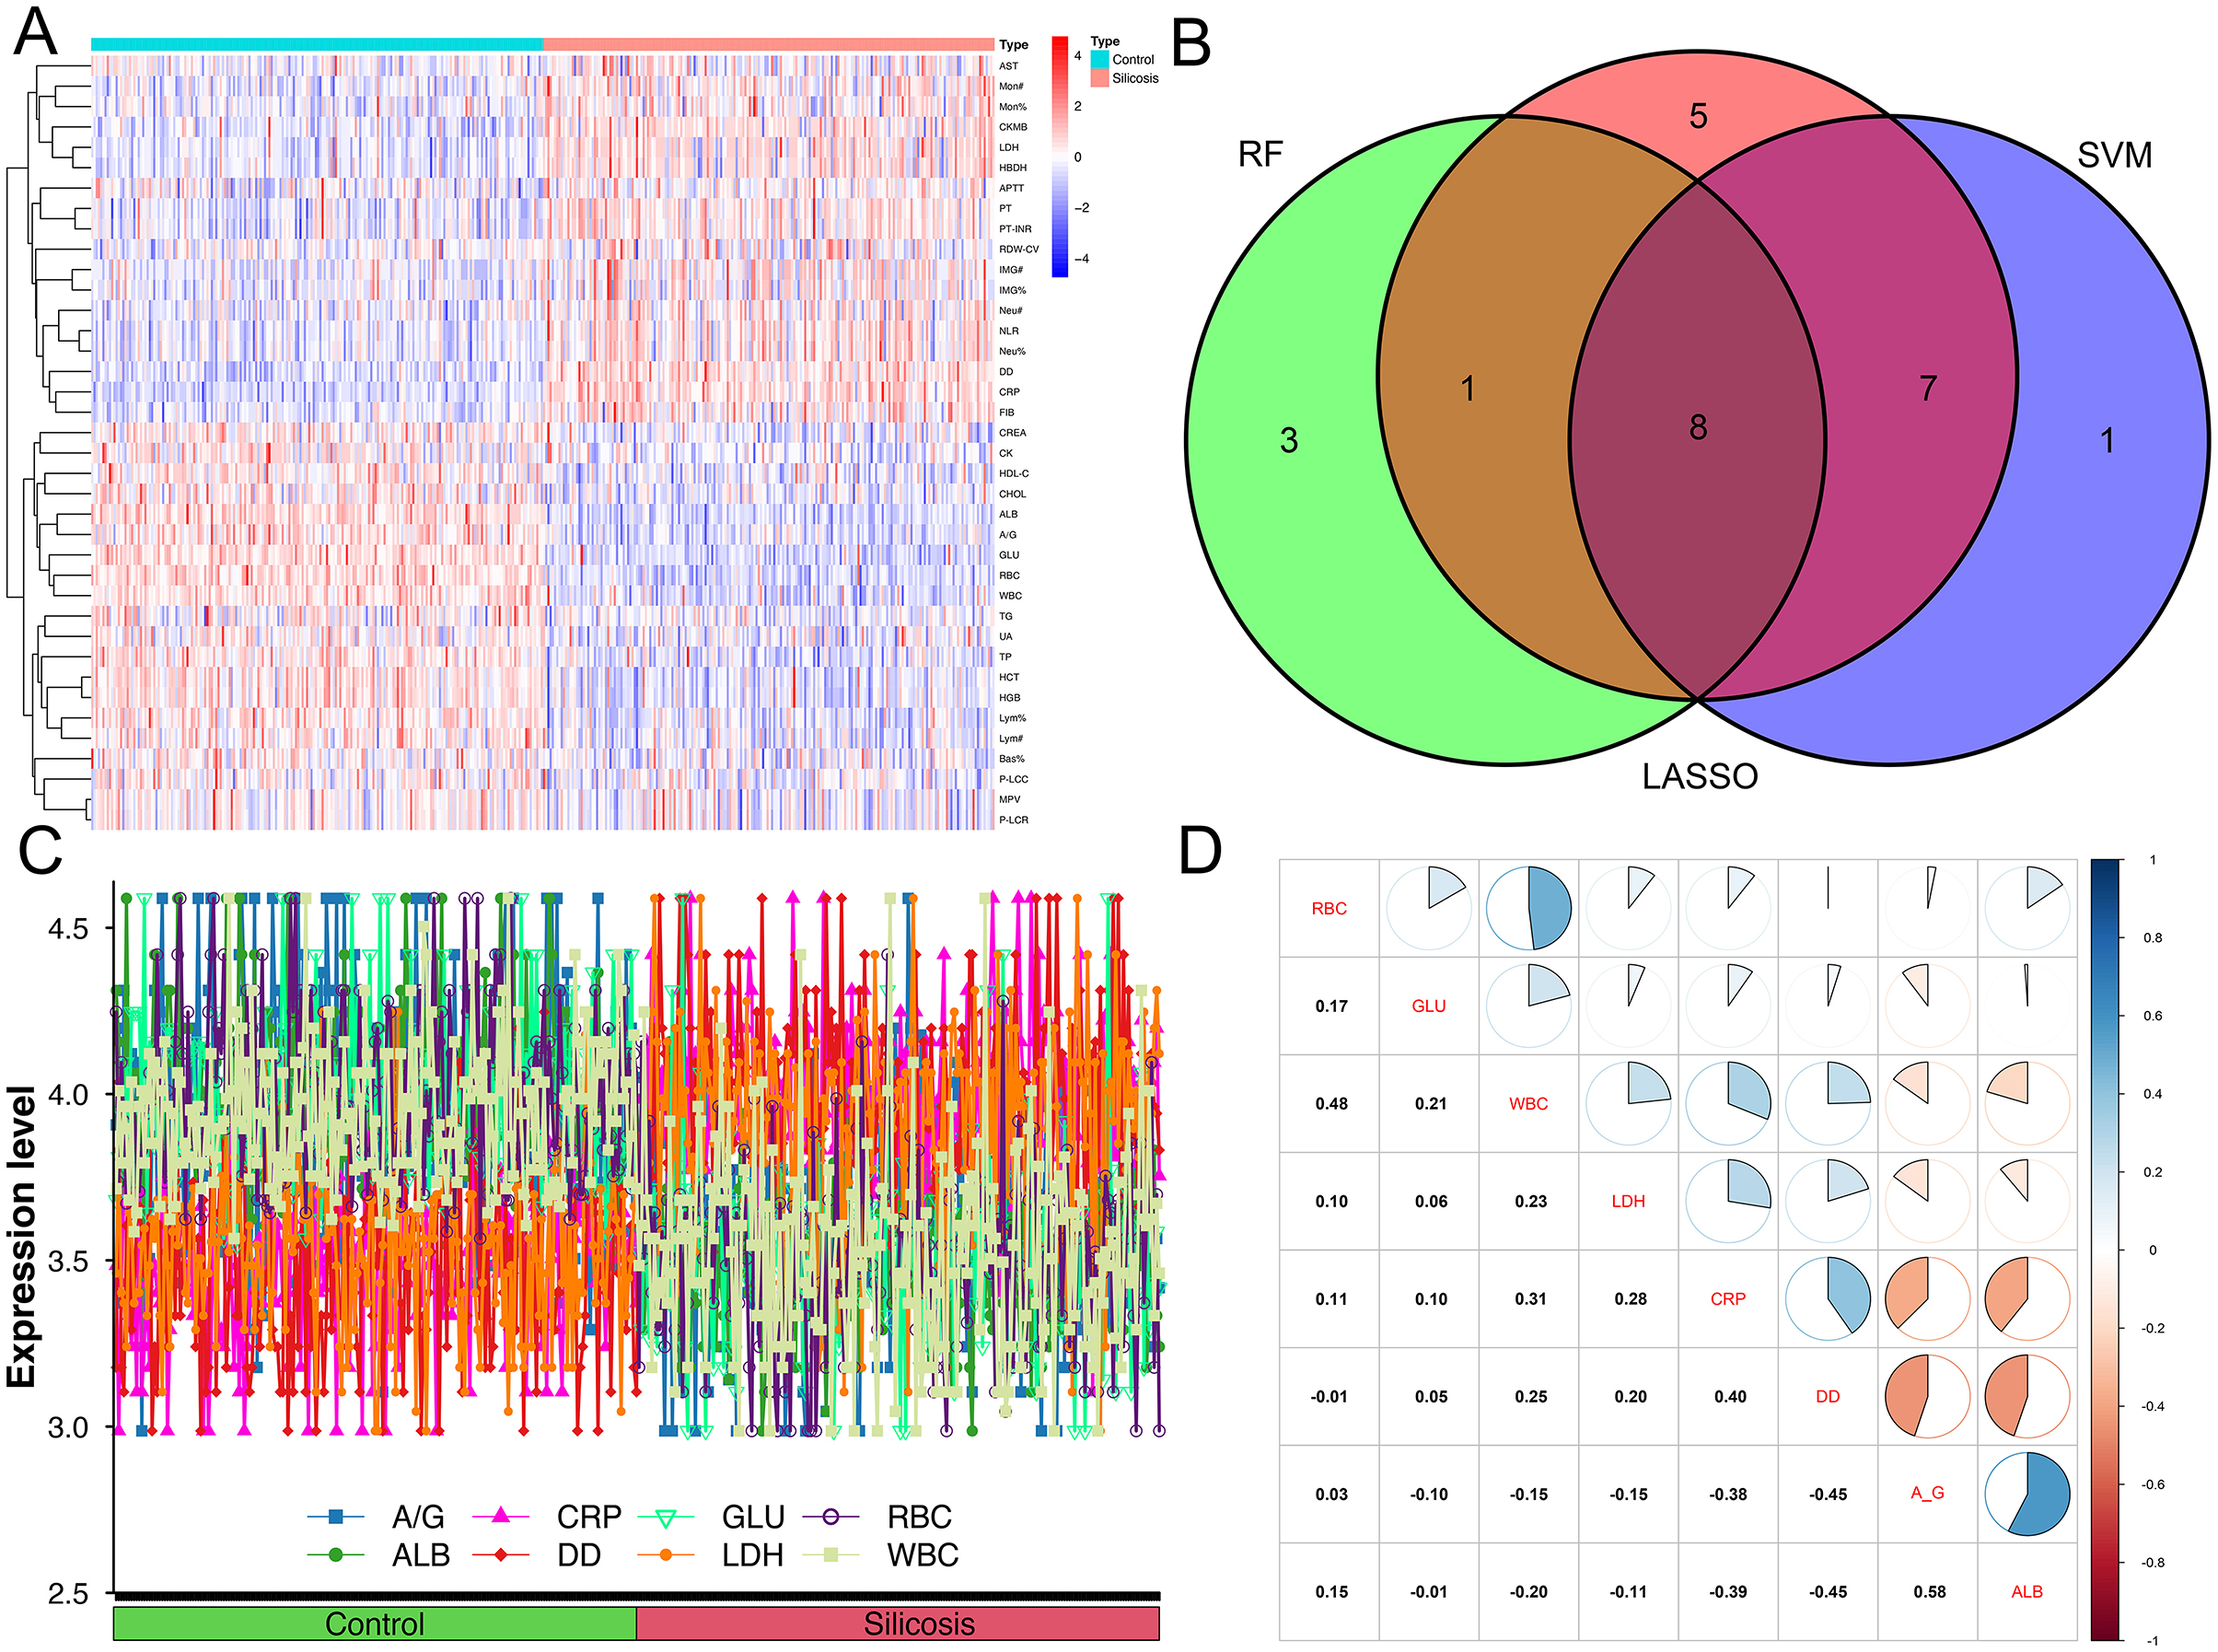
Figure 3. Difference indicators between the two groups and the correlation between eight intersecting biomarkers. (A) Heatmap of indicators that differentiate between silicosis patients and controls; (B) Venn diagrams of three machine algorithms; (C) line graph of eight intersecting biomarkers between silicosis patients and controls; (D) the correlation between eight intersecting biomarkers.

Table 4. . Construction of a logistics regression model for the diagnosis of silicosis by multiple biomarkers.
Independent evaluation of the proposed multi-biomarker logistic model
To assess the predictive value of the proposed multiple biomarker-based logistic model for silicosis diagnostics, the AUC of the logistic model was compared with each of the separate biomarkers. The ROC curve showed that the logistic model had an AUC of 0.982, which was better than that of any single biomarker (Figure 4A). By utilizing the maximum Youden index as a criterion, the cut-off values, AUC, sensitivity, and specificity for each biomarker and the logistic model were determined (Table 5). The logistic model exhibited a sensitivity of 94.6% and a specificity of 95.6% at a threshold value of 0.500. The predictive nomogram was constructed, whereby each biomarker's relative level corresponded to a score, and the total score was obtained by the summation of the score of each biomarker (Figure 4B). Next, the performance of this model was tested in the independent test cohort, obtaining a predictive accuracy of 0.936 and an AUC of 0.979 (Figure 4C).
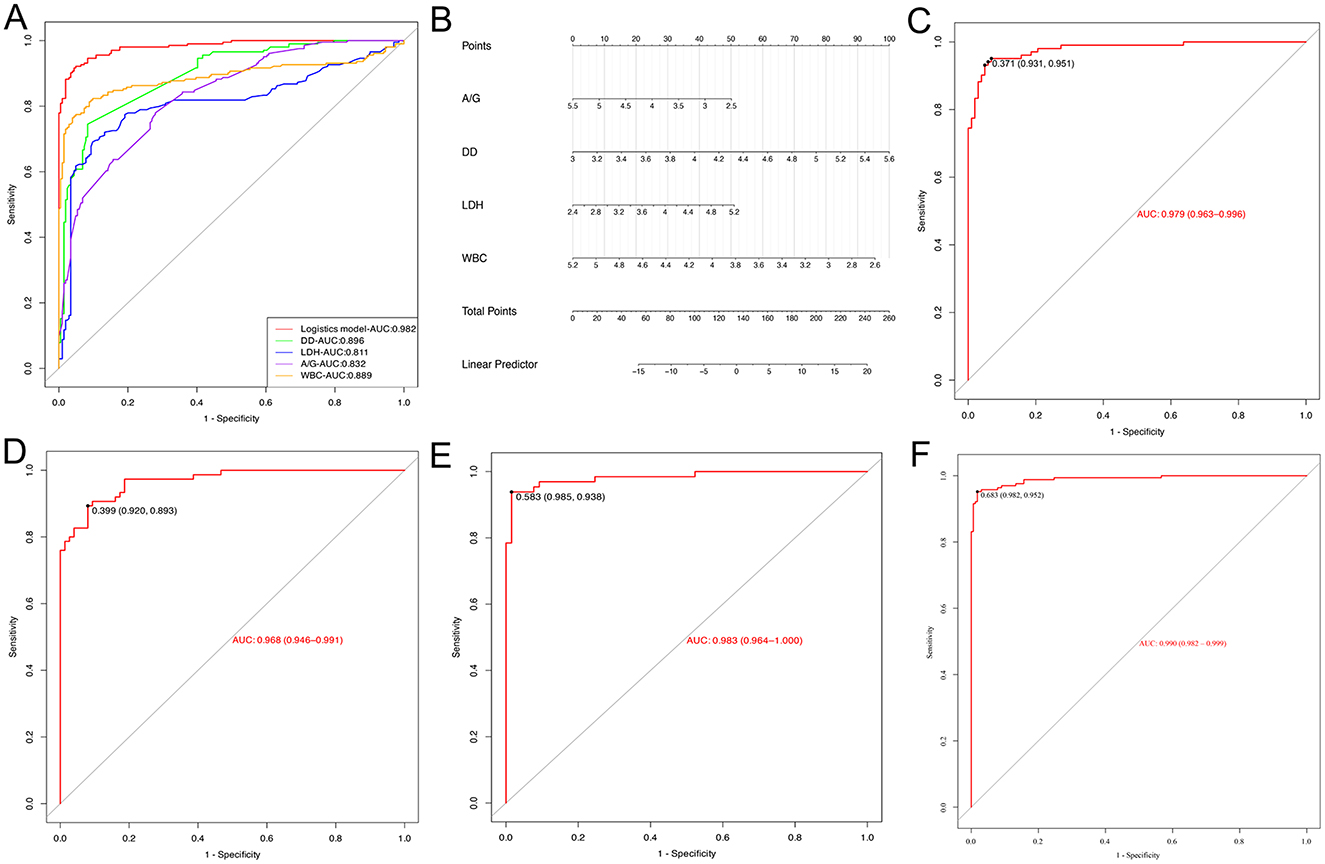
Figure 4. Evaluation of the logistic model. (A) ROC curves for the logistic model used to predict silicosis vs. single laboratory biomarkers. (B) The Nomogram of the logistic model. (C) The ROC curve for the logistic model in the evaluation set. (D) ROC curve of the logistic model for stage 1 silicosis. (E) ROC curve of the logistic model for stage 2 silicosis. (F) ROC curve of the logistic model for stage 3 silicosis.
To explore the diagnostic performance of the logistic model in different stages of silicosis, the diagnostic accuracy and AUC of the model at stages 1, 2, and 3 of silicosis were compared. The results showed that the diagnostic accuracy of the logistic model for stage 1, stage 2, and stage 3 silicosis was 88.0, 95.4, and 94.3%, respectively, with AUC of 0.968, 0.983, and 0.990 (Figures 4D–F).
Discussion
Silicosis is a progressive pneumoconiosis characterized by interstitial fibrosis following exposure to silica dust. According to the Guidelines for the use of the International Labor Organization (ILO) International Classification of Radiographs of Pneumoconiosis, the diagnosis of silicosis primarily includes X-ray posteroanterior chest radiographs and a clear history of silica dust exposure (26). Although silicosis patients may exhibit varying degrees of respiratory symptoms and signs, as well as abnormalities in certain laboratory tests, none of these are specific. In recent years, with the continuous deepening of research on silicosis, some valuable silicosis diagnostic biomarkers have been proposed, such as interleukin-6 (IL6), interleukin-8 (IL8), TNF-α, Clara cell secretory protein 16 (CC16), nephronectin (NPNT), and serum HO-1, shedding light on the pathogenesis and progression of silicosis (19, 27, 28). Furthermore, studies have found that KL-6, surfactant protein D (SP-D) and MMPs are potential biomarkers for diagnosing and monitoring the progression of various fibrotic lung diseases (29). These findings suggest the necessity of applying biomarkers to detect silicosis, in addition to imaging studies and a clear occupational exposure history. However, these biomarkers rely on specialized equipment and expensive consumables, making it difficult to adapt to the widespread regional and population distribution of silicosis. For example, IL-6 and TNF-α are measured by enzyme-linked immunosorbent assays (ELISAs), while KL-6 is measured by electrochemiluminescent immunoassays (ECLIAs), which are expensive and time-consuming. Therefore, we screened routine physical examination indicators with shorter turn-around time (TAT), lower test costs and wider popularity for potential biomarkers related to the progression of silicosis cases. In addition, laboratory indicators have been integrated using mathematical statistical techniques, which is more beneficial than focusing on a single indicator or system to comprehensively describe the pathological process of the disease and improve the sensitivity and specificity of diagnosis.
Previous studies have shown that inhaled silica particles (< 10 μm) reach the distal lung chambers via the mucociliary defenses and may interact with mononuclear alveolar macrophages to induce silicosis (30). Alveolar macrophages either leave the lung when exposed to silica or migrate to the lung interstitium where they are transformed into activated interstitial macrophages. They play a critical role in the progression of silica-induced lung lesions. Our study found that monocyte-related parameters, such as Mon#, Mon%, Neu#, and Neu%, were significantly increased in the silicosis group (P < 0.05), while Lym# and Lym% were significantly decreased, ultimately leading to a reduction in the WBC count. Macrophages originate from monocytes entering the lung from the bloodstream, and alveolar macrophage activation leads to changes within the mononuclear cell system. The increased NLR in the silicosis group is attributed to increased neutrophils and decreased lymphocytes in silicosis patients. Serum ALB and globulin are generally used to indicate nutritional status and chronic inflammation, respectively. Recently, the A/G ratio has emerged as a novel prognostic factor (31). In this study, a lower A/G ratio was observed in the silicosis group, which may be due to both lower ALB levels in the silicosis group and an increase in inflammation-related globulin. Inflammation-associated pulmonary fibrosis has been reported in many studies on the pathogenesis of silicosis, confirming that silicosis is closely associated with inflammatory factors. Clinical biochemistry in the silicosis group confirmed significant increases in inflammatory markers including AST, CKMB, CRP, HBDH, and LDH. In particular, the elevation of LDH in patients with silicosis has been confirmed previously, and evaluations of agate and cowboy sandblasting workers have shown that plasma LDH levels are associated with exposure to silica and the severity of the disease (17). Several other conditions, including systemic infection or inflammation, muscle injury, hemolysis, thromboembolism or malignancy, may also result in elevated plasma LDH concentrations. Finally, in the assessment of coagulation function in silicosis patients, we found that APTT, DD, FIB, PT-INR, and PT were higher in silicosis patients compared with the control group, indicating a coagulation dysfunction in silicosis patients. The coagulation and fibrinolysis system maintains a balance under normal conditions, which may be disturbed by hypoxia. A study by Sabit et al. in 2010 showed that 2 h of hypoxic stimulation led to coagulation activation (32). As a product of the degradation of fibrin, the elevation of DD is indicative of hyperfibrinolysis and a hypercoagulable state (33). We speculate that as silicosis progresses, the increasingly severe pulmonary interstitial fibrosis leads to tissue hypoxia and intravascular microthrombosis, which activates the coagulation system and increases DD. This is consistent with the results of Song et al. in pneumoconiosis (34).
The advent of machine learning has facilitated the integration of artificial intelligence with medical data analysis. Through the utilization of its powerful autonomous learning capabilities, machine learning is capable of constructing complex, multivariate predictive models involving multiple parameters. To enhance the efficacy of machine learning in screening, three distinct machine learning algorithms (LASSO, SVM, and RF) were employed to analyze the training set data and to derive their cross-tabulation results. As a new attempt in the study of diagnostic biomarkers for silicosis, this study identified four conventional indicators (A/G, DD, LDH, and WBC) most clinically associated with silicosis, which constitute a validated model for the prediction of silicosis.
Previous research has proposed a few potential biomarkers for silicosis. However, the diagnostic efficacy of a single biomarker is limited when investigating the complex etiology and long incubation period of occupational diseases (13, 35, 36). Therefore, the combination of several biomarkers is necessary to improve diagnostic efficiency. For example, the combined use of KL-6, SP-D and matrix metalloproteinase-2 (MMP-2) for the diagnosis of asbestos and silicosis achieved a sensitivity of 83% and a specificity of 62% (17). In our study, a statistical synthesis approach based on mathematical statistics was proved to provide better analytical results in the investigation of occupational silicosis. The ROC curve analysis showed that the sensitivity of the combination of the four biomarkers was higher than that of any of the single blood biomarkers. The combination of A/G, DD, LDH and WBC can improve the diagnostic efficacy for silicosis. In addition, due to its simplicity, non-radioactive, and non-invasive nature, this model is expected to be widely used for silicosis diagnostics. However, it should be noted that the application of any diagnostic index for silicosis should be carried out in a population exposed to silica dust.
Several limitations of this pilot study should be also acknowledged. Firstly, given the constraints of retrospective data, we were unable to continuously monitor the biomarker levels of each patient to evaluate the dynamic changes in the progression of silicosis. Secondly, further validation through a large-scale, prospective, multicenter cohort study is expected in the future. Additionally, since lung imaging alterations are critical for the current diagnosis of silicosis, future research might integrate patient imaging characteristics to enhance diagnostic precision.
Conclusions
Based on machine learning, eight potential silicosis biomarkers were selected from routine blood parameters in the clinic, and four biomarker-based (A/G, DD, LDH and WBC) logistic regression model was further developed for the silicosis diagnosis in this study. These routine blood indicators may be used as readily available biomarkers for the adjuvant diagnosis of silicosis. Our study provided a potentially economical, convenient, and efficient strategy for early diagnosis and monitoring of occupational silicosis in occupational disease clinics and primary healthcare institutions.
Data availability statement
The raw data supporting the conclusions of this article will be made available by the authors, without undue reservation.
Ethics statement
The studies involving humans were approved by the Ethics Committee of West China Fourth Hospital of Sichuan University. The studies were conducted in accordance with the local legislation and institutional requirements. The human samples used in this study were acquired from primarily isolated as part of your previous study for which ethical approval was obtained. Written informed consent for participation was not required from the participants or the participants' legal guardians/next of kin in accordance with the national legislation and institutional requirements.
Author contributions
G-kS: Data curation, Validation, Writing— original draft. Y-hX: Investigation, Writing— review & editing. LWa: Formal analysis, Writing— review & editing. P-pX: Data curation, Writing— original draft. Z-xW: Investigation, Writing— review & editing. JZ: Project administration, Writing— review & editing. LWu: Conceptualization, Supervision, Writing— review & editing.
Funding
The author(s) declare financial support was received for the research, authorship, and/or publication of this article. This research was funded by the Medical Research Project of Chengdu Municipal Health Commission (2022365). None of the sponsors had any involvement in the experiment design, specimen collection or data analysis. Additionally, no funder played a role in drafting the manuscript.
Conflict of interest
The authors declare that the research was conducted in the absence of any commercial or financial relationships that could be construed as a potential conflict of interest.
Publisher's note
All claims expressed in this article are solely those of the authors and do not necessarily represent those of their affiliated organizations, or those of the publisher, the editors and the reviewers. Any product that may be evaluated in this article, or claim that may be made by its manufacturer, is not guaranteed or endorsed by the publisher.
Supplementary material
The Supplementary Material for this article can be found online at: https://www.frontiersin.org/articles/10.3389/fpubh.2024.1450439/full#supplementary-material
References
1. Leung CC Yu ITS, Chen W. Silicosis. Lancet. (2012) 379:2008–18. doi: 10.1016/S0140-6736(12)60235-9
2. Pollard KM. Silica, silicosis, and autoimmunity. Front Immunol. (2016) 7:97. doi: 10.3389/fimmu.2016.00097
3. Harijith A, Ebenezer DL, Natarajan V. Reactive oxygen species at the crossroads of inflammasome and inflammation. Front Physiol. (2014) 5:352. doi: 10.3389/fphys.2014.00352
4. Sayan M, Mossman BT. The NLRP3 inflammasome in pathogenic particle and fibre-associated lung inflammation and diseases. Part Fibre Toxicol. (2016) 13:51. doi: 10.1186/s12989-016-0162-4
5. Hoy R, Chambers DC. Silicosis: an ancient disease in need of a dose of modern medicine. Respirology. (2020) 25:464–5. doi: 10.1111/resp.13766
6. Zhang R, Liu S, Zheng S. Characterization of nano-to-micron sized respirable coal dust: particle surface alteration and the health impact. J Hazard Mater. (2021) 413:125447. doi: 10.1016/j.jhazmat.2021.125447
7. Ahmad I, Khan MI, Patil G, Chauhan LKS. Evaluation of cytotoxic, genotoxic and inflammatory responses of micro- and nano-particles of granite on human lung fibroblast cell IMR-90. Toxicol Lett. (2012) 208:300–7. doi: 10.1016/j.toxlet.2011.11.004
8. Yi X, He Y, Zhang Y, Luo Q, Deng C, Tang G, et al. Current status, trends, and predictions in the burden of silicosis in 204 countries and territories from 1990 to 2019. Front Public Health. (2023) 11:1216924. doi: 10.3389/fpubh.2023.1216924
9. Austin EK, James C, Tessier J. Early detection methods for silicosis in Australia and Internationally: a review of the literature. Int J Environ Res Public Health. (2021) 18:8123. doi: 10.3390/ijerph18158123
10. Liu X, Jiang Q, Wu P, Han L, Zhou P. Global incidence, prevalence and disease burden of silicosis: 30 years' overview and forecasted trends. BMC Public Health. (2023) 23:1366. doi: 10.1186/s12889-023-16295-2
11. Li T, Yang X, Xu H, Liu H. Early identification, accurate diagnosis, and treatment of silicosis. Can Respir J. (2022) 2022:3769134. doi: 10.1155/2022/3769134
12. Krefft S, Wolff J, Rose C. Silicosis: an update and guide for clinicians. Clin Chest Med. (2020) 41:709–22. doi: 10.1016/j.ccm.2020.08.012
13. Liu K, Sun L, Li S, Xu H. Combined application of multiple biomarkers for early auxiliary diagnosis of silicosis. Toxicol Ind Health. (2023) 39:138–45. doi: 10.1177/07482337231154636
14. Alix-Panabières C, Pantel K. Liquid biopsy: from discovery to clinical application. Cancer Discov. (2021) 11:858–73. doi: 10.1158/2159-8290.CD-20-1311
15. Căluţu IM, Sma̧ra̧ndescu RA, Raşcu A. biomonitoring exposure and early diagnosis in silicosis: a comprehensive review of the current literature. Biomedicines. (2022) 11:100. doi: 10.3390/biomedicines11010100
16. Adamcakova J, Mokra D. New insights into pathomechanisms and treatment possibilities for lung silicosis. Int J Mol Sci. (2021) 22:4162. doi: 10.3390/ijms22084162
17. Blanco-Pérez JJ, Blanco-Dorado S, Rodríguez-García J, Gonzalez-Bello ME, Salgado-Barreira Á, Caldera-Díaz AC, et al. Serum levels of inflammatory mediators as prognostic biomarker in silica exposed workers. Sci Rep. (2021) 11:13348. doi: 10.1038/s41598-021-92587-0
18. Naha N, Muhamed JCJ, Pagdhune A, Sarkar B, Sarkar K. Club cell protein 16 as a biomarker for early detection of silicosis. Indian J Med Res. (2020) 151:319–25. doi: 10.4103/ijmr.IJMR_1799_18
19. Nandi SS, Lambe UP, Sarkar K, Sawant S, Deshpande J. A rapid point of care CC16 kit for screening of occupational silica dust exposed workers for early detection of silicosis/silico-tuberculosis. Sci Rep. (2021) 11:23485. doi: 10.1038/s41598-021-02392-y
20. El-Beheidy R, Domouky AM, Zidan H, Amer YA. Serum KL-6 as predictive and prognostic marker of interstitial lung disease in childhood connective tissue diseases: a pilot study. Reumatismo. (2021) 73:1399. doi: 10.4081/reumatismo.2021.1399
21. Wu J, Lu AD, Zhang LP, Zuo YX, Jia YP. Study of clinical outcome and prognosis in pediatric core binding factor-acute myeloid leukemia. Zhonghua Xue Ye Xue Za Zhi. (2019) 40:52–7. doi: 10.3760/cma.j.issn.0253-2727.2019.01.010
22. Liu J, Zhang R, Song HY, Xia Q, Zhao TT, Pan LP, et al. The effects of long-term exposure to silica dust on serum CC16 and KL-6 levels. Zhonghua Lao Dong Wei Sheng Zhi Ye Bing Za Zhi. (2019) 37:567–70. doi: 10.3760/cma.j.issn.1001-9391.2019.08.002
23. Ji X, Wu B, Jin K, Luo C, Han R, Chen M, et al. MUC5B promoter polymorphisms and risk of coal workers' pneumoconiosis in a Chinese population. Mol Biol Rep. (2014) 41:4171–6. doi: 10.1007/s11033-014-3100-2
24. Lee S, Honda M, Yamamoto S, Kumagai-Takei N, Yoshitome K, Nishimura Y, et al. Role of nephronectin in pathophysiology of silicosis. Int J Mol Sci. (2019) 20:2581. doi: 10.3390/ijms20102581
25. Jimenez AL, Gómez GJ, Molina AH, Doña AC, Caro AC. Biomarkers in peripheral blood from patients with chronic silicosis caused by artificial quartz agglomerates. Eur Respir J. (2019) 54 (Suppl. 63):PA5192. doi: 10.1183/13993003.congress-2019.PA5192
26. Muszyńska-Graca M, Dabkowska B, Brewczyński PZ. Guidelines for the use of the International Classification of Radiographs of Pneumoconioses of the International Labour Office (ILO): substantial changes in the currrent edition. Med Pr. (2016) 67:833–7. doi: 10.13075/mp.5893.00493
27. Zhang M, Peng LL, Ji XL, Yang HB, Zha RS, Gui GP. Tumor necrosis factor gene polymorphisms are associated with silicosis: a systemic review and meta-analysis. Biosci Rep. (2019) 39:BSR20181896. doi: 10.1042/BSR20181896
28. Lee JS, Shin JH, Lee JO, Lee W-J, Hwang J-H, Kim JH, et al. Blood levels of IL-Iβ, IL-6, IL-8, TNF-α, and MCP-1 in pneumoconiosis patients exposed to inorganic dusts. Toxicol Res. (2009) 25:217–24. doi: 10.5487/TR.2009.25.4.217
29. Xue C, Wu N, Li X, Qiu M, Du X, Ye Q. Serum concentrations of Krebs von den Lungen-6, surfactant protein D, and matrix metalloproteinase-2 as diagnostic biomarkers in patients with asbestosis and silicosis: a case-control study. BMC Pulm Med. (2017) 17:144. doi: 10.1186/s12890-017-0489-0
30. Sato T, Saito Y, Inoue S, Shimosato T, Takagi S, Kaneko T, et al. Serum heme oxygenase-1 as a marker of lung function decline in patients with chronic silicosis. J Occup Environ Med. (2012) 54:1461–6. doi: 10.1097/JOM.0b013e3182636e93
31. Wu PP, Hsieh YP, Kor CT, Chiu PF. Association between albumin-globulin ratio and mortality in patients with chronic kidney disease. J Clin Med. (2019) 8:1991. doi: 10.3390/jcm8111991
32. Sabit R, Thomas P, Shale DJ, Collins P, Linnane SJ. The effects of hypoxia on markers of coagulation and systemic inflammation in patients with COPD. Chest. (2010) 138:47–51. doi: 10.1378/chest.09-2764
33. Moresco RN, Júnior RH, Cláudio Rosa Vargas L, Mariano da Rocha Silla L. Association between plasma levels of D-dimer and fibrinogen/fibrin degradation products (FDP) for exclusion of thromboembolic disorders. J Thromb Thrombolysis. (2006) 21:199–202. doi: 10.1007/s11239-006-4837-9
34. Song YG, Hao FT, Zhu J, Li A, Xia YJ, Wang DX. Clinical study on pneumoconiosis with pulmonary thromboembolism. Zhonghua Lao Dong Wei Sheng Zhi Ye Bing Za Zhi. (2008) 26:39–42. doi: 10.3760/cma.j.issn.1001-9391.2008.01.010
35. Wang SX, Liu P, Wei MT, Chen L, Guo Y, Wang RY, et al. Roles of serum clara cell protein 16 and surfactant protein-D in the early diagnosis and progression of silicosis. J Occup Environ Med. (2007) 49:834–9. doi: 10.1097/JOM.0b013e318124a927
Keywords: silicosis, early diagnostics, liquid biopsy, biomarkers, machine learning
Citation: Sun G-k, Xiang Y-h, Wang L, Xiang P-p, Wang Z-x, Zhang J and Wu L (2025) Development of a multi-laboratory integrated predictive model for silicosis utilizing machine learning: a retrospective case-control study. Front. Public Health 12:1450439. doi: 10.3389/fpubh.2024.1450439
Received: 17 June 2024; Accepted: 23 December 2024;
Published: 15 January 2025.
Edited by:
Rudy Foddis, University of Pisa, ItalyReviewed by:
Pierpaolo Ferrante, National Institute for Insurance Against Accidents at Work (INAIL), ItalyAndrey Korchevskiy, Chemistry and Industrial Hygiene, Inc., United States
Copyright © 2025 Sun, Xiang, Wang, Xiang, Wang, Zhang and Wu. This is an open-access article distributed under the terms of the Creative Commons Attribution License (CC BY). The use, distribution or reproduction in other forums is permitted, provided the original author(s) and the copyright owner(s) are credited and that the original publication in this journal is cited, in accordance with accepted academic practice. No use, distribution or reproduction is permitted which does not comply with these terms.
*Correspondence: Ling Wu, d3VsaW5nMDYxMEBmb3htYWlsLmNvbQ==
 Guo-kang Sun
 Yun-hui Xiang
 Lu Wang3
 Pin-pin Xiang