- School of Public Health, Bengbu Medical University, Bengbu, China
Polycyclic aromatic hydrocarbons (PAHs) were measured in 342 daily PM10 samples collected in four seasons at a site in Bengbu, China. This study was a qualitative and quantitative investigation of the emission sources of atmospheric PAHs in Bengbu and the spatial distribution of regional PAH sources in PM10 samples. The annual concentrations of the 16 EPA priority PAHs ranged from 1.45 to 62.16 ng/m3, with an annual mean of 7.63 ± 7.38 ng/m3. The seasonal trends during the year were: winter (6.13–62.16 ng/m3, median = 14.99 ng/m3) > autumn (2.01–18.78 ng/m3, median = 4.90 ng/m3) > spring (1.45–19.34 ng/m3, median = 3.32 ng/m3) > summer (1.57–4.27 ng/m3, median = 2.12 ng/m3). The PAHs over the year were dominated by medium-molecular-weight PAHs (39.81%), followed by high-molecular-weight PAHs (35.77%), and low-molecular-weight PAHs (24.42%). The diagnostic ratio method and positive matrix factorization revealed that the PAH sources in Bengbu in spring and summer were industrial emissions, coal and biomass combustion, and traffic emissions; while the sources in autumn and winter were coal and biomass combustion and traffic emissions. According to a backward trajectory clustering analysis and potential source contribution function analysis, Bengbu City was mainly affected by pollution from the northern and northwestern regions in spring, autumn, and winter, while it was more affected by the coastal monsoon in summer. The PAH pollution in Bengbu was most severe in spring, autumn, and winter, and the health risk to the population was also most severe at that time. The health risk to adult males (3.35 × 10⁻⁴) was greater than the risk to adult females (3.14 × 10⁻⁴), and the health risk to adults was greater than the risk to children (2.52 × 10⁻⁴).
1 Introduction
Polycyclic aromatic hydrocarbons (PAHs) are hydrocarbons consisting of two or more benzene rings linked together in a fused ring. They are widely distributed in various media, such as the atmosphere, water, and soil (1). Although PAHs occur only in trace amounts in the environment, they have been identified by the United States Environmental Protection Agency (USEPA) and the European Union (EU) as priority pollutants for environmental control because of their toxicity and potential for bioconcentration, and they present a serious risk to ecosystems and human health (2). Studies have shown that PAHs can attach to airborne particles and accumulate in the body through inhalation, ingestion, or absorption through skin contact, leading to poisoning, anemia, neurotoxicity, lung cell damage, and other respiratory problems (3). Polycyclic aromatic hydrocarbons can also cause serious health problems such as birth defects, genetic damage, and lung and skin cancer (4).
Several researchers have already conducted studies on PAHs in atmospheric particulate matter and have identified seasonal trends. In a study of atmospheric PAHs in Shanghai, Chen Y et al. (5) derived annual PAH concentrations of 167 ± 109 ng/m3 in an urban area and 216 ± 86.5 ng/m3 in a suburban area. The same seasonal trend was observed at both sites, with the highest concentrations occurring in winter and the lowest in autumn. In a study in the coastal area of Dalian (6), the average PAH concentrations in air and seawater were 27.5 ± 14.6 ng/m3 and 49.5 ± 20.5 ng/L, respectively. The PAH concentrations in air were seasonal, being higher in winter (99 ng/m3) than in summer (2.7 ng/m3). Many studies of airborne PAHs, including those referred to above, have focused on large cities, while the effects of atmospheric PAH pollution in small and medium-sized towns have not received as much attention.
Polycyclic aromatic hydrocarbons from the incomplete combustion of organic matter (such as coal, oil, and natural gas) and the pyrolysis of large organic compounds dominate atmospheric emissions (7). To better understand and control PAH pollution processes, several methods have been developed to identify PAH sources. Diagnostic PAH ratios (8) and positive matrix factorization (PMF) (9) are common methods applied for pollution source analysis. Ali-Taleshi MS et al. (10) used these two methods in their study in the Tehran region of Iran and found that industrial and petroleum emissions contributed the most to overall PAH pollution during the non-heating period (19.8 and 27.2%, respectively), while vehicle exhaust and biomass-fired natural gas emissions contributed the most during the heating period (40.7 and 29.6%, respectively). The application of diagnostic PAH ratios and PMF modeling by Chao S et al. (11) showed that the largest contribution to PAH emissions in downtown Beijing came from vehicle emissions (54.6%), followed by coal combustion (29.8%). The combination of the two source analysis techniques makes the source results more reliable by validating each other, although this has not been commonly undertaken in small and medium-sized city studies.
In addition to the sources of emissions, the long-range transport of air pollutants is also a matter of great concern. Duan L et al. (12) found that the Yangtze River Delta region was the main PAH source area in Hangzhou in spring and summer, while in autumn and winter PAH pollution mainly originated from long-range transport from northern China. Zhang Y et al. (13) showed that the contribution of long-distance transport from northern Wuhan to the north and east of China was greater than that from southern China, while the contributions from local areas were higher than that from long-range transport. In the analysis of aerosol samples from the Chongqing metropolitan area (14), a potential source contribution function (PSCF) analysis was used to identify south-eastern Sichuan and north-western Chongqing as the main potential PAH sources. Therefore, the identification of source areas using a cluster analysis and the PSCF method was necessary to improve the management of pollutant emissions in each region and to achieve the joint regional management of the atmosphere across regions. Many studies have not addressed the long-range transport of atmospheric pollution when investigating PAH sources.
Bengbu city is located in the middle reaches of the Huai River, with a total area of 969.39 km2 and a total population over 800,000 within its urban area. This makes it one of China’s small and medium-sized cities. (15). It is situated in the middle of Anhui Province and is an important node of the East China Economic Zone and the Yangtze River Delta Economic Circle. This geographical location makes Bengbu an important transport hub connecting East and Central China, and Bengbu has a relatively well-developed industrial base and economic system compared to other locations in eastern China. It is therefore considered a typical small to medium-sized city in the Yangtze River Delta region (16). In recent years, the Yangtze River Delta region has experienced frequent and severe haze (17). Atmospheric studies in the Yangtze River Delta region have focused on large cities such as Shanghai (18), Nanjing (19), and Hefei (20), and have not yet investigated the small and medium-sized cities. Based on recent environmental monitoring data, Bengbu ranks poorly in air quality compared to other areas within Anhui Province (21). Quantitative source identification related to atmospheric PAHs was considered in this study for a more precise understanding of pollution emissions. To determine the spatial distribution of pollutant sources, we used the backward trajectory method of airflow to trace the atmospheric transport of pollutants. We also conducted a potential source analysis to identify the areas with the greatest impact on pollution in Bengbu City.
The main objectives of this study were to: (1) analyze the changes in atmospheric PAHs concentrations as well as the season and molecular structure (i.e., number of rings) trends in Bengbu over a whole year; (2) investigate the specific PAH sources in Bengbu using a combination of the qualitative diagnostic PAH ratios method and a quantitative PMF model; (3) trace all the pollutant streams entering Bengbu City using the HYSPLIT model to identify the areas in Bengbu City with high levels of pollution through a potential source analysis; (4) assess the health risks of PAHs to the population of Bengbu City, we also calculated the possible health risks of air pollution on adult males, adult females, and children. These data provide important information for policy makers to develop emission reduction strategies to reduce PAH emissions and improve air quality in Bengbu and other similar small and medium-sized cities in China.
2 Experimental materials and analysis
2.1 Sampling site and sampling
The sampling site was located on the rooftop of a teaching building at Bengbu Medical University (117.433°E, 32.908°N) at a height of about 15 m above ground level. The sampling duration was from October 2021 to September 2022. All PM10 samples were collected using a high-flow particulate sampler (Model 2031, Laoshan Institute of Applied Technology, Qingdao, China) with a flow rate of 1.05 m3/min and a daily sampling period of 23 h. Sampling times were fixed, from 9:00 a.m. each day to 8:00 a.m. the next day. A total of 342 samples were collected. Samples were collected on glass fiber membranes (20 × 25 cm, Shanghai Xingya Purification Material Factory), which were placed in a muffle furnace at 400°C for 4 h prior to sampling to remove organic matter. After sampling, the membranes were folded and sealed in aluminum foil envelopes and then stored in a refrigerator at −20°C prior to analysis. The meteorological parameters observed during the study period are shown in Table 1.
2.2 Analysis of PAHs
The method described in the “Determination of polycyclic aromatic hydrocarbons in ambient air and exhaust gas phase and particulate matter by gas chromatography–mass spectrometry (HJ 646–2013)” was used for the analysis of PAHs, with a slight modification (22). Each PM10 sample was placed in a 20 mL sample bottle and a dichloromethane (≥99.9%, Shanghai Aladdin Biochemical Technology Co., China)/hexane (95%, Shanghai Aladdin Biochemical Technology Co., China; 1:1, V/V) solution was added until the filter membrane was completely immersed. The sample bottle was ultrasonically extracted twice for 10 min using an ultrasonic cleaner. After ultrasound, the supernatant was extracted into a sharp-bottomed tube. Then, the sharp-bottomed tube was placed on a water bath nitrogen blowing apparatus to concentrate the solution. Then n-hexane and the internal standard (naphthalene-d8, acenaphthene-d10, phenanthrene-d10, chrysene-d12, and perylene-d12, Shanghai Anpu Experimental Technology Co.) were added and the solution was transferred to a gas chromatography vial (23).
Samples were analyzed by gas chromatography–mass spectrometry (5975C-7890A, Agilent, Santa Clara, CA, United States). A column (30 m × 0.25 mm × 0.25 μm; DB-5MS, Agilent) was used to quantify PAHs and 1 μL of the sample was injected in splitless mode. The MS was operated in electron impact mode at 70 eV. The selected ion monitoring mode was used to collect the data. Helium was used as the carrier gas at a flow rate of 0.5 mL/min (24). The temperature program of the GC oven was 100°C and held for 2 min at the first stage, then increased to 320°C at rate of 10°C/min and kept for 5 min. The 16 USEPA priority PAHs are: naphthalene (Nap), acenaphthylene (Acy), acenaphthene (Ace), fluorene (Flu), phenanthrene (Phe), anthracene (An), fluoranthene (Fl), pyrene (Pyr), benzo(a)anthracene (BaA), chrysene (Chr), benzo(b)fluoanthene (BbF), benzo(k)fluoranthene (BkF), benzo(a)pyrene (BaP), indeno (1,2,3-cd) pyrene (IcP), dibenzo (a, h)anthracene (DBA), benzo (g, h, i)perylene (BghiP) (25).
2.3 Quality assurance and quality control
The atmospheric samplers underwent a routine flow rate calibration to ensure precise sampling, and strict quality assurance and control measures were adopted for all analytical procedures. Throughout the experimental procedures, meticulous quality control and assurance were maintained with the use of method blanks, program blanks, and standard spiked recovery samples during the testing phase. In the detection process, the correlation coefficient for the standard curve of the 16 priority PAHs exceeded 0.99. A blank filter was placed the power-off sampler and treated the same as a normal sampling filter. The relative deviation of PAHs in parallel samples was rigorously controlled to be below 15%, accompanied by a sample repeatability of 10%. A blank was added after every three samples in the GC–MS procedure to check for sample contamination. Deuterated PAHs (naphthalene-d8, acenaphthene-d10, phenanthrene-d10, chrysene-d12, and perylene-d10, US o2si smart solution) were added to the samples as recovery substitutes for detection, and the recoveries were within the acceptable range of 74.38 to 128.42%. The detection limits (ng/m3) were: 0.026 (Nap), 0.008 (Acy), 0.008 (Ace), 0.011 (Flu), 0.015 (Phe), 0.031 (An), 0.014 (Fl), 0.033 (Pyr), 0.029 (BaA), 0.030 (Chr), 0.021 (BbF), 0.013 (BkF), 0.015 (BaP), 0.015 (IcP), 0.003 (DBA), and 0.009 (BghiP).
2.4 Source apportionment of PAHs
2.4.1 The PAH diagnostic ratios
Diagnostic ratios are widely used to identify and assess PAH emission sources (26) The Flu/(Flu + Pyr), Ant/(Ant + Phe), BaA/(BaA + Chr), and InP/(InP + BghiP) diagnostic ratios were used in this study (27).
2.4.2 Positive matrix factorization modeling
The USEPA PMF 5.0 model was used for the qualitative and quantitative identification of PAH sources. It is a receptor-based source apportionment model, which is recommended by the USEPA (28). The uncertainty was calculated from the method detection limit (MDL) and determination error fraction. If the concentration was lower than MDL, the uncertainty was set to 5/6 of the MDL; if the concentration was higher than MDL, the uncertainty was set to the square root of the sum of squared error fraction-weighted concentration and squared MDL (29).
2.4.3 The HYSPLIT model
We calculated backward trajectories using the HYSPLIT model.1 The model was run at starting times of 00:00, 06:00, 12:00, and 18:00 UTC every day during the sampling period. The duration of the calculation was 48 h and the height was 500 m above ground level. Daily meteorological data obtained from the Global Data Assimilation System was provided by the National Centers for Environmental Prediction. The HYPSPLIT model results were saved as endpoint files and then imported into the TrajStat software2 for trajectory clustering and statistics. The PSCF was determined using TrajStat to identify the spatial distribution of PAH sources.
2.5 Health risk assessment of PAHs
Inhalation is a crucial pathway for PAH exposure. The incremental life-time cancer risk (ILCR) model was used in this study to assess the carcinogenic risk of PAHs. This is an effective evaluation model based on BaP to assess human health risks. The calculation formula of the health risk assessment model is shown in Equation 1.
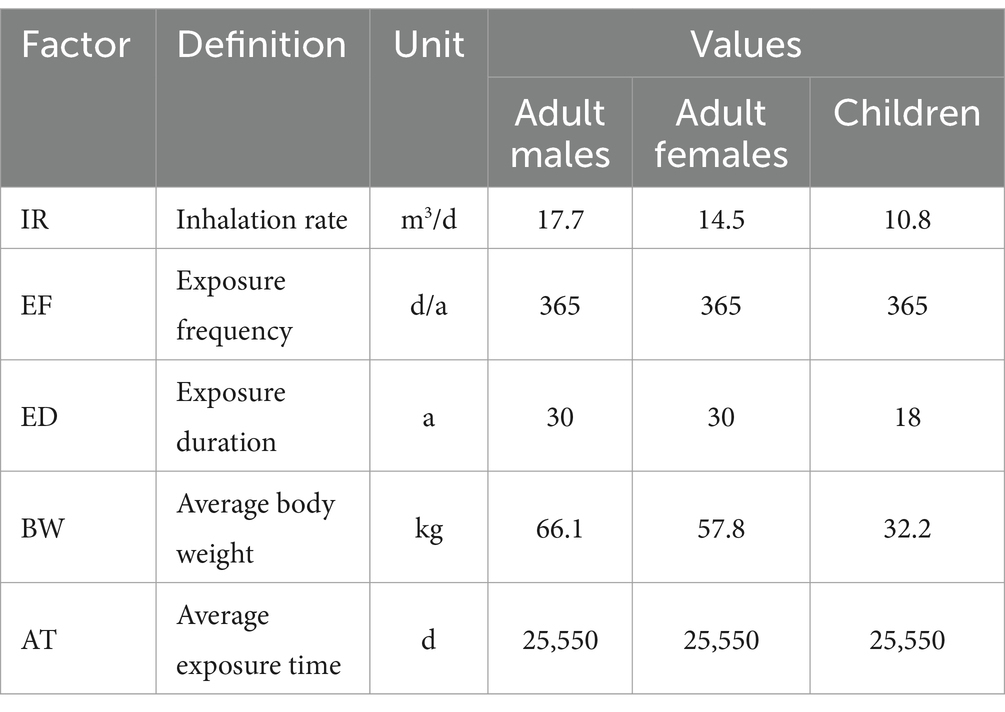
where, CSF is the inhalation cancer slope factor of BaP, 3.14 kg d mg−1; CA is the BaP equivalent (BaPeq) concentration, in mg/m3, and is calculated from the product of the concentration and the toxicity equivalency factor (TEF) of each PAH congener. The TEFs of the 16 priority PAHs are as follows: NaP, Ace, Acy, Fl, Phe, Flu, and Pyr = 0.001; Ant, BghiP, and Chry = 0.01; BaA, BbF, BkF, and InP = 0.1; and BaP and DahA = 1 (30, 31). The other parameters of human inhalation exposure (32) were as presented in Table 2.
2.6 Data analysis
Statistical analyses were performed using SPSS (IBM SPSS software 22.0), including a one-way analysis of variance (ANOVA), with statistical significance at p < 0.05; and mean, range, and variance of PAH concentrations. Origin 2023 software was used to produce graphs of PAH concentration changes and seasonal variations.
3 Results and discussion
3.1 Seasonal variation of PAH concentrations
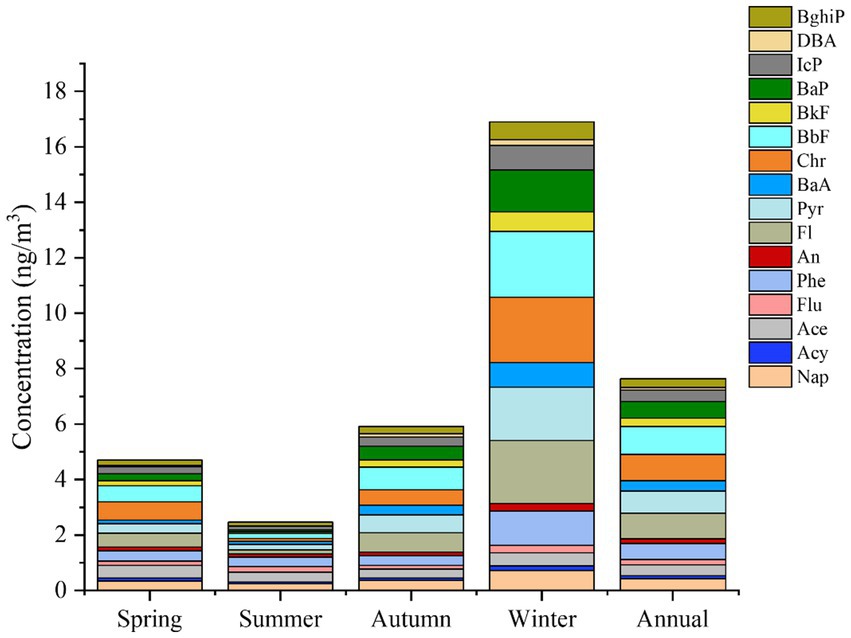
The PAH concentrations over the whole year ranged from 1.45 to 62.16 ng /m3, the median was 4.36 ng/m3, with an annual mean concentration (± standard deviation, SD) of 7.63 ± 7.38 ng/m3. Among the 16 PAHs, Phe, Flt, Pyr, Chr, BbF, and BaP were the most abundant, accounting for 63.71% of the total PAHs, as shown in Figure 1. The overall PAH concentrations were higher than the observed PAH concentration in atmospheric PM10 in Sri Lanka (3.06–36.88 ng/m3) (33), Bangkok (35.80–55.50 ng/m3) (34), and Chengdu (12.25–58.56 ng/m3) (35); but lower than the PAH concentration in atmospheric PM10 in the Xinjiang region (11.98–138.46 ng/m3) (36), Hefei (17.70–78.26 ng/m3) (20) and Guangzhou (7.4–159.4 ng/m3) (37). This indicates an average level of PAH pollution in the Bengbu area.
In terms of seasonal trends, the PAH concentration was significantly higher in winter than in the other three seasons (one-way ANOVA, p < 0.01). No significant differences were observed among the other three seasons. Overall, the values decreased in the order of winter (6.13–62.16 ng/m3, median = 14.99 ng/m3) > autumn (2.01–18.78 ng/m3, median = 4.90 ng/m3) > spring (1.45–19.34 ng/m3, median = 3.32 ng/m3) > summer (1.57–4.27 ng/m3, median = 2.12 ng/m3). This trend was consistent with those reported in previous studies in the central Qilian Mountains (38) and Zaragoza, Spain (39).
Among the 16 PAH monomers, BaP presented a carcinogenic risk due to its frequency of occurrence, high toxicity, and potential threat to human health. In our study, its annual mean concentration was 0.61 ng/m3, accounting for 8.11% of ΣPAHs. The mean BaP concentration was much higher in winter (1.51 ng/m3) than in the other seasons (spring: 0.27 ng/m3; summer: 0.08 ng/m3; and autumn: 0.49 ng/m3). In this study, the mean winter ρ(BaP) concentration was 1.51 ng/m3 and did not exceed the secondary level (2.5 ng/m3) in China’s air quality standard (GB 3095–2012). The ρ(BaP) concentration in winter in Bengbu was 1/10 of the winter BaP concentration in Urumqi (10.94 ng/m3) (40), 1/14 of the winter concentration in Chengde (14.3 ng/m3) (41), and 1.11 times the winter concentration in Isfahan (1.35 ng/m3) (42), suggesting that the carcinogenic risk of BaP from respiratory exposure of the residents in the present study was lower than that in the Urumqi and Chengde regions and higher than that in the Isfahan region. During the winter sampling period there were 9 days when the BaP concentrations exceeded 2.5 ng/m3. Residents of Bengbu may therefore face a health risk from respiratory exposure to PAHs during the winter.
3.2 The PAH compositions
Polycyclic aromatic hydrocarbons can be separated into low-molecular-weight (LMW, 2–3 rings), middle-molecular-weight (MMW, 4 rings), and high-molecular-weight (HMW, 5–6 rings) congeners. The LMW and MMW PAHs are more volatile than the HMW PAHs and are generally present in both the particle and gaseous phases. The HMW PAHs are only present in the particle phase (43).
The proportions of ΣPAHs in the four seasons were winter (56.50%) > autumn (19.78%) > spring (16.61%) > summer (7.11%). The PAHs over the full year were dominated by MMW PAHs (39.81%), followed by HMW PAHs (35.77%), and LMW PAHs (24.42%). The contribution of the PAHs of different molecular weights in the various seasons is shown in Figure 2. It can be seen that MMW and HMW PAHs accounted for the largest proportion (75.58%) of PAHs over the year. The highest proportions of MMW and HMW PAHs occurred in spring, autumn, and winter (66.81, 76.63, and 81.41%, respectively), while for LMW PAHs the highest proportion occurred during the summer months (53.01%). This could be due to PAHs tending to accumulate on particles during the colder seasons. In summer, the high temperature and relative humidity, together with high rainfall (Table 1) may have promoted the rapid degradation of PAHs, and also promoted strong photochemical reactions with atmospheric radicals and ozone (44).
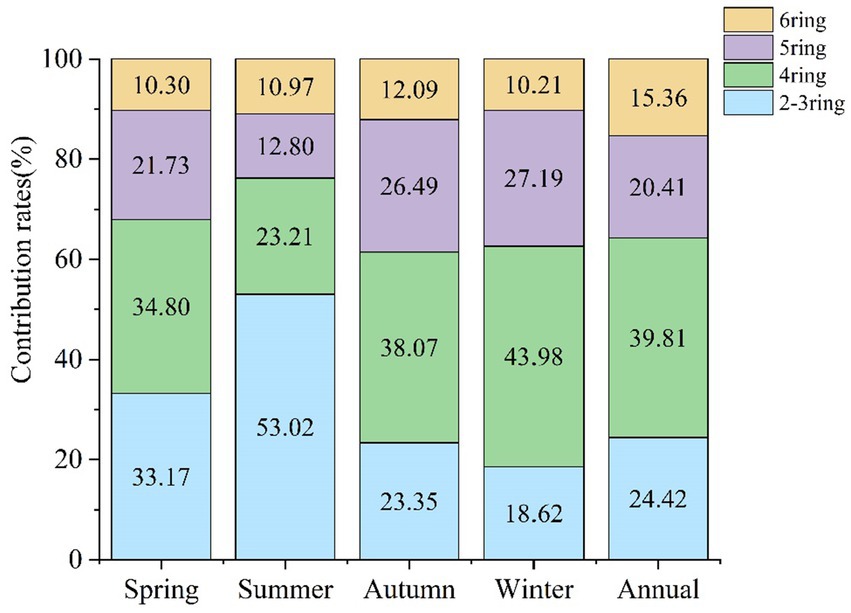
Figure 2. Contributions of PAHs with different ring numbers to the total PAH concentration in the four seasons.
3.3 Source apportionment of PAHs
3.3.1 The PAH diagnostic ratios
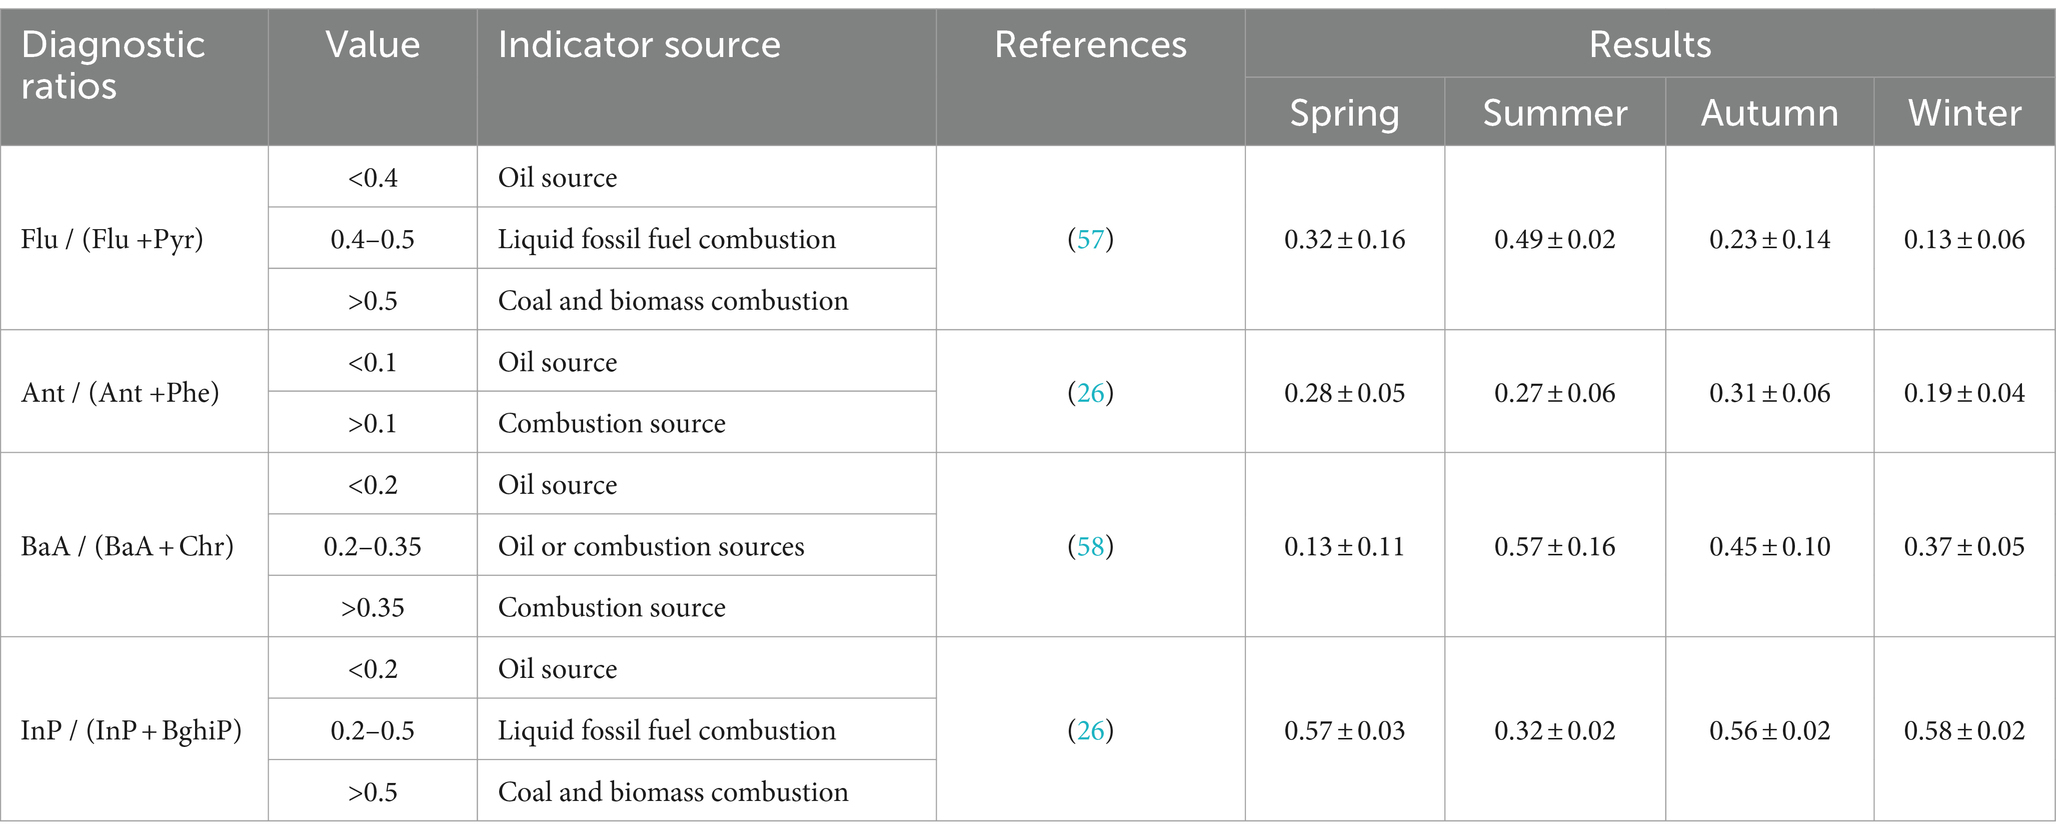
The BaA/(BaA + Chr), Flu/(Flu+Pyr), Ant/(Ant+Phe), and InP/(InP + BghiP) ratios were calculated to investigate the PAH sources in Bengbu City, with the results shown in Table 3.
The values of BaA/(BaA + Chr) in spring were in the range of 0.05–0.22, with mean values below 0.2, whereas the values of Flu/(Flu + Pyr) in autumn and winter were in the ranges of 0.09–0.39 and 0.05–0.23, respectively, with mean values below 0.4, indicating the contribution of petroleum sources in spring, autumn, and winter. Additionally, the values of InP/(InP + BghiP) were 0.51–0.63, 0.54–0.59, and 0.55–0.61 in spring, autumn, and winter, respectively. The average values were all >0.5, indicating that there was also a combination of contributions from coal and biomass combustion in spring, autumn, and winter. In contrast, the summer values of Flu/(Flu + Pyr) and InP/(InP + BghiP) were 0.46–0.51 and 0.28–0.35, respectively, with mean values of 0.49 and 0.32, indicating that the main PAH source in summer was the combustion of liquid fossil fuels. The average value of Ant/(Ant + Phe) over the four seasons was >0.1, demonstrating that combustion sources had an effect on PAH pollution in Bengbu City during the study period.
The results of the diagnostic ratios method showed that the PAH sources varied among the four seasons, with petroleum emissions, coal and biomass combustion, and liquid fossil fuel combustion being the main sources contributing to PAH pollution in Bengbu.
3.3.2 The PMF model
Four distinct PAH sources were identified in the four seasons (Figure 3).
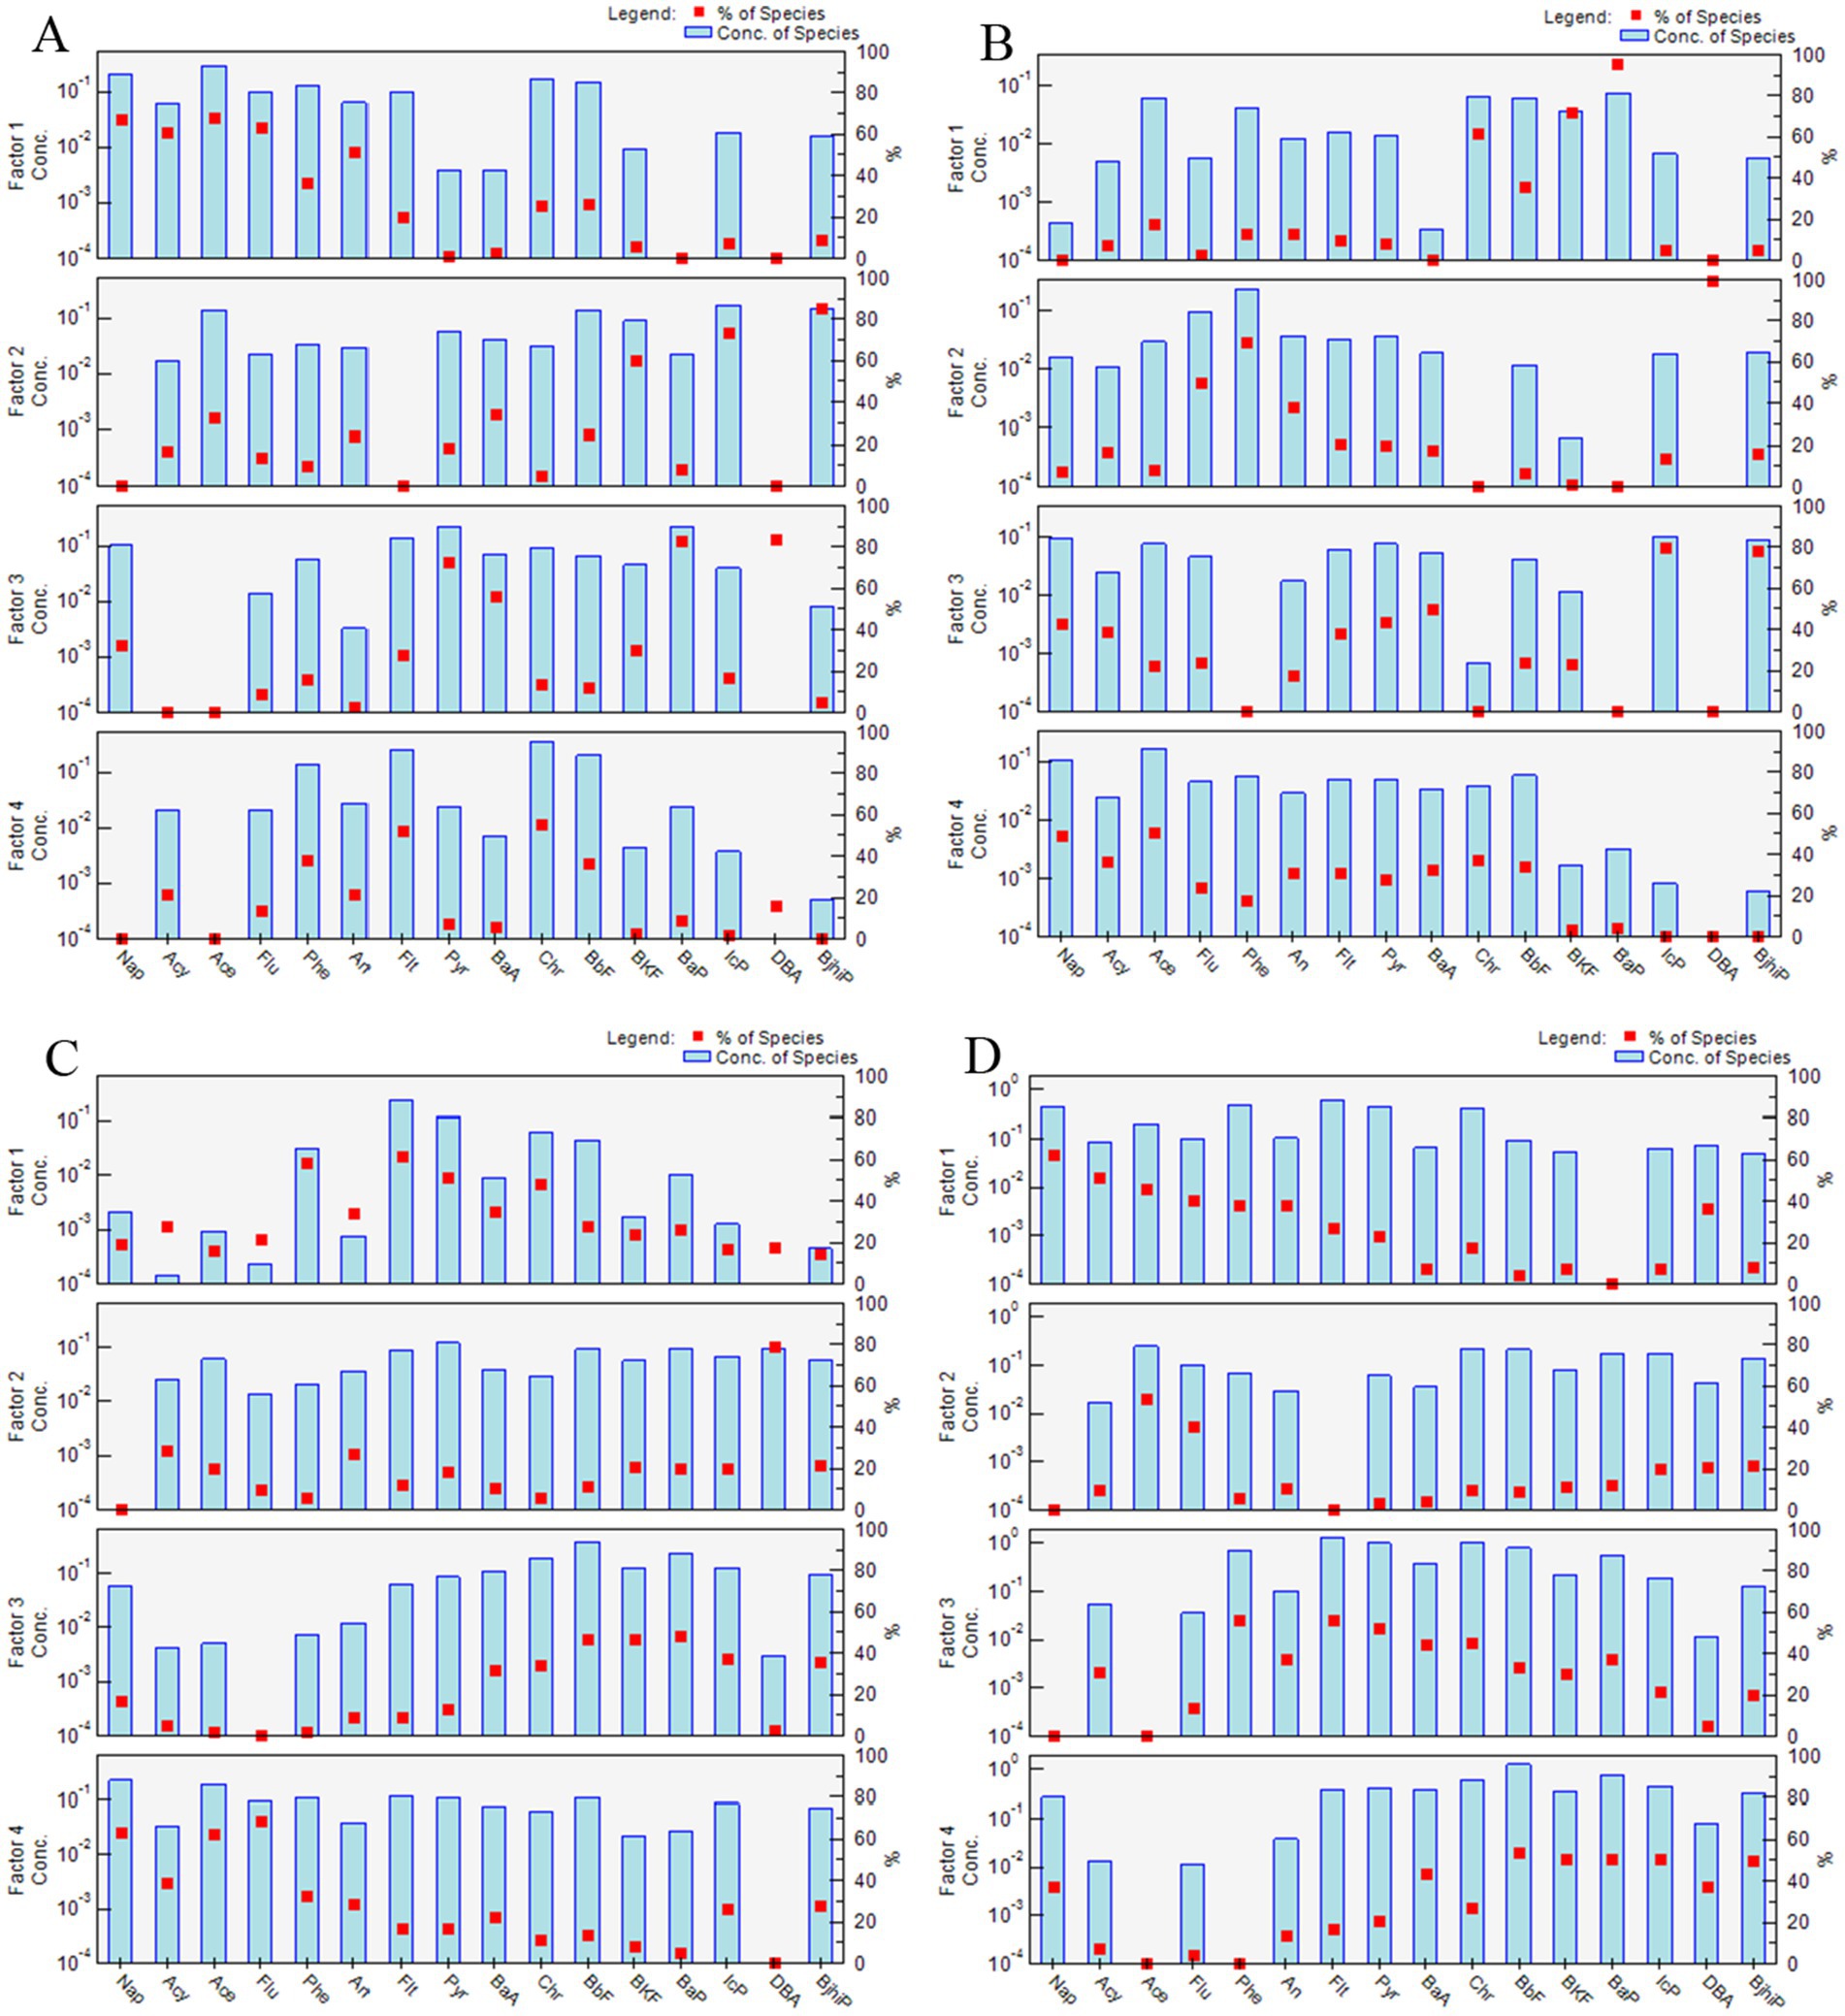
Figure 3. Source profiles and individual contributions of each factor to the PAH concentrations in the four seasons: (A) spring, (B) summer, (C) autumn, and (D) winter.
Spring factor 1, summer and autumn factor 3, and winter factor 4 were highly loaded with Phe, Ant, Fl, Pyr, BaA, and Chr, which are major constituents of coal and biomass combustion emissions (45). Their contribution was larger in winter (42.39%) than in spring (21.46%), summer (20.34%), and autumn (24.94). The highest contributions of coal and biomass combustion occurred in the winter months, probably due to the high use of coal and biomass for heating (29) and occurrence of temperature inversions, which are not conducive to the diffusion of pollutants (46).
Benzo(a)pyrene is often considered to be a good marker of powered vehicles, while BkF is an important component of diesel-powered vehicles (47), and InP, DBA, BghiP, are typical markers of traffic emissions (48). Factor 3 in spring, factor 1 in summer, factor 4 in autumn, and factor 2 in winter were mainly composed of BaA, Chr, B(b/k) F, BaP, InP, DBA, and BghiP, which have been identified as markers of traffic emissions. Their contributions throughout the year were spring (12.29%), summer (35.78%), autumn (27.96%), and winter (18.40%). Their contribution was particularly prominent in summer, probably because the production of PAHs was enhanced under the high temperatures and intense light conditions of summer (41).
Factor 4 in spring, factor 2 in summer, factor 1 in autumn, and factor 3 in winter were predominantly weighted by BaP, followed by B(b/k) F, Chr, and Phe. These monomers are recognized as markers of the coking industry (29). Their contributions were spring (23.31%), summer (11.50%), autumn (21.17%), and winter (21.80%). The contributions of industrial emissions varied little among the four seasons, suggesting that industrial pollution emissions were relatively constant during the study period.
Low-molecular-weight PAHs are typical markers of the volatilization of crude oil and petroleum products (49). Factor 2 in spring, factor 4, in summer, factor 2 in autumn, and factor 1 in winter were mostly associated with Acy, Ace, Flu, and Phe. Therefore, the source may be emissions from the volatilization of crude oil and petroleum products. The contributions of the four seasons were spring (42.94%), summer (32.38%), autumn (25.93%), and winter (17.41%). The higher contributions in spring and summer than in autumn and winter were probably due to higher contributions from crude oil and oil volatiles as a result of the warmer temperatures (41).
From the PMF results it could be concluded that the PAH sources in spring and summer were industrial emissions, volatile emissions from crude oil and petroleum products, and traffic emissions, while the PAH sources in autumn and winter were coal and biomass combustion and industrial emissions. The PMF results were essentially the same as the diagnostic ratio method.
3.3.3 The HYSPLIT model
Air mass trajectories during the four seasons were clustered based on the characteristics of the spatial distributions of the trajectories in each season. Figure 4 shows the clusters of the backward trajectories for each sampling season. Four distinct clusters were identified. The PSCF values and potential spatial distributions of PAH sources in Bengbu are presented in Figure 5. The color of the legend represents the potential pollution level: red represents high pollution levels, while blue represents low pollution levels. Pollution levels varied greatly from season to season due to the different trajectories of the air masses.
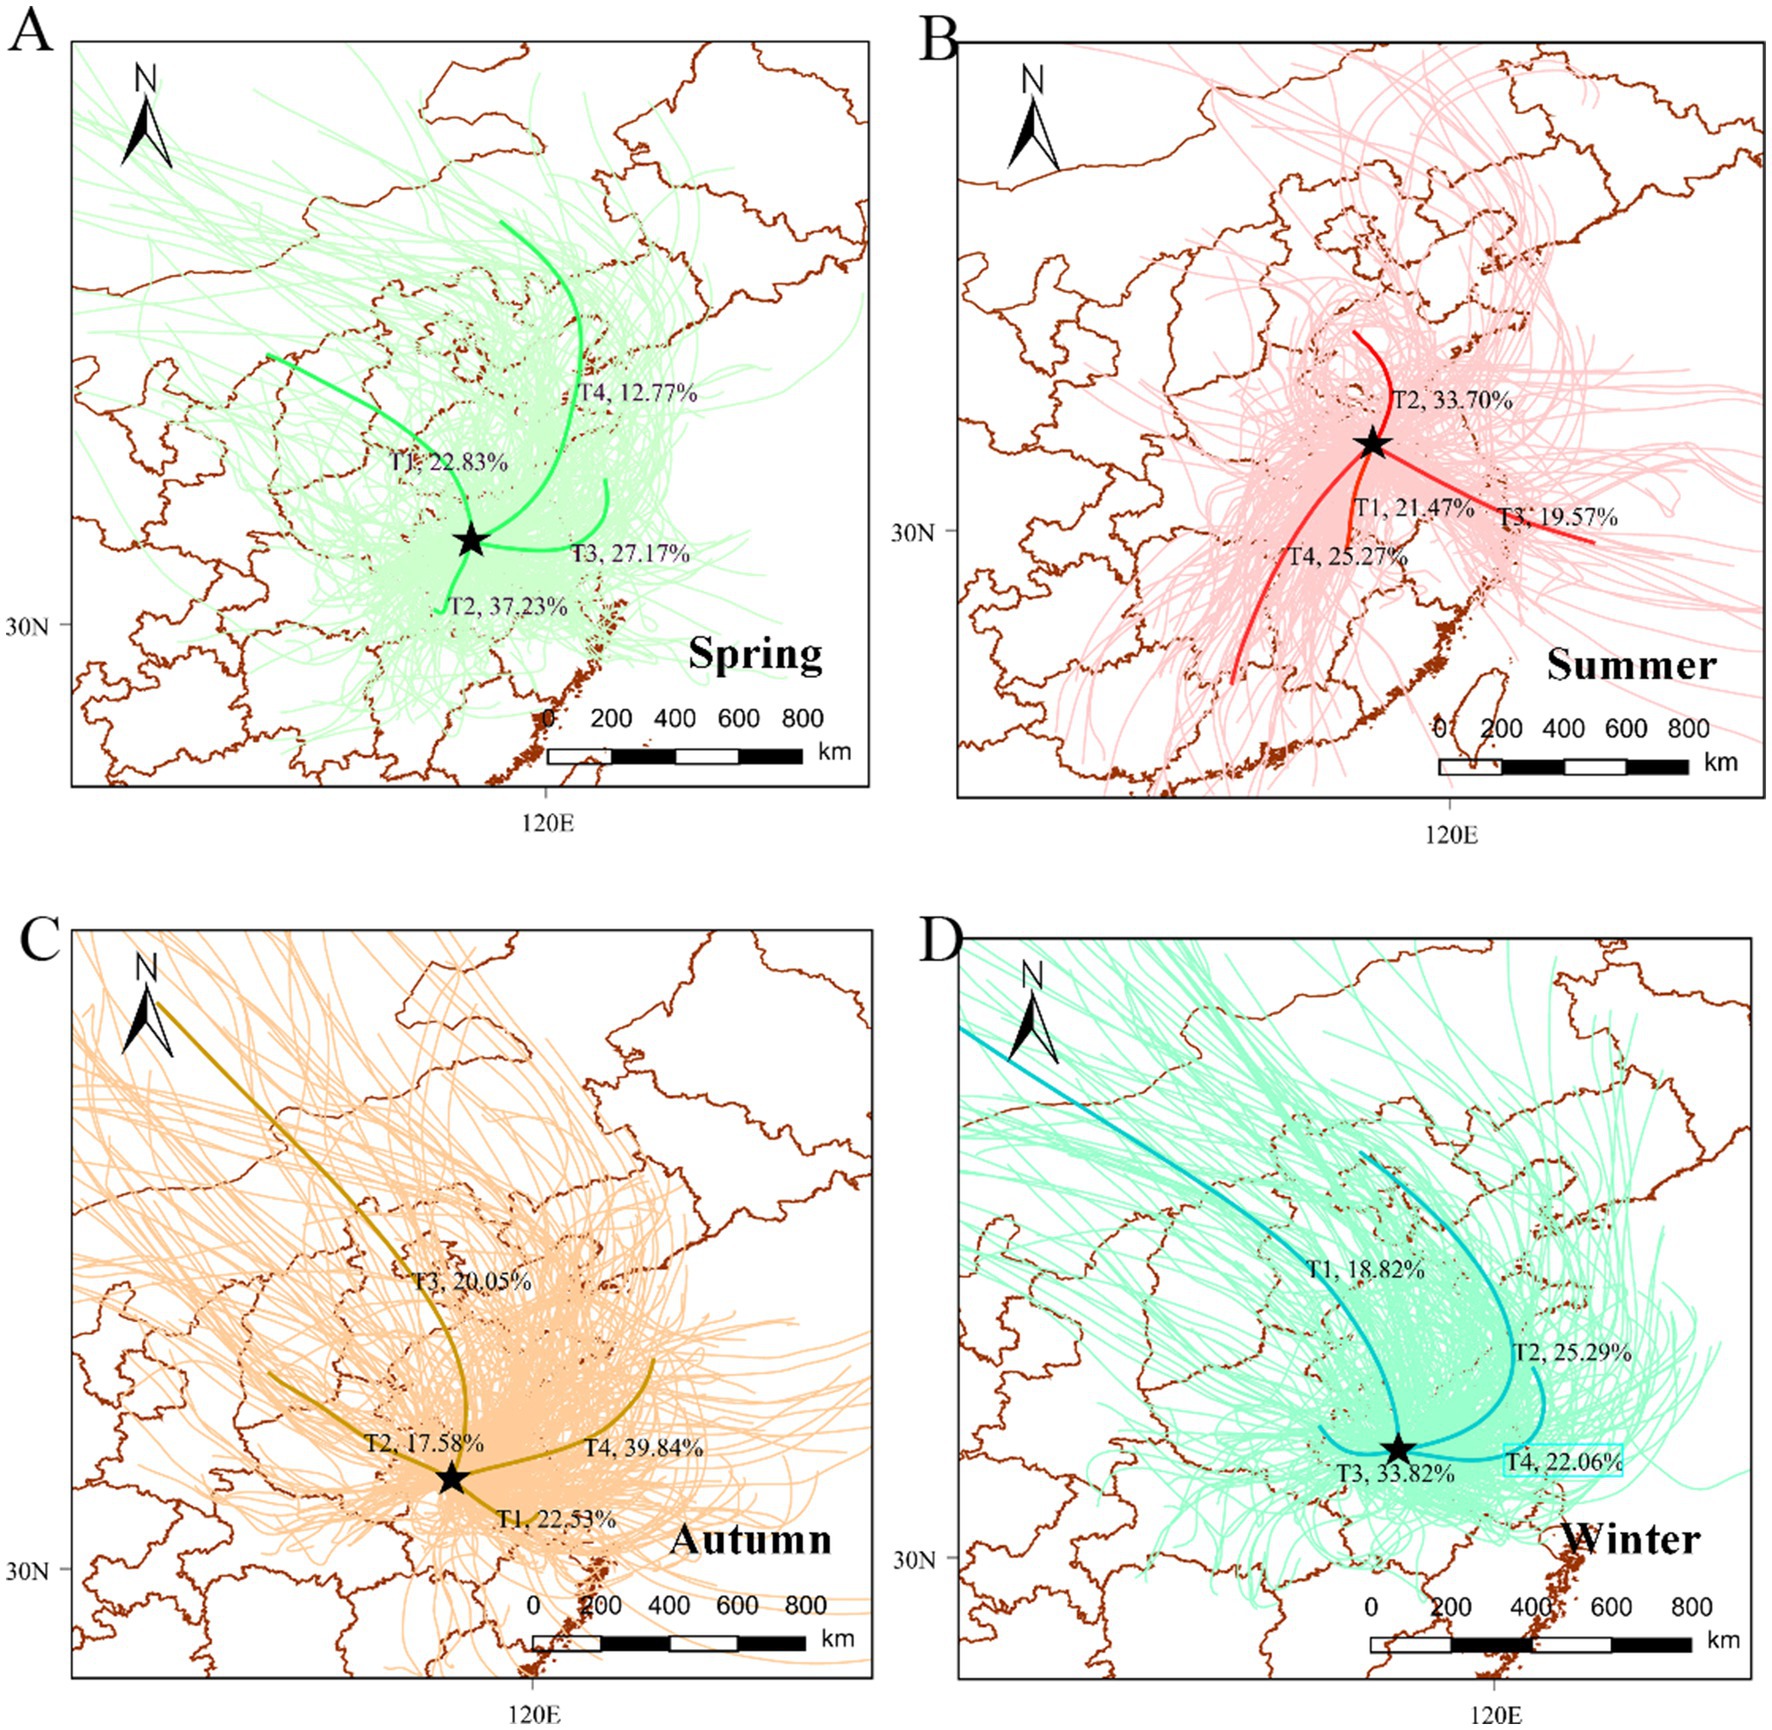
Figure 4. Cluster analysis of a 24 h backward trajectory of air masses during the study period: (A) spring, (B) summer, (C) autumn, and (D) winter.
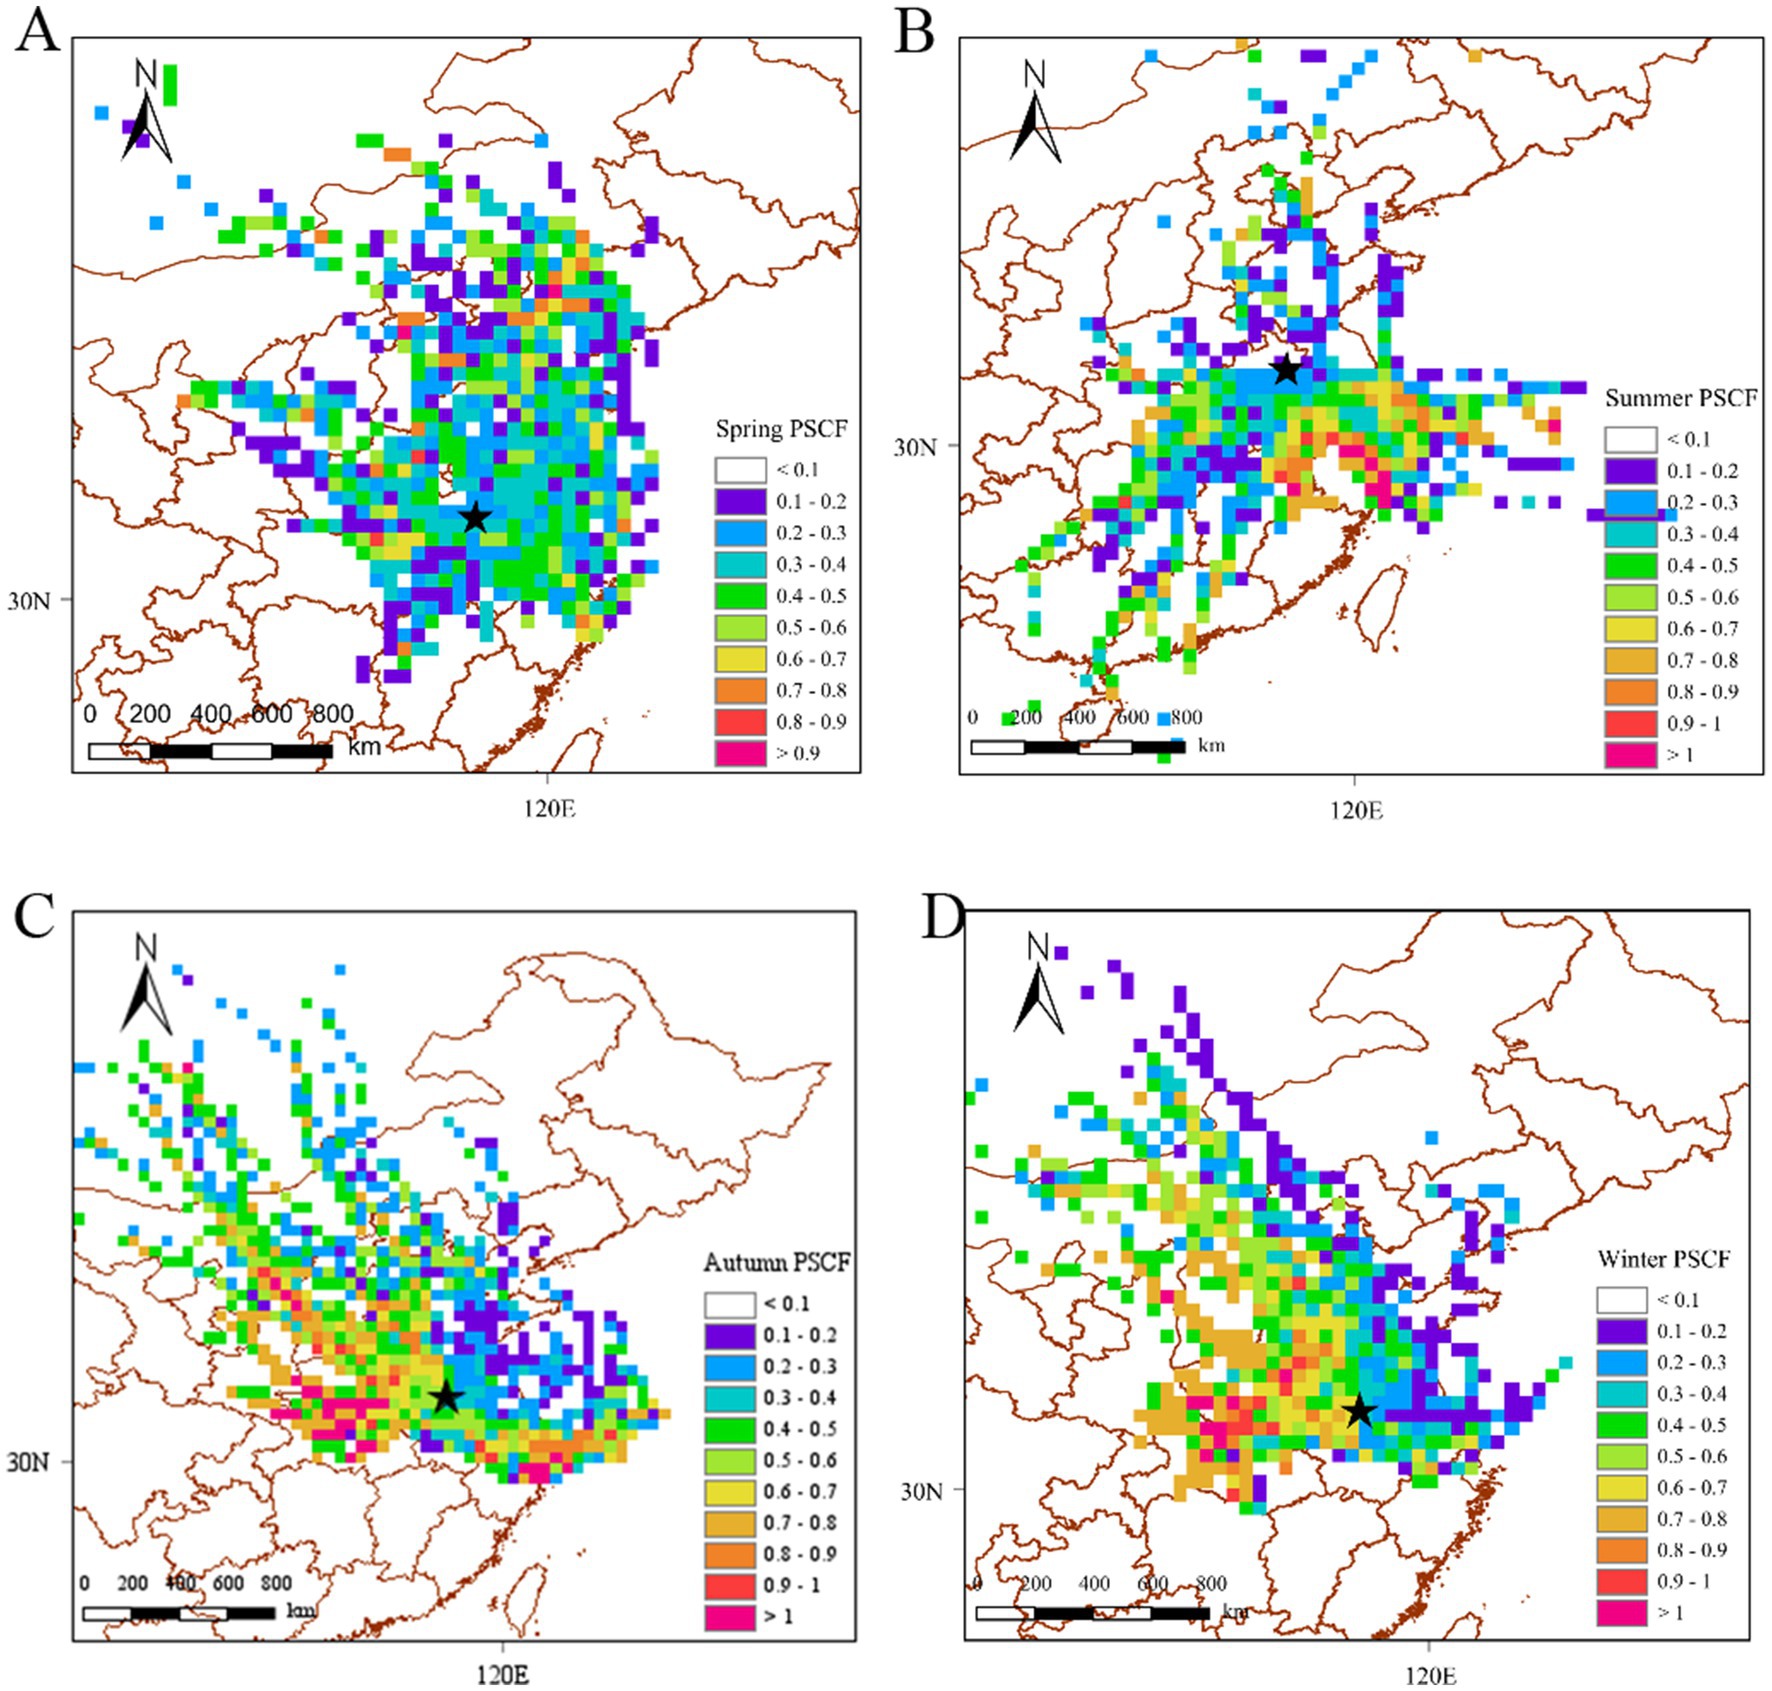
Figure 5. Potential PAH sources as determined by the PSCF algorithm: (A) spring, (B) summer, (C) autumn, and (D) winter.
In spring, cloud T1 originates from the north-west (e.g., Shanxi and Henan) and cloud T4 originates from the north (e.g., Liaoning and Shandong). These clouds had high PAH concentrations of 5.31 and 5.01 ng/m3, respectively, which were higher than the spring PAH concentration in Bengbu (4.69 ng/m3). In contrast, the pollutant concentrations from the southern cloud T2 from Jiangxi and the eastern cloud T3 from Jiangsu (4.45 and 4.26 ng/m3, respectively) were lower than the average concentration in Bengbu in spring. The areas with high PSCF scores in the spring were in the north and north-west, including Shanxi and Shandong, which were identified as potentially polluted areas in the spring. Liaoning (46) and Shanxi (50), which are traditional industrial bases and coal provinces in China, have higher emissions in spring, and the northerly winds in spring facilitate the long-distance transport of pollutants from northern regions, which may exacerbate some of the industrial emissions in Bengbu City in spring.
Bengbu was most affected by pollution from air currents (cloud T3) from the east coast of Zhejiang and other areas during the summer months, with a PAH concentration of 2.79 ng/m3. This was followed by southern areas such as Fujian, where the pollution concentration was second only to the eastern areas (2.62 ng/m3). The pollutant concentrations carried by these two air trajectories exceeded the summer PAH concentration in Bengbu (2.46 ng/m3). The airflow from central Shandong (cloud T2) and the airflow from Hunan and Hubei (cloud T4) carried lower concentrations of pollutants than the summer concentrations in Bengbu, which were 2.28 ng/m3 and 2.27 ng/m3. The PSCF simulation also showed that the summer pollution zone was mainly located in the southeastern coastal area. Coastal regions such as Jiangsu (51), Zhejiang (12) and Shanghai (52) are some of the most economically developed regions in China with high levels of car ownership. Traffic emissions were the main source of PAH emissions in summer in these regions. Traffic emissions of PAHs accounted for the highest proportion of total PAHs (25.2%) during summer in Bengbu city, although the high concentrations at this time of the year may also be related to PAHs brought into the area by the polluted monsoon.
The autumn PAH concentration in Bengbu was 5.91 ng/m3, and was heavily influenced by the pollutant concentrations resulting from cloud T2 (9.31 ng/m3) which originated from the north−west direction, including Shanxi, and cloud T3 (6.17 ng/m3) which originated from the north direction, including Hebei and Shandong. The pollutant concentrations from the southern Jiangsu airflow (Cloud T1) and the northern Jiangsu airflow (Cloud T4) had a lesser impact on Bengbu City, resulting in concentrations of 5.94 and 4.34 ng/m3, respectively. The areas with high PSCF scores in autumn were mainly located in the northern and northwestern regions, including Shanxi and Henan, which were also identified as potential pollution source areas for Bengbu City in autumn. Shanxi and Hebei provinces have relatively abundant coal resources, while there is also heavy use of coal in Shandong and Henan provinces (53). The proportions of atmospheric PAHs resulting from coal combustion in Chengde (41) and Zhengzhou (54) were 37.28 and 38.0%, respectively. Therefore, the pollution streams due to coal combustion in the northwestern parts of the city had a significant impact on the autumn PAH concentrations in Bengbu.
The PAH concentration in Bengbu in winter was 16.89 ng/m3. The T1 cloud from Shanxi, Hebei and Shandong and T3 cloud from Henan carried higher PAH concentrations (21.91 and 18.49 ng/m3) than the T2 cloud from Shandong and Jiangsu and the T4 cloud from Bohai and Jiangsu (13.51 and 14.05 ng/m3). The areas with high winter PSCF scores were also mainly located in the northern and north−western regions, such as Hebei, Henan, and Hubei. In the districts north of Huaihe River in China, large amounts of coal are burned for central heating in autumn and winter. The T1 and T3 air flows from the north−west, which carry coal combustion pollutants, compounded the PAH concentrations in Bengbu in winter. Wang J et al. (54) in Zhengzhou showed that the main source of the 16 priority PAHs was coal combustion, and Wang Y et al. (55) in Dalian found that the contribution of coal combustion to the PAH burden increased from 26 to 45% due to emissions from domestic heating in winter. Therefore, the long-range transport of pollutants from the northwest and north may have exacerbated winter PAH pollution in Bengbu.
The potential source areas derived from the PSCF analysis were the same as those derived from the backward trajectory clustering analysis, with Bengbu City being strongly influenced by the northwestern and northern regions in the spring, autumn, and winter, and strongly influenced by the monsoon from the eastern coastal region in the summer.
3.4 Health risk assessment
According to the USEPA, an ILCR lower than 1 × 10⁻⁶ can be regarded as negligible, and an ILCR above 1 × 10⁻⁴ is likely to be harmful to human beings. An ILCR value within a range of 1 × 10⁻⁶ to 1 × 10⁻⁴ indicates a tolerable risk for the public (46).
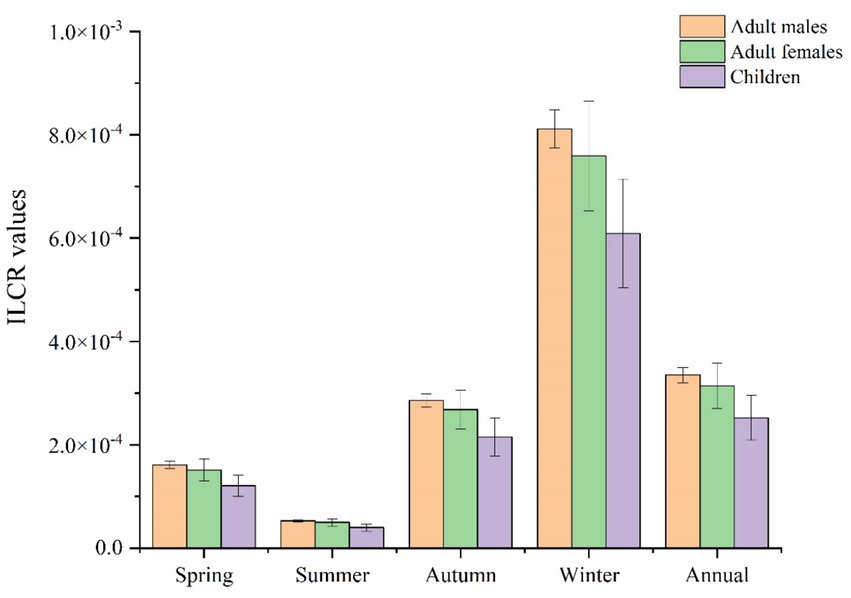
As shown in Figure 6, the ILCR value of PAH exposure through inhalation for adult males was highest in winter (8.11 × 10⁻⁴), followed by autumn (2.86 × 10⁻⁴), spring (1.61 × 10⁻⁴), and summer (5.30 × 10⁻⁵), with an annual value of 3.35 × 10⁻⁴. The ILCR values for adult females and adult males in the four seasons were comparable, but slightly lower in adult females: winter (7.59 × 10⁻⁴) > autumn (2.68 × 10⁻⁴) > spring (1.51 × 10⁻⁴) > summer (4.97 × 10⁻⁵), with an annual value of 3.14 × 10⁻⁴. The ILCR values for children during the study period were winter (6.09 × 10⁻⁴) > autumn (2.15 × 10⁻⁴) > spring (1.21 × 10⁻⁴) > summer (3.98 × 10⁻⁵), with an annual value of 2.52 × 10⁻⁴. All categories of people were at risk in spring, autumn and winter, with adult males at higher risk than adult females, and all adults at higher risk than children, which was likely due to adults’ faster breathing rates and longer exposure times (56).
It was apparent that PAH pollution in Bengbu was more severe in spring, autumn, and winter, and the health risk to the population was therefore more severe at this time. The health risk for adult males was greater than that for adult females, and the health risk to adults was greater than that for children.
There is a certain amount of uncertainty in the risk assessment process at the population level. Changes in the environment in which the population is located at the time of the assessment may bring about changes in exposure pathways, and exposure concentrations may fluctuate over time. There are also limitations in the statistical models themselves, and there are also uncertainties in the parameters that are incorporated into the models during the assessment process.
4 Conclusion
Polycyclic aromatic hydrocarbons were measured in PM10 samples collected in four seasons at a site in Bengbu City. The annual concentrations of the 16 priority PAHs in Bengbu City ranged from 1.45 to 62.16 ng/m3, with an annual mean concentration of 7.63 ± 7.38 ng/m3. There was a seasonal trend for concentrations to be significantly higher in winter (6.13–62.16 ng/m3, median = 14.99 ng/m3) than in spring (1.45–19.34 ng/m3, median = 3.32 ng/m3), summer (1.57–4.27 ng/m3, median = 2.12 ng/m3), and autumn (2.01–18.78 ng/m3, median = 4.90 ng/m3). The annual average BaP concentration was 0.61 ng/m3, contributing 8.11% of ΣPAHs. The PAHs in the full year were dominated by MMW PAHs (39.81%), followed by HMW PAHs (35.77%) and LMW PAHs (24.42%).
The diagnostic ratio method and PMF revealed that the sources of PAH pollution in Bengbu in spring and summer were industrial emissions, coal and biomass combustion, and traffic emissions; while the sources of PAH pollution in autumn and winter were coal and biomass combustion and traffic emissions. According to the backward trajectory clustering analysis and PSCF potential source analysis, Bengbu City was strongly affected by pollution from the northern and northwestern regions in spring, autumn, and winter, while it was more affected by the coastal monsoon in summer.
The atmospheric PAH pollution in Bengbu was most severe in spring, autumn, and winter, and the health risk to the population was also most severe at that time. The health risk to adult males was greater than the risk to adult females, and the health risk to adults was greater than the risk to children.
Data availability statement
The original contributions presented in the study are included in the article/supplementary material, further inquiries can be directed to the corresponding author.
Author contributions
DW: Data curation, Formal analysis, Investigation, Writing – original draft, Writing – review & editing. ZM: Conceptualization, Data curation, Formal analysis, Investigation, Methodology, Writing – original draft. HD: Formal analysis, Investigation, Writing – original draft. WW: Formal analysis, Investigation, Writing – original draft. LC: Investigation, Writing – original draft. DZ: Investigation, Writing – original draft. JY: Writing – review & editing. QZ: Writing – review & editing.
Funding
The author(s) declare that financial support was received for the research, authorship, and/or publication of this article. The authors gratefully acknowledge the support of the following funds: the National Natural Science Foundation of China (grant no. 32001159), the Bengbu Medical College Graduate Research and Innovation Plan Program (grant nos. Byycx22069, Byycxz22037, Byycxz23017, and Byycxz21047), and the Discipline Construction Fund of Bengbu Medical College (grant no. 11200002).
Acknowledgments
The authors are grateful to the Chinese Meteorology Administration (http://data.cma.cn/) for providing the meteorological data. The authors would like to thank Yuanyuan Yang, Fangyan Yuan, and Xulong Zhang for their help with this study. We thank the editor and reviewers for their valuable comments on the manuscript.
Conflict of interest
The authors declare that the research was conducted in the absence of any commercial or financial relationships that could be construed as a potential conflict of interest.
Publisher’s note
All claims expressed in this article are solely those of the authors and do not necessarily represent those of their affiliated organizations, or those of the publisher, the editors and the reviewers. Any product that may be evaluated in this article, or claim that may be made by its manufacturer, is not guaranteed or endorsed by the publisher.
Footnotes
References
1. Patel, AB, Shaikh, S, Jain, KR, Desai, C, and Madamwar, D. Polycyclic aromatic hydrocarbons: sources, toxicity, and remediation approaches. Front Microbiol. (2020) 11:562813. doi: 10.3389/fmicb.2020.562813
2. Shi, R, Li, X, Yang, Y, Fan, Y, and Zhao, Z. Contamination and human health risks of polycyclic aromatic hydrocarbons in surface soils from Tianjin coastal new region. China Environ Pollut. (2021) 268:115938. doi: 10.1016/j.envpol.2020.115938
3. Fang, W, Yang, Y, and Xu, Z. PM10 and PM2.5 and health risk assessment for heavy metals in a typical factory for cathode ray tube television recycling. Environ Sci Technol. (2013) 47:12469–76. doi: 10.1021/es4026613
4. Jedrychowski, WA, Majewska, R, Spengler, JD, Camann, D, Roen, EL, and Perera, FP. Prenatal exposure to fine particles and polycyclic aromatic hydrocarbons and birth outcomes: a two-pollutant approach. Int Arch Occup Environ Health. (2017) 90:255–64. doi: 10.1007/s00420-016-1192-9
5. Chen, Y, Feng, Y, Xiong, S, Liu, D, Wang, G, Sheng, G, et al. Polycyclic aromatic hydrocarbons in the atmosphere of Shanghai. China Environ Monit Assess. (2011) 172:235–47. doi: 10.1007/s10661-010-1330-x
6. Wu, X, Wang, Y, Zhang, Q, Zhao, H, Yang, Y, Zhang, Y, et al. Seasonal variation, air-water exchange, and multivariate source apportionment of polycyclic aromatic hydrocarbons in the coastal area of Dalian. China Environ Pollut. (2019) 244:405–13. doi: 10.1016/j.envpol.2018.10.075
7. Reizer, E, Viskolcz, B, and Fiser, B. Formation and growth mechanisms of polycyclic aromatic hydrocarbons: a mini-review. Chemosphere. (2022) 291:132793. doi: 10.1016/j.chemosphere.2021.132793
8. Mali, M, Ragone, R, Dell'Anna, MM, Romanazzi, G, Damiani, L, and Mastrorilli, P. Improved identification of pollution source attribution by using PAH ratios combined with multivariate statistics. Sci Rep. (2022) 12:19298. doi: 10.1038/s41598-022-23966-4
9. Habeebullah, TM, Munir, S, Zeb, J, and Morsy, EA. Source apportionment of atmospheric PM10 in Makkah Saudi Arabia by modelling its ion and trace element contents with positive matrix factorization and generalised additive model. Toxics. (2022) 10:119. doi: 10.3390/toxics10030119
10. Ali-Taleshi, MS, Squizzato, S, Riyahi, BA, Moeinaddini, M, and Masiol, M. Using a hybrid approach to apportion potential source locations contributing to excess cancer risk of PM2.5-bound PAHs during heating and non-heating periods in a megacity in the Middle East. Environ Res. (2021) 201:111617. doi: 10.1016/j.envres.2021.111617
11. Chao, S, Liu, J, Chen, Y, Cao, H, and Zhang, A. Implications of seasonal control of PM2.5-bound PAHs: an integrated approach for source apportionment, source region identification and health risk assessment. Environ Pollut. (2019) 247:685–95. doi: 10.1016/j.envpol.2018.12.074
12. Duan, L, Yu, H, Wang, Q, Cao, Y, Wang, G, Sun, X, et al. PM2.5-bound polycyclic aromatic hydrocarbons of a megacity in eastern China: source apportionment and cancer risk assessment. Sci Total Environ. (2023) 869:161792. doi: 10.1016/j.scitotenv.2023.161792
13. Zhang, Y, Zheng, H, Zhang, L, Zhang, Z, Xing, X, and Qi, S. Fine particle-bound polycyclic aromatic hydrocarbons (PAHs) at an urban site of Wuhan, Central China: characteristics, potential sources and cancer risks apportionment. Environ Pollut. (2019) 246:319–27. doi: 10.1016/j.envpol.2018.11.111
14. Feng, T, Wang, F, Yang, F, Li, Z, Lu, P, and Guo, Z. Carbonaceous aerosols in urban Chongqing, China: seasonal variation, source apportionment, and long-range transport. Chemosphere. (2021) 285:131462. doi: 10.1016/j.chemosphere.2021.131462
15. Hou, Y, Zhang, K, Zhu, Y, and Liu, W. Spatial and temporal differentiation and influencing factors of environmental governance performance in the Yangtze River Delta China. Sci Total Environ. (2021) 801:149699. doi: 10.1016/j.scitotenv.2021.149699
16. Dai, D, Zhou, B, Zhao, S, Li, K, and Liu, Y. Research on industrial carbon emission prediction and resistance analysis based on CEI-EGM-RM method: a case study of Bengbu. Sci Rep. (2023) 13:14528. doi: 10.1038/s41598-023-41857-0
17. Hong, Y, Xu, X, Liao, D, Ji, X, Hong, Z, Chen, Y, et al. Air pollution increases human health risks of PM2.5-bound PAHs and nitro-PAHs in the Yangtze River Delta, China. Sci Total Environ. (2021) 770:145402. doi: 10.1016/j.scitotenv.2021.145402
18. Su, P, Yue, H, Zhang, W, Tomy, GT, Yin, F, Sun, D, et al. Application of a fugacity model to estimate emissions and environmental fate of ship stack PAHs in Shanghai China. Chemosphere. (2021) 281:130710. doi: 10.1016/j.chemosphere.2021.130710
19. Wang, T, Xia, Z, Wu, M, Zhang, Q, Sun, S, Yin, J, et al. Pollution characteristics, sources and lung cancer risk of atmospheric polycyclic aromatic hydrocarbons in a new urban district of Nanjing. China J Environ Sci. (2017) 55:118–28. doi: 10.1016/j.jes.2016.06.025
20. Hu, R, Liu, G, Zhang, H, Xue, H, Wang, X, and Wang, R. Particle-associated polycyclic aromatic hydrocarbons (PAHs) in the atmosphere of Hefei, China: levels, characterizations and health risks. Arch Environ Contam Toxicol. (2018) 74:442–51. doi: 10.1007/s00244-017-0472-z
21. Jia, L, Sun, J, and Fu, Y. Spatiotemporal variation and influencing factors of air pollution in Anhui Province. Heliyon. (2023) 9:e15691. doi: 10.1016/j.heliyon.2023.e15691
22. Liu, W, Xu, Y, Zhao, Y, Liu, Q, Yu, S, Liu, Y, et al. Occurrence, source, and risk assessment of atmospheric parent polycyclic aromatic hydrocarbons in the coastal cities of the Bohai and yellow seas. China Environ Pollut. (2019) 254:113046. doi: 10.1016/j.envpol.2019.113113
23. Liu, LB, Liu, Y, Lin, JM, Tang, N, Hayakawa, K, and Maeda, T. Development of analytical methods for polycyclic aromatic hydrocarbons (PAHs) in airborne particulates: a review. J Environ Sci. (2007) 19:1–11. doi: 10.1016/S1001-0742(07)60001-1
24. Tang, J, Ma, S, Liu, R, Yue, C, Li, G, Yu, Y, et al. The pollution profiles and human exposure risks of chlorinated and brominated PAHs in indoor dusts from e-waste dismantling workshops: comparison of GC-MS, GC-MS/MS and GC x GC-MS/MS determination methods. J Hazard Mater. (2020) 394:122573. doi: 10.1016/j.jhazmat.2020.122573
25. Zainal, P, Alang, AS, Abdul, AS, and Rosly, NZ. Polycyclic aromatic hydrocarbons: occurrence, electroanalysis, challenges, and future outlooks. Crit Rev Anal Chem. (2022) 52:878–96. doi: 10.1080/10408347.2020.1839736
26. Tobiszewski, M, and Namiesnik, J. PAH diagnostic ratios for the identification of pollution emission sources. Environ Pollut. (2012) 162:110–9. doi: 10.1016/j.envpol.2011.10.025
27. Chen, YC, Chiang, HC, Hsu, CY, Yang, TT, Lin, TY, Chen, MJ, et al. Ambient PM2.5-bound polycyclic aromatic hydrocarbons (PAHs) in Changhua County, Central Taiwan: seasonal variation, source apportionment and cancer risk assessment. Environ Pollut. (2016) 218:372–82. doi: 10.1016/j.envpol.2016.07.016
28. Sun, X, Wang, H, Guo, Z, Lu, P, Song, F, Liu, L, et al. Positive matrix factorization on source apportionment for typical pollutants in different environmental media: a review. Environ Sci Process Impacts. (2020) 22:239–55. doi: 10.1039/C9EM00529C
29. Wang, Q, Liu, M, Yu, Y, and Li, Y. Characterization and source apportionment of PM2.5-bound polycyclic aromatic hydrocarbons from Shanghai city. China Environ Pollut. (2016) 218:118–28. doi: 10.1016/j.envpol.2016.08.037
30. USEPA. (1989). Risk assessment guidance for superfund volume I human health evaluation manual (part A). Environmental Protection Agency/540/1-89/002. 5–52.
31. USEPA. (1997). Exposure Factors Handbook. Environmental Protection Agency /600/P-95/002. 104–126.
32. Ministry of Ecology and Environment of the People's Republic of China. (2014). Exposure factors handbook of Chinese population. Available at: https://www.researchgate.net/publication/294645806_zhongguorenqunbaolucanshushouce_gaiyao (Accessed June, 2024).
33. Abayalath, N, Malshani, I, Ariyaratne, R, Zhao, S, Zhong, G, Zhang, G, et al. Characterization of airborne PAHs and metals associated with PM10 fractions collected from an urban area of Sri Lanka and the impact on airway epithelial cells. Chemosphere. (2022) 286:131741. doi: 10.1016/j.chemosphere.2021.131741
34. Thongsanit, P, Jinsart, W, Hooper, B, Hooper, M, and Limpaseni, W. Atmospheric particulate matter and polycyclic aromatic hydrocarbons for PM10 and size-segregated samples in Bangkok. J Air Waste Manage Assoc. (2003) 53:1490–8. doi: 10.1080/10473289.2003.10466325
35. Yin, H, Qiu, C, Ye, Z, Li, S, and Liang, J. Seasonal variation and source apportionment of organic tracers in PM10 in Chengdu. China Environ Geochem Health. (2015) 37:195–205. doi: 10.1007/s10653-014-9636-1
36. Ling, Z, Song, S, and Huang, T. Pollution characteristics, sources and health risk assessment of polycyclic aromatic hydrocarbons (PAHs) in atmospheric PM10 in Bosten Lake area, Xinjiang China. Earth and Environment. (2024) 52:29–40. doi: 10.14050/j.cnki.1672-9250.2023.51.055
37. Bi, X, Sheng, G, Peng, P, Zhang, Z, and Fu, J. Extractable organic matter in PM10 from LiWan district of Guangzhou City PR China. Sci Total Environ. (2002) 300:213–28. doi: 10.1016/s0048-9697(02)00272-3
38. Wu, X, Sun, W, Huai, B, Wang, L, Han, C, Wang, Y, et al. Seasonal variation and sources of atmospheric polycyclic aromatic hydrocarbons in a background site on the Tibetan plateau. J Environ Sci. (2023) 125:524–32. doi: 10.1016/j.jes.2022.02.042
39. Callen, MS, Iturmendi, A, and Lopez, JM. Source apportionment of atmospheric PM2.5-bound polycyclic aromatic hydrocarbons by a PMF receptor model. Assessment of potential risk for human health. Environ Pollut. (2014) 195:167–77. doi: 10.1016/j.envpol.2014.08.025
40. Simayi, M, Yahefu, P, Han, M, Wang, J, and Nurbia, P. Characteristics, sources apportionment and toxicity assessment of polycyclic aromatic hydrocarbons in atmospheric particulate matters 2017 Chinese new year in Urumqi. Environ Chem. (2018) 37:2433–42.
41. He, B, Nie, S, Li, Y, Guo, R, Yao, B, Cui, J, et al. Seasonal distribution characteristics, source analysis, and health risk evaluation of PAHs in PM2.5 in Chengde. Environ Sci. (2022) 43:2343–54. doi: 10.13227/j.hjkx.202108224
42. Soleimani, M, Ebrahimi, Z, Mirghaffari, N, Moradi, H, Amini, N, Poulsen, KG, et al. Seasonal trend and source identification of polycyclic aromatic hydrocarbons associated with fine particulate matters (PM2.5) in Isfahan City, Iran, using diagnostic ratio and PMF model. Environ Sci Pollut Res Int. (2022) 29:26449–64. doi: 10.1007/s11356-021-17635-8
43. Li, Q, Kang, S, Wang, N, Li, Y, Li, X, Dong, Z, et al. Composition and sources of polycyclic aromatic hydrocarbons in cryoconites of the Tibetan plateau glaciers. Sci Total Environ. (2017) 574:991–9. doi: 10.1016/j.scitotenv.2016.09.159
44. Vuong, QT, Thang, PQ, Nguyen, T, Ohura, T, and Choi, SD. Seasonal variation and gas/particle partitioning of atmospheric halogenated polycyclic aromatic hydrocarbons and the effects of meteorological conditions in Ulsan. South Korea Environ Pollut. (2020) 263:114592. doi: 10.1016/j.envpol.2020.114592
45. Larsen, RR, and Baker, JE. Source apportionment of polycyclic aromatic hydrocarbons in the urban atmosphere: a comparison of three methods. Environ Sci Technol. (2003) 37:1873–81. doi: 10.1021/es0206184
46. Wang, S, Ji, Y, Zhao, J, Lin, Y, and Lin, Z. Source apportionment and toxicity assessment of PM2.5-bound PAHs in a typical iron-steel industry city in Northeast China by PMF-ILCR. Sci Total Environ. (2020) 713:136428. doi: 10.1016/j.scitotenv.2019.136428
47. Liu, Y, Chen, L, Huang, QH, Li, WY, Tang, YJ, and Zhao, JF. Source apportionment of polycyclic aromatic hydrocarbons (PAHs) in surface sediments of the Huangpu River, Shanghai. China Sci Total Environ. (2009) 407:2931–8. doi: 10.1016/j.scitotenv.2008.12.046
48. Wang, J, Hang, HS, Huang, R, Gao, M, Liu, S, Zhao, S, et al. Characterization of parent and oxygenated-polycyclic aromatic hydrocarbons (PAHs) in Xi'an, China during heating period: an investigation of spatial distribution and transformation. Chemosphere. (2016) 159:367–77. doi: 10.1016/j.chemosphere.2016.06.033
49. Mai, B, Qi, S, Zeng, EY, Yang, Q, Zhang, G, Fu, J, et al. Distribution of polycyclic aromatic hydrocarbons in the coastal region off Macao, China: assessment of input sources and transport pathways using compositional analysis. Environ Sci Technol. (2003) 37:4855–63. doi: 10.1021/es034514k
50. Zhang, Y, Song, Y, Chen, Y, Chen, Y, Lu, Y, Li, R, et al. Discovery of emerging sulfur-containing PAHs in PM2.5: contamination profiles and potential health risks. J Hazard Mater. (2021) 416:125795. doi: 10.1016/j.jhazmat.2021.125795
51. Chen, C, Xia, Z, Wu, M, Zhang, Q, Wang, T, Wang, L, et al. Concentrations, source identification, and lung cancer risk associated with springtime PM2.5-bound polycyclic aromatic hydrocarbons (PAHs) in Nanjing, China. Arch Environ Contam Toxicol. (2017) 73:391–400. doi: 10.1007/s00244-017-0435-4
52. Li, Y, Huang, Y, Yuan, L, He, Y, Yin, G, He, T, et al. The deposition mapping of polycyclic aromatic hydrocarbons in megacity Shanghai. China J Hazard Mater. (2023) 443:130173. doi: 10.1016/j.jhazmat.2022.130081
53. Zhang, Y, Lin, Y, Cai, J, Liu, Y, Hong, L, Qin, M, et al. Atmospheric PAHs in North China: spatial distribution and sources. Sci Total Environ. (2016) 565:994–1000. doi: 10.1016/j.scitotenv.2016.05.104
54. Wang, J, Geng, NB, Xu, YF, Zhang, WD, Tang, XY, and Zhang, RQ. PAHs in PM2.5 in Zhengzhou: concentration, carcinogenic risk analysis, and source apportionment. Environ Monit Assess. (2014) 186:7461–73. doi: 10.1007/s10661-014-3940-1
55. Wang, Y, Zhang, Q, Zhang, Y, Zhao, H, Tan, F, Wu, X, et al. Source apportionment of polycyclic aromatic hydrocarbons (PAHs) in the air of Dalian, China: correlations with six criteria air pollutants and meteorological conditions. Chemosphere. (2019) 216:516–23. doi: 10.1016/j.chemosphere.2018.10.184
56. Wang, J, Cao, J, Dong, Z, Guinot, B, Gao, M, Huang, R, et al. Seasonal variation, spatial distribution and source apportionment for polycyclic aromatic hydrocarbons (PAHs) at nineteen communities in Xi'an, China: the effects of suburban scattered emissions in winter. Environ Pollut. (2017) 231:1330–43. doi: 10.1016/j.envpol.2017.08.106
57. De La Torre-Roche, RJ, Lee, WY, and Campos-Diaz, SI. Soil-borne polycyclic aromatic hydrocarbons in El Paso, Texas: analysis of a potential problem in the United States/Mexico border region. J Hazard Mater. (2009) 163:946–58. doi: 10.1016/j.jhazmat.2008.07.089
Keywords: PM10, polycyclic aromatic hydrocarbon, source analysis, positive matrix factorization, HYSPLIT model
Citation: Wu D, Ma Z, Diao H, Wang W, Chen L, Zhou D, Yang J and Zhen Q (2024) Characteristics, potential sources, and cancer risk apportionment of PM10-bound polycyclic aromatic hydrocarbons in Bengbu, Central China. Front. Public Health. 12:1445782. doi: 10.3389/fpubh.2024.1445782
Edited by:
Barbara Kozielska, Silesian University of Technology, PolandReviewed by:
Chunlin Zhang, Jinan University, ChinaOlusola Olabisi Ogunseye, University of Arizona, United States
Copyright © 2024 Wu, Ma, Diao, Wang, Chen, Zhou, Yang and Zhen. This is an open-access article distributed under the terms of the Creative Commons Attribution License (CC BY). The use, distribution or reproduction in other forums is permitted, provided the original author(s) and the copyright owner(s) are credited and that the original publication in this journal is cited, in accordance with accepted academic practice. No use, distribution or reproduction is permitted which does not comply with these terms.
*Correspondence: Quan Zhen, emhlbnF1YW5AYmJtdS5lZHUuY24=
†These authors have contributed equally to this work
 Danchen Wu†
 Quan Zhen
