
94% of researchers rate our articles as excellent or good
Learn more about the work of our research integrity team to safeguard the quality of each article we publish.
Find out more
ORIGINAL RESEARCH article
Front. Public Health , 27 June 2024
Sec. Aging and Public Health
Volume 12 - 2024 | https://doi.org/10.3389/fpubh.2024.1418385
 Nanbu Wang1†
 Lian Ren2†
 Ziyuan Li3†Yunhao Hu3
 Jingpei Zhou3
 Quan Sun3
 Bin Pei4
 Xinyu Li3
 Wanqing Peng3Jinyan Yu3Renhui Zhao3Ziting Huang3Zhenhu Chen5
 Guoxin Huang4*
Background: The study aimed to examine the association between the systemic immune-inflammation index (SII), a contemporary metric of systemic inflammatory response, and biological aging, which are closely interconnected processes.
Methods: This cross-sectional study utilized 10 cycles of data from the NHANES database spanning from 1990 to 2018. The study examined the relationship between the SII index, calculated as P * N/L, where P represents preoperative peripheral platelet count, N represents neutrophil count, and L represents lymphocyte count, and biological aging. Biological aging was assessed through various methods, such as phenotypic age, phenotypic age acceleration (PhenoAgeAccel), biological age, and biological age acceleration (BioAgeAccel). Correlations were analyzed using weighted linear regression and subgroup analysis.
Results: Among the 7,491 participants analyzed, the average age was 45.26 ± 0.34 years, with 52.16% being female. The average phenotypic and biological ages were 40.06 ± 0.36 and 45.89 ± 0.32 years, respectively. Following adjustment for potential confounders, elevated SII scores were linked to increased phenotypic age, biological age, Phenotypic age acceleration, and Biological age acceleration. Positive correlations were observed between health behavior and health factor scores and biological aging, with stronger associations seen for health factors. In health factor-specific analyses, the β coefficient was notably higher for high BMI. The robust positive associations between SII scores and both phenotypic age and biological age in the stratified analyses were consistently observed across all strata.
Conclusion: The evidence from the NHANES data indicate that SII may serve as a valuable marker for assessing different facets of aging and health outcomes, such as mortality and the aging process. Additional research is warranted to comprehensively elucidate the implications of SII in the aging process and its utility as a clinical instrument for evaluating and addressing age-related ailments.
Aging is characterized by systemic chronic inflammation, which is accompanied by cellular senescence, immunosenescence, organ dysfunction, and age-related diseases (1). Due to the increase in life expectancy and the decline in fertility rates, the global population is aging (2). Although everyone ages, the rate of aging is uneven, and the difference in aging rate between individuals is manifested by differences in susceptibility to death and disease (3). To further explain aging from the perspective of harmful inflammation and weakened immunity, inflammaging was introduced as an evolutionary perspective on immunosenescence, referring to the phenomenon of low-grade, chronic damage resulting from increased inflammation levels within the body (4). Later, inflammaging has been considered a hallmark of aging (5). Meanwhile, it is worth mentioning that can also damage the immune system, leading to immunosenescence during aging (6).
The systemic immune-inflammation index (SII) is an effective parameter to show the systemic immune and inflammation condition. It is a novel index that is used for the characterization of the severity of systemic inflammation. Recent studies have identified the high SII level as an independent predictor of poor outcomes in patients with multiple metabolic diseases (7). However, the association between the inflammatory level biomarker SII and aging is not well characterized.
Aging is a complex biological process that involves multiple dimensions of cells, tissues, and organs (8), so there are various ways to characterize biological aging, such as phenotypic age, biological age, leukocyte telomere length, and metabolic age score (9–11). In this study, phenotypic age and biological age were chosen to reflect aging. In general, phenotypic age corresponds to chronological age at the same risk of death, biological age refers to chronological age at the same physiological function (12). Phenotypic age and biological age calculated based on clinically observable data are considered to be more reliable predictors of aging outcomes.
Therefore, we examined the relationship between SII and aging in adults in this study, utilizing a large sample of people aged 20 to 80 years from the National Health and Nutrition Examination Survey (NHANES).
This study utilized 10 cycles of data spanning from 1990 to 2018 from the NHANES database. A total of 74,053 participants with SII data and 37,403 participants with phenotypic age and biological age data were extracted. The range of participants with covariate data was between 42,020 and 81,385. Following the combination of all variables and exclusion of participants with missing values, 7,491 participants were retained. Weighting was applied to represent 57,707,615 individuals. Further details can be found in Figure 1.
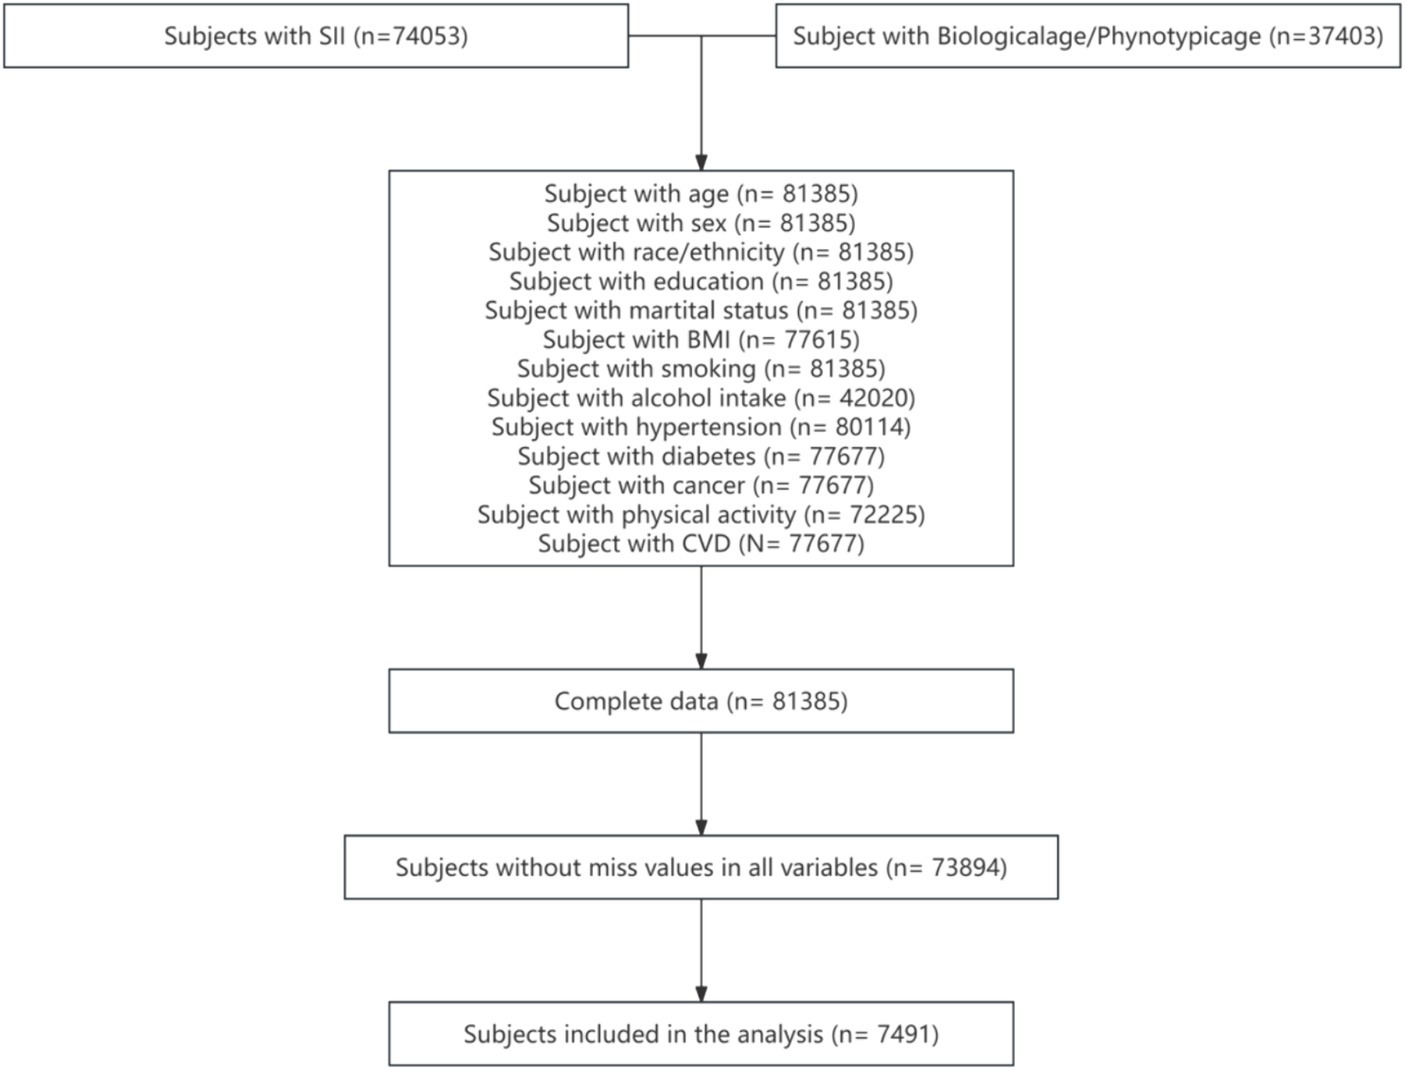
Figure 1. Flowchart of the participant selection from NHANES 1999–2018.
The calculation of the SII in this study is based on prior research conducted by Hu et al. (13). The formula for determining SII is SII = P * N/L, with P representing preoperative peripheral platelet count, N representing neutrophil count, and L representing lymphocyte count. Additionally, SII values are categorized into quartiles and subjected to a logarithmic transformation for normalization. In the division of quartiles, Q1 takes the 25% observation value after sorting the samples from small to large, which is [7.1505, 347.885]. Q2 takes the 50% observed value of the sample sorted from small to large, which is [347.885, 482]. Q3 takes the 75% observation value after sorting the samples from small to large, which is [482, 676]. Q4 takes the 100% observation value of the sample sorted from small to large, which is [676, 7290.9375].
Biological aging was assessed through the utilization of phenotypic age and biological age, each employing distinct biomarkers and calculation methodologies. Phenotypic age was calculated to consist of albumin, creatinine, glucose, Ln(C-reactive protein), lymphocyte percentage, mean cell volume, erythrocyte distribution width, alkaline ohosphatase, leukocyte count, chronological age (12). The Klemera and Doubal method was shown previously to be a reliable predictor of biological age and mortality that includes a set of eight biomarkers (Ln(C-reactive protein), serum creatinine, glycated hemoglobin, serum albumin, serum total cholesterol, serum urea nitrogen, serum alkaline phosphatase, and systolic blood pressure) (14, 15). Details of the calculation formulae are shown in Appendix 1.
Biological age was subtracted from chronological age (time elapsed since birth) to obtain biological age acceleration. Phenotypic age was subtracted from chronological age to obtain phenotypic age acceleration. Their values indicate a person appears older [positive value] or younger [negative value] than expected, physiologically.
In our study, covariates consisted of several factors previously displayed or assumed to be associated with SII and senescence. Covariables included age, sex, body mass index, race/ethnicity, marital status, education, smoking, alcohol intake, poverty, diabetes, hypertension, cerebrovascular disease (CVD), cancer, and physical activity.
This study utilized a multi-stage probability sampling approach from the NHANES database, with analysis conducted under the condition of sample weighting. The weights were adjusted according to the method outlined on the official NHANES website, using the weight variable “wtmec2yr” calculated as “1/10 * wtmec2yr.” Normality of the included variables was assessed using the Shapiro–Wilk test, with variables fitting a normal distribution described using mean and standard deviation. Differences among multiple groups were compared using ANOVA testing. When the variables deviated from a normal distribution, the median and number of quarterbacks were utilized to characterize the variables, and the Kruskal-Wallis test was employed to assess variances among multiple groups. Group differences were further examined using a Chi-square test.
Weighted linear regression was employed to investigate the association between aging acceleration and SII. The initial model utilized single-factor weighted liner regression, with aging acceleration as the independent variable and SII as the dependent variable. Model 1, which utilized single-factor weighted linear regression, employed aging acceleration as the independent variable and SII as the dependent variable. Model 2 was constructed, adjusting for the key covariates of age, sex, and race. Model 3 was developed by further adjusting for a comprehensive set of additional covariates, including age, sex, BMI, race/ethnicity, marital status, education, smoking habits, alcohol consumption, poverty level, diabetes status, hypertension, cardiovascular disease (CVD), cancer history, and physical activity.
Subgroup analysis was conducted based on various demographic and health-related variables including age, sex, BMI, race/ethnicity, marital status, education, smoking, alcohol intake, hypertension, CVD, cancer. The R (4.1.2) software was used for statistical analysis and drawing, and the “nhanesR” package was mainly used in the statistical analysis process of R (4.1.2) software.
A total of 7,491 people were included in this study, of whom 47.84% were male and 52.16% were female, average age was 45.26 years and 76.07% were white. The clinical characteristics of the participants by SII quartiles are shown in Table 1, from which we can find statistically significant differences in sex, BMI, race/ethnicity, marital status, education, smoking, hypertension, physical activity, phenotypic age, biological age and phenotypic age acceleration (all p < 0.05).
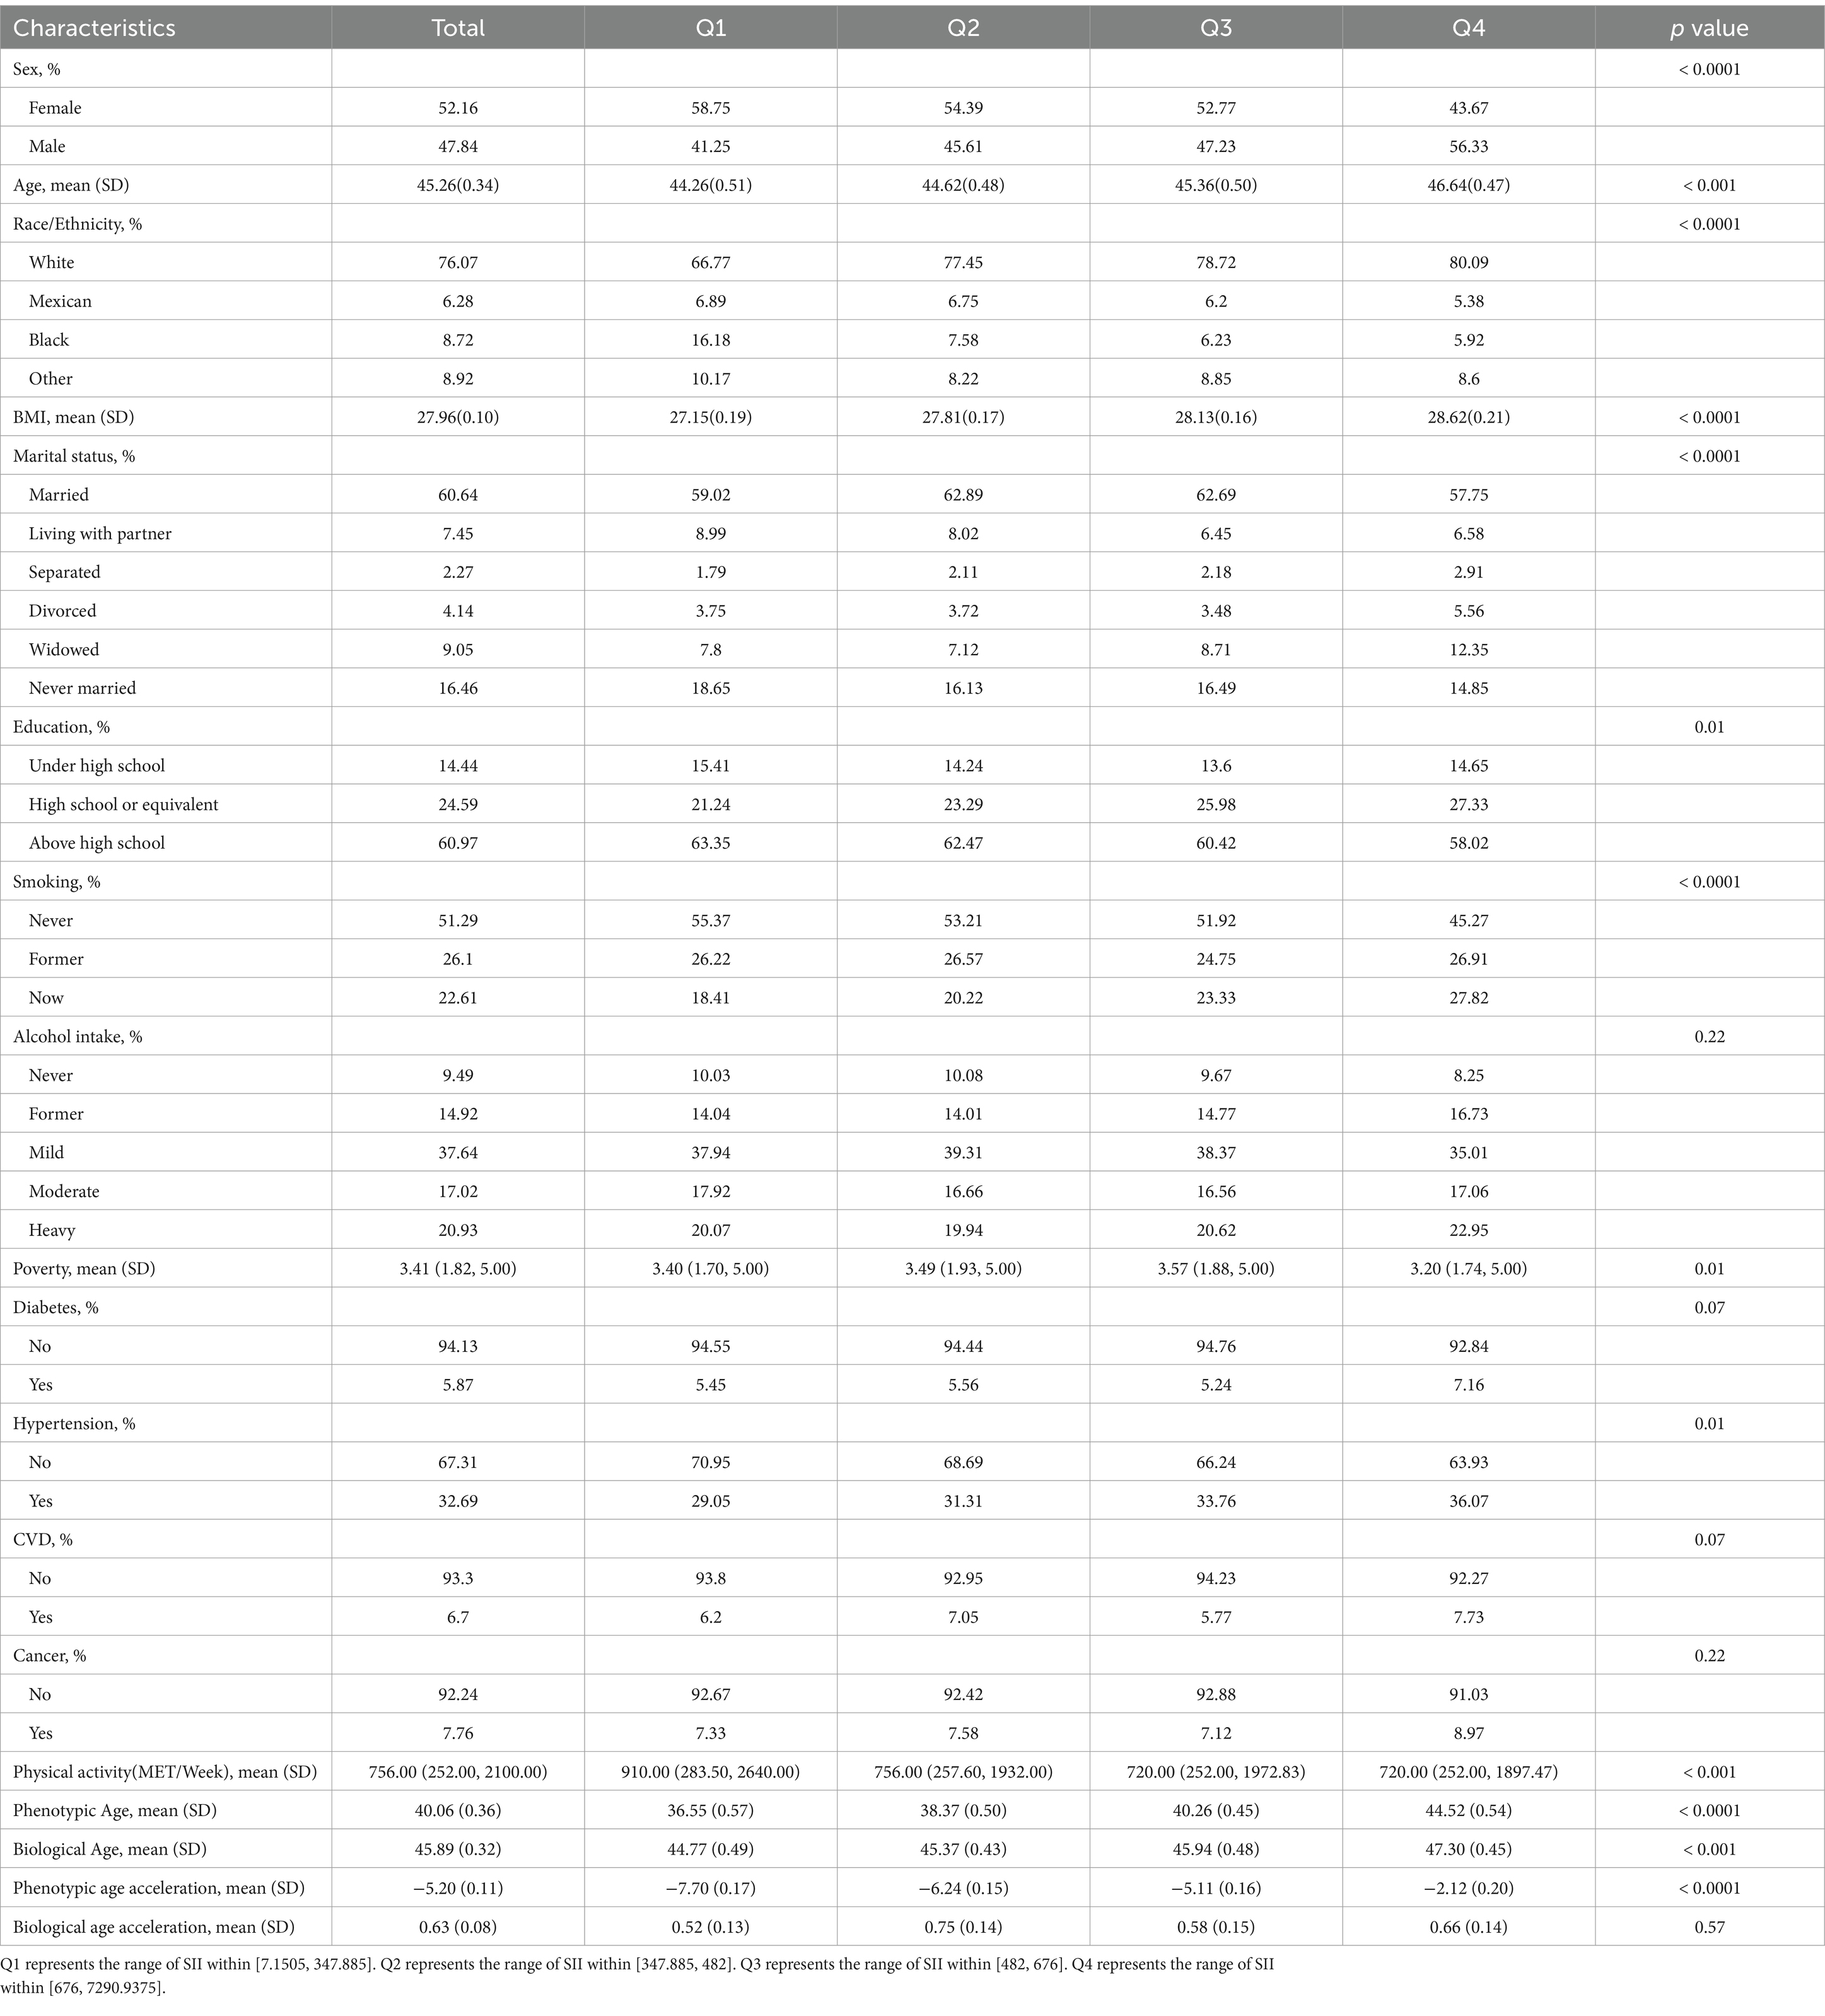
Table 1. Weighted demographic characteristics of all participants.
After performing a weighted multivariate linear regression analysis (Table 2). Following the non-normal transformation of SII, the linear regression analysis revealed a statistically significant positive association between log (SII) and phenotypic age acceleration. Specifically, the estimated beta coefficient (95% confidence interval) was 3.89 (3.49, 4.28) in model 1, with a p-value of less than 0.0001. Subsequent models yielded beta coefficients of 4.34 (3.94, 4.75) in model 2 and 3.7 (3.32, 4.09) in the fully adjusted model 3, all with p-values less than 0.0001. Sensitivity analysis involved transforming SII into quartiles, with the highest quartile showing a beta coefficient of 5.58 (5.10, 6.06) compared to the lowest quartile in model1. In comparison to the lowest quartile (model 1), the results demonstrated statistically significant differences in β values for models 2 and 3, with respective values of 6.22 (95% CI 5.75, 6.69) and 5.28 (95% CI 4.85, 5.71), both yielding a p value of less than 0.0001.
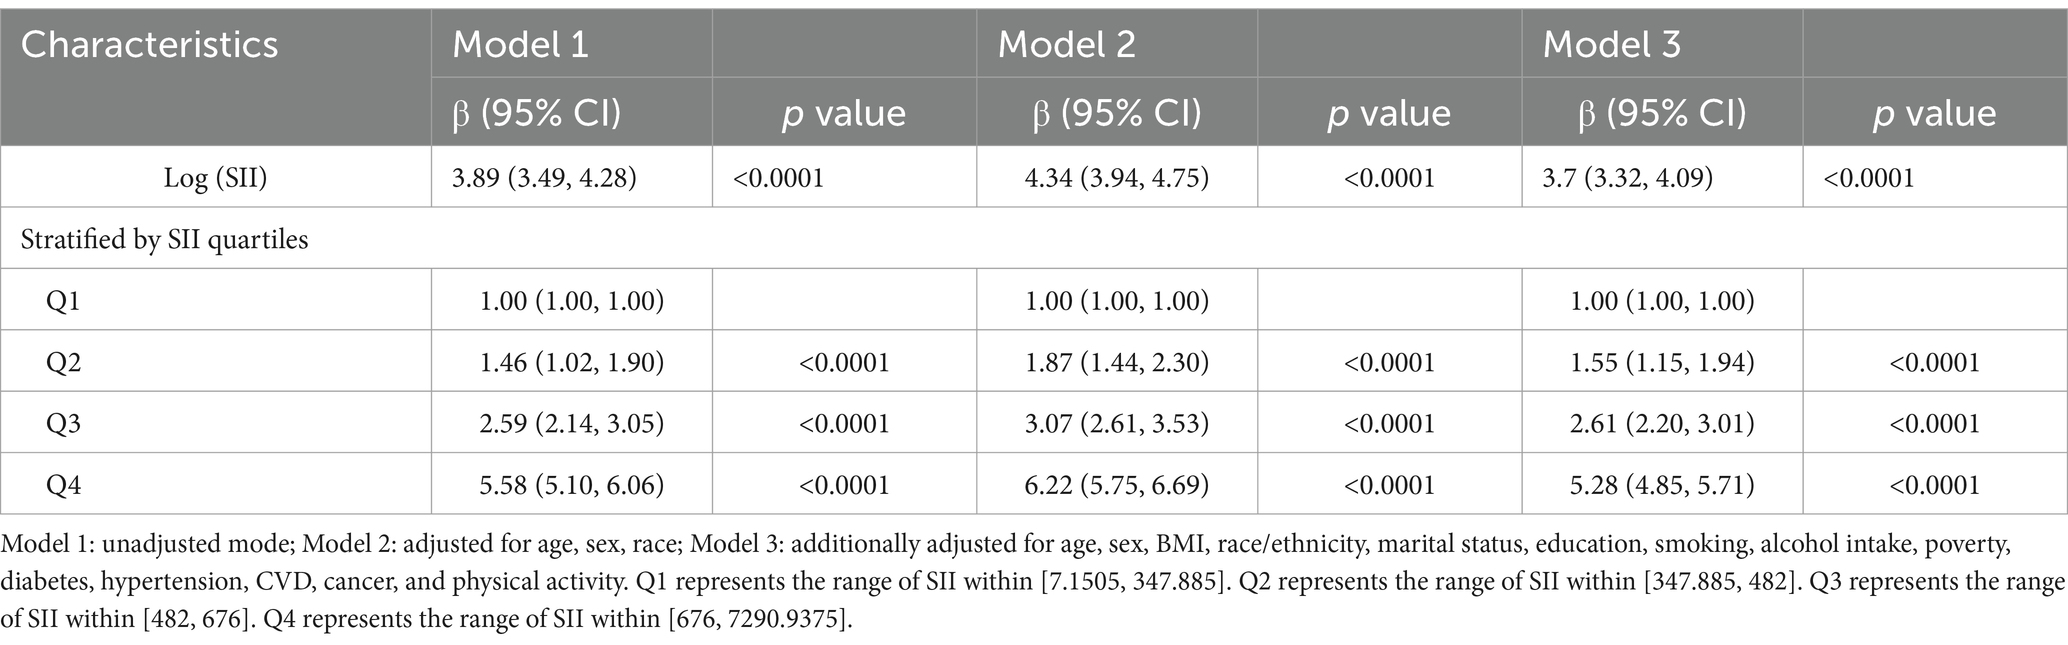
Table 2. Weighted multivariate linear analysis SII and senescence for phenotypic age acceleration.
After performing a weighted multivariate linear regression analysis (Table 3). Following the non-normal transformation of SII, the linear regression analysis revealed a statistically significant positive association between log(SII) and biological age acceleration. Specifically, in model 1, the estimated beta coefficient (β) was 0.15 (95% confidence interval [CI]: −0.06, 0.35) with a corresponding p-value of 0.15. In model 2, the association strengthened with a β of 0.52 (95% CI: 0.30, 0.73) and a p-value of less than 0.0001. Finally, in the fully adjusted model 3, the estimated β was 0.33 (95% CI: 0.13, 0.53) with a p-value of less than 0.0001. The Sensitivity Index of the study was converted from a continuous variable to a categorical variable (quartiles) for further analysis, as shown in Table 2. When compared to the lowest quartile, the results for model 1 yielded a β coefficient of 0.14 (95% CI: −0.19, 0.47) with a p value of 0.39. In model 2, the β coefficient was 0.67 (95% CI: 0.33, 1.02) with a p value of less than 0.0001. Model 3 showed a β coefficient of 0.37 (95% CI, 0.05, 0.70) with a p value of 0.02.
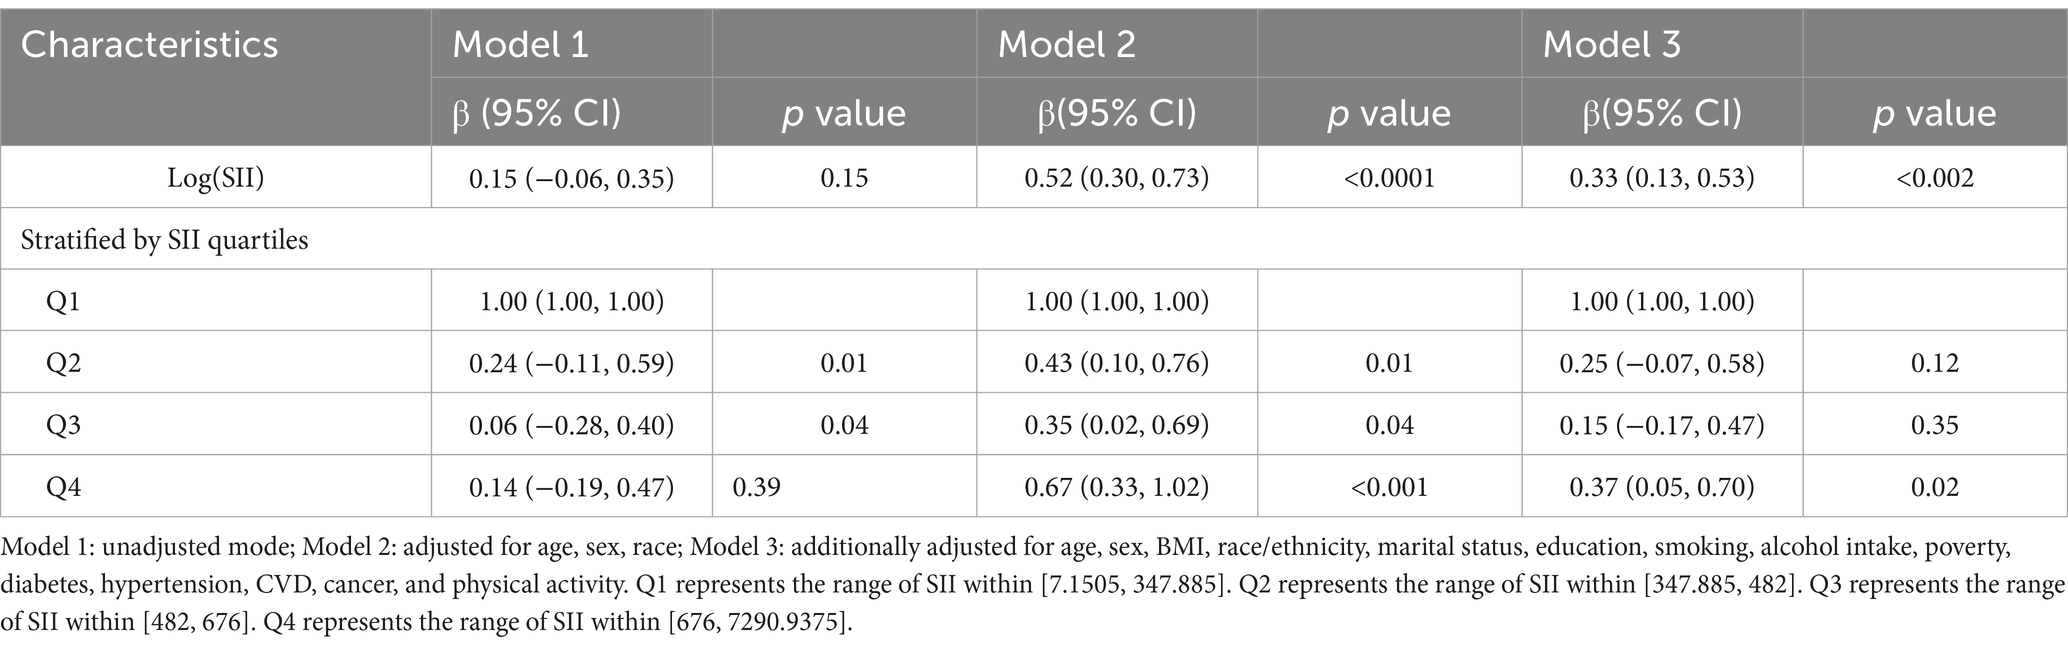
Table 3. Weighted multivariate linear analysis SII and senescence for biological age acceleration.
We found that the risk of aging was not consistently associated with increased log(SII) levels (Table 4) in some subgroups. Overall, for both phenotypic age acceleration and biological age acceleration, sex, marital status, education, smoke, alcohol intake, hypertension, and CVD was statistically significant (p > 0.05).
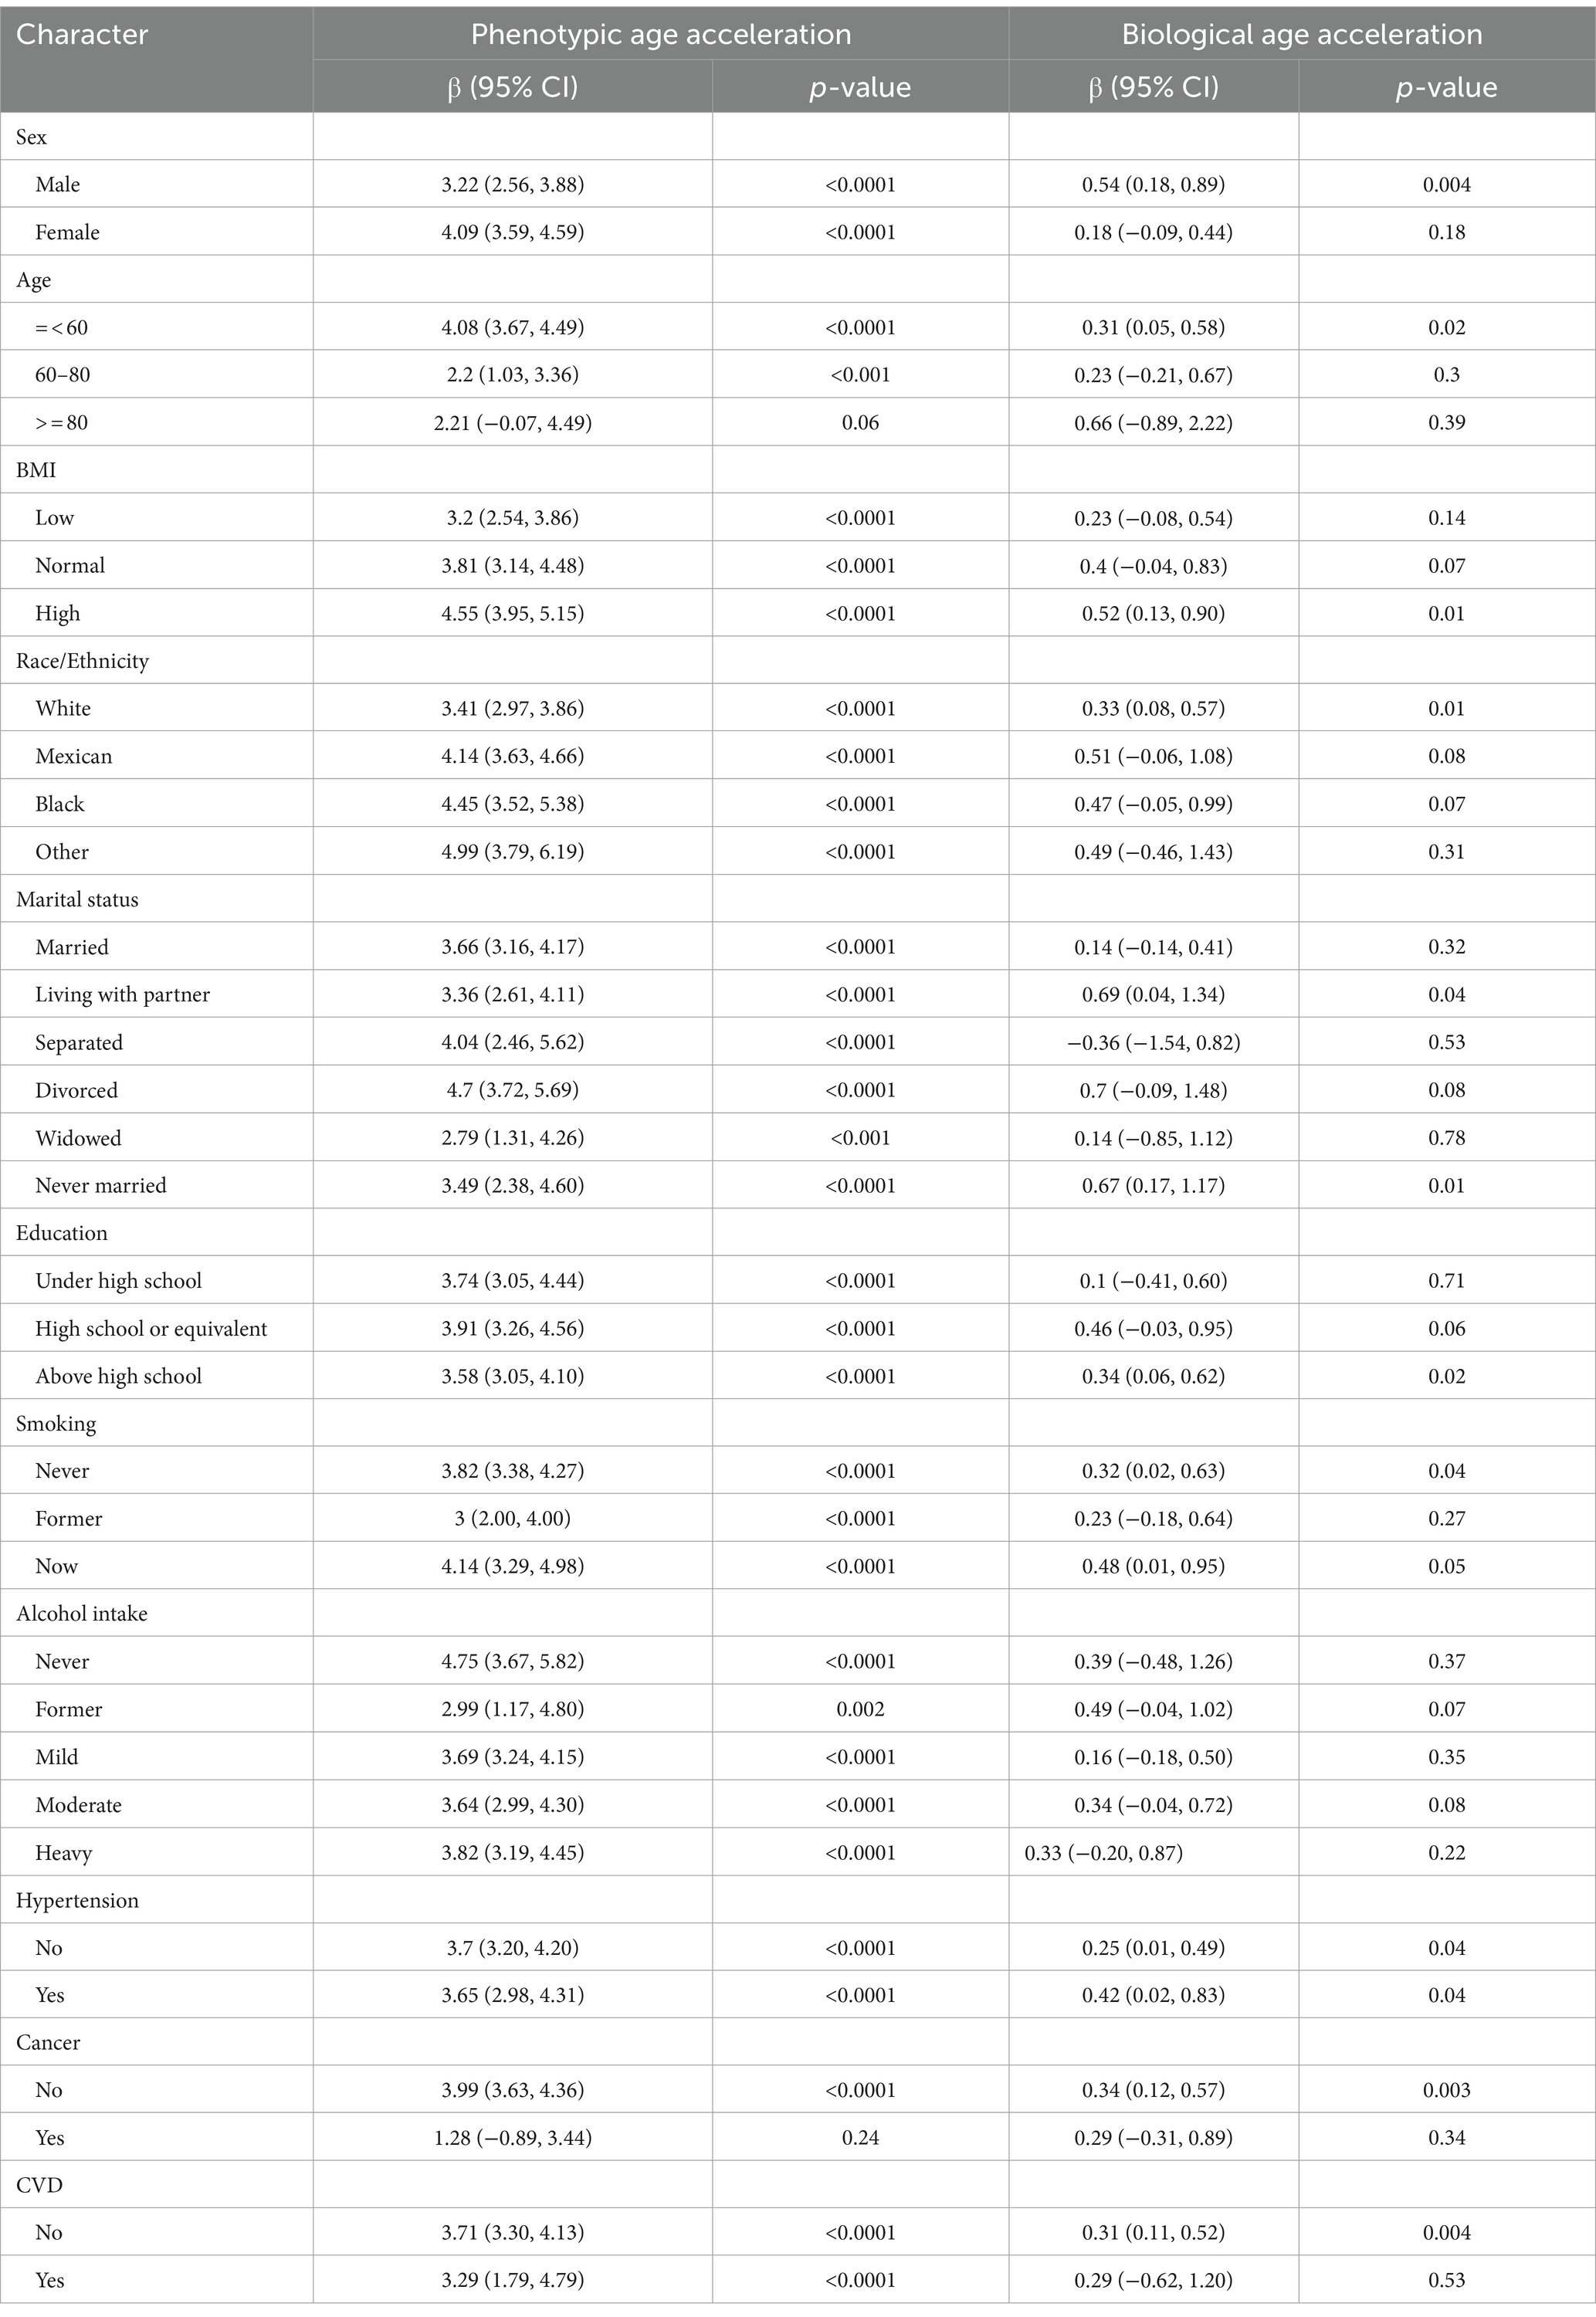
Table 4. Subgroup analysis for the association between SII and senescence.
To elucidate the relationship between SII and biological aging, we carried out a cross-sectional analysis of 7,491 participants from the NHANES cohort. Affirmative associations were revealed between SII and its health behavior and health factor subscales and biological aging. Stratified analyses illustrated that the relationship between SII and biological aging remained stable across stratification factors.
Biological aging is known to be assessed in a variety of ways, such as phenotypic age, biological age, white blood cell telomere length, and metabolic age score. Therefore, several studies have evaluated the relationship between SII and biological aging assessed using other modalities. A previous study using the NHANES database from 1999 to 2018 found a positive correlation, there is a positive correlation between SII and rheumatoid arthritis. This study also found that SII is a novel, valuable, and convenient inflammatory marker that can be used to predict the risk of rheumatoid arthritis in US adults (16). Xia et al. discovered that among participants with all-cause mortality and cardiovascular mortality, SII was closely associated with cardiovascular death and all-cause death, and more attention should be paid to systemic inflammation to provide better preventive strategies (16).
It is worth noting that our results indicate that positive correlations were observed between health behavior and health factor scores and biological aging, with stronger associations seen for health factors. Various factors have been found to exert similar influences on both Phenotypic age and Biological age. Health-related factors, such as abstaining from alcohol and tobacco, having a favorable marital and educational status, maintaining normal blood pressure, and having no history of cardiovascular disease, have been shown to decelerate the aging process. Numerous studies have provided evidence that a normal body mass index (BMI) can extend lifespan, enhance healthy life expectancy, promote better physical functioning among older individuals, and impede the aging process (17, 18). Restoring aberrant BMI is a novel and promising strategy to combat aging. Moreover, different racial backgrounds have been found to impact indicators of aging and the duration of a healthy lifespan in healthy adults through their effects on multiple molecular pathways and cell types. Blood pressure is commonly regarded as a significant modifiable vascular risk factor in the prevention or postponement of aging and dementia (19, 20). Aging is distinguished by changes in neuro-cardiovascular regulatory mechanisms, resulting in compromised patterns of physiological variability (21). The alterations observed in both aging and blood pressure involve numerous shared molecular mechanisms, such as subclinical inflammation, heightened production of reactive oxygen species, impaired endothelial function, increased arterial stiffness, autonomic dysfunction, genomic instability, oxidative damage to mitochondria, and epigenetic modifications, among other factors (21, 22). Furthermore, it has been observed that hypertension is linked to cortical atrophy, specifically in the hippocampus and frontal cortical regions, thereby expediting the process of brain aging (23). Our study reveals that health factors exhibit a stronger correlation with aging compared to health behaviors, likely due to the direct association between health factors and the aging process, while health behaviors mitigate aging by enhancing health factors.
Diseases associated with aging, including osteoporosis, malignant tumors, arteriosclerosis, Parkinson’s disease, and Alzheimer’s disease, now also affect younger populations (24). Jia et al. reported a 19-year-old Chinese youth with probable AD (25). Stroke and other age-related diseases are also showing a trend toward youthfulness (24). The average age of 7,491 participants in this study is 45.26 ± 0.34 years old, which belongs to the middle-aged age range. Unlike the older adult, patients aged 40–54 are the most productive and responsible age group, the main source of income, and often the parents of young children (26). The early onset of age-related diseases is becoming a major medical and social issue (27). Valuable indicators for evaluating aging and health outcomes are particularly important, and we look forward to more research on SII and aging in different age groups in the future, in order to comprehensively elucidate the significance of SII in the aging process and its effectiveness as a clinical tool for evaluating and addressing age-related diseases.
The current investigation possesses various notable attributes. Firstly, the NHANES employed a sophisticated multistage probability sampling design, ensuring the selection of a representative sample from the civilian non-institutionalized population. Consequently, the extrapolation of our results to the entire US civilian noninstitutionalized population can be deemed highly reliable. Secondly, this study employed stratified analyses to investigate the relationship between SII and biological aging across diverse populations, thereby enhancing the generalizability of the findings. Overall, these results have significant implications for public health in terms of aging prevention.
It is imperative to recognize the constraints of the present study. Primarily, the cross-sectional design hinders the ability to establish a causal association between SII and biological aging. Consequently, forthcoming investigations should utilize prospective methodologies to substantiate the effectiveness of the SII. Moreover, the assessment of health behavior indicators in this study was reliant on self-reported questionnaires, susceptible to recall bias. Furthermore, the analysis of biological aging was constrained to clinical indicators such as phenotypic age and biological age, with no exploration of molecular or cellular components. Nonetheless, employing two separate methodologies for assessing biological aging enabled the reciprocal confirmation of our results, thereby greatly bolstering the robustness and credibility of our conclusions.
This study examined a demographically diverse sample of adults in the United States and found significant positive associations between the systemic immune inflammation index (SII), health behavior scores, health factor scores, and biological aging. Of note, health factors showed a stronger positive correlation with biological aging compared to health behaviors, with blood glucose and blood pressure being particularly influential among the health factors. These findings emphasize the potential effectiveness of SII in hastening the aging process and reducing biological aging. Additionally, they underscore the significance of embracing a healthy lifestyle, which plays a crucial role in averting aging.
The original contributions presented in the study are included in the article/Supplementary material, further inquiries can be directed to the corresponding author.
This study was based on publicly available datasets. Ethical review and approval was not required for the study, in accordance with the local legislation and institutional requirements. For the NHANES data studied, ethics approval and consent to participate in NHANES was approved by the National Center for Health Statistics Research Ethics Review Board.
NW: Conceptualization, Data curation, Formal analysis, Funding acquisition, Investigation, Methodology, Project administration, Resources, Software, Supervision, Validation, Visualization, Writing – original draft, Writing – review & editing. LR: Conceptualization, Data curation, Formal analysis, Funding acquisition, Investigation, Methodology, Project administration, Resources, Software, Supervision, Validation, Visualization, Writing – original draft, Writing – review & editing. ZL: Conceptualization, Data curation, Formal analysis, Funding acquisition, Investigation, Methodology, Project administration, Resources, Software, Supervision, Validation, Visualization, Writing – original draft, Writing – review & editing. YH: Conceptualization, Writing – review & editing. JZ: Data curation, Writing – review & editing. QS: Formal analysis, Writing – review & editing. BP: Funding acquisition, Writing – review & editing. XL: Investigation, Writing – review & editing. WP: Methodology, Writing – review & editing. JY: Project administration, Writing – review & editing. RZ: Resources, Writing – review & editing. ZH: Software, Writing – review & editing. ZC: Supervision, Writing – review & editing. GH: Software, Writing – review & editing.
The author(s) declare that financial support was received for the research, authorship, and/or publication of this article. This study was supported by National Key R&D Program of China (2022YFC3501402), Guangdong Basic and Applied Basic Research Foundation (2021A1515011470), Guangzhou Basic and Applied Basic Research Foundation (202201011297).
We thank the NCHS for their efforts in creating the data for the NHANES.
The authors declare that the research was conducted in the absence of any commercial or financial relationships that could be construed as a potential conflict of interest.
All claims expressed in this article are solely those of the authors and do not necessarily represent those of their affiliated organizations, or those of the publisher, the editors and the reviewers. Any product that may be evaluated in this article, or claim that may be made by its manufacturer, is not guaranteed or endorsed by the publisher.
The Supplementary material for this article can be found online at: https://www.frontiersin.org/articles/10.3389/fpubh.2024.1418385/full#supplementary-material
NHANES, National Health and Nutrition Examination Survey; SII, immune-inflammation index; PhenoAgeAccel, phenotypic age acceleration; BioAgeAccel, biological age acceleration; CVD, cerebrovascular disease; OS, oxidative stress; BMI, body mass index.
1. Uyar, B, Palmer, D, Kowald, A, Murua Escobar, H, Barrantes, I, Möller, S, et al. Single-cell analyses of aging, inflammation and senescence. Ageing Res Rev. (2020) 64:101156. doi: 10.1016/j.arr.2020.101156
3. Liu, Z, Kuo, PL, Horvath, S, Crimmins, E, Ferrucci, L, and Levine, M. A new aging measure captures morbidity and mortality risk across diverse subpopulations from NHANES IV: a cohort study. PLoS Med. (2019) 15:e1002718. doi: 10.1371/journal.pmed.1002718
4. Fulop, T, Larbi, A, Dupuis, G, Le Page, A, Frost, EH, Cohen, AA, et al. Immunosenescence and Inflamm-aging as two sides of the same coin: friends or foes? Front Immunol. (2018) 8:1960. doi: 10.3389/fimmu.2017.01960
5. Campisi, J, Kapahi, P, Lithgow, GJ, Melov, S, Newman, JC, and Verdin, E. From discoveries in ageing research to therapeutics for healthy ageing. Nature. (2019) 571:183–92. doi: 10.1038/s41586-019-1365-2
6. Takahashi, T, and Iwasaki, A. Sex differences in immune responses. Science. (2021) 371:347–8. doi: 10.1126/science.abe7199
7. Luo, J, Qin, X, Zhang, X, Zhang, Y, Yuan, F, Shi, W, et al. Prognostic implications of systemic immune-inflammation index in myocardial infarction patients with and without diabetes: insights from the NOAFCAMI-SH registry. Cardiovasc Diabetol. (2024) 23:1–11. doi: 10.1186/s12933-024-02129-x
8. Kennedy, BK, Berger, SL, Brunet, A, Campisi, J, Cuervo, AM, Epel, ES, et al. Geroscience: linking aging to chronic disease. Cell. (2014) 159:709–13. doi: 10.1016/j.cell.2014.10.039
9. Mwasongwe, S, Gao, Y, Griswold, M, Wilson, JG, Aviv, A, Reiner, AP, et al. Leukocyte telomere length and cardiovascular disease in African Americans: the Jackson heart study. Atherosclerosis. (2017) 266:41–7. doi: 10.1016/j.atherosclerosis.2017.09.016
10. Levine, ME, Lu, AT, Quach, A, Chen, BH, Assimes, TL, Bandinelli, S, et al. An epigenetic biomarker of aging for lifespan and healthspan. Aging (Albany NY). (2018) 10:573–91. doi: 10.18632/aging.101414
11. Hertel, J, Friedrich, N, Wittfeld, K, Pietzner, M, Budde, K, Van der Auwera, S, et al. Measuring biological age via Metabonomics: the metabolic age score. J Proteome Res. (2016) 15:400–10. doi: 10.1021/acs.jproteome.5b00561
12. Zhang, R, Wu, M, Zhang, W, Liu, X, Pu, J, Wei, T, et al. Association between life's essential 8 and biological ageing among US adults. J Transl Med. (2023) 21:622. doi: 10.1186/s12967-023-04495-8
13. Hu, B, Yang, XR, Xu, Y, Sun, YF, Sun, C, Guo, W, et al. Systemic immune-inflammation index predicts prognosis of patients after curative resection for hepatocellular carcinoma. Clin Cancer Res. (2014) 20:6212–22. doi: 10.1158/1078-0432.CCR-14-0442
14. Klemera, P, and Doubal, S. A new approach to the concept and computation of biological age. Mech Ageing Dev. (2006) 127:240–8. doi: 10.1016/j.mad.2005.10.004
15. Levine, ME. Modeling the rate of senescence: can estimated biological age predict mortality more accurately than chronological age? J Gerontol A Biol Sci Med Sci. (2013) 68:667–74. doi: 10.1093/gerona/gls233
16. Liu, B, Wang, J, Li, YY, Li, KP, and Zhang, Q. The association between systemic immune-inflammation index and rheumatoid arthritis: evidence from NHANES 1999-2018. Arthritis Res Ther. (2023) 25:34. doi: 10.1186/s13075-023-03018-6
17. Xia, Y, Xia, C, Wu, L, Li, Z, Li, H, and Zhang, J. Systemic immune inflammation index (SII), system inflammation response index (SIRI) and risk of all-cause mortality and cardiovascular mortality: a 20-year follow-up cohort study of 42,875 US adults. J Clin Med. (2023) 12:1128. doi: 10.3390/jcm12031128
18. Sun, Q, Yu, D, Fan, J, Yu, C, Guo, Y, Pei, P, et al. Healthy lifestyle and life expectancy at age 30 years in the Chinese population: an observational study. Lancet Public Health. (2022) 7:e994–e1004. doi: 10.1016/S2468-2667(22)00110-4
19. GBD 2021. Diabetes collaborators. Global, regional, and national burden of diabetes from 1990 to 2021, with projections of prevalence to 2050: a systematic analysis for the global burden of disease study 2021. Lancet. (2023) 402:203–34. doi: 10.1016/S0140-6736(23)01301-6
20. Santisteban, MM, Iadecola, C, and Carnevale, D. Hypertension, neurovascular dysfunction, and cognitive impairment. Hypertension. (2023) 80:22–34. doi: 10.1161/HYPERTENSIONAHA.122.18085
21. Gumz, ML, Shimbo, D, Abdalla, M, Balijepalli, RC, Benedict, C, Chen, Y, et al. Toward precision medicine: circadian rhythm of blood pressure and chronotherapy for hypertension - 2021 NHLBI workshop report. Hypertension. (2023) 80:503–22. doi: 10.1161/HYPERTENSIONAHA.122.19372
22. Ou, YN, Tan, CC, Shen, XN, Xu, W, Hou, XH, Dong, Q, et al. Blood pressure and risks of cognitive impairment and dementia: a systematic review and Meta-analysis of 209 prospective studies. Hypertension. (2020) 76:217–25. doi: 10.1161/HYPERTENSIONAHA.120.14993
23. Luo, J, Thomassen, JQ, Bellenguez, C, Grenier-Boley, B, de Rojas, I, Castillo, A, et al. Genetic Associations Between Modifiable Risk Factors and Alzheimer Disease. JAMA Netw Open. (2023) 6:e2321189. doi: 10.1001/jamanetworkopen.2023.13734
24. Johnson, RJ, Lanaspa, MA, Sanchez-Lozada, LG, Tolan, D, Nakagawa, T, Ishimoto, T, et al. The fructose survival hypothesis for obesity. Philos Trans R Soc Lond Ser B Biol Sci. (2023) 378:20220230. doi: 10.1098/rstb.2022.0230
25. GBD 2019 Stroke Collaborators. Global, regional, and national burden of stroke and its risk factors, 1990-2019: a systematic analysis for the global burden of disease study 2019. Lancet Neurol. (2021) 20:795–820. doi: 10.1016/S1474-4422(21)00252-0
26. Jia, J, Zhang, Y, Shi, Y, Yin, X, Wang, S, Li, Y, et al. A 19-year-old adolescent with probable Alzheimer's disease. J Alzheimers Dis. (2023) 91:915–22. doi: 10.3233/JAD-221065
Keywords: systemic immune-inflammatory index, aging, NHANES, phenotypic age, biological age
Citation: Wang N, Ren L, Li Z, Hu Y, Zhou J, Sun Q, Pei B, Li X, Peng W, Yu J, Zhao R, Huang Z, Chen Z and Huang G (2024) The association between SII and aging: evidence from NHANES 1999–2018. Front. Public Health. 12:1418385. doi: 10.3389/fpubh.2024.1418385
Edited by:
Matthew Yousefzadeh, Columbia University, United StatesReviewed by:
Turan Aghayev, University of California, San Francisco, United StatesCopyright © 2024 Wang, Ren, Li, Hu, Zhou, Sun, Pei, Li, Peng, Yu, Zhao, Huang, Chen and Huang. This is an open-access article distributed under the terms of the Creative Commons Attribution License (CC BY). The use, distribution or reproduction in other forums is permitted, provided the original author(s) and the copyright owner(s) are credited and that the original publication in this journal is cited, in accordance with accepted academic practice. No use, distribution or reproduction is permitted which does not comply with these terms.
*Correspondence: Guoxin Huang, eHp5eGhneEAxNjMuY29t
†These authors have contributed equally to this work and share first authorship
Disclaimer: All claims expressed in this article are solely those of the authors and do not necessarily represent those of their affiliated organizations, or those of the publisher, the editors and the reviewers. Any product that may be evaluated in this article or claim that may be made by its manufacturer is not guaranteed or endorsed by the publisher.
Research integrity at Frontiers
Learn more about the work of our research integrity team to safeguard the quality of each article we publish.