 Yu Wang
 Jiaxue Wang*
 Xiao Wang
95% of researchers rate our articles as excellent or good
Learn more about the work of our research integrity team to safeguard the quality of each article we publish.
Find out more
ORIGINAL RESEARCH article
Front. Public Health , 12 June 2024
Sec. Aging and Public Health
Volume 12 - 2024 | https://doi.org/10.3389/fpubh.2024.1387850
This article is part of the Research Topic Trends, Trajectories and Predictors of Healthy Aging View all 21 articles
Background: Aging, as a global demographic issue, is characterized by its rapid growth, which drives an increase in people's healthcare awareness. The emergence of wellness bases caters to this market demand. Therefore, the identification of potential areas suitable for wellness activities and the construction of wellness bases, referred to as Wellness Target Areas (WTAs), becomes a crucial first step. Currently, commonly used identification methods are mostly based on traditional statistical approaches, which are often complex, cumbersome, and subject to potential risks of subjective assumptions, affecting the reliability of WTAs identification results. Longevity level serves as a comprehensive indicator reflecting the natural and socio-economic environment of a region, making it the most indicative of the regional wellness environment status.
Methods: This study proposes using longevity level as the benchmark for WTAs identification to simplify the identification process and reduce the impact of subjective bias on the results. The study focuses on 129 county-level units in Yunnan Province. Firstly, the Geodetector (GD) is utilized to explore the complex interaction between the longevity level and the geographical environment to determine regional wellness factors. Secondly, using ArcGIS and geographical weighted regression (GWR), the study investigates the role of different wellness factors, ultimately classifying and grading the WTAs.
Results: The longevity level in Yunnan Province exhibits a pattern of multi-point clustering, forming three major longevity regions. Factors that significantly influence longevity level include annual average precipitation, sunshine duration, PM2.5 content, per capita disposable income, density of tourist attractions, and distance from residential areas to hospitals. Based on the degree of longevity and the contribution rate of influencing factors, Yunnan Province's WTAs are classified into three levels and two types (natural and comprehensive).
Conclusion: Our study aims to establish a connection between longevity level and the selection of wellness bases, exploring regional wellness factors through the relationship between longevity phenomena and geographical environment, identifying potential construction areas for wellness bases (i.e., WTAs), providing new insights for the precise selection of wellness bases, effectively enhancing the scientificity of site selection, promoting population health, and contributing to the global aging process with better health.
As the global trend of population aging intensifies (1–5), people's awareness of healthcare is gradually increasing. An increasing number of individuals are considering improving their health through various wellness activities, and the emergence of wellness bases caters to this market demand (6–8). The rapid expansion of the aging population, as the primary target clientele, presents significant opportunities and challenges for the development of wellness bases (9–12). They aim to promote physical and mental wellbeing through different environments, experiences, and activities. However, in the current process of constructing and developing wellness bases, various factors need to be considered, such as resource endowment, accessibility, and the income level of the aging population. Additionally, there are issues such as the mere presence of wellness gimmicks, wastage of wellness resources, and unreasonable layouts. Against this backdrop, identifying suitable areas for constructing wellness bases, known as Wellness Target Areas (WTAs), is the crucial first step in their development. This directly impacts the subsequent implementation of wellness activities and the ultimate achievement of wellness goals.
Currently, the identification methods for WTAs primarily rely on qualitative research, while quantitative research is largely based on traditional statistical methods. These methods include Questionnaire Survey Method (QSM) (13), Analytic Hierarchy Process (AHP) (14), and Fuzzy Comprehensive Evaluation Method (FCEM) (15). For instance, Li and Xu (16) evaluated the construction and development potential of forest wellness bases from multiple levels using AHP and FCEM. Liu et al. (17) also used the expert consultation method and AHP to evaluate the suitability of wellness spaces in Beijing, China. Phuthong et al. (18), with the assistance of QSM, formulated assessment indicators for the development potential of Thailand's WTAs from seven dimensions such as infrastructure and cultural resources. Esfandyari et al. (19) evaluated the impact factors of building wellness bases in the rural areas of northwestern Iran based on QSM, asserting that geographical location, climate, history, etc. are the decisive factors for the site selection and construction of wellness bases. However, these methods are often influenced by the subjective thinking patterns of researchers. The question design and interpretation of QSM may be biased due to the subjective preferences and personal opinions of researchers. For example, in the research of WTAs identification, different researchers may have different understandings and definitions of “suitability” and “impact factors,” which affects the objectivity of questionnaire design and the reliability of conclusions. Similarly, when AHP and FCEM determine factor weights, they rely on experts to determine the relative importance of each factor through pairwise comparisons, which may lead to inconsistency and inaccuracy of factor weights (20).
In the context of global aging, accurately identifying WTAs suitable for the construction of wellness bases has become an important issue. However, the strong subjectivity and complex selection process greatly limit the effective identification of WTAs. We need to consider using an objective and comprehensive indicator to assess the potential of regional wellness base construction, and use it as a benchmark for WTA identification. From the explanations and elaborations of the concept of “wellness base” by scholars from various fields, it is clear that promoting population health and longevity is the ultimate goal of wellness base construction and wellness activities (21–23). In this regard, the regional longevity agglomeration phenomenon is the result of the comprehensive effect of the natural environment, cultural environment, and individual factors, among others (24–30), and the level of longevity can largely reflect the impact of the regional environment on human health. Therefore, we propose an innovative method, taking the level of longevity as a comprehensive characterization indicator of wellness environment conditions and the main basis for WTA identification. This method aims to establish a connection between the level of longevity and the site selection of wellness bases, explore regional wellness factors through the relationship between longevity phenomena and geographical environment, identify potential construction areas for wellness bases (i.e., WTAs), reduce the impact of subjective bias on the results, avoid the problem of incomplete consideration of influencing factors in the identification process, simplify the complex and cumbersome site selection process, and provide new insights for the precise site selection of wellness bases.
In summary, we use the level of longevity as the benchmark for identifying WTAs and take Yunnan Province, the core area of the longevity region in Southwest China, as the case study. First, we explore the spatial distribution pattern of the longevity a in Yunnan Province through spatial analysis methods. Then, we use the Geodetector (GD) and Geographically Weighted Regression (GWR) to explore the driving factors (wellness elements) that form this pattern (31, 32). The use of GD and GWR is due to their ability to effectively handle the spatial heterogeneity of geographical phenomena, thereby helping us better understand and explain the relationship between longevity phenomena and geographical environment. Through regional wellness elements and their modes of action, we finally divide the potential areas for building wellness bases (i.e., WTAs), into types and levels. This method is expected to provide a reference for the site selection, construction, and development of wellness bases in other regions or globally, meet the wellness needs of various groups mainly composed of older adult, improve the precision of population health policy guidance, and thus promote population health development and contribute to the global healthy aging process.
China, as one of the countries with the fastest aging population in the world, is experiencing a rapid increase in its aging population. According to the 2020 national census data, the population over 65 years old (191 million) accounts for 13.24% of the total population (1.443 billion), an increase of 4.37% compared to 2010. Yunnan Province, as one of the distribution areas of the longevity belt in China, is located on the southeastern edge of the Himalayas (33). The active geological structure movement in the plate boundary area makes it the regional unit with the most diverse geographical environment in Asia, making it an ideal place to study the phenomenon of longevity (Figure 1).
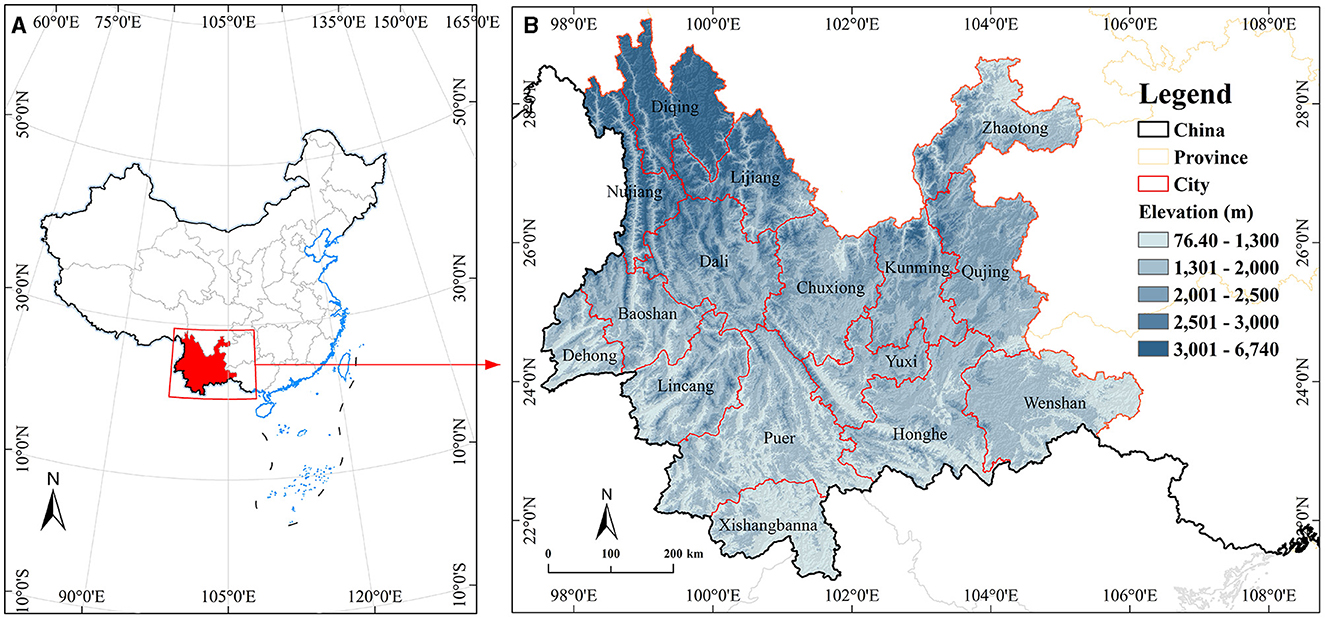
Figure 1. Overview map of the study area. (A) The location of Yunnan Province in China. (B) Diagram of the cities and elevation distribution in Yunnan Province.
Yunnan Province has a total area of 394,100 square kilometers (21°8′N−29°15′N, 97°31′E−106°11′E). From a natural environment perspective, about 90% of Yunnan Province is mountainous, the terrain gradually descends from the northwest to the southeast in a step-like manner, and the climate is complex and diverse, combining low-latitude climate, monsoon climate, and mountainous climate characteristics. The complex terrain and diverse climate have created unique natural environmental features. At the same time, with the development of the social economy in this area, per capita income is continuously increasing. Influenced by historical and other factors, this area has also formed a multi-ethnic culture (26 ethnic minorities, out of 56 in China), unique health-preserving medicine (Miao medicine, Tibetan medicine, etc.), and other special cultural environments. Ethnic customs and cultural differences also affect the lifespan of the population to a certain extent, which lays a good foundation for regional population longevity (34).
This study is based on the seventh census data of Yunnan Province, with 129 counties in the region serving as the research unit. The vector data is sourced from the National Basic Geographic Information Center (http://www.ngcc.cn/ngcc/), and the population data is derived from the National Bureau of Statistics census data, the China County Statistical Yearbook (County and City Edition), the Yunnan Province Statistical Yearbook (http://www.stats.gov.cn/tjsj/pcsj/), and internal statistical data from various prefecture-level, county-level, and district-level administrative units. The selection of data sources is based on their reliability and timeliness.
Longevity is influenced by various factors. Based on the unique natural environment of Yunnan Province and the existing literature on the influencing factors of population longevity, we selected 12 factors for in-depth exploration (18, 35–41). As shown in Table 1, they can be divided into natural and human factors (42). Firstly, terrain and soil conditions are considered to have a certain impact on human health (43–45). Particularly, the impact of elevation and slope on the natural environmental gradients such as air pressure and negative oxygen ions (46). We use the ArcGIS software to extract the average elevation (A1) and slope (A2) data of each county from the digital elevation model data (sourced from the Geospatial Data Cloud), and obtains the average soil organic carbon (A3) content of each county from the World Soil Database to characterize the soil environment. Secondly, high and low temperatures and precipitation intensity in climate factors play an important role in affecting the mortality rate of the older population (47). We use interpolation of nearly 20 years of meteorological station data to obtain the annual average temperature (A4), sunshine duration (A5), and annual average precipitation (A6) of each county from 2000 to 2020. Solid particles in the air, such as PM2.5 content (A7, referring to particles in the atmosphere with a diameter ≤ 2.5 μm, also known as respirable particles), also have a certain impact on human health (48). In terms of economy, per capita disposable income (B1) plays a key role in ensuring the quality of life of residents (49). The quality of medical and transportation directly relates to whether residents' health is guaranteed (50). We use the average distance from residents' points to hospitals in each county (B2) and road density (B3) to represent these two factors. Finally, the leisure environment for older adult is considered to be closely related to mental health (51), and high-quality older adult leisure environments can improve individuals' emotional regulation ability (52). We use the density of nursing homes (B4) and density of tourist attractions in each county (B5) to represent the quality of the leisure environment.
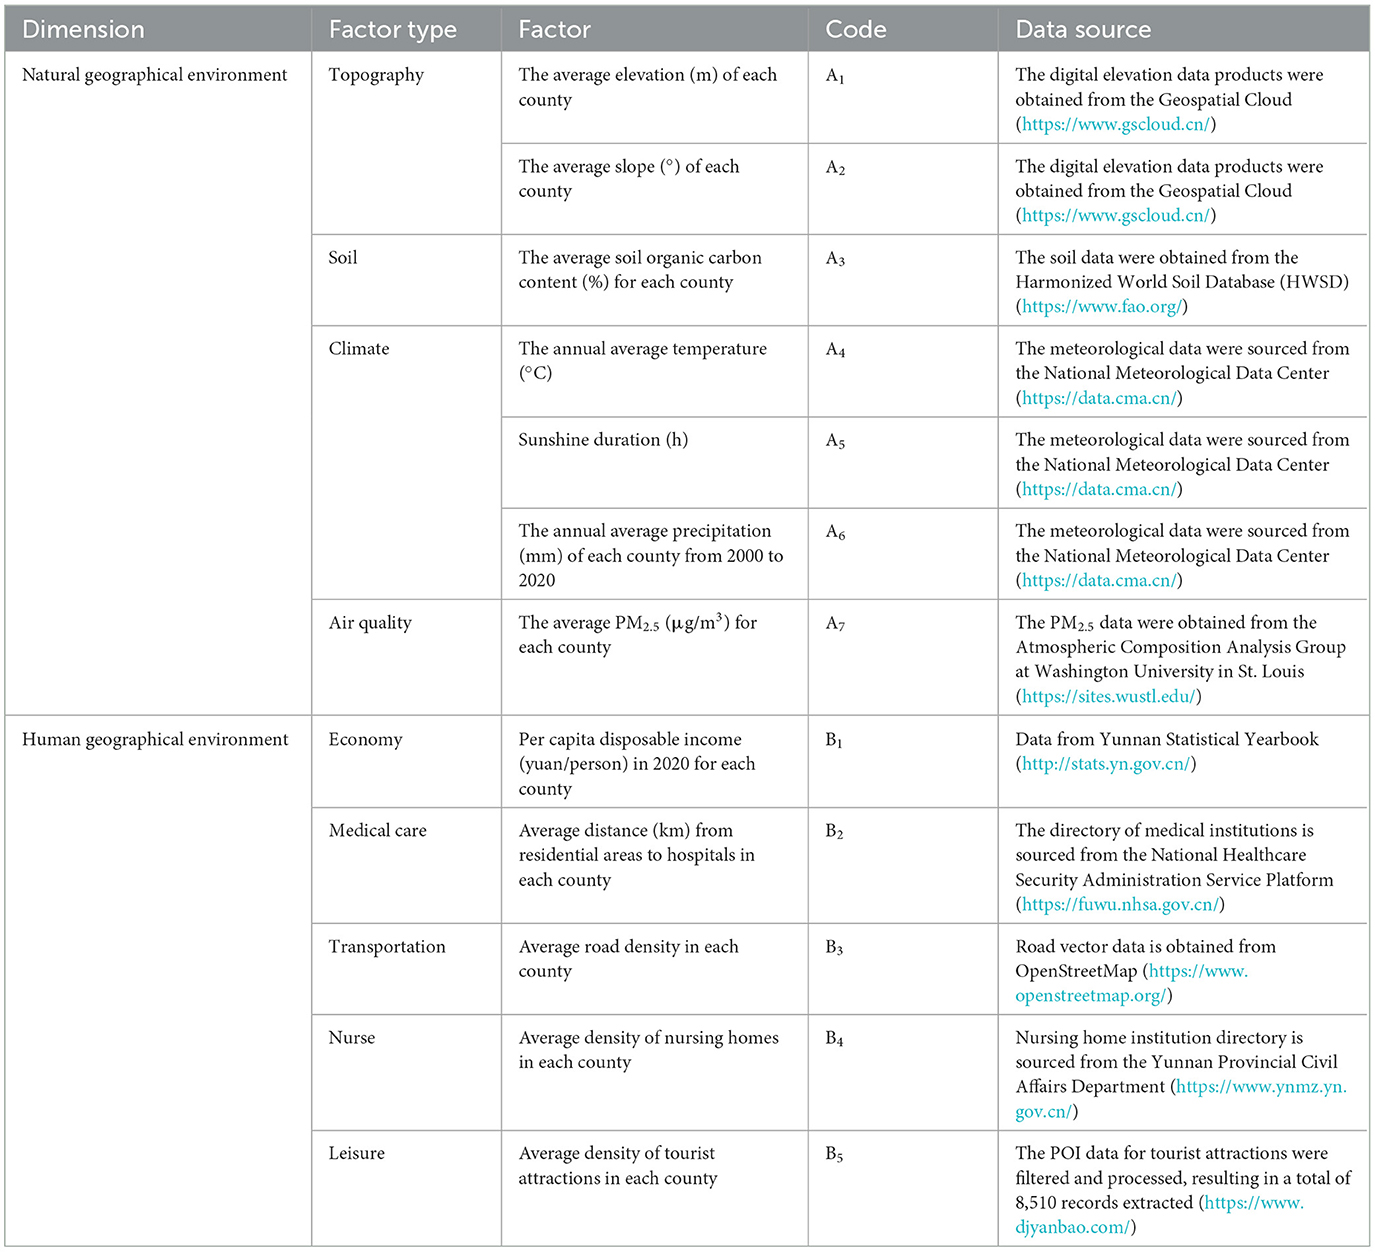
Table 1. Impact factor parameters and their data sources.
In conclusion, in this study, we have selected a total of seven natural factors (Table 1), including elevation (A1), slope (A2), soil organic carbon content (A3), annual average temperature (A4), sunshine duration (A5), annual average precipitation (A6), average PM2.5 content (A7), as well as 5 human factors, including per capita disposable income (B1), distance from residential areas to hospitals (B2), road density (B3), density of nursing homes (B4), and density of tourist attractions (B5) for investigation.
The process of the study is shown in Figure 2. Building upon the elucidation of the coupling relationship between the spatial distribution of longevity levels and the identification of wellness factors, this study focuses on the core area of the typical longevity belt in China, namely Yunnan Province, as a case study area. It investigates the spatial distribution patterns of longevity levels and employs GD model to explore the driving factors behind this distribution pattern (i.e., identifying regional wellness factors). Due to variations in the depth and breadth of the effects of different wellness factors in different regions, the study further utilizes GWR to investigate the modes of action of different driving factors on regional longevity levels. Based on the regression coefficients, the contribution of different factors is calculated to classify the types of WTAs. Meanwhile, based on the longevity index, these WTAs are graded, leading to conclusions being drawn.
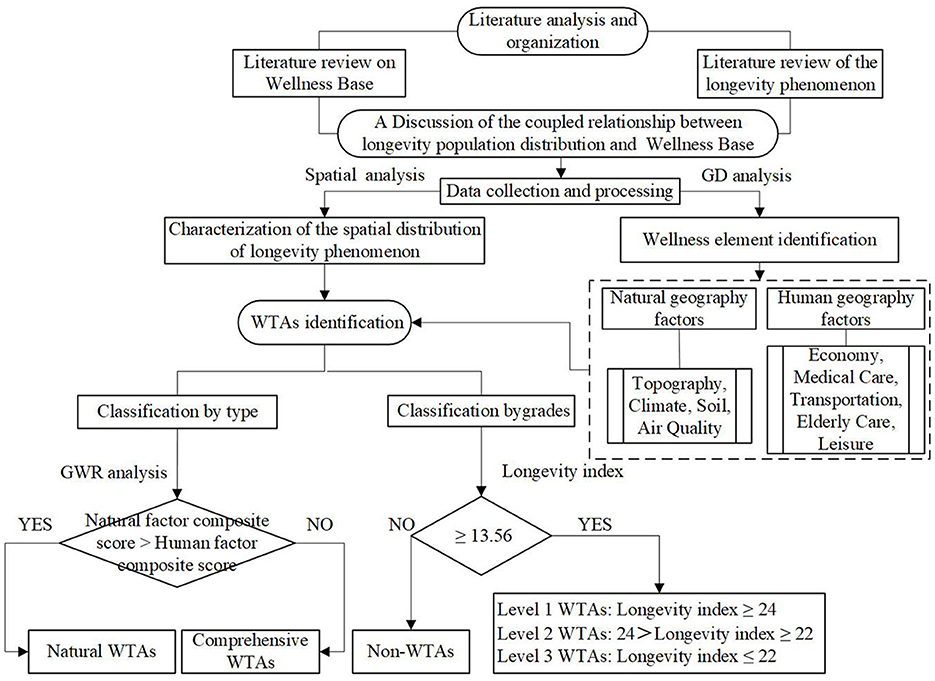
Figure 2. Research flowchart.
The level of longevity can be measured from multiple perspectives, and its measurement methods involve various indicators. To more comprehensively assess the longevity status of a region or country, it is often necessary to consider multiple factors (30). This study starts from the perspective of the structure of the aging population and measures the regional longevity level by the percentage of the population over 90 years old (P90+) to the population over 65 years old (P65+). This calculation method can not only avoid the impact of the population base, but also more specifically understand the longevity status of a region in the higher age segment, and intuitively reflect the overall lifespan level of the region (53). The longevity index is calculated as shown in Equation (1):
Hotspot analysis is a statistical technique that uses the Getis-Ord index to identify areas with significant spatial clustering of high or low values. This allows for the measurement of cold spots and hotspots in geographical phenomena (54). In this study, the index is used to measure and evaluate the spatial clustering degree of the longevity index. The index is calculated by Equation (2):
After standardizing the index, Z() is obtained, and the calculation formula is as Equation (3):
In the formula, Xi represents the longevity index of the ith county in Yunnan Province. Wij is the spatial weight matrix. n is the total number of evaluation units (number of counties). is the mathematical expectation. is the coefficient of variation. The distribution of the values determines the hot and cold spot areas of the longevity index in different counties. If the value is significant and positive, it indicates that the longevity population in that area shows a high-level spatial clustering feature, making it a hot spot area. Conversely, if it is a negative value, it indicates a cold spot area.
GD model is a statistical method that reveals the driving factors behind research phenomena and the interaction relationships between various factors (32). GD includes risk detection, factor detection, ecological detection, and interaction detection. According to the research needs, this study only explains factor detection and interaction detection, which respectively represent the explanatory power (q) of single factor or multi-factor interaction on the spatial differentiation of longevity population. The establishment of the GD model requires the conversion of continuous variables into discrete categories or interval variables. This study inputs 12 geographical environment variables into GD to calculate q-values. It utilizes the GD package in R (55) to draw distribution maps of q values obtained through various discretization methods (including equal interval, quantile, natural breakpoint, geometric interval, and standard deviation methods) and classification numbers (ranging from 4 to 10 classes). The study identifies the optimal discretization method for different factor variables based on the maximum q value. The calculation formula of q is as Equation (4):
In the formula, q represents the explanatory power of geographic factors for spatial heterogeneity of longevity population, with a range of [0, 1]. A higher q-value indicates stronger explanatory power. L is the number of categories of the influencing factor X, Nh is the total number of units in the entire region (number of counties), and σh is the variance of the dependent variable Y for the hth category within the region.
The Geographically Weighted Regression (GWR) model is a regression model that extends spatial effects based on the Ordinary Least Squares (OLS) model (31). It is used to study the relationships between variables in spatial datasets and takes into account spatial autocorrelation. Unlike traditional regression analysis, GWR allows model parameters to vary spatially, meaning each observation point (county) in the model has its own regression coefficient. This enables GWR to better capture the spatial heterogeneity and non-linear relationship between the spatial distribution of the long-lived population and influencing factors. In GWR, the regression coefficient of each observation point (county) is calculated by weighting the information of nearby points, these weights are usually calculated based on distance or other measures of spatial association. Therefore, for each observation point, the model fits a local regression model based on the data of its surrounding neighboring points to more accurately reflect the specific spatial environment of that point (county). The calculation formula for the GWR model is as Equation (5):
In this formula, yi represents the longevity index, P is the number of wellness factors, (ui, vi) represents the coordinates of point i (i = 1, 2, 3, …, n), and βk(ui, vi) is the value of the continuous function at point i. xik and εi denote the kth independent variable and its error term, respectively.
This study, based on the comprehensive consideration of the geographical environmental characteristics and socio-economic status of Yunnan Province, uses GD to screen out factors that have a significant correlation (above 95% confidence level) with the phenomenon of longevity areas. Since different factors have obvious differences in their effects in different regions, WTAs are further classified and graded based on the results of the GWR regression coefficients. GWR is performed in ArcGIS software, and the specific steps are as follows:
• First, normalize the values of the influencing factors that pass the significance test (in the GD model).
• Next, calculate the sum of the products of the contribution (regression coefficient) of different types of influencing factors (natural factors and human factors) through the GWR model to obtain the comprehensive scores of natural factors and human factors in different counties.
• When the comprehensive score of natural factors in a certain county is higher than the comprehensive score of human factors, it is classified as a natural type WTA, otherwise, it is classified as a comprehensive type WTA.
To circumvent the influence of population differences on the spatial differentiation of longevity, we use the longevity index (in Section 2.3.2) to measure regional longevity levels and conduct spatial visualization analysis (Figure 3A). The study uses the national average level of 15% as the threshold, dividing the longevity area into four levels, namely high-level area (27.70–33.4), sub-high-level area (24.09–27.69), higher-level area (20.48–24.08), and non-significant area (11.47–20.47). The regional differences in the longevity index at the county scale are significant, and the high-level areas show a “three poles and multiple centers” distribution trend.
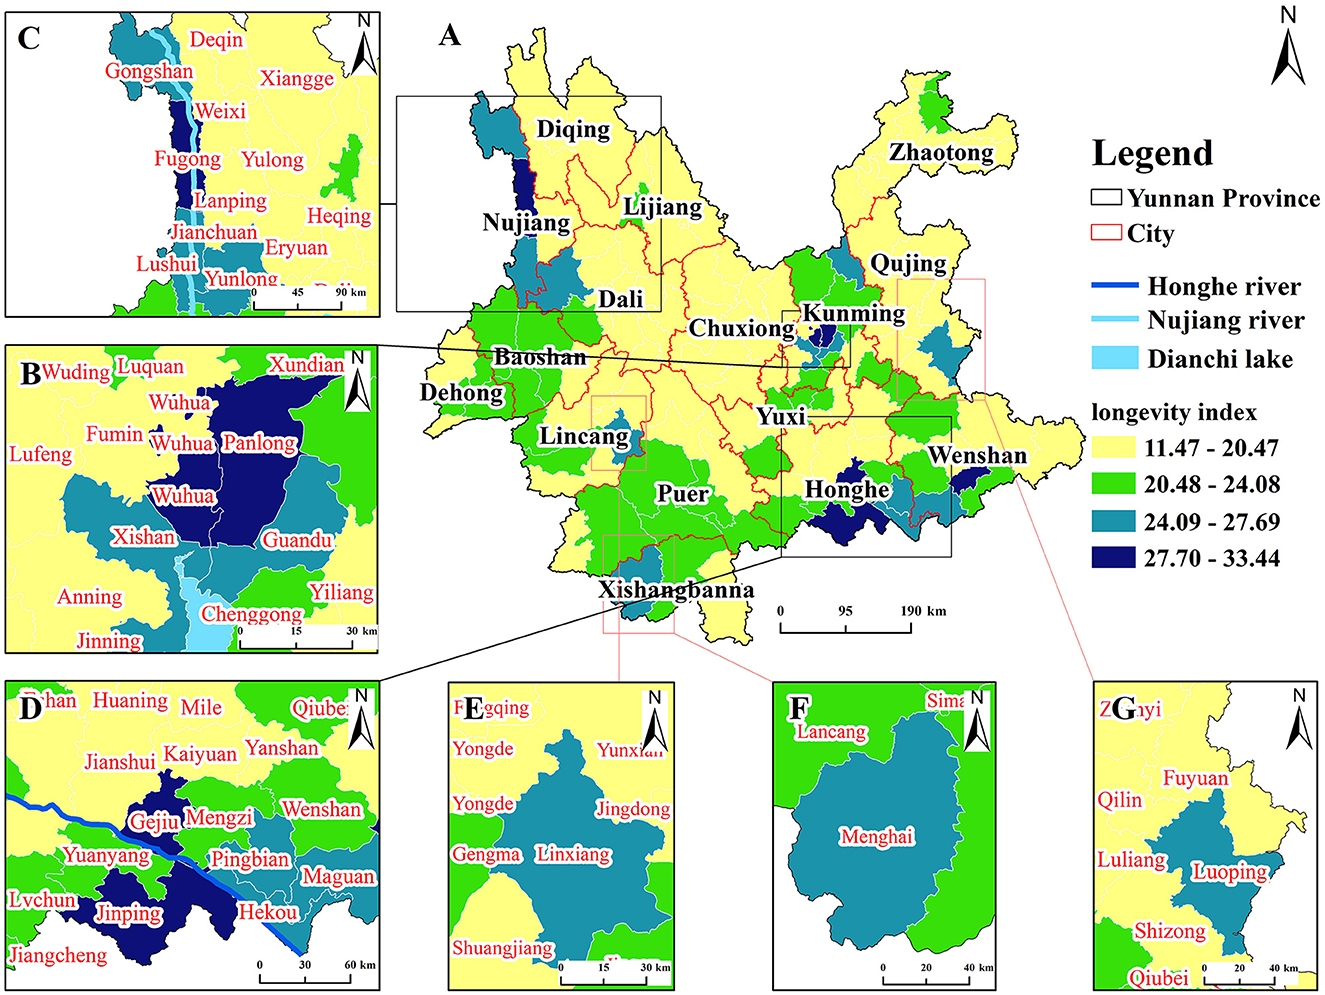
Figure 3. Distribution map of longevity levels (index), showing the following: (A) Distribution map of longevity index in Yunnan Province; (B) Dian Lake Basin Longevity Area; (C) Nujiang River Basin Longevity Area; (D) Honghe River Basin Longevity Area. (E) Linxiang and other secomd-level areas; (F) Menghai and other secomd-level areas; (G) Luoping and other secomd-level areas.
The “three poles” are clustered around Dian Lake, Nujiang, and Honghe River, presenting three major longevity areas: (1) The “Dian Lake Basin Longevity Area” (Figure 3B), which includes high-level and sub-high-level and higher-level areas surrounding the high-level area (Wuhua and Panlong), overall showing a hierarchical distribution. (2) The “Nujiang River Basin Longevity Area” (Figure 3C), which includes a high-level county (Fugong), multiple sub-high-level areas (e.g., Gongshan) and higher-level areas (e.g., Tengchong) distributed near both sides of the Nujiang River. (3) The “Honghe River Basin Longevity Area” (Figure 3D), where sub-high-level areas (e.g., Pingbian) and multiple higher-level areas are distributed around the high-level area (Gejiu, Jinping, Xichou), presenting a hierarchical distribution. The “multiple centers” are manifested as counties such as Linxiang (Figure 3E), Menghai (Figure 3F), and Luoping (Figure 3G), which are clustered or sporadically distributed sub-high-level longevity areas.
To further explore the clustering pattern of longevity, the Getis-Ord statistical index-based hotspot analysis method was employed in the ArcGIS platform. The spatial results of the hotspots for the longevity index in Yunnan Province are shown in Figure 4. Hotspot areas [including highly significant hotspots (99% confidence level), significant hotspots (95% confidence level), and hotspots (90% confidence level)] are mainly distributed in the Dian Lake Basin, the Honghe River Basin, and the Nujiang River Basin, with highly significant hotspots mostly concentrated in the Honghe River Basin and the Dian Lake Basin. Coldspot areas [including highly significant coldspots (99% confidence level), significant coldspots (95% confidence level), and coldspots (90% confidence level)] are mainly located in areas such as Dali City, Chuxiong City, and Zhaotong City. The results of the hotspot analysis correspond to the geographical distribution characteristics of the longevity index. It can be observed that longevity regions are mainly concentrated in the Dian Lake Basin, Honghe River Basin, and Nujiang River Basin.
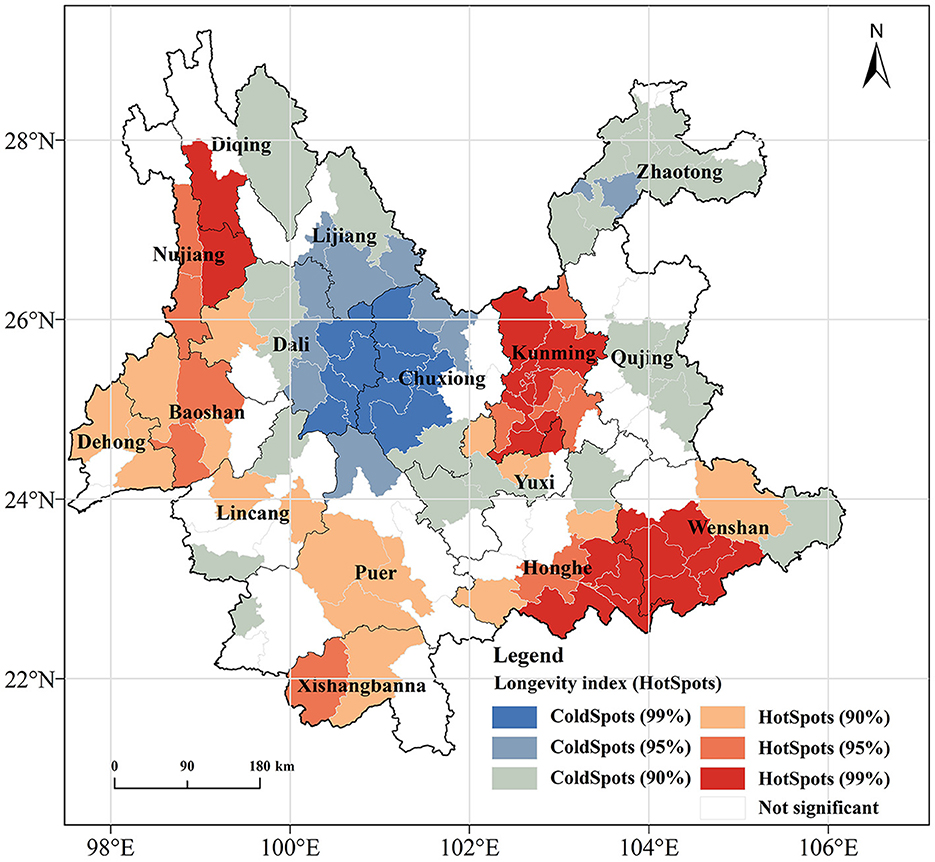
Figure 4. Hotspots distribution map of longevity level (index).
Using the longevity index as the dependent variable, the natural and human factor variables were transformed into type values and inputted into the GD model for calculation. The best detection results were then output based on different discretization methods.
The results of single-factor detection are depicted in Figure 5. From the perspective of natural factors, significant differences in the contribution of each factor are observed. The influence on the spatial distribution of the longevity population follows the order of A6 (0.2816) > A5 (0.2624) > A7 (0.2108) > A1 (0.1506) > A4 (0.0987) > A2 (0.0649) > A3 (0.0293). Notably, A6 (0.2816) exhibits the highest contribution to the spatial agglomeration of the longevity population, while factors A1, A2, A4, and A3 did not pass the significance test (p < 0.05). Regarding human factors, the influence on the spatial distribution of the longevity population follows the order of B3 (0.2639) > B1 (0.1833) > B4 (0.1757) > B5 (0.1686) > B2 (0.1537). However, both B3 and B4 did not pass the significance test (p < 0.05). Overall, the explanatory power q of the six factors that passed the significance test is as follows: A6 > A5 > A7 > B1 > B5 > B2, indicating that the explanatory power of natural factors is stronger than that of human factors. This underscores the crucial role of natural factors, as innate environmental conditions, in determining the longevity level.
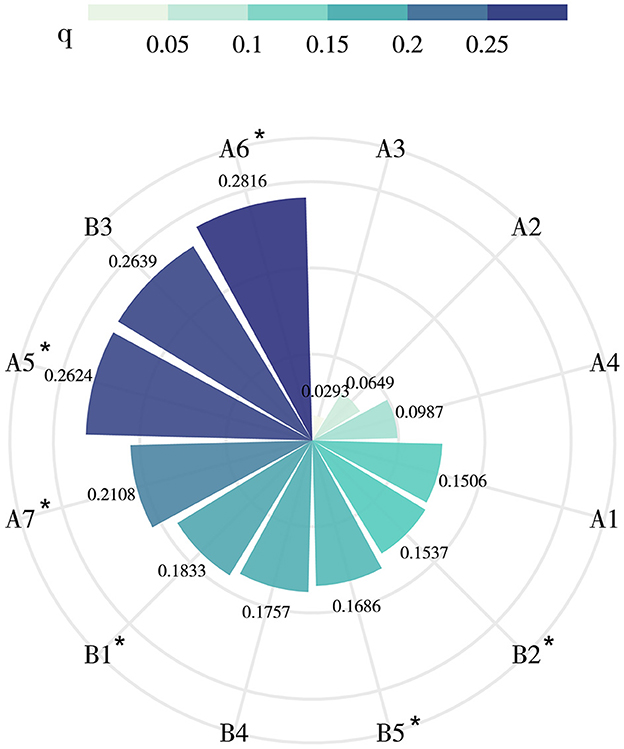
Figure 5. Single factor detection results affecting the spatial distribution of long-lived population. “*” represents a significant p-value < 0.05 (i.e., passed the test of significance).
The GD interaction detection results, as illustrated in Figure 6, indicate that the interaction between A5 and A4 is the most significant (q = 0.601). A6 and B5 constitute the second leading interaction factors for the distribution of high longevity levels (q = 0.531), while A5 and B5 are the third leading interaction factors (q = 0.530). Notably, although the explanatory power of A4 is not significant in single-factor detection, its interaction with A5 yields the highest action value at 0.601. This suggests that the explanatory power of dual-factor interaction surpasses that of single-factor action, indicating that spatial heterogeneity results from enhanced effects after multi-factor interaction. When A5 and A6 interact with multiple human factors, the action values are all above 0.45, indicating that the explanatory power for the spatial agglomeration of the longevity population is significantly improved when human factors interact with natural factors. In conclusion, while natural factors play a leading role in longevity agglomeration, the influence of human factors should not be overlooked. The explanatory power of geographical factor interaction on the spatial distribution of longevity levels does not follow a linear influence of a single factor or a simple superposition process, but rather results from multi-factor comprehensive action.
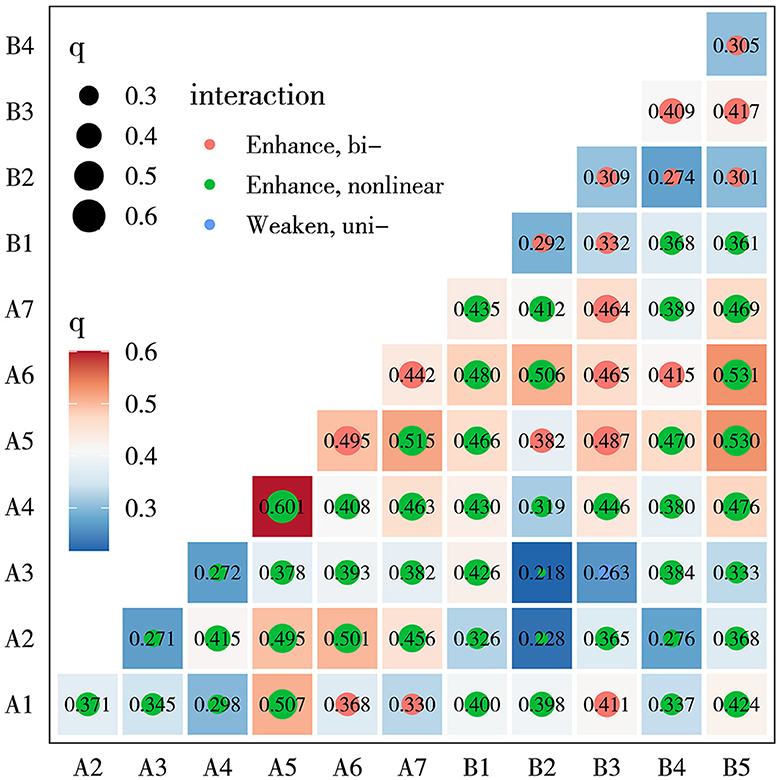
Figure 6. Heat map of interactive detection of influence factors. Natural factor (code): elevation (A1), slope (A2), soil organic carbon content (A3), annual average temperature (A4), sunshine duration (A5), annual average precipitation (A6), and average PM2.5 content (A7). Human factors: per capita disposable income (B1), distance from residential areas to hospitals (B2), road density (B3), density of nursing homes (B4), and density of tourist attractions (B5).
Given that the impact of different factors on the spatial distribution of the long-lived population is not isolated, and the strength and outcome of independent variables vary across regions, the GWR model was further introduced for local spatial regression analysis. The spatial differences in the effects of six influencing factors that passed the 0.05 significance test of geographic detection were analyzed, including three natural factors (Factor A6, A5, and A7) and three human factors (Factor B1, B2, and B5). The GWR model overall passed the multicollinearity judgment, with an R2 of 0.5320 (adjusted R2 = 0.4438), indicating a relatively high goodness of fit. The spatial effects of each geographic factor were significantly different, as shown in Figure 7.
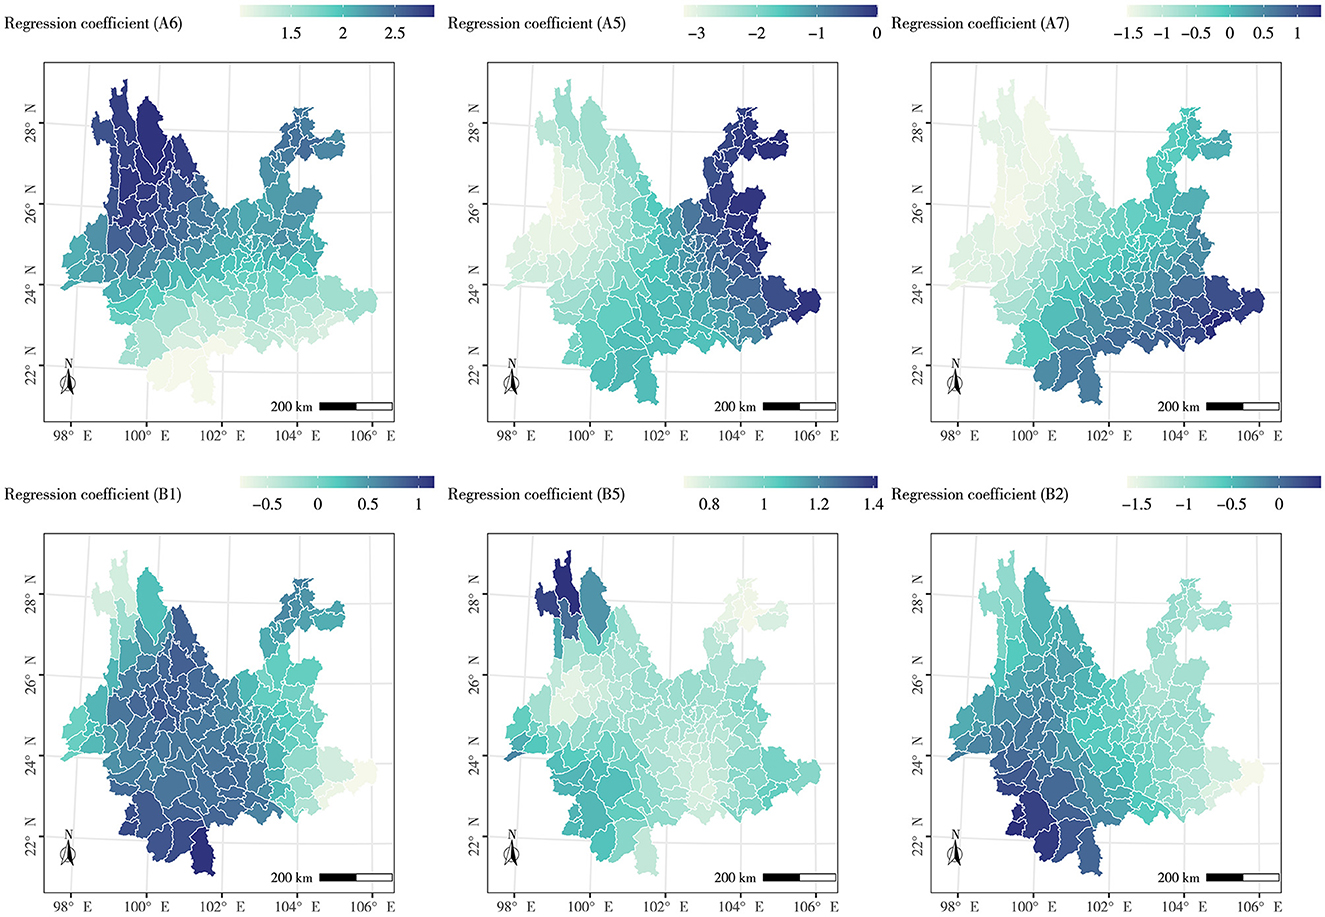
Figure 7. Analysis of regression coefficient of impact factors. showing the following: Geographically weighted regression analysis of human factors: Natural factor (code): the annual average precipitation (A6), sunshine duration (A5), and average PM2.5 content (A7). Human factors: the per capita disposable income (B1), distance from residential areas to hospitals (B2), and density of tourist attractions (B5).
The GWR analysis reveals that natural factors exert varying positive and negative influences across different regions. Factor A6 significantly positively affects the spatial distribution heterogeneity of the longevity population, with the effect intensifying from the south to the north of Yunnan Province. This suggests that precipitation has fostered longevity in Yunnan Province, with rainfall's contribution to longevity being more pronounced in the north. Conversely, Factor A5 negatively impacts the western region of Yunnan Province. These areas, despite having a basic sunshine duration exceeding 5.5 h, experience a negative effect due to low rainfall. However, it exerts a positive influence in the east and northeast of Yunnan Province. These regions, located in the front zone of the Kunming quasi-stationary front, receive high rainfall, and the appropriate sunlight promotes health preservation. The influence of Factor A7 diminishes from the southeast to the northwest of Yunnan Province. The lower the PM2.5 content level, the higher the air quality, which is beneficial to human health. The PM2.5 content concentration across Yunnan Province is generally low, with only Hekou County's PM2.5 content concentration (36.842 μg/m3) exceeding the national secondary standard (35.000 μg/m3) (56). The positive effect of the regression coefficient in the southeastern region may be attributed to the minimal social and economic development gap in these areas. Residents can access equal opportunities for medical, educational, and other facility services. In recent years, the economic growth rate has gradually increased, and industrial pollution has intensified. Consequently, a contradiction between high PM2.5 content concentration and high longevity level has emerged.
The GWR results also indicate that human factors exert varying positive and negative influences across different regions. The regression coefficient of Factor B1 has a significant positive driving effect in approximately half of the study areas, primarily concentrated in the 100°E−102°E region, such as Xishuangbanna City, Dali City, and Lijiang City. This is attributed to the development of the tourism industry in these areas in recent years, which, coupled with economic development, has fostered longevity. The areas negatively impacted by Factor B1 are concentrated in the southeastern region of Yunnan Province. These areas, despite being relatively economically underdeveloped, have a high longevity index, hence the negative impact. With the exception of a few counties near the southwestern border of Yunnan Province that do not contribute positively, Factor B2 has almost universally limited the improvement of longevity in all areas. This is because the population in the southwestern region of Yunnan Province is relatively small, and medical resources are not as strained as in other places, resulting in a weak impact of B2 on the clustering of longevity. Factor B5 has a significant positive effect in all counties in Yunnan Province. Yunnan, boasting a large number of tourist attractions and ranking among the top in the country, has a rich ethnic cultural atmosphere that promotes both physical and mental health.
The GD analysis explores the impact of various factors on longevity across geographical spaces, while the GWR more finely discerns the contribution (regression coefficient) of different factors to longevity in distinct regions. Therefore, calculating the weight scores of natural and human factors based on their contributions is a logical approach. This method quantifies the impact of different factors and provides a foundation for the subsequent identification and classification of WTAs.
Based on the above conclusions, this study adopts A6, A5, A7, B1, B2, and B5 as the selection criteria for WTAs, which is scientifically sound. Specifically, this study first identifies the main factors that significantly impact the longevity level and identifies the regional healthcare elements (including A6, A5, A7, B1, B2, and B5) based on the results of the GD analysis. Then, through GWR, the contribution of each factor in geographical space (i.e., regression coefficient) is explored to obtain more regionally differentiated factor weights. Finally, the comprehensive scores of natural and human factors in different counties are calculated respectively, based on the sum of the product of the normalized source data of the influencing factors and their contributions. These scores are combined to categorize different types of WTAs. If the comprehensive score of natural factors in a county is higher than that of human factors, it is classified as a natural WTA; otherwise, it is classified as a comprehensive WTA.
Simultaneously, counties (55 in total) not <15% of the national average longevity level are classified and graded, and the division results are shown in Table 2 and Figure 8. Natural WTAs are primarily distributed in the northwest and southeast of Yunnan, while comprehensive WTAs are mainly located in the central region of Yunnan. Among them, first-level WTAs (longevity index ≥24) include 18 counties, comprising 10 natural WTAs and 8 comprehensive WTAs; 16 counties are categorized as second-level WTAs (24 > longevity index > 22), including seven natural WTAs and nine comprehensive WTAs; third-level WTAs (longevity index ≤ 22) include 20 counties, divided into 11 natural WTAs and nine comprehensive WTAs.
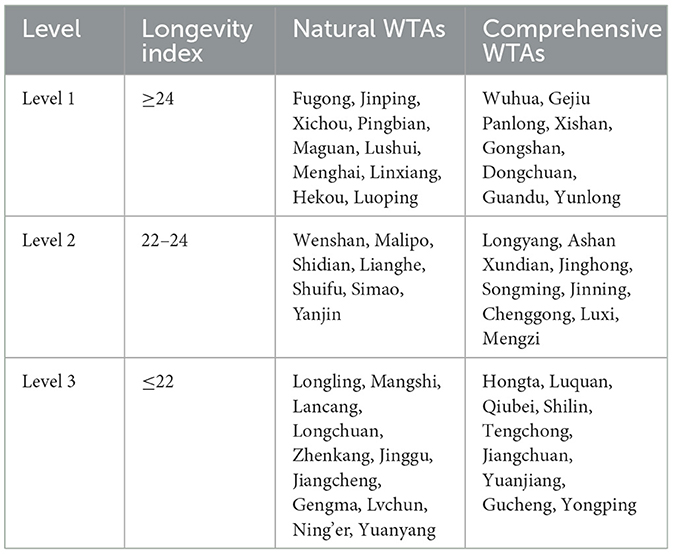
Table 2. Classification table of wellness target areas (WTAs) in Yunnan Province.
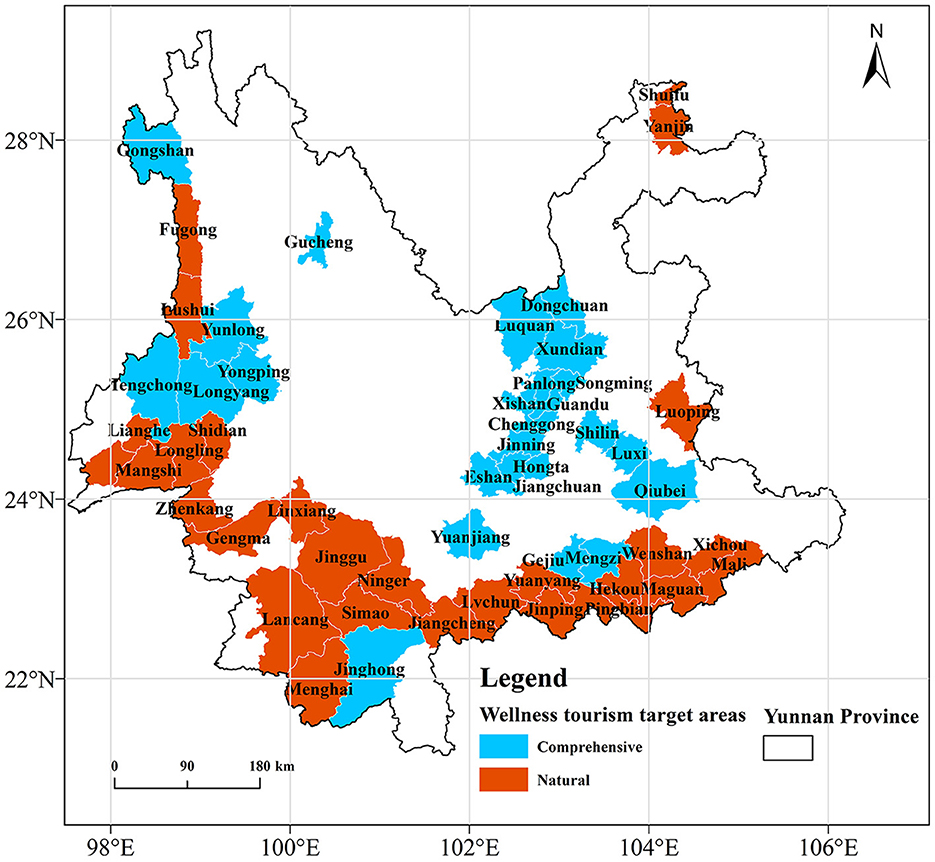
Figure 8. Wellness target area classification results.
In terms of the spatial distribution of longevity, we found that the longevity regions in Yunnan Province exhibit a “three-pole and multi-center” distribution pattern. These areas also display a distinct “center-periphery” distribution mode, which roughly corresponds to the economic geography gradient of Yunnan Province but is not entirely coincident. This indicates that the phenomenon of longevity is influenced by a combination of the natural environment and socio-economic conditions. The results of the GD further confirm this rule: the explanatory power of natural factors for the phenomenon of longevity is slightly stronger than that of human factors. The explanatory power of factors, as determined through significance testing, is in the order of annual average precipitation > sunshine duration > PM2.5 content > per capita disposable income > density of tourist attractions > the average distance from residents' points to hospitals. It can be seen that as innate environmental conditions, natural factors are crucial to the level of longevity, but the driving role of human factors should not be ignored. On the other hand, the results of GWR also show that due to geographical environmental differences, independent factors (variables) have different strengths and results in different regions. There are positive and negative differences in the spatial effects of each geographical factor on the longevity index.
Through the analysis of longevity level characteristics, we use the national average longevity level as a basis to divide it into three levels. As mentioned earlier, the phenomenon of longevity is influenced by the spatial heterogeneity of natural and human factors in different regions. Therefore, WTAs should also be divided into different types based on this heterogeneity phenomenon. We calculate the comprehensive scores of different factor types (natural and human) based on their contributions, and finally divide the WTAs in Yunnan Province into two types: natural and comprehensive. The first-level natural WTAs are mainly distributed in the northwest, southwest, and southeast of Yunnan. These areas, dominated by mountains and hills, have a warm and humid climate, and a dense river network. The unique natural resource endowment makes these areas the core of longevity population agglomeration, providing a positive effect for the agglomeration of the longevity population. The first-level comprehensive WTAs are mainly distributed in the central region of Yunnan. This area, characterized by a flat and open terrain and a warm and humid climate, meets the health needs of the wellness group given the natural environment. A robust economic foundation can also meet the market demand of the wellness group for modern social service levels, and radiate to drive the economic development of surrounding areas.
Currently, there are still many issues in the identification of WTAs globally, and the construction of wellness bases remains in an immature stage (1, 2, 57). Based on the analysis of literature from various countries and the case area (Yunnan Province, China), the common problems faced can be summarized as follows: (1) In the geographical environment, health and wellness factors have not been accurately identified. The understanding of the term “wellness” remains at a simple leisure and vacation level, and the importance of the natural environment and cultural environment to health services has not been given due attention. (2) Traditional methods (such as QSM, AHP, FCEM, etc.) are highly subjective, leading to a certain degree of blindness in the identification of WTAs. (3) The development positioning of the WTAs is still not clear, leading to waste of health and wellness resources and unreasonable layout of health and wellness activities. For example, natural WTAs should develop and design health and wellness products based on the pursuit of the true nature of the health and wellness group; comprehensive WTAs can take advantage of regional economic advantages to meet the diversified needs of the health and wellness market. (4) The development model is single, the types of health and wellness products in the health and WTAs are seriously homogenized, and the corresponding industry policies and industry mechanisms have not yet formed institutional norms. (5) The imperfection of social security systems such as pension insurance benefits leads to greater resistance to the continuous development of the health and wellness market, and the potential for the development of the health and wellness industry is difficult to be deeply tapped.
In response to the deficiencies and problems in the current process of identifying health and WTAs (3, 58–60), this study proposes the following suggestions based on the research results, and plans to promote the healthy development of the health and wellness industry in a planned and step-by-step manner: (1) It is crucial to fully explore regional health and wellness factors in the early stage of identifying health and WTAs. Developers need to accurately grasp the endowment of regional health and wellness resources, divide different orientation types of health and WTAs according to regional resource advantages, and avoid waste of health and wellness resources. (2) Adopting appropriate identification methods according to local conditions is a prerequisite for the orderly development of health and wellness activities and the reasonable layout of health and WTAs. Developers need to conduct a comprehensive investigation and research on the regional natural environment and socio-economic conditions to minimize the influence of subjectivity on the identification of health and WTAs. (3) High-quality construction standards are a key link in the healthy development of health and WTAs. Local government departments should expedite the establishment and improvement of health and WTAs construction standards, formulate perfect market operation rules, and promote the group and differentiated development of regional health and WTAs to meet the health and wellness needs of different health and wellness groups. (4) The aging population, as the main target group of wellness bases, has a profound influence on the healthy development of WTAs due to their financial capability. Therefore, accelerating the establishment of a multi-level social security system, integrating medical care with older adult care, and promoting the continuous optimization of the pension system framework are essential guarantees for the stable operation of wellness bases.
This study classified and assessed the potential areas suitable for constructing wellness bases (i.e., WTAs) in Yunnan Province, based on the complex interaction between longevity levels and their influencing factors. This provides a scientific basis for the future planning of wellness bases and the healthy development of the wellness industry. However, the study also has some limitations.
On one hand, influenced by factors such as geographical location and political history, the economic development and medical standards of the case study area, Yunnan Province, did not significantly improve until the past decade. This is an important reason why this study only analyzed data from the Seventh National Population Census of 2020. However, this to some extent affected our analysis of the relationship between longevity and geographical environmental factors over a longer time scale, as well as the identification of regional wellness factors. On the other hand, in terms of selecting influencing factors, we did not extensively consider anthropogenic interference factors. How to comprehensively consider more factors, further improve the selection method of evaluation factors, seek a more reasonable way to explore influencing factors, reveal the complex driving processes of factors, perfectly integrate qualitative and quantitative analysis methods, and apply them to the identification of WTAs to more comprehensively understand the complex interactions between geographical phenomena will be the focus of our future research. In subsequent studies, appropriately increasing the evaluation of anthropogenic interference factors (such as local residents' attitudes toward hindering the development of wellness bases, the income levels of the aging population, and the accessibility of WTAs), quantifying qualitative indicators, appropriately expanding the range of influence factor indicators between groups, and considering fuzzy processing of some factor weights to reduce the subjectivity of conclusions may perhaps more effectively improve the scientificity of WTAs identification.
Building upon the clarification of the interrelationship between the clustering of longevity populations and the identification of wellness factors, this study associates the selection of wellness bases with longevity levels, proposing a novel approach that considers longevity levels as the primary basis for identifying potential areas for constructing wellness bases (i.e., WTAs). Using Yunnan Province, China, as a typical case study area, the study employs GD and GWR models to explore wellness factors and their modes of action, ultimately delineating WTAs of different types and levels. Compared to traditional methods such as QSM, AHP, and FCEM, this approach can simplify the cumbersome site selection process for WTAs, reduce the influence of researchers' subjective thinking on the results, enhance the scientific rigor of WTAs identification, and provide a more specific and measurable representation for precise site selection of wellness bases in various regions and even globally. Although our study is limited to the analysis of Yunnan Province, China, as a case study area, since we identify WTAs based on longevity phenomena, this method is also applicable to other countries and regions. This will facilitate more scientific and precise site selection for wellness bases, promote the healthy development of the wellness industry, accelerate the improvement of the wellness industry chain, and ultimately contribute to promoting population health and longevity, thereby aiding the global aging process.
The original contributions presented in the study are included in the article/supplementary material, further inquiries can be directed to the corresponding author.
YW: Conceptualization, Data curation, Formal analysis, Methodology, Software, Writing – original draft. JW: Data curation, Formal analysis, Investigation, Software, Writing – original draft. XW: Data curation, Formal analysis, Software, Writing – original draft.
The author(s) declare financial support was received for the research, authorship, and/or publication of this article. This research was funded by the special research project of Yunnan Provincial Department of Culture and Tourism titled “Research and Pilot Survey of Tourism Industry Elements in Yunnan Province” (grant number 01300206020618018) and Horizontal Project for Scientific Research Incubation (grant number 01300205020516083/028).
The authors declare that the research was conducted in the absence of any commercial or financial relationships that could be construed as a potential conflict of interest.
All claims expressed in this article are solely those of the authors and do not necessarily represent those of their affiliated organizations, or those of the publisher, the editors and the reviewers. Any product that may be evaluated in this article, or claim that may be made by its manufacturer, is not guaranteed or endorsed by the publisher.
1. Ambrosi-Randić N, Nekić M, Tucak Junaković I. Felt age, desired, and expected lifetime in the context of health, well-being, and successful aging. Int J Aging Hum Dev. (2018) 87:33–51. doi: 10.1177/0091415017720888
2. Lee C, Zhu X, Lane AP, Portegijs E. Editorial: Healthy aging and the community environment. Front Public Health. (2021) 9:737955. doi: 10.3389/fpubh.2021.737955
3. Klusmann V, Kornadt AE. Current directions in views on ageing. Eur J Ageing. (2020) 17:383–6. doi: 10.1007/s10433-020-00585-4
4. Guo W, Chai X, Zhang Z, Ma Z. Editorial: Population aging and older health in an era of digitalization: empirical findings and implications. Front Public Health. (2024) 12:1414013. doi: 10.3389/fpubh.2024.1414013
5. Li H, Tao S, Sun S, Xiao Y, Liu Y. The relationship between health literacy and health-related quality of life in Chinese older adults: a cross-sectional study. Front Public Health. (2024) 12:1288906. doi: 10.3389/fpubh.2024.1288906
6. Kong D, Sun J. Study on the countermeasures of integrating outdoor sports into the development of health service industry in China. J Healthc Eng. (2022) 2022:e1889519. doi: 10.1155/2022/1889519
7. Zhuo L, Guan X, Ye S. Quantitative evaluation and prediction analysis of the healthy and sustainable development of China's sports industry. Sustainability. (2020) 12:2184. doi: 10.3390/su12062184
8. Wang H, Gao X, Liu G, Wang F, Rosenberg MW. Environmental health, economy, and amenities interactively drive migration patterns among China's older people. Front Public Health. (2024) 12:1354071. doi: 10.3389/fpubh.2024.1354071
9. Gai L, An Y, Sun W. Research on forest health industry based on Wanghong economy—taking forest health industry of Sucun Township as an example. J Phys: Conf Ser. (2020) 1622:012057. doi: 10.1088/1742-6596/1622/1/012057
10. Li L, Chen X. Empirical research into the development mechanism of industry innovation of health and wellness tourism in the context of the sharing economy. Int J Environ Res Public Health. (2022) 19:12479. doi: 10.3390/ijerph191912479
11. Qian F, Shang Y. The impact of regional economic growth and factor input on the convergence of health tourism industry—based on the data of 31 Provinces in China. Front Environ Sci. (2022) 10:881337. doi: 10.3389/fenvs.2022.881337
12. Wang Y, Zhang Q, Huang L, Zeng F. Factors related to satisfaction with community-based home aging services in Shandong, China. Front Public Health. (2024) 12:1298669. doi: 10.3389/fpubh.2024.1298669
13. Marić Stanković A, Radonjić I, Petković M, Divnić D. Climatic elements as development factors of health tourism in South Serbia. Sustainability. (2022) 14:15757. doi: 10.3390/su142315757
14. Ho W, Ma X. The state-of-the-art integrations and applications of the analytic hierarchy process. Eur J Oper Res. (2018) 267:399–414. doi: 10.1016/j.ejor.2017.09.007
16. Li JR, Xu D. Evaluation of forest recreation tourism development potential based on AHP and fuzzy comprehensive evaluation method–taking Liaodong mountainous area as an example. China Agric Resour Zoning. (2018) 39:135–142+169. doi: 10.7621/cjarrp.1005-9121.20180818
17. Liu N, Wei YJ, Zheng YM, Shi JL. Evaluation of spatial suitability for forest wellness tourism destinations in Beijing. Adv Geosci. (2023) 42:1573–86. doi: 10.18306/dlkxjz.2023.08.010
18. Phuthong T, Anuntavoranich P, Chandrachai A, Piromsopa K. Developing and validating an assessment scale to measure the competitiveness of wellness destinations. Sustainability. (2022) 14:4152. doi: 10.3390/su14074152
19. Esfandyari H, Choobchian S, Momenpour Y, Azadi H. Sustainable rural development in Northwest Iran: proposing a wellness-based tourism pattern using a structural equation modeling approach. Humanit Soc Sci Commun. (2023) 10:1–15. doi: 10.1057/s41599-023-01943-0
20. Shao HQ, Wang ZF. Spatial distribution characteristics and influencing factors of recreation tourism resources in Xuefeng Mountain Area, Hunan. J Nat Sci Hunan Normal Univ. (2022) 45:44–54. doi: 10.7612/j.issn.2096-5281.2022.04.006
21. Zhong L, Deng B, Morrison AM, Coca-Stefaniak JA, Yang L. Medical, health and wellness tourism research—a review of the literature (1970–2020) and research agenda. Int J Environ Res Public Health. (2021) 18:10875. doi: 10.3390/ijerph182010875
22. Ullah N, Zada S, Siddique MA, Hu Y, Han H, Vega-Muñoz A, et al. Driving factors of the health and wellness tourism industry: a sharing economy perspective evidence from KPK Pakistan. Sustainability. (2021) 13:13344. doi: 10.3390/su132313344
23. Kazakov S, Oyner O. Wellness tourism: a perspective article. Tour Rev. (2020) 76:58–63. doi: 10.1108/TR-05-2019-0154
24. Crimmins EM, Hayward MD, Hagedorn A, Saito Y, Brouard N. Change in disability-free life expectancy for Americans 70 years old and older. Demography. (2009) 46:627–46. doi: 10.1353/dem.0.0070
25. Aliberti SM, De Caro F, Funk RHW, Schiavo L, Gonnella J, Boccia G, et al. Extreme longevity: analysis of the direct or indirect influence of environmental factors on old, nonagenarians, and centenarians in Cilento, Italy. Int J Environ Res Public Health. (2022) 19:1589. doi: 10.3390/ijerph19031589
26. Vázquez-Palacios FR, Tovar-Cabañas R. Natural and cultural longevity zones from an anthropological and geographical viewpoint. Popul Ageing. (2022) 15:707–23. doi: 10.1007/s12062-022-09370-w
27. Du Y, Luo K, Hussain R. Comparative study of physico-chemical parameters of drinking water from some longevity and non-longevity areas of China. J Water Health. (2017) 15:462–73. doi: 10.2166/wh.2017.183
28. Huang Y, Rosenberg M, Hou L, Hu M. Relationships among environment, climate, and longevity in China. Int J Environ Res Public Health. (2017) 14:1195. doi: 10.3390/ijerph14101195
29. Yu J, Zhou J, Long A, He X, Deng X, Chen Y, et al. Comparative study of water quality and human health risk assessment in longevity area and adjacent non-longevity area. Int J Environ Res Public Health. (2019) 16:3737. doi: 10.3390/ijerph16193737
30. Deng Q, Wei Y, Zhao Y, Han X, Yin J. Understanding the natural and socioeconomic factors behind regional longevity in Guangxi, China: is the centenarian ratio a good enough indicator for assessing the longevity phenomenon? Int J Environ Res Public Health. (2018) 15:938. doi: 10.3390/ijerph15050938
31. Wu Y, Tang Z, Xiong S. A unified geographically weighted regression model. Spat Stat. (2023) 55:100753. doi: 10.1016/j.spasta.2023.100753
32. Liang Y, Xu C. Knowledge diffusion of Geodetector: a perspective of the literature review and Geotree. Heliyon. (2023) 9:e19651. doi: 10.1016/j.heliyon.2023.e19651
33. Wang WY, Li YH, Li HR, Yu JP, Xiao ZY. Environmental mechanisms of regional longevity in China. Sci Decis. (2015) 01:1–12. doi: 10.3773/j.issn.1006-4885.2015.01.001
34. Huang L, Xu H. Therapeutic landscapes and longevity: wellness tourism in Bama. Soc Sci Med. (2018) 197:24–32. doi: 10.1016/j.socscimed.2017.11.052
35. Phuthong T, Anuntavoranich P, Chandrachai A, Piromsopa K. Wellness tourism destination assessment model: a development indicator in an emerging economy-Thailand. In: 2021 IEEE International Conference on Industrial Engineering and Engineering Management (IEEM). Singapore: IEEE (2021), p. 1040–6. doi: 10.1109/IEEM50564.2021.9672602
36. Romão J, Machino K, Nijkamp P. Integrative diversification of wellness tourism services in rural areas – an operational framework model applied to east Hokkaido (Japan). Asia Pac J Tour Res. (2018) 23:734–46. doi: 10.1080/10941665.2018.1488752
37. Medina-Muñoz DR, Medina-Muñoz RD. Critical issues in health and wellness tourism: an exploratory study of visitors to wellness centres on Gran Canaria. Curr Issues Tour. (2013) 16:415–35. doi: 10.1080/13683500.2012.748719
38. Chen K-H, Huang L, Ye Y. Research on the relationship between wellness tourism experiencescape and revisit intention: a chain mediation model. Int J Contemp Hosp Manag. (2022) 35:893–918. doi: 10.1108/IJCHM-01-2022-0050
39. Dillette AK, Douglas AC, Andrzejewski C. Dimensions of holistic wellness as a result of international wellness tourism experiences. Curr Issues Tour. (2021) 24:794–810. doi: 10.1080/13683500.2020.1746247
40. Dini M, Pencarelli T. Wellness tourism and the components of its offer system: a holistic perspective. Tour Rev. (2021) 77:394–412. doi: 10.1108/TR-08-2020-0373
41. Mangwane J, Ntanjana A. Wellness tourism in South Africa: development opportunities. In:Rocha Á, Abreu A, de Carvalho JV, Liberato D, González EA, Liberato P, , editors. Advances in Tourism, Technology and Smart Systems. Singapore: Springer (2020), p. 581–92. doi: 10.1007/978-981-15-2024-2_50
42. Xu H, Pan W, Xin M, Pan W, Hu C, Wanqiang D, et al. Study of the economic, environmental, and social factors affecting Chinese residents' health based on machine learning. Front Public Health. (2022) 10:896635. doi: 10.3389/fpubh.2022.896635
43. Andrews GJ, Moon G. Space, place, and the evidence base: part I—an introduction to health geography. Worldviews Evid-Based Nurs. (2005) 2:55–62. doi: 10.1111/j.1741-6787.2005.05004.x
44. Song Y, Shao M. Impacts of complex terrain features on local wind field and PM25 concentration. Atmosphere. (2023) 14:761. doi: 10.3390/atmos14050761
45. Wen Y, Xiao J, Yang J, Cai S, Liang M, Zhou P. Quantitatively disentangling the geographical impacts of topography on PM25 pollution in China. Remote Sens. (2022) 14:6309. doi: 10.3390/rs14246309
46. Li K, Liu J, Zhu Y. Knowledge, attitude, and practice of atrial fibrillation in high altitude areas. Front Public Health. (2024) 12:1322366. doi: 10.3389/fpubh.2024.1322366
47. Coker ES, Stone SL, McTigue E, Yao JA, Brigham EP, Schwandt M, et al. Climate change and health: rethinking public health messaging for wildfire smoke and extreme heat co-exposures. Front Public Health. (2024) 12:1324662. doi: 10.3389/fpubh.2024.1324662
48. Dean A, Green D. Climate change, air pollution and human health in Sydney, Australia: a review of the literature. Environ Res Lett. (2018) 13:053003. doi: 10.1088/1748-9326/aac02a
49. Wen L, Pan W, Liao S, Pan W, Xu H, Hu C, et al. combination-based machine learning algorithm estimating impacts of social, economic, and environmental on resident health—on China's provincial panel data. Eng Appl Artif Intell. (2023) 123:106135. doi: 10.1016/j.engappai.2023.106135
50. Yang J, Mao L. Understanding temporal change of spatial accessibility to healthcare: an analytic framework for local factor impacts. Health Place. (2018) 51:118–24. doi: 10.1016/j.healthplace.2018.03.005
51. Balasubramanian M, Shafei A, Liang Z. Innovations in older adult care and health service management: a focus on China. Front Public Health. (2024) 12:1404227. doi: 10.3389/fpubh.2024.1404227
52. Xu Q, Gu J, Jia C, Chen H, Li Z, Gu H. A study on the impact of health shocks on subjective wellbeing of middle-aged people and older adults—evidence from China. Front Public Health. (2024) 11:1238026. doi: 10.3389/fpubh.2023.1238026
53. Zhou J, Gao X, Wei Y, Chen C, Wang J, Zhang Z, et al. Population attributable fractions for modifiable factors of longevity and healthy longevity among the late-elderly aged 75 years or older — China, 1998–2018. CCDCW. (2023) 5:25–30. doi: 10.46234/ccdcw2023.005
54. Bornmann L, de Moya Angeon F. Hot and cold spots in the US research: a spatial analysis of bibliometric data on the institutional level. J Inf Sci. (2019) 45:84–91. doi: 10.1177/0165551518782829
55. Song Y, Wang J, Ge Y, Xu C. An optimal parameters-based geographical detector model enhances geographic characteristics of explanatory variables for spatial heterogeneity analysis: cases with different types of spatial data. GISci Remote Sens. (2020) 57:593–610. doi: 10.1080/15481603.2020.1760434
56. Wang ZS, Guo M, Tan YF, Hu JG, Wu XF. Suggestions on the future development of air quality standards in China. Environ Prot. (2023) 51:33–40. doi: 10.14026/j.cnki.0253-9705.2023.15.010
57. Csirmaz É, Peto K. International trends in recreational and wellness Tourism. Procedia Econ Financ. (2015) 32:755–62. doi: 10.1016/S2212-5671(15)01458-6
58. Qin C, Wang X. Does the increase in health insurance benefits have different effects on the health of middle-aged and older people individuals in rural areas? Analysis based on quantile difference-in-differences method. Front Public Health. (2024) 12:1322790. doi: 10.3389/fpubh.2024.1322790
59. Ahmad SA, Tan PM, Singh DKA, Ibrahim R, Teh P-L, Hamid TA. Editorial: Aging research and practices in Malaysia. Front Public Health. (2022) 10:48822. doi: 10.3389/fpubh.2022.948822
Keywords: longevity population, influencing factor, wellness target area, wellness base, Yunnan Province
Citation: Wang Y, Wang J and Wang X (2024) A longevity level-oriented wellness target area identification method: a case study of Yunnan Province, China. Front. Public Health 12:1387850. doi: 10.3389/fpubh.2024.1387850
Received: 18 February 2024; Accepted: 29 May 2024;
Published: 12 June 2024.
Edited by:
Yunhwan Lee, Ajou University, Republic of KoreaReviewed by:
Tatjana Fischer, University of Natural Resources and Life Sciences Vienna, AustriaCopyright © 2024 Wang, Wang and Wang. This is an open-access article distributed under the terms of the Creative Commons Attribution License (CC BY). The use, distribution or reproduction in other forums is permitted, provided the original author(s) and the copyright owner(s) are credited and that the original publication in this journal is cited, in accordance with accepted academic practice. No use, distribution or reproduction is permitted which does not comply with these terms.
*Correspondence: Jiaxue Wang, d2p4eW5zZEAxNjMuY29t
Disclaimer: All claims expressed in this article are solely those of the authors and do not necessarily represent those of their affiliated organizations, or those of the publisher, the editors and the reviewers. Any product that may be evaluated in this article or claim that may be made by its manufacturer is not guaranteed or endorsed by the publisher.
Research integrity at Frontiers
Learn more about the work of our research integrity team to safeguard the quality of each article we publish.