- 1Department of Public Health, Adama Hospital Medical College, Adama, Ethiopia
- 2Department of Nursing and Midwifery, College of Health Science, Arsi University, Asella, Ethiopia
- 3Department of Public Health, School of Public Health, College of Medicine and Health Science, Debre Berhan University, Debre Berhan, Ethiopia
Objective: This study aimed to estimate the time to viral load suppression and identify its predictors among HIV patients receiving antiretroviral therapy (ART) in the Gebi Resu zone, Afar Region, Ethiopia, 2023.
Setting: The study was conducted at public health facilities in the Gebi Resu zone of the Afar region.
Study design: This study is a facility-based, retrospective follow-up study.
Study participants: This study included 298 people living with HIV who were receiving ART services at selected health facilities in the Gebi Resu zone. Data were collected by reviewing patient records using a structured checklist. Bivariate and multivariate Cox regression analyses were conducted to assess the relationship between variables and control for confounders.
Results: The incidence rate of viral load suppression was 9.46 per 100 person-months. The median time to viral load suppression was 7.7 months, with an interquartile range of 3.8 months (IQR = 6.47–10.27). Patients at clinical stages 3 and 4 [AHR = 0.67, 95%CI (0.47, 0.96)], those who received cotrimoxazole prophylaxis therapy [AHR = 1.47, 95%CI (1.12, 1.92)], and patients with poor drug adherence [AHR = 0.40, 95%CI (0.18, 0.90)] were significantly associated with time to viral load suppression among people on antiretroviral therapy.
Conclusion: The time to viral load suppression and the median time to viral load suppression among people living with HIV on ART were shorter than those observed in many developing and developed countries. Clinical stage, cotrimoxazole prophylaxis therapy, and drug adherence were significant predictors of viral load suppression.
Introduction
Antiretroviral therapy (ART) for HIV infection aims to achieve and maintain viral load suppression. This can, in turn, prevent further immune system damage, reduce acquired immune deficiency syndrome (AIDS)-associated morbidity and mortality, restore immune function, and lower the risk of HIV transmission to uninfected individuals. Together, these effects contribute to reducing the overall incidence of HIV (1–4). In Ethiopia, ART became available free of charge in 2005, and antiretroviral treatment was first introduced in 2003 (5). Monitoring the response to ART is critical for determining treatment outcomes in people living with HIV (PLWH). Treatment outcomes are assessed using immunological markers (CD4 T-cell count), World Health Organization (WHO) clinical staging, and routine viral load suppression monitoring. Among these methods, viral load suppression monitoring is considered to be more accurate, timely, and reliable for detecting treatment failure compared to clinical monitoring or CD4 count (immunologic monitoring) (6).
According to WHO guidelines, viral load monitoring should be conducted annually for stable individuals and every 6 and 12 months after beginning ART (7, 8). Viral load suppression is defined by the WHO as the reduction of the virus’s ability to replicate to less than 1,000 copies/ml of plasma after a sufficient duration of ART (9).
The international community has established a global goal to ensure that 95% of all patients undergoing antiretroviral therapy achieve viral suppression by 2025. However, as of 2020, only 66% of the approximately 26 million PLWH on ART had achieved viral load suppression. In 2021, this figure increased to 68% of the 28.7 million PLWH worldwide. Similarly, in Ethiopia, only 72% of HIV-positive patients on ART achieved viral suppression (10, 11).
Multiple factors can lead to an unsuppressed viral load, including patients’ sociodemographic characteristics, treatment adherence, ART regimens, and other clinical factors (4, 12–14).
After a patient has been on ART for at least 6 months, an elevated or unsuppressed viral load could indicate poor adherence to treatment or therapeutic failure due to antiretroviral resistance (7, 15). The probability of CD4 T-cell destruction, the rate at which AIDS advances, and the ease of virus transmission all increase with the number of viral particles in the blood (16). In Ethiopia, among people starting highly active antiretroviral medication, an unsuppressed viral load was found to be a significant predictor of mortality (17). Additionally, studies have shown that 91.5% of new HIV infections were caused by PLWH who were either undiagnosed or did not receive medical attention, that is, those who did not achieve viral load suppression (18).
Despite its importance, only a few studies were conducted in Ethiopia to estimate the time to viral load suppression and its predictors (12, 14, 19, 20), and the time for viral load suppression ranged from a minimum of 3 months in Arba Minch to a maximum of 9 months in Hossana (12, 19).
Given the wide range of findings, conducting a study to assess the median time to viral load suppression in the study area is crucial for improving patient quality of life.
In addition, to the best of our knowledge, very little research has been conducted in the current study region, and there are no data regarding the time to viral load suppression and its predictors for the Afar region, which has been identified as having significantly high clusters of PLWH (21). Therefore, this study was designed to estimate the time to viral load suppression and its predictor in the Gebi Resu zone.
Methods and materials
Study design, setting, and population
The facility-based retrospective follow-up study was conducted in ART clinics of public health facilities in Gebi Resu (Zone 3), Afar National Regional State, Ethiopia.
The zone has 11 health centers and 1 general hospital, but only 8 health centers and 1 hospital offer ART services. The study was conducted among PLWH receiving ART services at selected health facilities in the Gebi Resu zone from 11 September 2017 to 10 September 2022. All PLWH who initiated ART for the first time during this period were eligible for inclusion. Since at least two consecutive measurements are required to declare viral load suppression, individuals with less than two consecutive viral load measurements were excluded from the study.
Sample size, sampling procedure, and measurement
The sample size was calculated using the formulas designed for survival analysis through STATA statistical software, the log-rank test, and the Cox proportional hazard model. The following assumptions were taken into consideration: confidence level = 95%, power = 90%, sample size allocation ratio = 1:1, the hazard ratio of patient’s baseline CD4 level of less than 200 compared to their counterpart 0.683, the hazard ratio of good ART adherence level 2.648, and 1.85 of hazard ratio among patients having opportunistic infection taken from the study conducted in Arba Minch (12) and West Gojam zone (14). Finally, a sample of 298 PLWH was determined after comparing the calculated sample sizes.
Based on the difference in the level of care, we stratified them into hospitals and health centers from a total of nine public health facilities providing ART service in the Gebi Resu zone of the Afar regional state. Only one hospital (Mohammed Akle Referral Hospital) in the zone provided ART service. In addition, three health centers were selected from the seven listed health centers by employing a simple random sampling method. Then, according to the inclusion criteria, eligible PLWH who started ART from 11 September 2017 to 10 September 2022, were identified from the registration book of each selected ART clinic. Finally, study units and selected PLWH receiving ART were randomly selected and allocated proportionally to each selected health facility.
Operational definition
Viral suppression refers to a viral load less than or equal to 1,000 copies/mL.
The adherence level is classified as good if average adherence is >95% or the patient misses ≤2 from 30 doses and < 3 from 60 doses, fair if the average adherence is 85–94% or the patient misses 3–5 from 30 doses and 3–9 from 60 doses, and poor if the average adherence is <85% or the patient misses ≥6 from 30 doses and > 9 from 60 doses.
Body Mass Index (BMI) is categorized as follows: underweight <18.5 kg/m2, normal weight 18.5–24.99 kg/m2, overweight 25–29.99 kg/m2, and obesity > = 30 kg/m2.
Data collection procedure and quality assurance
The data for the study were collected by four data collectors who were working on ART service provision, and the collection process was supervised by four trained clinical officers. Data were collected using a structured data abstraction checklist that included sociodemographic variables, clinical factors, and treatment-related variables. The data abstraction format was prepared in the English language. The data were collected through a review of patient medical records, electronic ART databases, and other related registration books (ART registration book, viral load registration book, and HIV-positive tracking registration book) at the selected facilities.
The study’s objectives, purposes, questionnaire, data collection procedures, roles in the evaluation, best practices for high-quality data, confidentiality, and supervision techniques were all covered in a 2-day training session for all data collectors (ART providers) and supervisors (clinical officers). Additionally, the data-gathering tool was pre-tested, and supervisors monitored and verified the data collection procedures. Before processing, the gathered data were stored in a secure location and verified every day for accuracy. After the data were collected, each questionnaire was coded separately.
Patient and public involvement
Patients were not involved in this study.
Data analysis
The collected data were coded and entered into Epi-Info version 7.2. These data were then exported to STATA version 16 for processing and analysis. Descriptive statistics such as frequency distribution, percentage, median, and interquartile range were calculated to summarize the characteristics of the study participants. The results of the variables were displayed using frequency tables and graphs. Kaplan–Meier survival curves were used to compare the event times between two or more groups. Observed survival differences were assessed using log-rank tests, with a significance level set at 5%.
Cox proportional-hazard regression was used to identify the predictors of time to viral load suppression among PLWH on ART. The event of interest under this particular objective was viral load suppression after enrolling in ART. The proportional hazard assumption was checked statistically using the global goodness-of-fit test proposed by Schoenfeld. The proportional hazard assumption was fulfilled with a global test value of 0.5661. The assumption was also checked for each predictor with minimum and maximum p-values of 0.2350 and 0.9753, respectively. The goodness of fit was checked using the Cox-Snell residual test.
Predictors with p-value of less than 0.25 in the bivariate Cox regression analysis were selected as candidates for multiple regression analysis. All predictors were then included in the multiple regression model to identify those independently associated with the outcomes of interest, adjusting for potential confounding variables. Variables with a p-value of less than 0.05 were considered as significantly associated with the dependent variable. The strength of the association between dependent and independent variables was expressed as a hazard ratio with a 95% confidence interval.
Results
Sociodemographic characteristics of patients
A total of 812 PLWH received ART at public health facilities in the Gebi Resu zone during the data collection period. Of these, 298 participants who fulfilled the inclusion criteria were randomly selected (Figure 1). From a total of 298 PLWH on ART, 204 participants (68.5%) were male individuals, 136 (45.6%) of them were married, 107 participants (35.9%) had no formal education, 205 participants (68.8%) resided in urban areas, 151 participants (50.7%) were Orthodox Christians, 88 participants (29.4%) were private employees, 39 participants (13.1%) were government employees, 27 participants (9.1%) were merchants, and 11 participants (3.7%) were pastoralists. (Table 1).
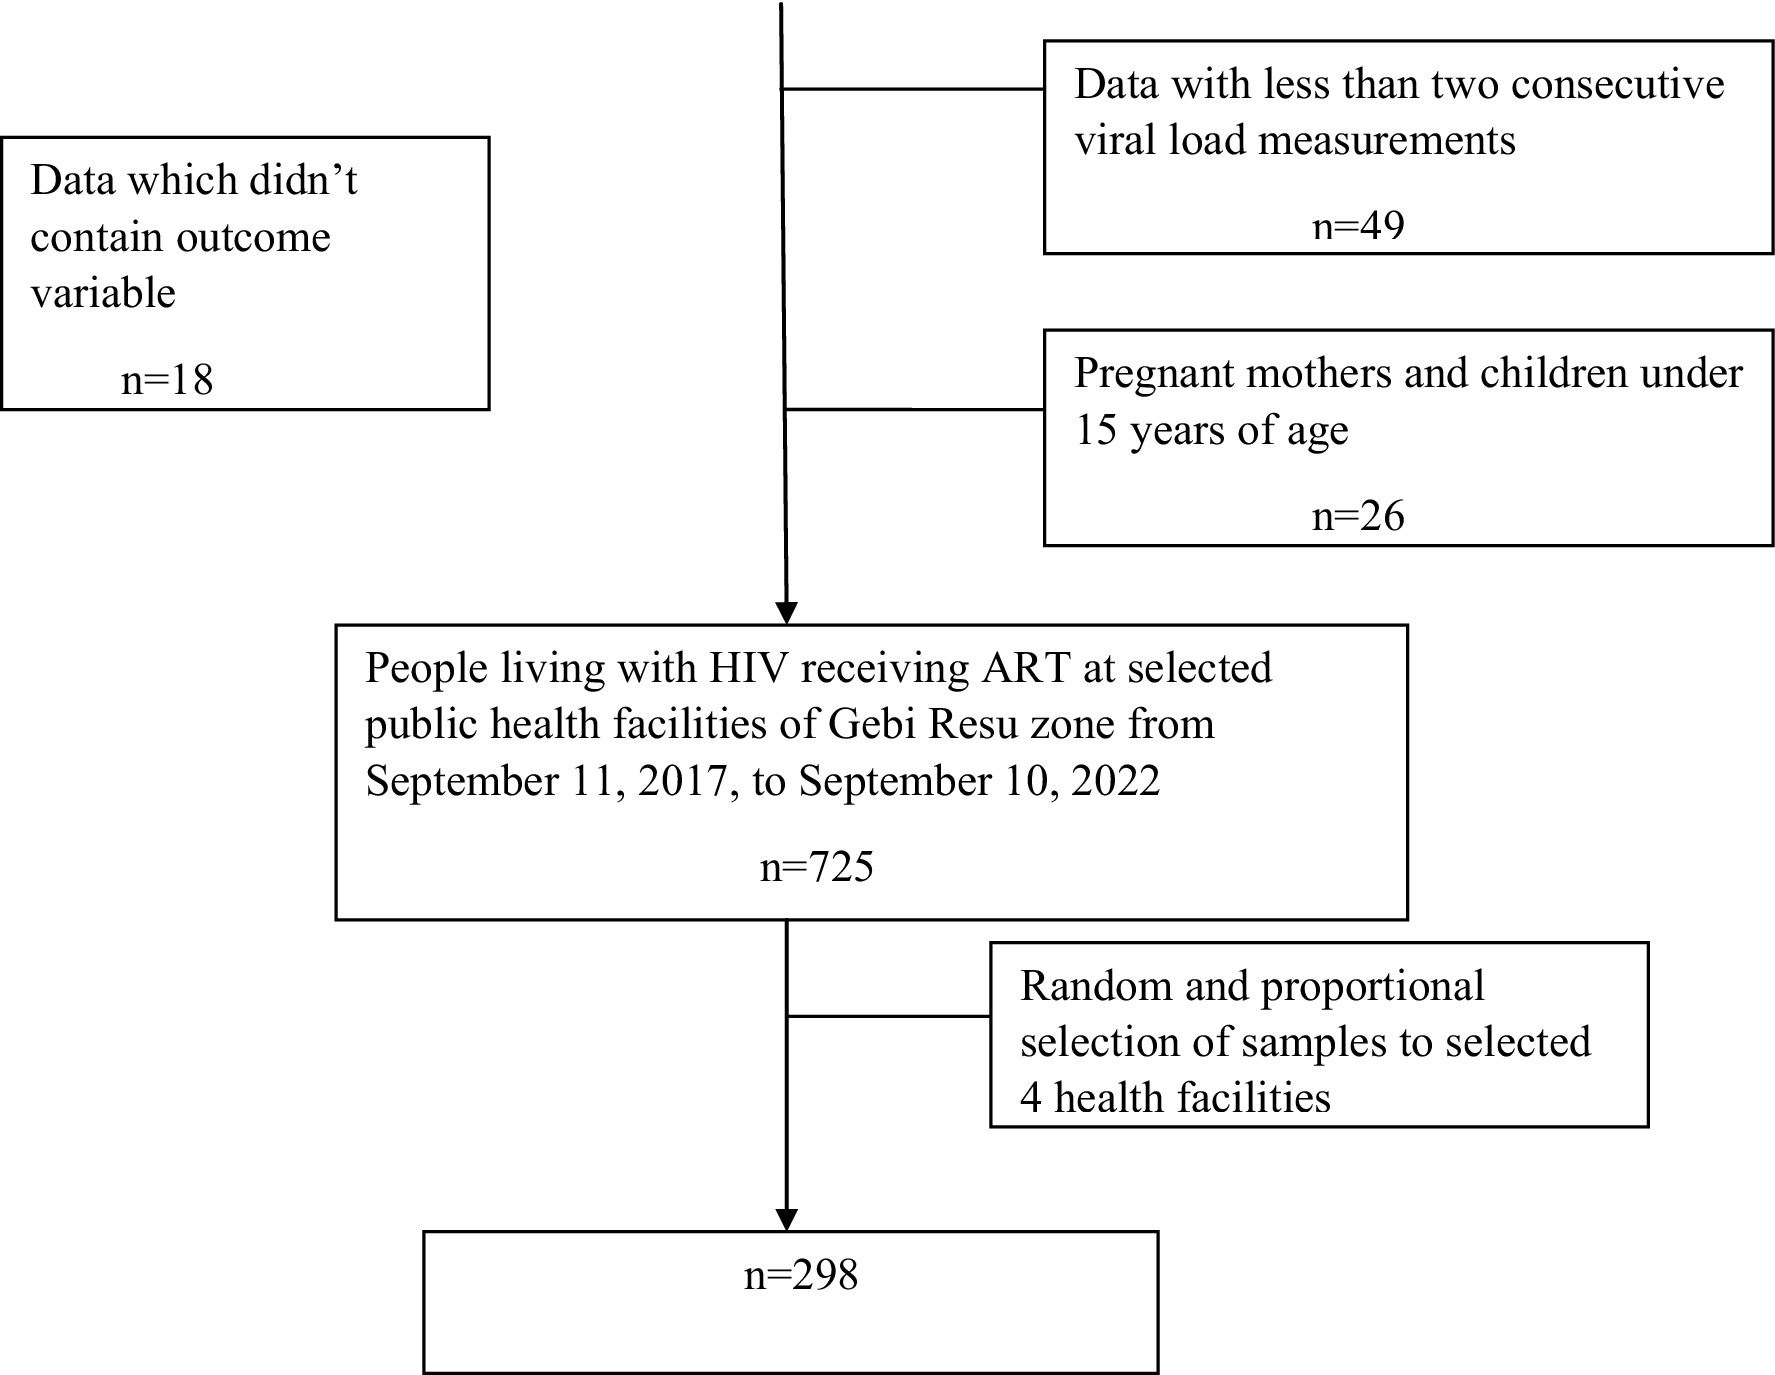
Figure 1. Flow diagram of patient selection to determine the time to viral load suppression and its predictors among PLWH on ART in Gebi Resu zone, Afar region, Ethiopia 2023.
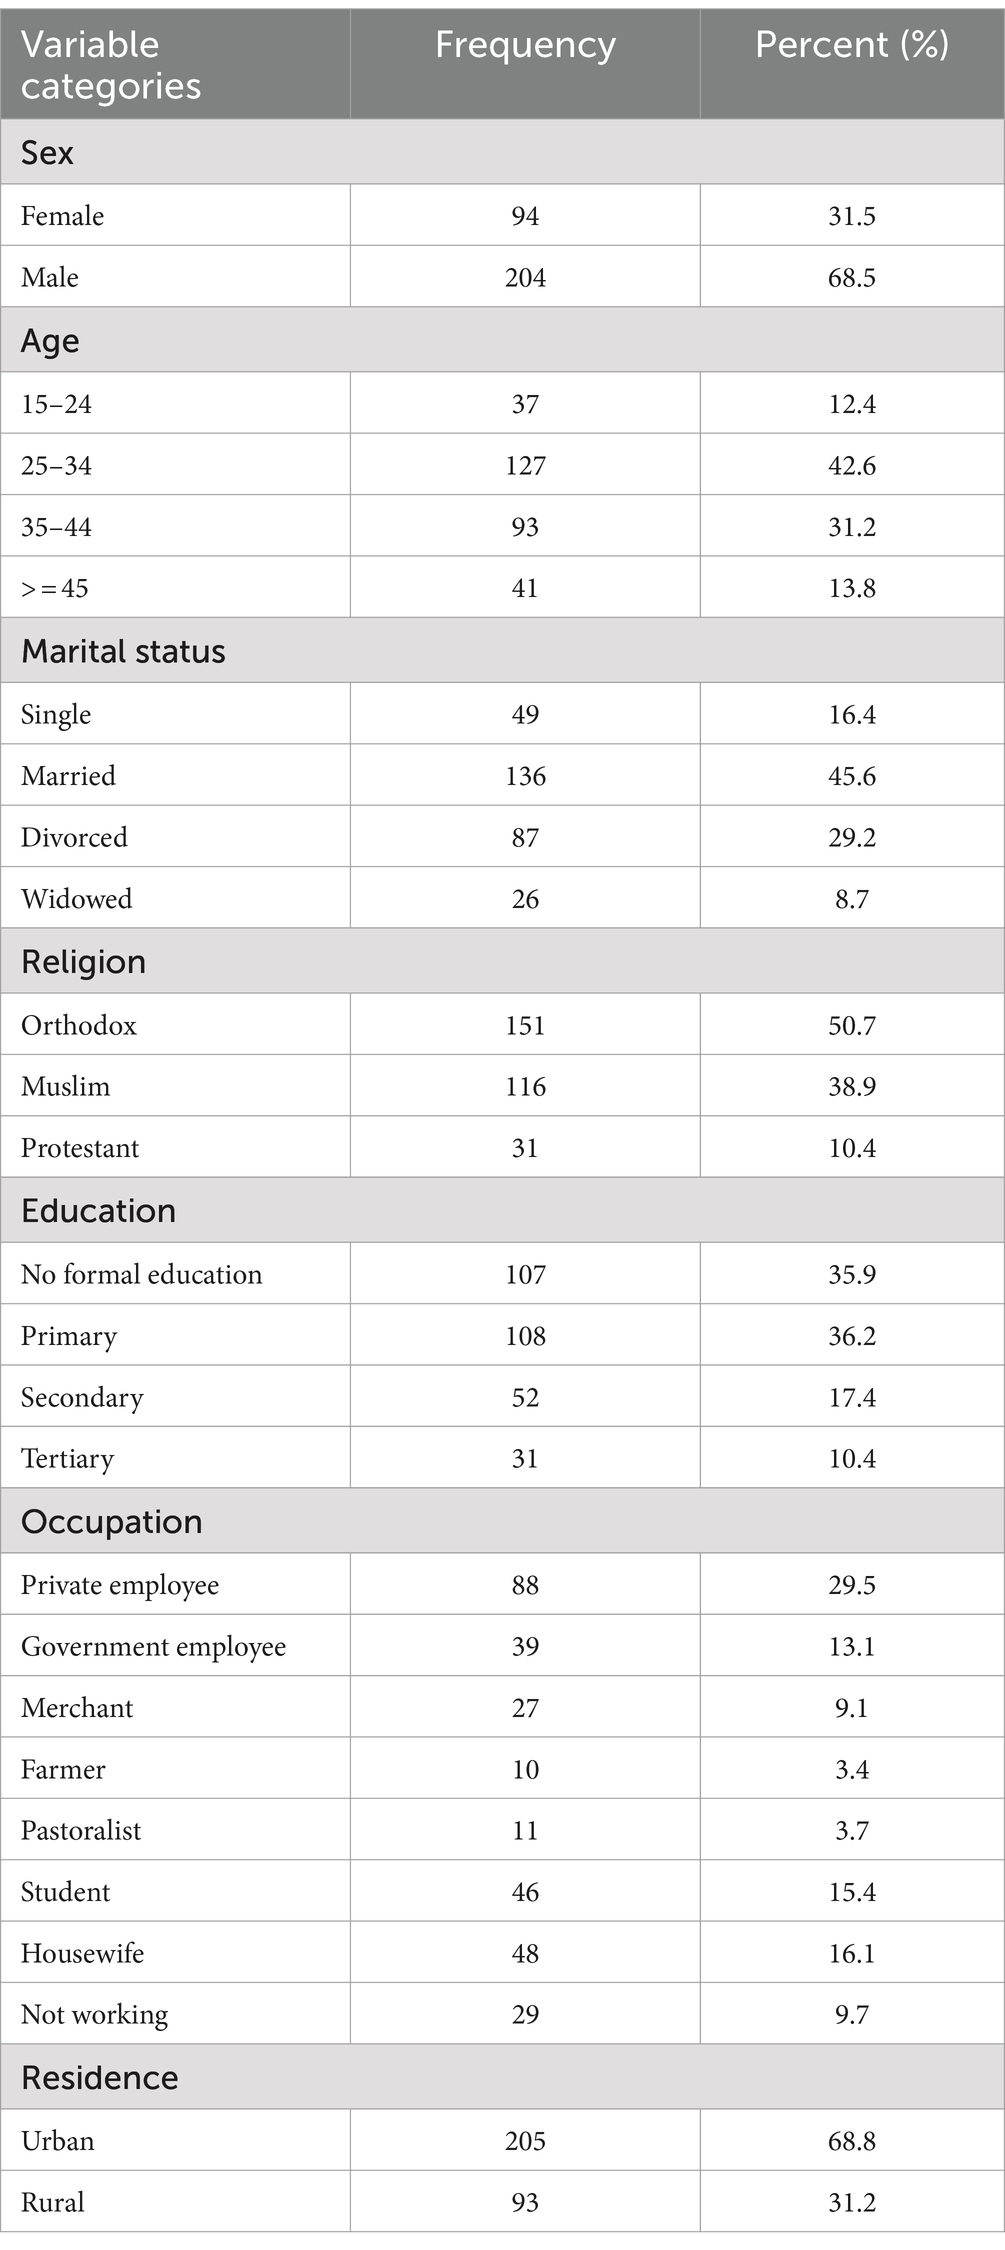
Table 1. Sociodemographic characteristics of PLWH on ART in Gebi Resu zone, Afar Region, Ethiopia, 2023.
Treatment-related characteristics of patients
Of the 298 study participants, 109 participants (36.6%) were on a baseline ART regimen of ABC/3TC/NVP or EFV, 254 participants (85.2%) demonstrated good medication adherence, 162 participants (54.4%) received cotrimoxazole prophylaxis therapy (CPT), 195 participants (65.4%) received isoniazid preventive therapy (IPT), and 216 participants (72.5%) disclosed their HIV status to family and friends (Table 2).
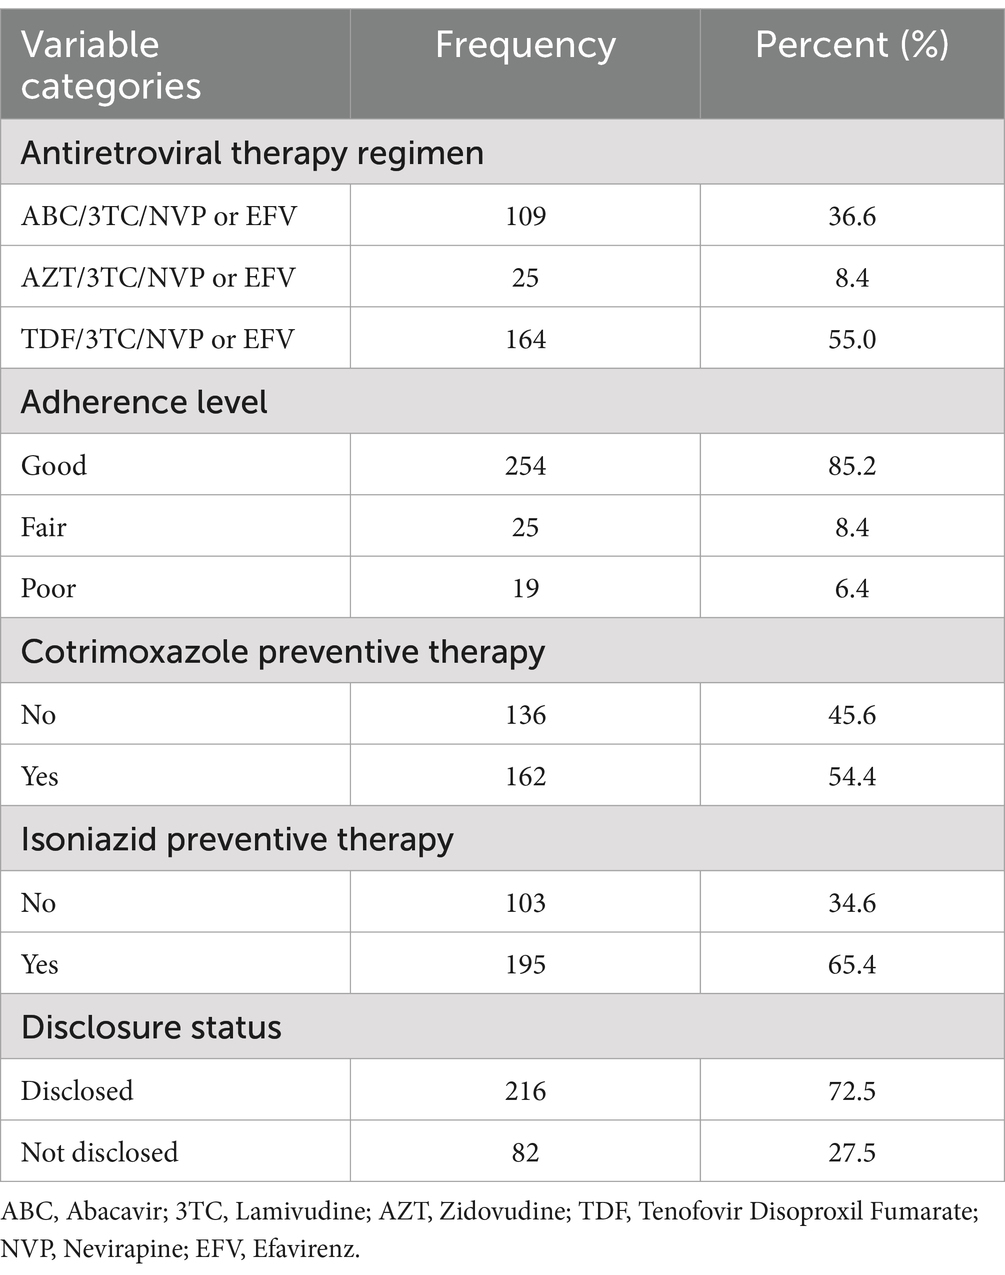
Table 2. Treatment-related characteristics of PLWH on ART in Gebi Resu zone, Afar Region, Ethiopia, 2023.
Clinical characteristics of patients
Of the 298,298 study participants, 208 participants (69.8%) were at WHO clinical stages 1 and 2, 98 participants (32.9%) had previously developed an opportunistic infection, 78 participants (26.2%) had a tuberculosis co-infection, and 213 participants (71.55%) had a baseline CD4 count of greater than or equal to 200 cells/mm.3 Additionally, 275 participants (92.3%) had a baseline viral load of less than 1,000 copies/ml, and 208 participants (69.8%) had a baseline body mass index (BMI) greater than 18.5 kg/m2 (Table 3).
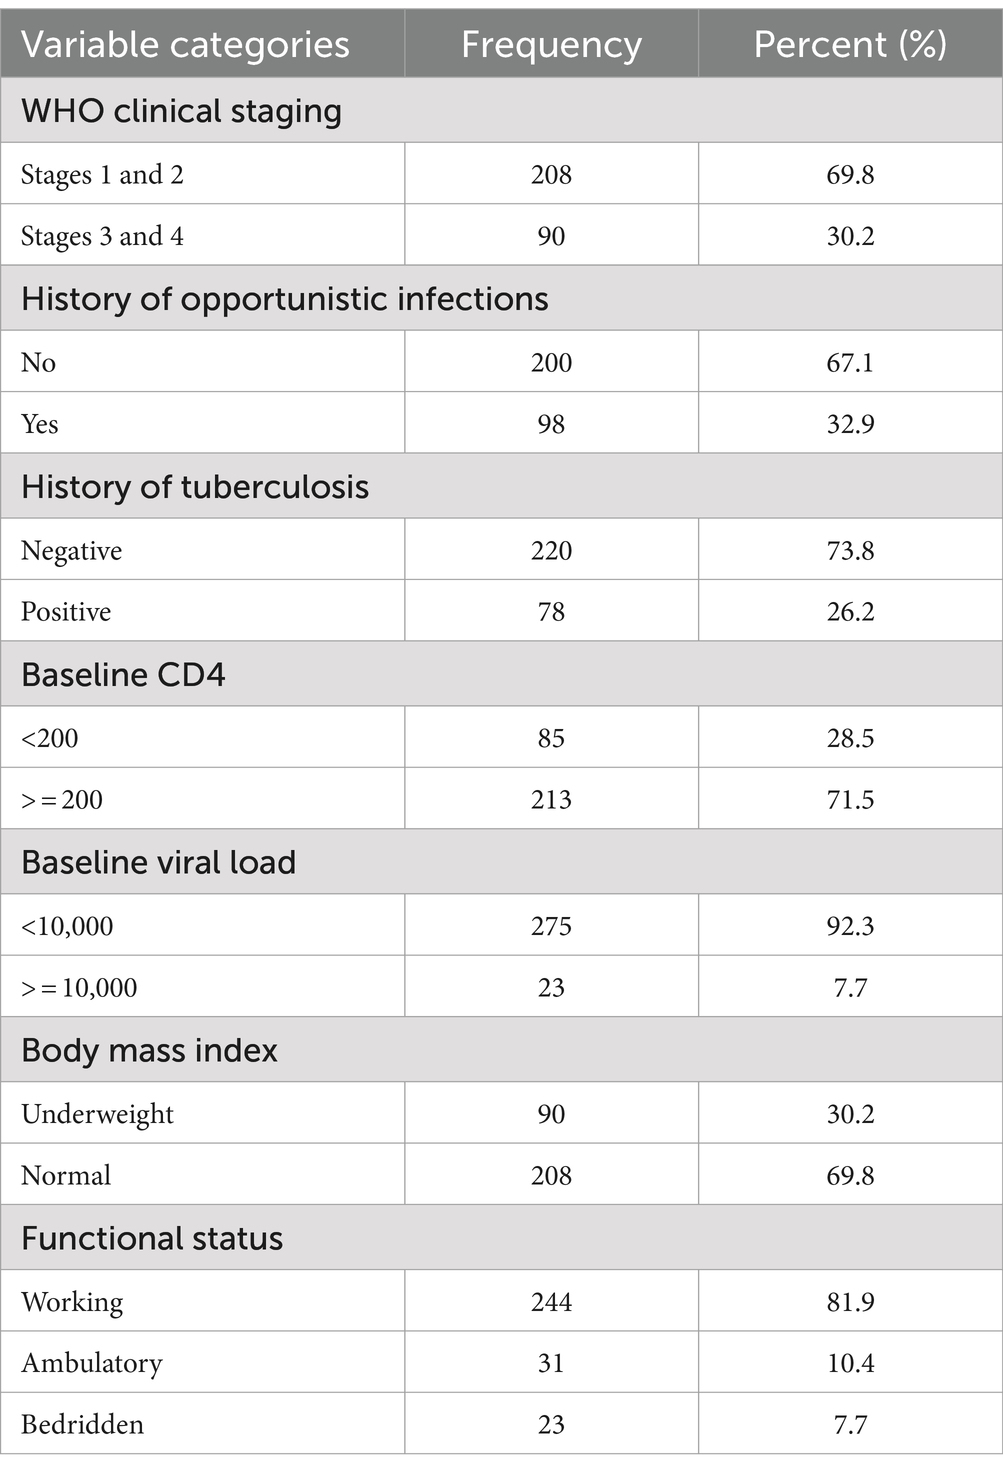
Table 3. Clinical-related characteristics of PLWH on ART in Gebi Resu zone, Afar Region, Ethiopia, 2023.
Time to viral load suppression and incidence among PLWH on ART
The incidence proportions of people who have achieved first viral load suppression were 83.89% (95% CI (79.25, 87.66)). The total observation time for the 298 patients was 2,644 person-months, and the viral load suppression incidence rate was 9.46 per 100 person-months. The median time to viral load suppression was 7.7 months with an interquartile range of 3.8 months (Q1 = 6.47 and Q3 = 10.27).
The Kaplan–Meier survival function graph presents the overall time to viral load suppression, with a median survival time of approximately 8 months, indicating that 50% of PLWH achieve viral load suppression approximately 8 months after initiating ART (Figure 2).
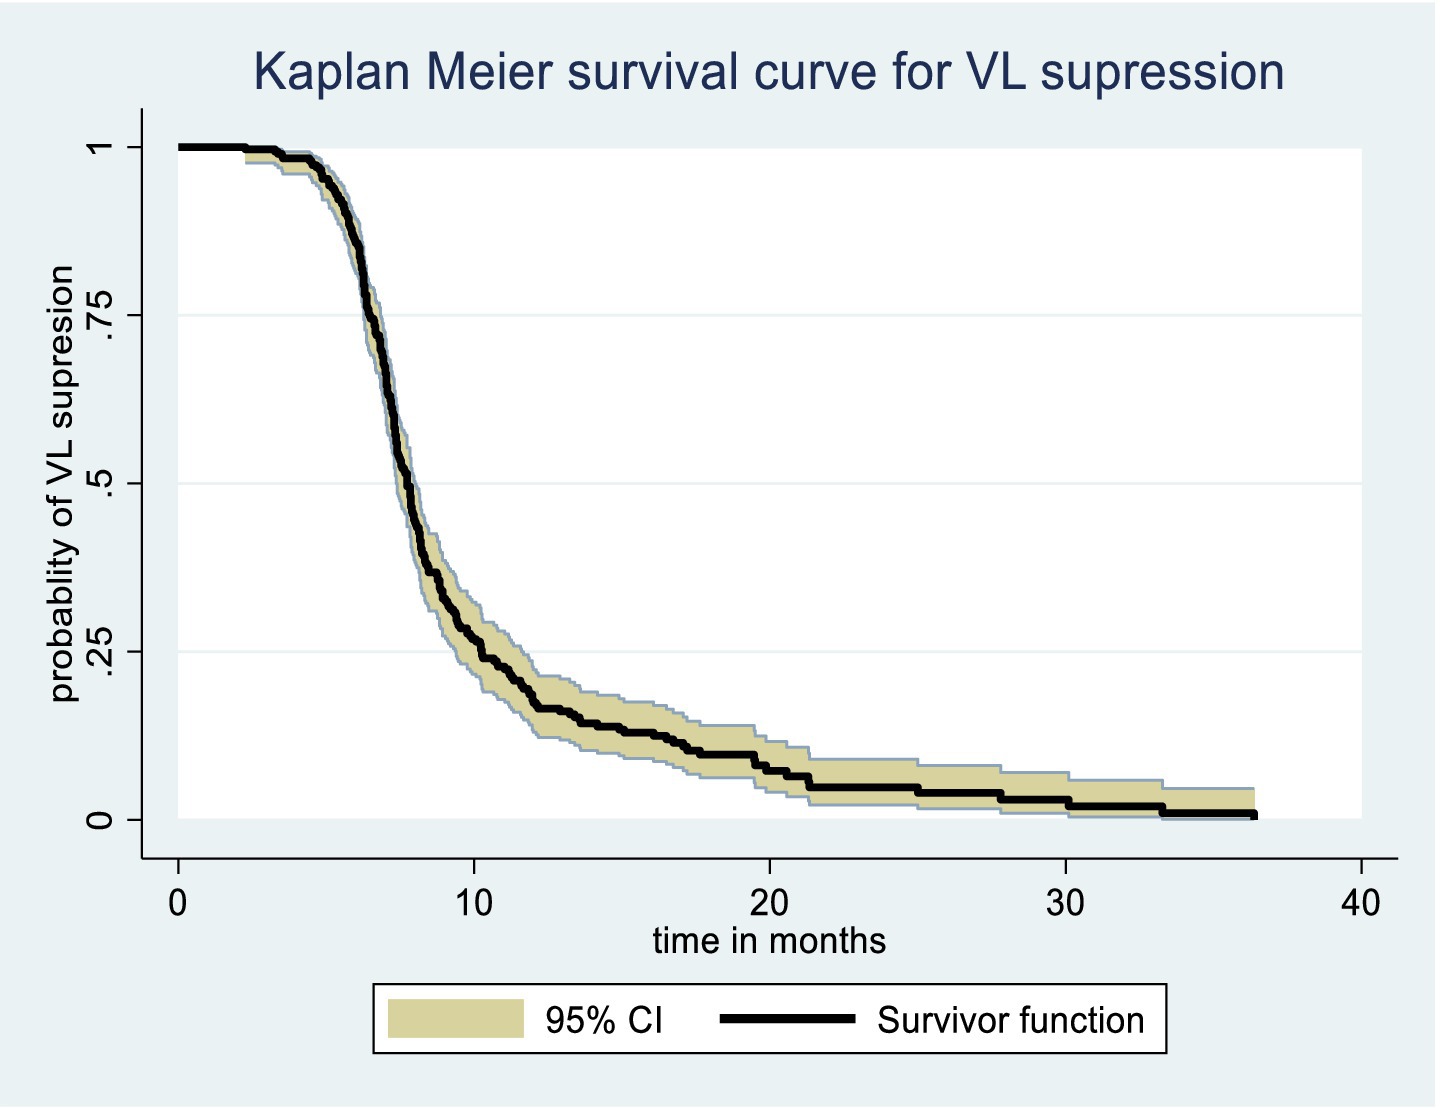
Figure 2. Overall Kaplan Meier survival curve of time to viral load suppression among PLWH on ART in Gebi Resu zone, Afar Region, Ethiopia, 2023.
The Kaplan–Meier survival estimate and log-rank test were used to compare the probability of time to viral load suppression across different variable groups. Significant differences in time to viral load suppression were observed between the categories of WHO clinical stage, CPT use, baseline CD4 count, and drug adherence groups (Figures 3–6).

Figure 3. Kaplan Meier survival curve by WHO clinical stage among PLWH on ART in Gebi Resu zone, Afar Region, Ethiopia, 2023. Log-rank test p-value = 0.0001.

Figure 4. Kaplan Meier survival curve by Cotrimoxazole Prophylaxis Therapy among PLWH on ART in Gebi Resu zone, Afar Region, Ethiopia, 2023. Log-rank test with a p-value of 0.0008.
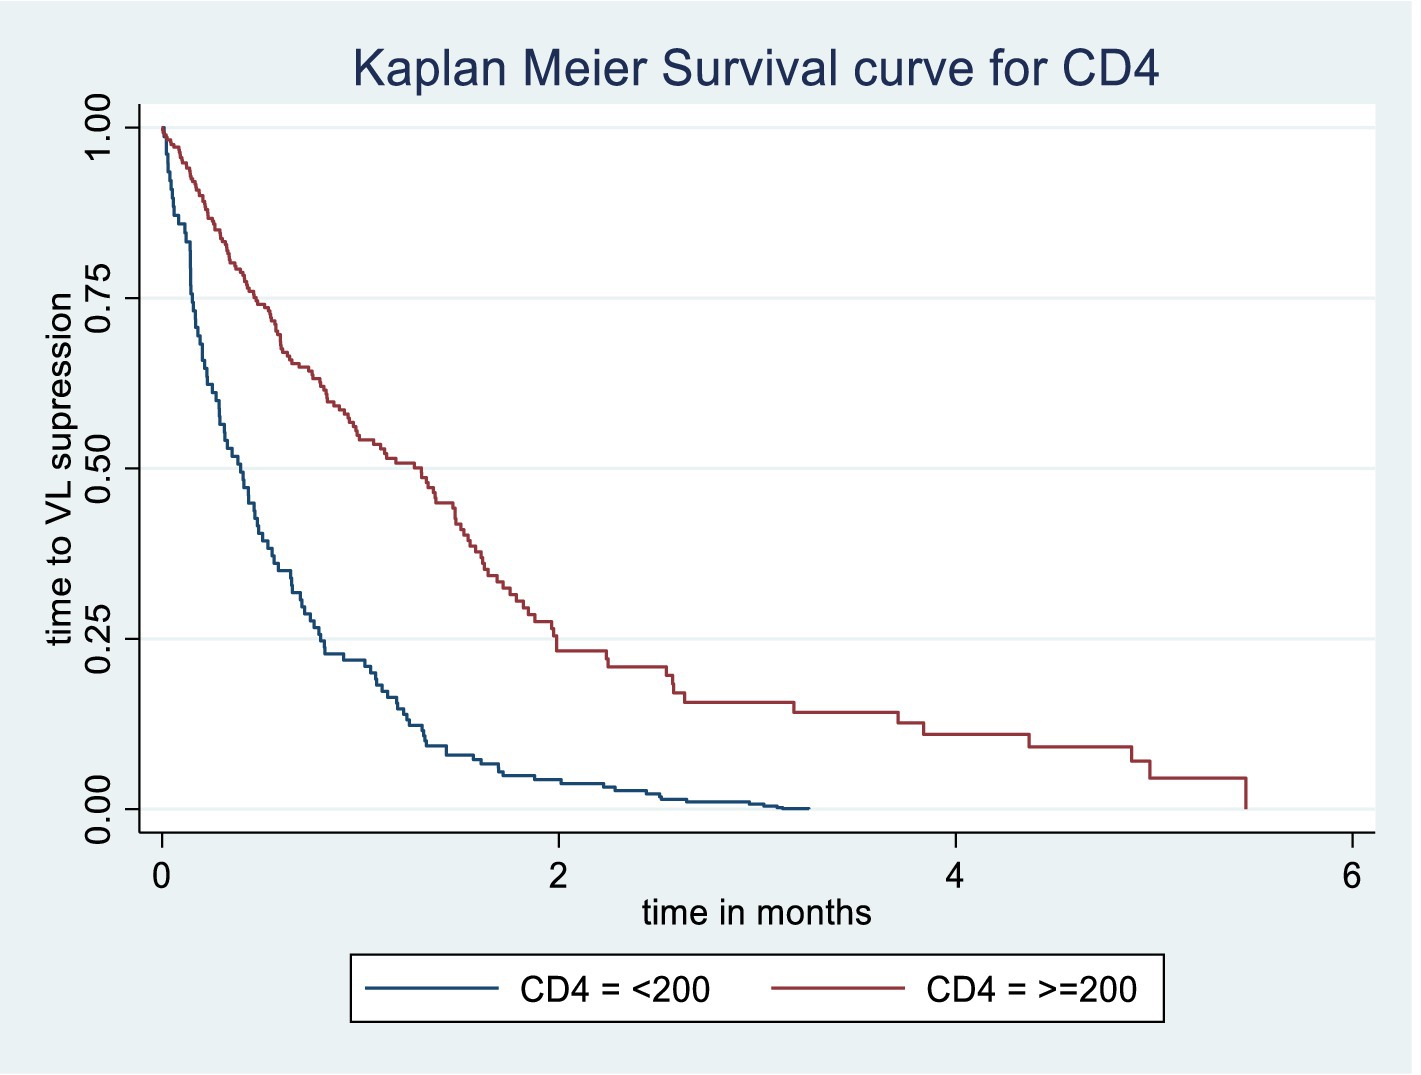
Figure 5. Kaplan Meier survival curve of time to viral load suppression among PLWH on ART by baseline CD4 in Gebi Resu zone, Afar Region, Ethiopia, 2023. Log-rank test with a p-value of 0.0143.
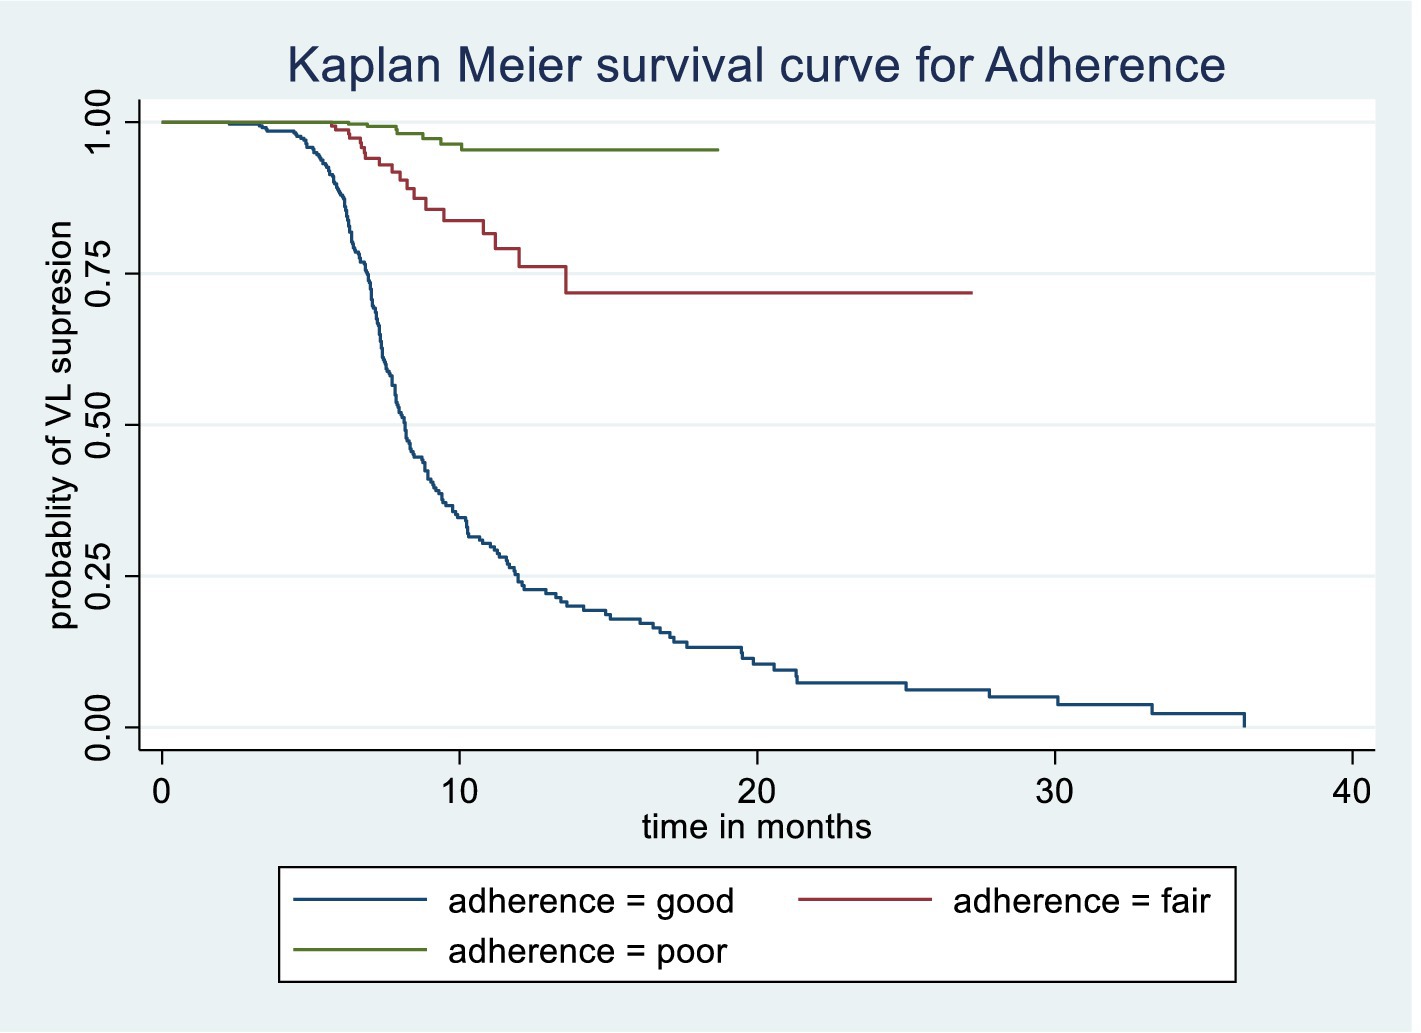
Figure 6. Kaplan Meier survival curve of time to viral load suppression among PLWH on ART by Adherence level in Gebi Resu zone, Afar Region, Ethiopia, 2023. Log-rank test with a p-value of 0.0015.
Predictors of time to viral load suppression among PLWH on ART
Variables with a p-value of <0.25 in the bivariate Cox regression analysis, such as sex, age, residence, BMI, WHO clinical stage, adherence, CPT, IPT, baseline CD4, and past opportunistic infection, were included in the multivariate Cox regression model (Table 4).
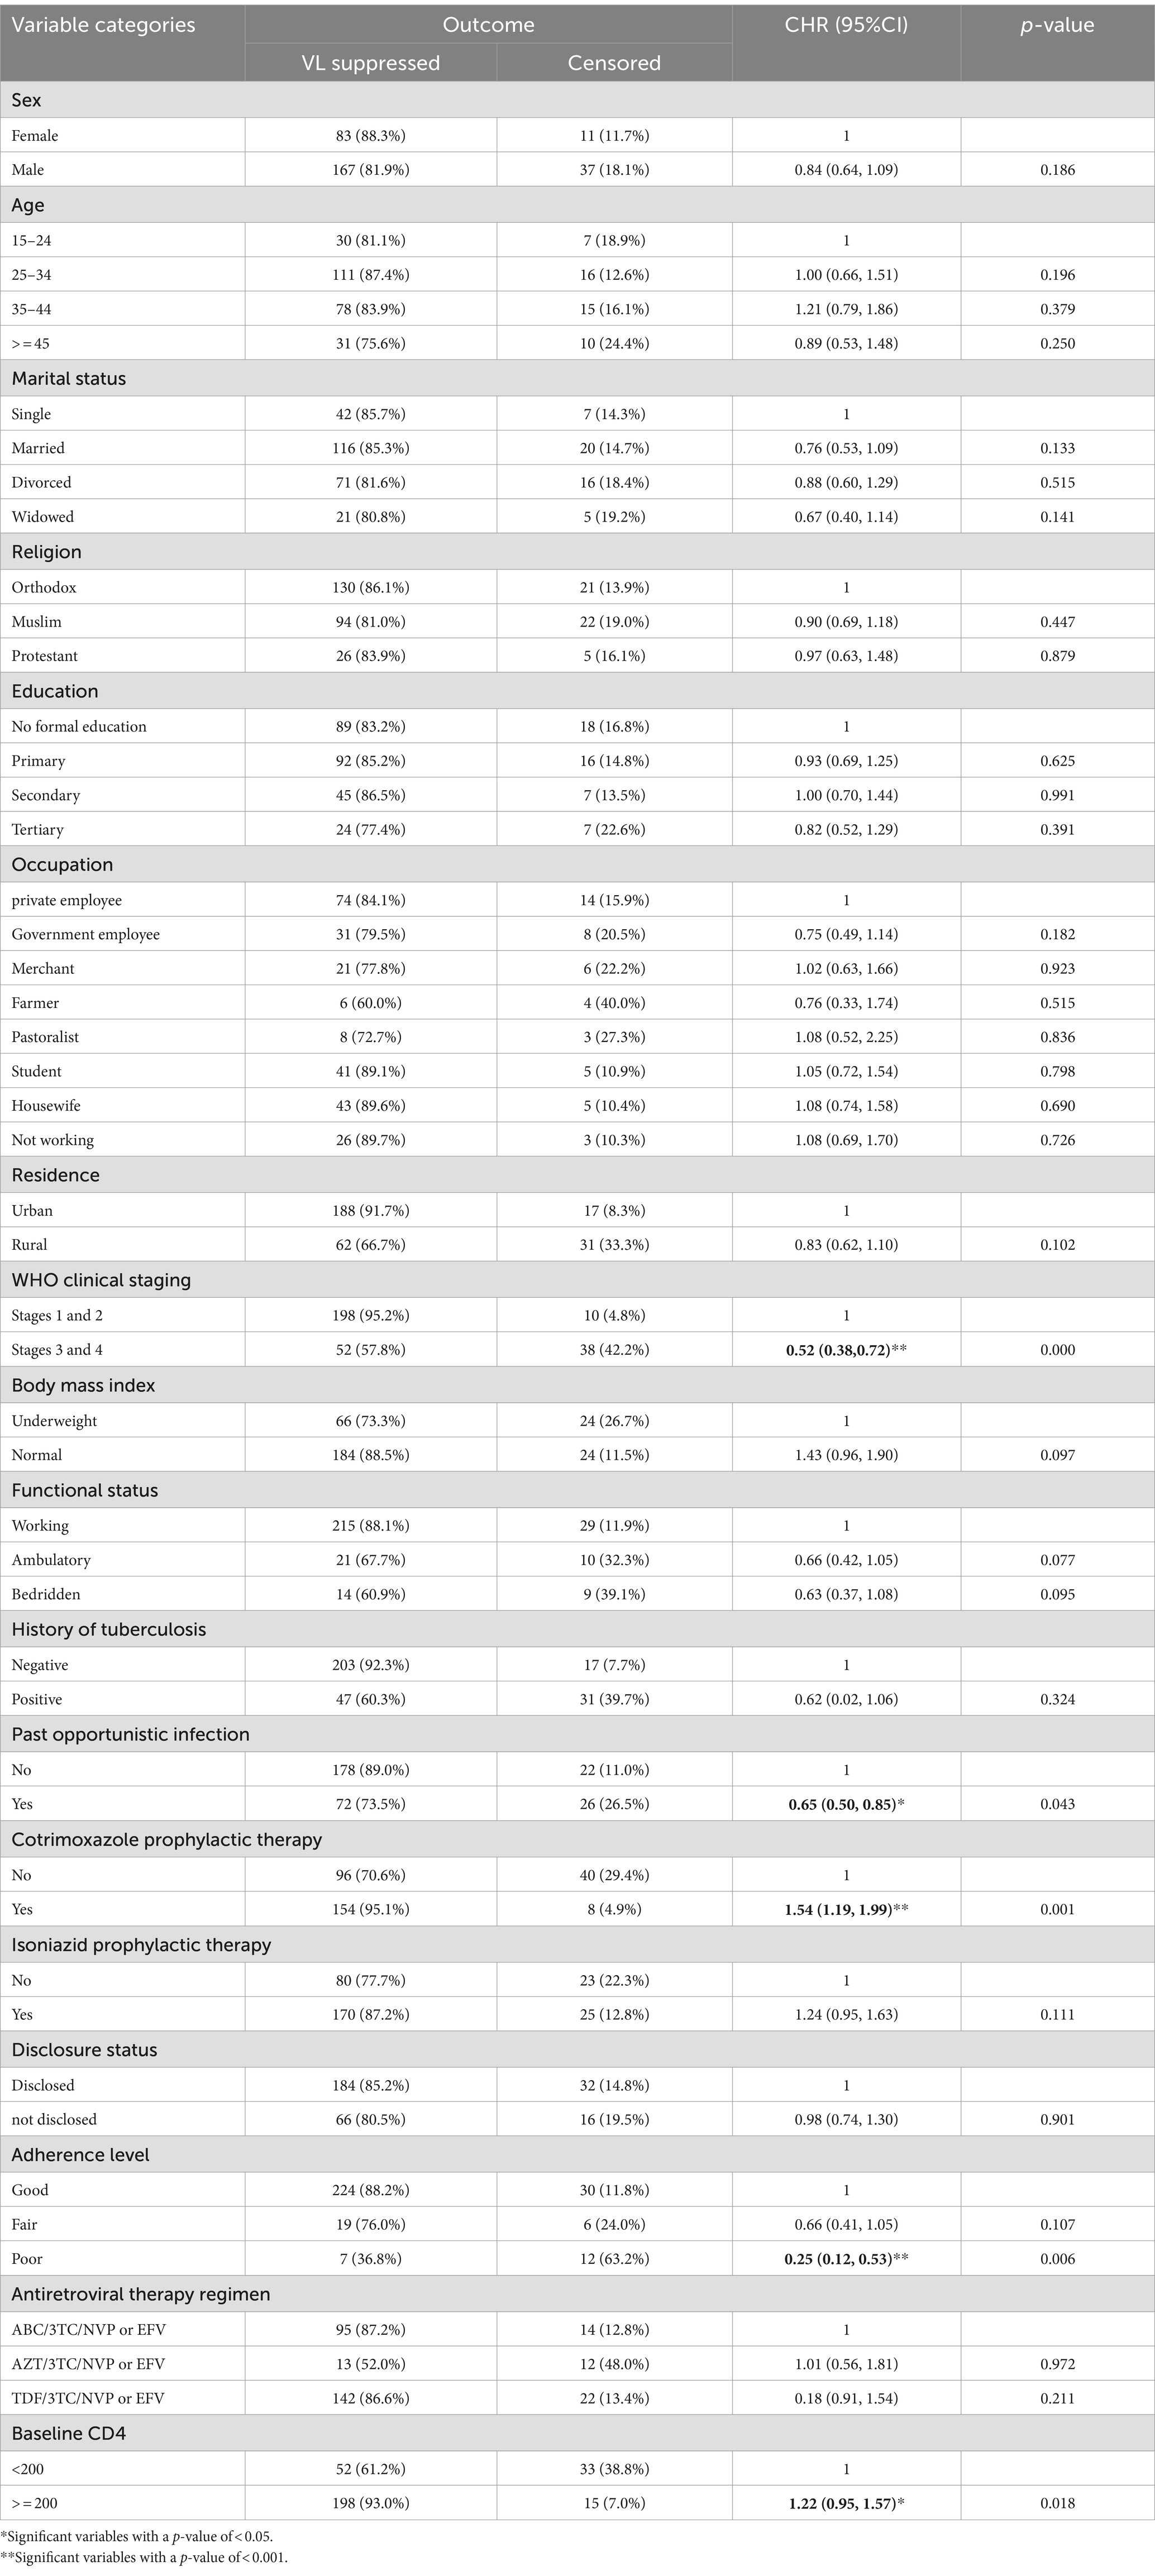
Table 4. Bivariate cox regression analysis of predictors of time to viral load suppression among PLWH on ART in Gebi Resu zone, Afar Region, Ethiopia, 2023.
In the multivariate Cox regression model, WHO clinical stage, CPT, and drug adherence were significant predictors of viral load suppression among PLWH with a p-value of <0.05 within a 95% confidence interval.
Patients at WHO clinical stages 3 and 4 had lower hazards of achieving viral load suppression by 33% compared to patients at clinical stages 1 and 2 (AHR = 0.67, 95%CI (0.47, 0.96)). Patients who received CPT had 1.47 times higher probability of achieving viral load suppression (AHR = 1.47, 95%CI (1.12, 1.92)). Patients with poor drug adherence had a reduced hazard of viral load suppression by 60% compared to patients with good drug adherence (AHR = 0.40, 95%CI (0.18, 0.90)) (Table 5).

Table 5. Bivariate and multivariate Cox regression of predictors of time to viral load suppression among PLWH on ART in Gebi Resu zone, Afar Region, Ethiopia, 2023.
Discussion
This research aimed to assess the time to viral load suppression and its predictors among PLWH on ART in the Gebi Resu zone, Afar Region, Ethiopia. The incidence proportions of people who have achieved their first viral load suppression were 83.89% (95% CI (79.25, 87.66)). The result aligned with studies conducted in Arba Minch, Ethiopia, and the United States of America (12, 22, 23).
On the other hand, the result was higher than the findings from studies conducted in East Shewa and West Gojjam zones in Ethiopia, Kenya, and Uganda (14, 20, 24, 25). On the other hand, the result was lower than that of a study conducted in Hossana, Ethiopia, Nigeria, and Brazil (19, 26, 27). This discrepancy might be due to the differences between the study areas in sociodemographic, infrastructural, and healthcare provision.
The incidence rate of viral load suppression was 9.46 per 100 person-months. This finding was similar to the results from a study conducted in Hossana, Ethiopia, higher than that of a study conducted in Kenya and lower than that of a study conducted in West Gojjam Zone, Ethiopia (14, 19, 24). The difference might be due to the enhancement in the ART service over time and the difference in socioeconomic status of the participants.
The median time for viral load suppression was 7.7 months (IQR: 6.47–10.27). It aligned with studies conducted in Hossana, Ethiopia, and Italy (19, 28). On the contrary, the median time was longer than studies conducted in Arba Minch and the East Shewa zone in Ethiopia and Switzerland (12, 20, 29). The discrepancy might be due to differences in weather conditions between the study areas. The weather conditions in Afar are very difficult to cope with since it is deserted and sandy (30). It affects the nutritional status of the population, especially PLWH, which would lead to lower antiretroviral adherence and, finally, longer duration of viral load suppression (30, 31). The other reason for the inconsistency might be the socioeconomic differences between the study areas.
The likelihood of achieving viral load suppression among PLWH at WHO clinical stages 3 and 4 was 33% lower than for those at clinical stages 1 and 2. This result aligns with studies conducted in Hossana and Arba Minch in Ethiopia, Kenya, and Nigeria (12, 19, 24, 27). This finding could be explained by the fact that, as HIV progresses to advanced stages, opportunistic infections occur due to immune suppression, which can increase morbidity and mortality rates due to complications (32). Additionally, the suppressed immunity in PLWH at clinical stages 3 and 4, where they develop AIDS, likely contributes to increased viral replication (33).
PLWH who received CPT had a 1.47 times higher likelihood of achieving viral load suppression compared to patients who did not receive CPT. This result is consistent with studies conducted in Arba Minch, Ethiopia (12), Uganda (34), and China (35).
The likely explanation is that CPT reduces susceptibility to bacterial infections, providing an advantage over those not on prophylaxis (36). It is advised that PLWH in clinical stages 3 and 4 take prophylaxis to suppress high viral loads and prevent various opportunistic infections. Additionally, CPT may improve survival rates by reducing malaria and opportunistic infections, thereby strengthening the immune system (37). Studies have also shown that CPT is associated with a slower decline in CD4 levels and a faster reduction in viral load (34, 38).
Patients with poor drug adherence were 60% less likely to achieve viral load suppression compared to those with good drug adherence. The result aligns with the findings from studies conducted in Kenya (24). The observed outcome may be attributed to the critical role of ART in suppressing HIV replication and improving patient outcomes. Good adherence to ART is essential for prolonging the life of PLWH, while poor adherence can have the opposite effect (39–41). Poor adherence diminishes the patient’s immune response, creating opportunities for viral replication, which may also lead to the emergence of drug-resistant strains (42).
The main limitations of the study include the exclusion of important behavioral factors that could directly or indirectly affect the time to viral load suppression, such as alcohol use, smoking, nutritional status, and the patients’ economic conditions. These factors were not accounted for due to the retrospective nature of the study.
Conclusion
The time to viral load suppression and the median time to viral load suppression among PLWH on ART in the Gebi Resu zone, Afar Region, Ethiopia, were shorter compared to results from both developing and developed countries. The patient’s baseline HIV clinical stage, use of CPT, and adherence to antiretroviral medication were significant predictors of time to viral load suppression in this region in 2023.
Our findings indicate that interventions aimed at improving clinical management, enhancing adherence to ART, and ensuring access to cotrimoxazole prophylaxis for individuals with unsuppressed viral load can significantly contribute to achieving the Joint United Nations Programme on HIV/AIDS (UNAIDS) “last 95%” target in Ethiopia. By focusing on these areas, healthcare providers and policymakers can work toward a more effective response to the HIV epidemic in Ethiopia. This aligns with global initiatives to end AIDS as a public health threat by 2030, reinforcing the need for continued investment in healthcare infrastructure, education, and support systems that empower individuals living with HIV. Further studies should consider assessing behavioral factors that could affect the time to viral load suppression by conducting prospective studies using primary data.
Data availability statement
The raw data supporting the conclusions of this article will be made available by the authors without undue reservation.
Ethics statement
Ethical review and approval was not required for the study on human participants in accordance with the local legislation and institutional requirements. Written informed consent from the [patients/ participants OR patients/participants legal guardian/next of kin] was not required to participate in this study in accordance with the national legislation and the institutional requirements.
Author contributions
AC: Conceptualization, Data curation, Formal analysis, Funding acquisition, Investigation, Methodology, Project administration, Resources, Software, Supervision, Validation, Visualization, Writing – original draft, Writing – review & editing. EH: Conceptualization, Data curation, Formal analysis, Funding acquisition, Investigation, Methodology, Project administration, Resources, Software, Supervision, Validation, Visualization, Writing – original draft, Writing – review & editing. HA: Conceptualization, Data curation, Formal analysis, Funding acquisition, Investigation, Methodology, Project administration, Resources, Software, Supervision, Validation, Visualization, Writing – original draft, Writing – review & editing. EW: Conceptualization, Data curation, Formal analysis, Funding acquisition, Investigation, Methodology, Project administration, Resources, Software, Supervision, Validation, Visualization, Writing – original draft, Writing – review & editing. SW:–.
Funding
The author(s) declare that no financial support was received for the research, authorship, and/or publication of this article.
Acknowledgments
We would like to acknowledge Adama Hospital Medical College for their support during this research. We would also like to express our gratitude to health institutions, data collectors, friends, family, and supervisors for their full support during the whole process of the study.
Conflict of interest
The authors declare that the research was conducted in the absence of any commercial or financial relationships that could be construed as a potential conflict of interest.
Publisher’s note
All claims expressed in this article are solely those of the authors and do not necessarily represent those of their affiliated organizations, or those of the publisher, the editors and the reviewers. Any product that may be evaluated in this article, or claim that may be made by its manufacturer, is not guaranteed or endorsed by the publisher.
References
1. Engsig, FN, Zangerle, R, Katsarou, O, Dabis, F, Reiss, P, Gill, J, et al. Long-term mortality in HIV-positive individuals virally suppressed for> 3 years with incomplete CD4 recovery. Clin Infect Dis. (2014) 58:1312–21. doi: 10.1093/cid/ciu038
2. Grinsztejn, B, Hosseinipour, MC, Ribaudo, HJ, Swindells, S, Eron, J, Chen, YQ, et al. Effects of early versus delayed initiation of antiretroviral treatment on clinical outcomes of HIV-1 infection: results from the phase 3 HPTN 052 randomised controlled trial. Lancet Infect Dis. (2014) 14:281–90. doi: 10.1016/S1473-3099(13)70692-3
3. Abdullahi, IJ, Deybasso, HA, and Adlo, AM. Determinants of virological failure among patients on first-line antiretroviral therapy in Central Oromia, Ethiopia: a case–control study. HIV/AIDS. (2020) 12:931–9. doi: 10.2147/HIV.S281672
4. Haider, MR, Brown, MJ, Harrison, S, Yang, X, Ingram, L, Bhochhibhoya, A, et al. Sociodemographic factors affecting viral load suppression among people living with HIV in South Carolina. AIDS Care. (2021) 33:290–8. doi: 10.1080/09540121.2019.1703892
5. FDREMo H. National Guidelines for Comprehensive HIV prevention care and treatment. (2017) FDRE Ministry of Health.
6. Adapting W. Implementing new recommendations on HIV patient monitoring. Geneva, Switzerland: World Health Organization (2017).
7. Organization WH. Consolidated guidelines on the use of antiretroviral drugs for treating and preventing HIV infection:Recommendation for a public health approach. (2016) World Health Organization (WHO).
8. Barnabas, G, Sibhatu, MK, and Berhane, Y. Antiretroviral therapy program in Ethiopia benefits from virology treatment monitoring. Ethiop J Health Sci. (2017) 27:1–2. doi: 10.4314/ejhs.v27i1.1S
9. Doherty, M. WHO guidelines on the use of CD4, viral load, and EID tests for initiation and monitoring of ART. Geneva, Switzerland: World Health Organization (2014).
11. AIDS at a crossroads. Geneva: Joint United Nations Programme on HIV/AIDS; Licence: CC BY-NC-SA 3.0 IGO. (2024). Available at: https://www.unaids.org/sites/default/files/media_asset/UNAIDS_FactSheet_en.UFs-gHsAf,pdf. (Accessed April 17).
12. Hussen, S, Mama, M, Mekonnen, B, Shegaze, M, Boti, N, and Shure, M. Predictors of time to viral load suppression of adult PLWHIV on ART in Arba Minch general hospital: a follow up study. Ethiop J Health Sci. (2019) 29:751–8. doi: 10.4314/ejhs.v29i6.12
13. Gelaw, B, Mulatu, G, Tesfa, G, Marew, C, Chekole, B, and Alebel, A. Magnitude and associated factors of virological failure among children on ART in Bahir Dar town public health facilities, Northwest Ethiopia: a facility based cross-sectional study. Ital J Pediatr. (2021) 47:1–9. doi: 10.1186/s13052-021-01030-7
14. Atnafu, GT, Moges, NA, Wubie, M, and Gedif, G. Incidence and predictors of viral load suppression after enhanced adherence counseling among HIV-positive adults in west Gojjam zone, Amhara region. Ethiopia Infection and Drug Resistance. (2022) 15:261–74. doi: 10.2147/IDR.S341392
15. Kyaw, NTT, Harries, AD, Kumar, AM, Oo, MM, Kyaw, KWY, Win, T, et al. High rate of virological failure and low rate of switching to second-line treatment among adolescents and adults living with HIV on first-line ART in Myanmar, 2005-2015. PLoS One. (2017) 12:e0171780. doi: 10.1371/journal.pone.0171780
16. WHO. Technical and operational considerations for implementing HIV viral load testing. (2014) World Health Organization (WHO).
17. Getaneh, Y, Ning, F, He, Q, Rashid, A, Kassa, D, Assefa, Y, et al. Survival and predictors of mortality among adults initiating highly active antiretroviral therapy in Ethiopia: a retrospective cohort study (2007-2019). Biomed Res Int. (2022) 2022:1–14. doi: 10.1155/2022/5884845
18. Skarbinski, J, Rosenberg, E, Paz-Bailey, G, Hall, HI, Rose, CE, Viall, AH, et al. Human immunodeficiency virus transmission at each step of the care continuum in the United States. JAMA Intern Med. (2015) 175:588–96. doi: 10.1001/jamainternmed.2014.8180
19. Erjino, E, Abera, E, and Lemma, TL. Time to viral load suppression and its predictors among adult patients on Antiretro viral therapy in Nigist Eleni Mohammed memorial comprehensive specialized hospital, Hossana, southern Ethiopia. HIV AIDS. (2023) 15:157–71. doi: 10.2147/HIV.S408565
20. Ali, JH, and Yirtaw, TG. Time to viral load suppression and its associated factors in cohort of patients taking antiretroviral treatment in east Shewa zone, Oromiya, Ethiopia, 2018. BMC Infect Dis. (2019) 19:1–6. doi: 10.1186/s12879-019-4702-z
21. Kibret, GD, Ferede, A, Leshargie, CT, Wagnew, F, Ketema, DB, and Alebel, A. Trends and spatial distributions of HIV prevalence in Ethiopia. Infect Dis Poverty. (2019) 8:1–9. doi: 10.1186/s40249-019-0594-9
22. Toren, KG, Buskin, SE, Dombrowski, JC, Cassels, SL, and Golden, MR. Time from HIV diagnosis to viral load suppression: 2007–2013. Sex Transm Dis. (2016) 43:34–40. doi: 10.1097/OLQ.0000000000000376
23. Hoenigl, M, Chaillon, A, Moore, DJ, Morris, SR, Mehta, SR, Gianella, S, et al. Rapid HIV viral load suppression in those initiating antiretroviral therapy at first visit after HIV diagnosis. Sci Rep. (2016) 6:32947. doi: 10.1038/srep32947
24. Maina, E, Mureithi, H, Adan, A, Muriuki, J, Lwembe, R, and Bukusi, E. Incidences and factors associated with viral suppression or rebound among HIV patients on combination antiretroviral therapy from three counties in Kenya. Int J Infect Dis. (2020) 97:151–8. doi: 10.1016/j.ijid.2020.05.097
25. Kazooba, P, Mayanja, BN, Levin, J, Masiira, B, and Kaleebu, P. Virological failure on first-line antiretroviral therapy; associated factors and a pragmatic approach for switching to second line therapy–evidence from a prospective cohort study in rural South-Western Uganda, 2004-2011. Pan Afr Med J. (2018) 29:1–16. doi: 10.11604/pamj.2018.29.191.11940
26. Bello, EJM, Correia, AF, Marins, JRP, Merchan-Hamann, E, and Kanzaki, LIB. Predictors of virologic failure in HIV/AIDS patients treated with highly active antiretroviral therapy in Brasília, Brazil during 2002–2008. Drug Target Insights. (2011) 5:DTI.S7527–41. doi: 10.4137/DTI.S7527
27. Abdullahi, SB, Ibrahim, OR, Okeji, AB, Yandoma, RI, Bashir, I, Haladu, S, et al. Viral suppression among HIV-positive patients on antiretroviral therapy in northwestern Nigeria: an eleven-year review of tertiary care Centre records, January 2009–December 2019. BMC Infect Dis. (2021) 21:1–8. doi: 10.1186/s12879-021-06722-3
28. Madeddu, G, De Vito, A, Cozzi-Lepri, A, Cingolani, A, Maggiolo, F, Perno, CF, et al. Time spent with HIV-RNA≤ 200 copies/ml in a cohort of people with HIV during the U= U era. AIDS. (2021) 35:1103–12. doi: 10.1097/QAD.0000000000002825
29. Pyngottu, A, Scherrer, AU, Kouyos, R, Huber, M, Hirsch, H, Perreau, M, et al. Predictors of Virological failure and time to viral suppression of first-line integrase inhibitor-based antiretroviral treatment. Clin Infect Dis. (2021) 73:e2134–41. doi: 10.1093/cid/ciaa1614
30. Belayihun, B, and Negus, R. Antiretroviral treatment adherence rate and associated factors among people living with HIV in Dubti hospital, Afar regional state, East Ethiopia. Int Schol Res Notices. (2015) 2015:1–5. doi: 10.1155/2015/187360
31. Hardon, AP, Akurut, D, Comoro, C, Ekezie, C, Irunde, HF, Gerrits, T, et al. Hunger, waiting time and transport costs: time to confront challenges to ART adherence in Africa. AIDS Care. (2007) 19:658–65. doi: 10.1080/09540120701244943
32. Weinberg, JL, and Kovarik, CL. The WHO clinical staging system for HIV/AIDS. Virtual Mentor. (2010) 12:202–6. doi: 10.1001/virtualmentor.2010.12.3.cprl1-1003
34. Mermin, J, Lule, J, Ekwaru, JP, Malamba, S, Downing, R, Ransom, R, et al. Effect of co-trimoxazole prophylaxis on morbidity, mortality, CD4-cell count, and viral load in HIV infection in rural Uganda. Lancet. (2004) 364:1428–34. doi: 10.1016/S0140-6736(04)17225-5
35. Qin, S, Lai, J, Zhang, H, Wei, D, Lv, Q, Pan, X, et al. Predictive factors of viral load high-risk events for virological failure in HIV/AIDS patients receiving long-term antiviral therapy. BMC Infect Dis. (2021) 21:448. doi: 10.1186/s12879-021-06162-z
36. Grimwade, K, and Swingler, G. Cotrimoxazole prophylaxis for opportunistic infections in adults with HIV. Cochrane Database Syst Rev. (2003) 2003:CD003108. doi: 10.1002/14651858.CD003508
37. Guidelines on post-exposure prophylaxis for HIV and the use of co-Trimoxazole prophylaxis for HIV-related infections among adults, adolescents and children: Recommendations for a public health approach: December 2014 supplement to the 2013 consolidated guidelines on the use of antiretroviral drugs for treating and preventing HIV infection. Geneva: © World Health Organization (2014).
38. Kalou, M, Sassan-Morokro, M, Abouya, L, Bile, C, Maurice, C, Maran, M, et al. Changes in HIV RNA viral load, CD4+ T-cell counts, and levels of immune activation markers associated with anti-tuberculosis therapy and cotrimoxazole prophylaxis among HIV-infected tuberculosis patients in Abidjan, Cote d'Ivoire. J Med Virol. (2005) 75:202–8. doi: 10.1002/jmv.20257
39. Cohen, MS, Chen, YQ, McCauley, M, Gamble, T, Hosseinipour, MC, Kumarasamy, N, et al. Prevention of HIV-1 infection with early antiretroviral therapy. N Engl J Med. (2011) 365:493–505. doi: 10.1056/NEJMoa1105243
40. Parienti, JJ, Das-Douglas, M, Massari, V, Guzman, D, Deeks, SG, Verdon, R, et al. Not all missed doses are the same: sustained NNRTI treatment interruptions predict HIV rebound at low-to-moderate adherence levels. PLoS One. (2008) 3:e2783. doi: 10.1371/journal.pone.0002783
41. Kobin, AB, and Sheth, NU. Levels of adherence required for virologic suppression among newer antiretroviral medications. Ann Pharmacother. (2011) 45:372–9. doi: 10.1345/aph.1P587
Keywords: time to viral load suppression, antiretroviral therapy, predictors, Afar, Ethiopia
Citation: Chirnet AT, Habtewold EM, Aman H, Wakwoya EB and Workie SG (2024) Time to viral load suppression and its predictors among people living with HIV on antiretroviral therapy in Gebi Resu zone, Afar Region, Ethiopia, 2023. Front. Public Health. 12:1384787. doi: 10.3389/fpubh.2024.1384787
Edited by:
John Shearer Lambert, University College Dublin, IrelandReviewed by:
Jacques L. Tamuzi, Stellenbosch University, South AfricaChijioke Umunnakwe, Ndlovu Research Centre, South Africa
Copyright © 2024 Chirnet, Habtewold, Aman, Wakwoya and Workie. This is an open-access article distributed under the terms of the Creative Commons Attribution License (CC BY). The use, distribution or reproduction in other forums is permitted, provided the original author(s) and the copyright owner(s) are credited and that the original publication in this journal is cited, in accordance with accepted academic practice. No use, distribution or reproduction is permitted which does not comply with these terms.
*Correspondence: Anteneh Tefera Chirnet, YW50dGVmMTlAZ21haWwuY29t
 Anteneh Tefera Chirnet
 Ephrem Mannekulih Habtewold1
 Haji Aman
 Elias Bekele Wakwoya