 Shuyuan Cheng
 Rong Yin3
 Qiong Wang
 Hui Zhang
 Li Ling
 Wen Chen
- 1International Cooperation and Exchange Department, The First Affiliated Hospital of Sun Yat-sen University, Guangzhou, China
- 2Health Policy and Management Department, Bloomberg School of Public Health, Johns Hopkins University, Baltimore, MD, United States
- 3Department of Medical Statistics, School of Public Health, Sun Yat-sen University, Guangzhou, China
- 4Department of Epidemiology, School of Public Health, Sun Yat-sen University, Guangzhou, China
- 5Department of Health Policy and Management, School of Public Health, Sun Yat-sen University, Guangzhou, China
- 6Department of Health Policy and Management, Bloomberg School of Public Health, Johns Hopkins University, Baltimore, MD, United States
Introduction: Dementia and physical disability are serious problems faced by the aging population, and their occurrence and development interact.
Methods: Based on data from a national cohort of Chinese people aged 60 years and above from the China Health and Retirement Longitudinal Survey from 2011 to 2018, we applied the group-based trajectory model to identify the heterogeneous trajectories of cognitive function and physical disability in participants with different physical disability levels. Next, multinomial logistic regression models were used to explore the factors affecting these trajectories.
Results: The cognitive function trajectories of the Chinese older people could be divided into three characteristic groups: those who maintained the highest baseline level of cognitive function, those with a moderate baseline cognitive function and dramatic progression, and those with the worst baseline cognitive function and rapid–slow–rapid progression. The disability trajectories also fell into three characteristic groups: a consistently low baseline disability level, a low initial disability level with rapid development, and a high baseline disability level with rapid development. Compared with those free of physical disability at baseline, a greater proportion of participants who had physical disability at baseline experienced rapid cognitive deterioration. Education, income, type of medical insurance, gender, and marital status were instrumental in the progression of disability and cognitive decline in the participants.
Discussion: We suggest that the Chinese government, focusing on the central and western regions and rural areas, should develop education for the older people and increase their level of economic security to slow the rate of cognitive decline and disability among this age group. These could become important measures to cope with population aging.
Introduction
Global aging is increasing, with one sixth of the world’s population being over the age of 60 in 2023 (1). Several studies have shown that the prevalence of dementia and physical disability in the older people increases with age (2, 3). The number of people with dementia worldwide is expected to increase from 57.4 million in 2019 to 152.8 million in 2050 (4). In China, there were approximately 16.25 million people with dementia in 2020, and that number is expected to approximately triple to 48.98 million by 2050 (5). Notably, the proportion of older people with disabilities among the total number of persons with disabilities in China is projected to exceed 57% in 2030, and will further increase to over 70% by 2050 if no preventive or control measures are taken (6). Meanwhile, increased longevity has led to a sustained increase in the number of years lived with physical disability, which has in turn increased the financial burden in later life for both disabled individuals and society (7, 8). Cognitive function and physical disability present major challenges to healthy aging today (9). Understanding the progression of cognitive degeneration and physical disability can contribute to the formulation of preventive or control measures.
During the progression from normal cognition to dementia, there is an intermediate stage of ‘mild cognitive impairment’ (10), which does not necessarily get progressively worse and may be reversible, according to previous research (11, 12). Existing studies have explored the trajectory of cognitive degeneration in the older people, but their findings on the typology of these trajectories have been inconsistent. Some studies, including three in China, have reported between three and six trajectories of cognitive degeneration among the older people (13–24). Specifically, some studies in the United States (US), the United Kingdom (UK), Japan, and China have shown that the higher the baseline cognitive level of older people, the slower their future decline in cognitive function. However, two other studies in China found that the older population with the most stable maintenance of cognitive function comprised people with a moderate baseline cognitive function (19, 20).
There is similar variation in studies on the trajectories of physical disability in the older people. Regarding the progression of mobility degeneration, the existence of a reversible trajectory among older adults has only been supported by two studies, both conducted in the Netherlands (25, 26). Nusselder et al. identified two groups of Dutch persons aged 15–74 years with reversible trajectories (26). One group was characterized by initial mild disability and gradual functional improvement, while those in the other group were moderately disabled at baseline with partial recovery in the subsequent months. In Gardeniers et al., the recovery of physical function was observed only among Dutch men aged 75 years and above, not their female counterparts (25). Some studies have identified between three and nine trajectories of physical disability in the older people (26, 27). Additionally, many researchers in the UK, the US, the Netherlands, and China have identified two groups with opposite patterns of mobility degeneration: those suffering the severest disability in the beginning, progressing most rapidly and reaching the worst status during the follow-up period; and those with no or little disability initially, then persistent low levels of physical disability over a period of years (25, 28–30). However, another study in China in 2015 showed that older people with a low level of disability (1 item of disability) at baseline later experienced the highest level of disability (nearly 10 items of disability) due to the rapid progression of their disability over the following decade (31).
Most previous studies have focused on the progression of physical disability and cognitive function separately. However, it has been shown that the two mutually affect each other (32, 33) and that there is a possibility of co-morbidity (34). Therefore, it is relevant to study the covarying trajectory of cognitive function and disability. At present, only five studies, all conducted in the US, have studied both cognitive function and physical disability, and they have found that the trajectories of disability vary with the state of cognitive function (27, 35–38). For example, a 2016 study by Tolea et al. involving US adults aged 50 and above found that older people with dementia experienced a decline in mobility (27). However, the current evidence on the trajectory of cognitive function in people with different disability levels remains limited. To date, no published studies in China have explored the trajectories of cognitive function and disability together.
Studies have shown that cognitive function trajectories are associated with genetics, the presence of other diseases, lifestyles, and socioeconomic status. Existing evidence suggests that the AOPEε4 gene may accelerate cognitive decline (39–41). Mental disorders, cardiovascular disease, and other chronic diseases have been identified as major contributors to accelerating declines in both cognition and mobility (42–44). In terms of lifestyle, poor nutrition and physical inactivity worsen both physical disability and cognitive function (45, 46). Previous studies have also revealed that education, income, occupation, and residential surroundings can differentially affect the rate of cognitive and disability decline in the older people (47–49). However, studies among China’s older population have mainly focused on the effects of factors such as gender, disease, and education (50); there is a lack of comprehensive analysis of multiple factors.
This study was designed to reveal the trajectories of both cognitive function and physical disability among older people in China, and to identify the factors contributing to them, utilizing data from the China Health and Retirement Longitudinal Survey (CHARLS) (51), a prospective study with a national cohort, spanning from 2011 to 2018. The results have important implications for developing practical strategies to address current issues facing the aging Chinese population.
Methods
Participants and setting
CHARLS survey data from 2011, 2013, 2015, and 2018 were used. A total of 7,961 persons aged 60 and above were included in this study from the 2011 baseline of 17,708 respondents. We further excluded those who were lost to follow up (1,094 in 2013, 795 in 2015, and 892 in 2018) and 469 persons whose test results for cognitive function and physical disability were missing, resulting in a final study population sample size of 4,441 (see Figure 1).
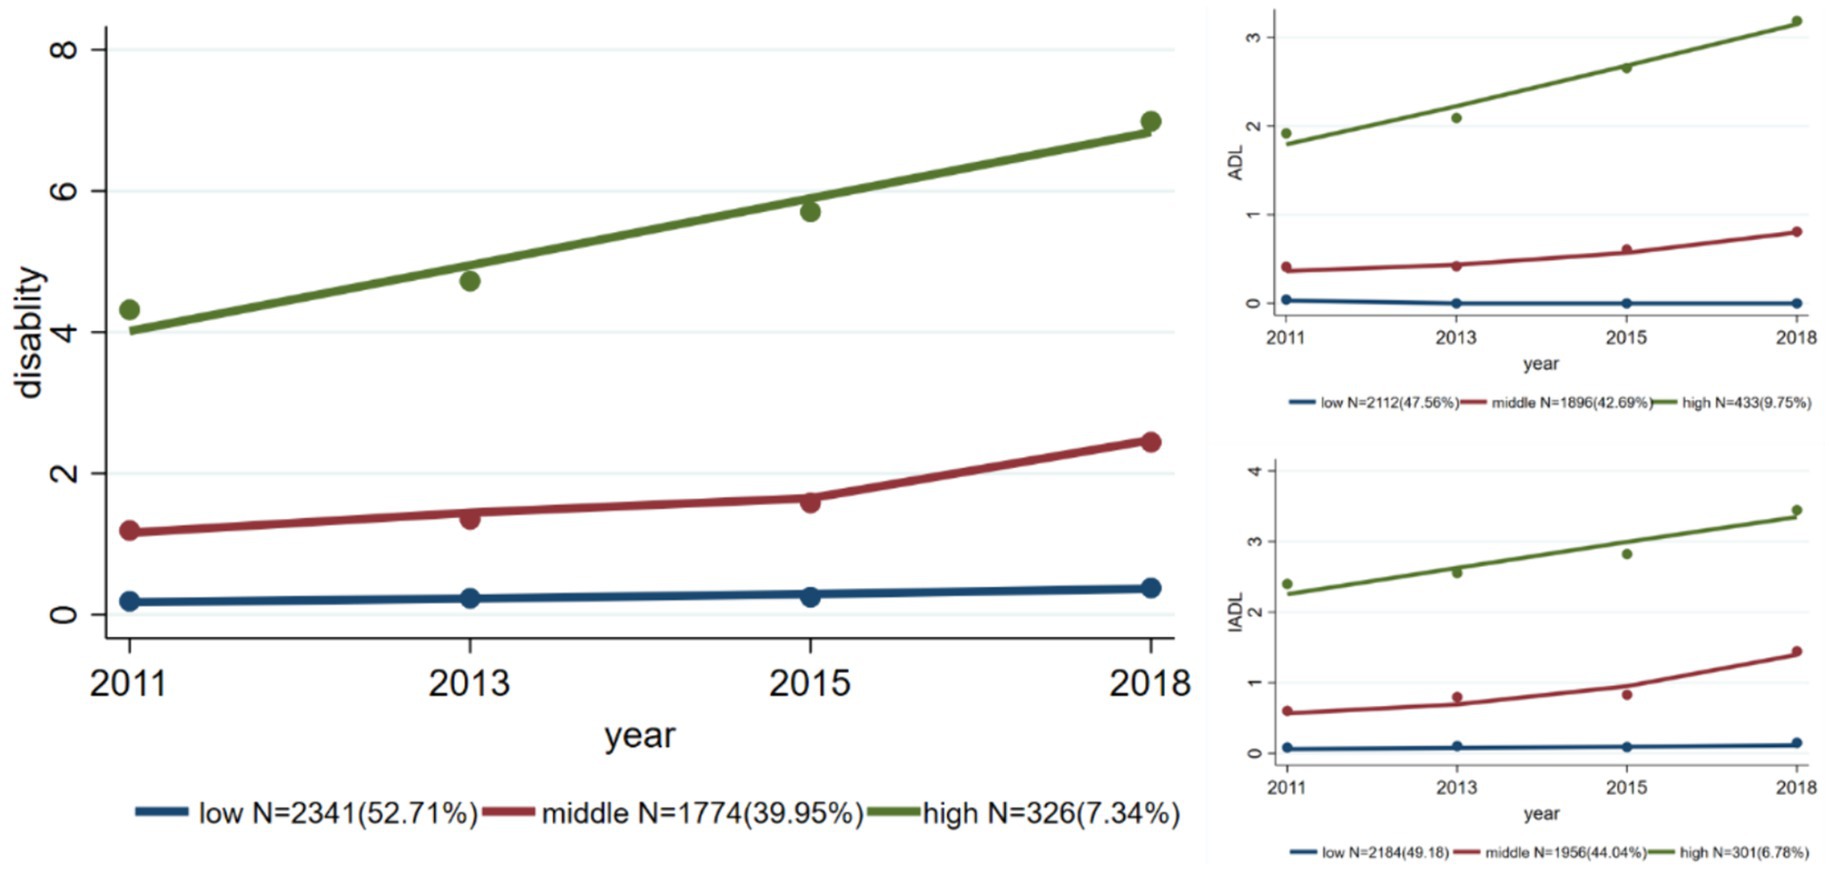
Figure 1. Trajectories of overall physical disability and of disability assessed by ADL and IADL separately.
Outcome measurements
Physical disability
Physical disability was assessed using scales of activities of daily living (ADL) and instrumental activities of daily living (IADL). Six questions (on bathing, dressing, eating, getting up/out of bed, toileting, and bowel control) were included in the ADL scale and five questions (on chores, cooking, shopping, phone calls, and medication) were included in the IADL scale. In the original questionnaire (52, 53), the responses to each question were divided into four levels (‘no difficulty’, ‘difficult but still able to complete’, ‘difficult and need help’, ‘unable to complete’). In this study, any level of difficulty was defined as the presence of disability, and ‘no difficulty’ was defined as the absence of disability. This approach generated a disability score between 0 and 11, with a higher number indicating more limitation in daily activities.
Cognitive function
Two components of cognitive function were measured: episodic memory and psychiatric status (53–56). Reverse scoring was adopted, with a higher score representing poorer cognitive function. Episodic memory was measured by testing the respondents’ ability to recall words, with 10 words tested for immediate memory and 10 for delayed memory. A wrong answer scored 1 point and a correct answer scored 0 points, yielding a total score ranging from 0 to 20 points, with higher scores representing worse episodic memory (57). Psychiatric status was measured by the time orientation, numeracy, and constructive drawing abilities of the survey respondents (58). The time orientation measurement asked the respondents the year, month, day, season, and day of the week at the time of the survey, with a wrong answer scoring 1 point and a correct answer scoring 0 points. Numeracy was measured by asking the respondents to calculate 100 minus 7 five consecutive times, with each wrong answer scoring 1 point and each correct answer 0 points. Constructive drawing ability was measured by asking the respondents to draw from a graphic shown by the investigator, with 0 points being assigned for correct drawings and 1 point for each error. The total cognitive function scores ranged from 0 to 31, with higher scores representing poorer cognitive function.
Covariates
The covariate data collected were age (60–69 years, 70–79 years, ≥80 years), gender (male, female), education (illiterate, elementary school, junior high school, high school and above), marital status (no partner, partnered), type of residence (rural, urban), region (eastern, central, western), annual household income (RMB0–9,999, RMB10,000–49,999, ≥RMB50,000), and type of medical insurance (Urban Employee Basic Medical Insurance, Urban and Rural Resident Basic Medical Insurance, Other).
Statistical analysis
The physical disability scores, including the total scores and scores for ADL and IADL, in the four survey waves were described by n (%). Medians (interquartile ranges) were used to describe the cognitive function scores, including total scores and the scores for episodic memory and psychiatric status.
Group-based trajectory modeling (GBTM) (59, 60) was employed to identify similarities in the developmental trajectories of cognitive function and physical disability among the participants. Referring to previous studies, most of which have identified three groups of trajectories (17–21), we a priori set three as the number of groups. The respondents were categorized into the groups to which the progression patterns of their three trajectories had the maximum predicted probability of belonging. Next, we used chi-square tests to test the differences in baseline characteristics among the three groups. GBTM was conducted separately for the total disability scores, scores for ADL and IADL, total cognitive function scores, scores for episodic memory, and scores for psychiatric status.
For trajectories considering both physical disability and cognitive function simultaneously, we first divided all the participants into two subgroups based on the disability scores: absence of disability (‘non-disabled’; disability score = 0) and presence of disability (‘disabled’; disability score ≥ 1). The cognitive function trajectory was then identified separately for the two subgroups using GBTM. In line with the aforementioned analysis, we a priori set three groups for GBTM and employed chi-square tests to analyze the differences in baseline characteristics.
A multinomial logistic regression model was used to analyze the factors influencing the trajectories of disability and cognitive function separately. The covariates were age, gender, education, marital status, type of residence, region, annual household income, and type of medical insurance. Due to limited sample size, we did not use a multinomial logistic regression model to identify the factors influencing the trajectories of cognitive function for subgroups with the presence and absence of disability. In addition, two sensitivity analyses were conducted to examine (1) the potential interactions of baseline cognitive function/physical disability score with other characteristics on physical disability and cognitive function trajectory, respectively, and (2) the potential moderation of hypertension on physical disability and cognitive function trajectory. Because, hypertension is important as comorbidities need to be taken in account as it is very frequent and is a risk factor for cognitive impairment and physical disability.
The software packages R 4.2.3 and Stata 17.0 were used for the statistical analyses, and the two-tailed test level of α was 0.05.
All waves of CHARLS were approved by the Institutional Review Board (IRB) of Peking University (IRB00001052-11015 for household survey and IRB00001052-11014 for biomarker collection). All participants signed informed consent.
Results
Baseline characteristics of the surveyed population
As shown in Table 1, the majority of the participants were aged 60–69 years (71.8%) at baseline, and approximately half were women (51.3%). Many were illiterate (34.8%) or had only a primary school education level (46.8%). A small number of the participants had no partner (18.1%). Although a minority were from urban areas (17.6%), the regional distribution was relatively even (37.7% from eastern China, 36.2% from central China, and 26.1% from western China). The annual household income of more than half of the participants was less than RMB10,000 (58.9%), and the main type of medical insurance was medical insurance for urban and rural residents (80.5%).
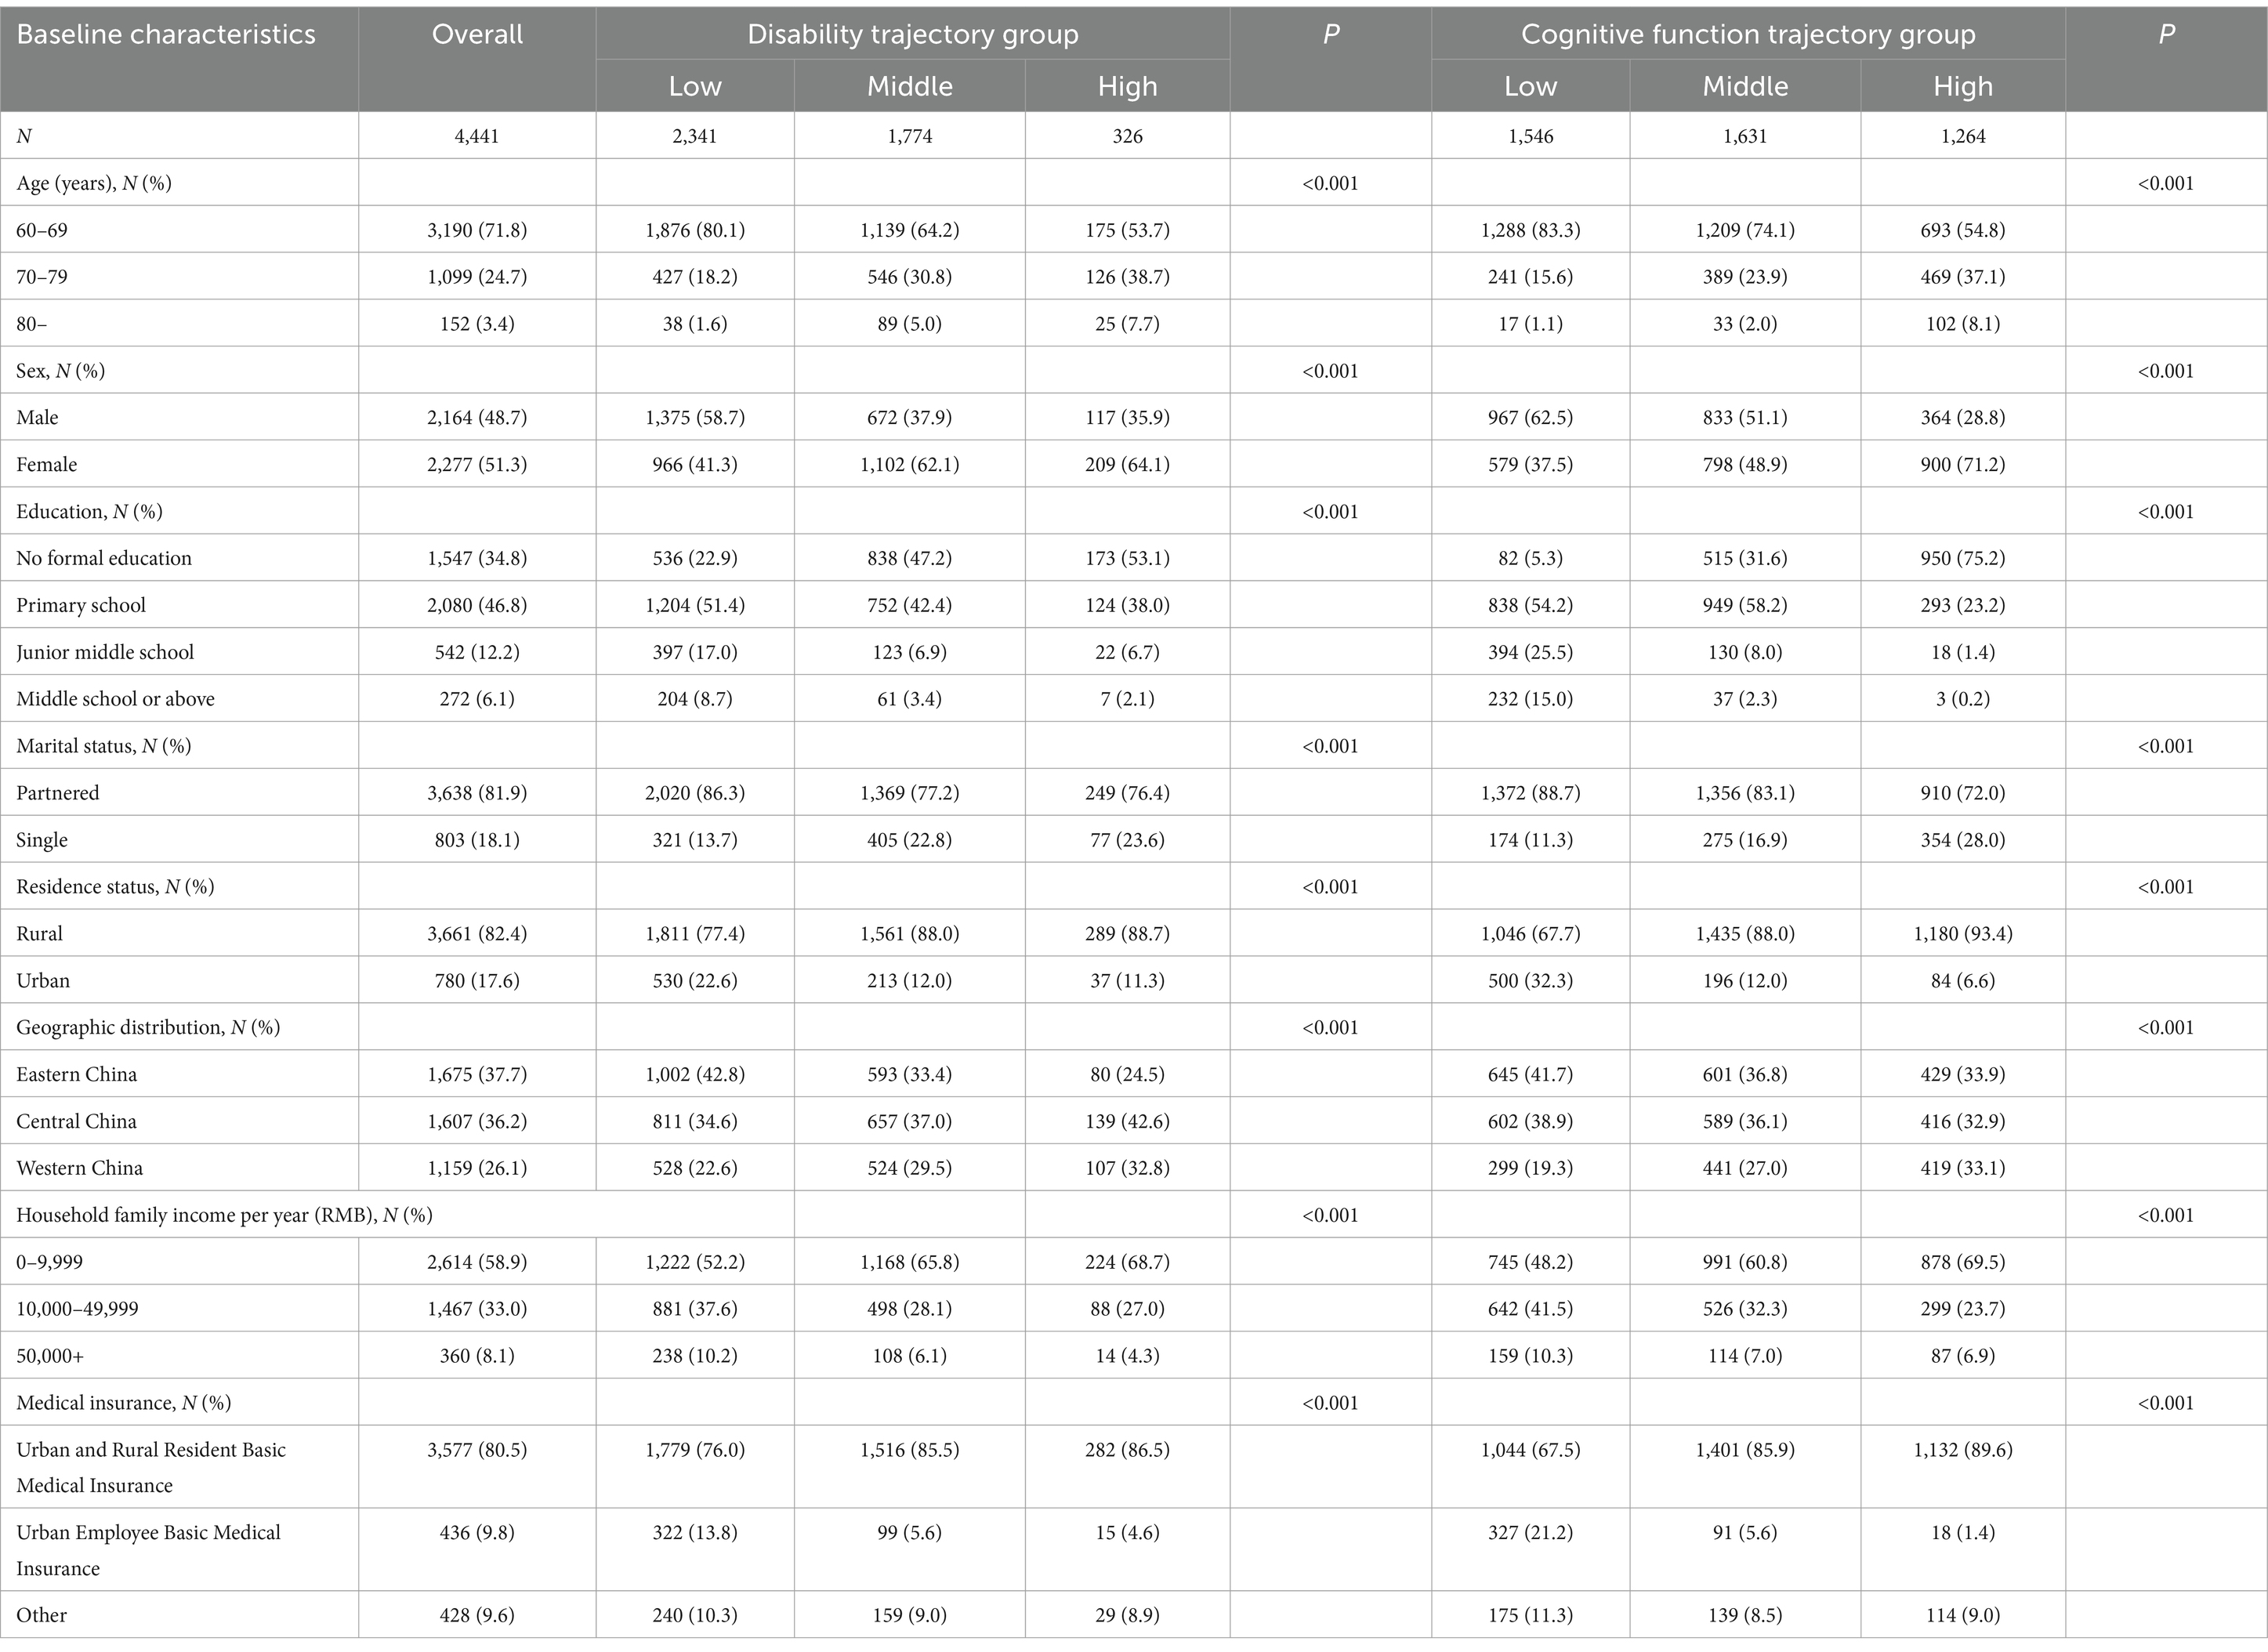
Table 1. Baseline characteristics of the participants.
Physical disability and cognitive function across four survey waves
Table 2 shows the disability and cognitive function scores across the four survey waves. The proportion of participants free of physical disability gradually decreased from the 2011 to 2018 survey waves, with percentages of 65.9, 57.4, 51.0, and 46.6%. Few participants had a disability score above 5 points (<5%). The same trend was observed for IADL measurements, with the proportion of participants without physical disability being 74.6, 64.3, 59.7, and 53.5% for each survey wave. Compared with that of IADL disabilities, the prevalence of ADL disabilities was slightly lower, with the corresponding percentages of disability-free participants being 78.6, 78.1, 71.6, and 68.7%, respectively.
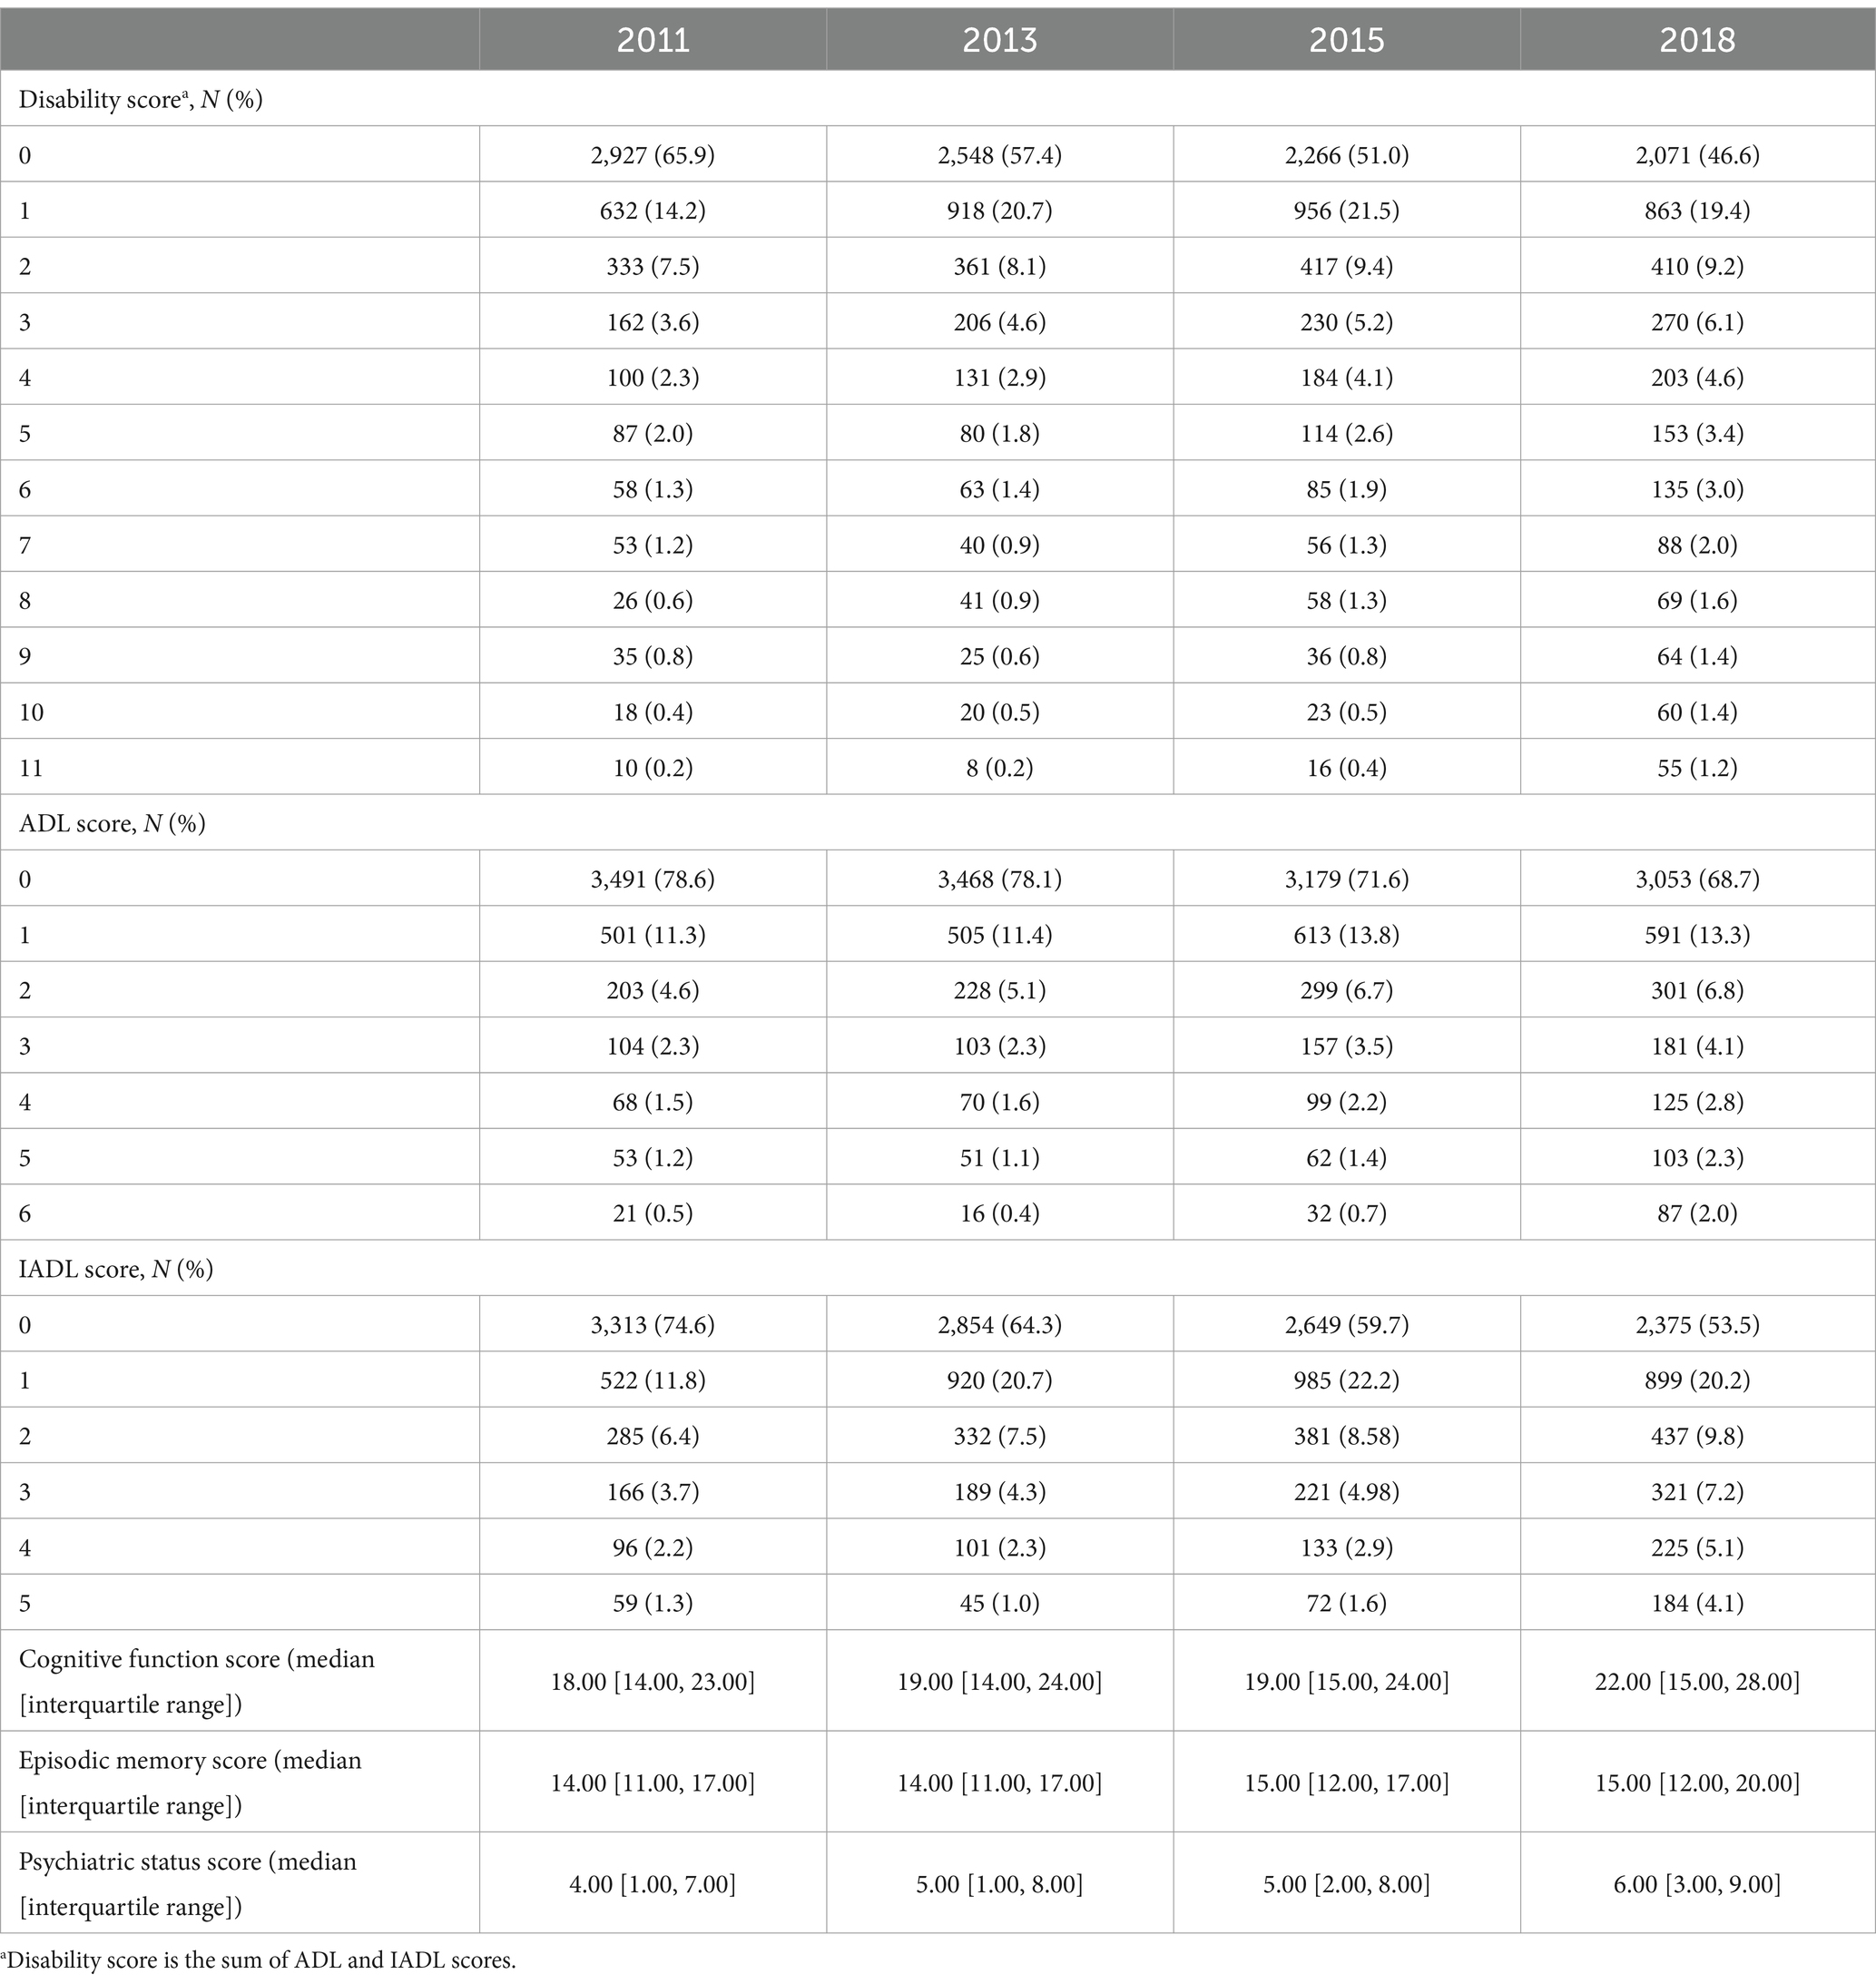
Table 2. Disability and cognitive function scores across the four survey waves (N = 4,441).
The cognitive function of the participants also deteriorated over the four waves of the survey, with the median cognitive function score increasing from 18 points in the 2011 wave to 19 points in 2013 and 2015, and 22 points in the 2018 wave. As an element of cognitive function, the psychiatric status worsened, with the median score rising from 4 points in 2011 to 5 points in 2013 and 2015, and 6 points in the 2018 wave. Meanwhile, deterioration in episodic memory occurred more slowly, with the median score increasing from 14 points in 2011 to 15 points in the 2018 wave.
Trajectories of disability and cognitive function
Three disability trajectories are shown in Figure 1. The trajectory with the consistently lowest level of disability was denoted the LOW group. This group (N = 2,341) maintained a low disability level across the four survey waves and accounted for 52.71% of the total participants. The participants (N = 1,774, 39.95%) with a somewhat higher disability level at baseline were categorized as the MIDDLE group. The disability score in this group started at a relatively low level, increased slowly from the 2011 to the 2015 wave, but then increased more rapidly in later years. The group with the highest baseline disability level, the HIGH group, contained the smallest number of participants (N = 326, 7.34%). The disability score of this group increased rapidly from 4 in 2011 to approximately 7 in the 2018 wave. The trajectories of disability assessed using ADL and IADL showed similar trends (Figure 1).
Figure 2 shows three cognitive function trajectories. The LOW group started with the best cognitive function and consistently maintained a score of approximately 14 points (out of 20) across the four survey waves. This group accounted for 34.81% of the total participants (N = 1,546). The MIDDLE group comprised participants with marked declines in cognitive function. In this group (N = 1,631, 36.73%), the cognitive function score was approximately 18 points in the 2011 wave, but dramatically increased to approximately 23 points in the 2018 wave. The HIGH group, i.e., the group with the worst cognitive function, had a baseline score of over 24 points, which rapidly increased to approximately 28 points by the 2018 wave, and represented 28.46% of the total respondents (N = 1,264). The trajectories of episodic memory and psychiatric status showed similar trends.
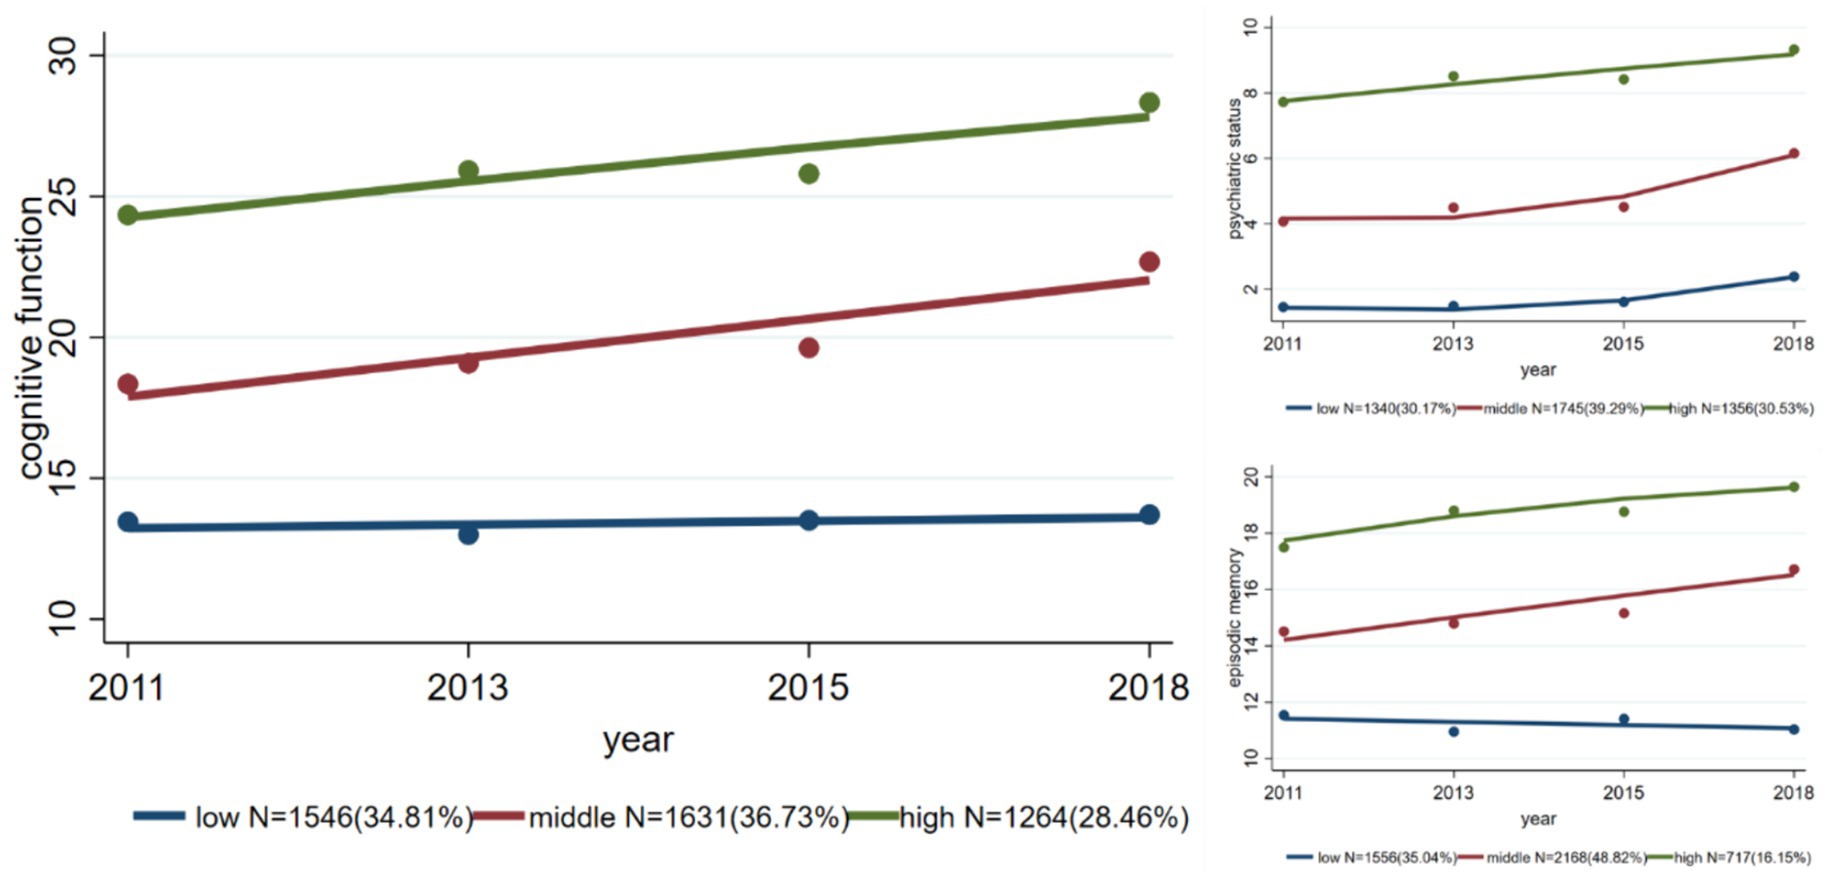
Figure 2. Trajectories of overall cognitive function, psychiatric status, and episodic memory.
Figure 3 shows the trajectories of cognitive function in the disabled and non-disabled subgroups. Although the trajectories of the three groups in each subgroup showed the same trend, the cognitive function scores in the disabled group were lower than those in the non-disabled group. In terms of the distribution of participants, the non-disabled subgroup had more participants in the LOW disability trajectory group (N = 1,147, 39.19%) than the disabled group did (N = 427, 28.20%), but had fewer participants in the MIDDLE (36.76% vs. 42.60%) and HIGH disability trajectory groups (24.05% vs. 29.19%).
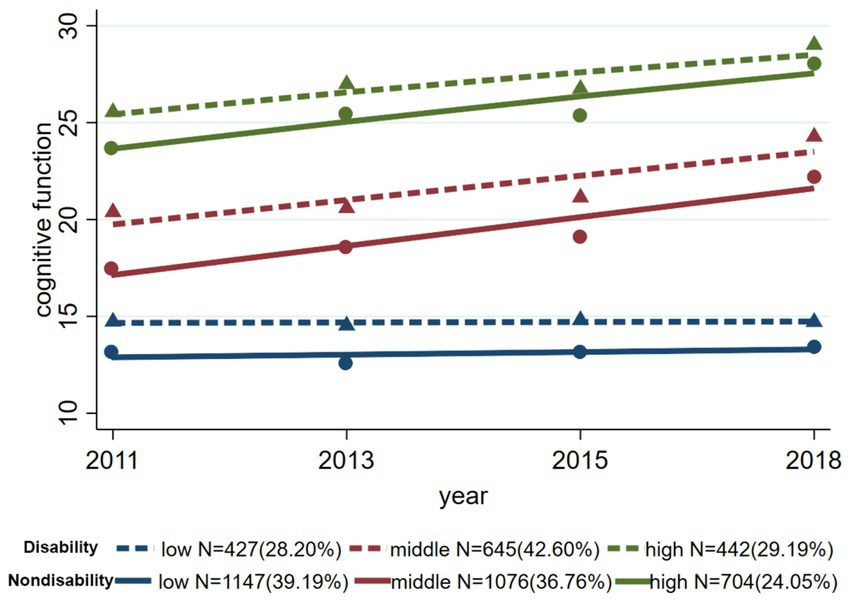
Figure 3. Trajectories of cognitive function in the disabled and non-disabled subgroups.
Factors influencing the trajectories of physical disability and cognitive function
The association between various factors and the trajectories of physical disability and cognitive function are shown in Figure 4. Compared with the LOW disability trajectory group, the risk factors for the MIDDLE group were an age of 70–79 years (odds ratio [OR]: 2.089; 95% confidence interval [CI]: 1.778, 2.456) or 80 years and older (3.879; 2.556, 5.887); being female (1.913; 1.654, 2.213); and living in the central (1.628; 1.392, 1.904) and western (1.697; 1.431, 2.012) regions of China. The protective factors were primary school (0.585; 0.501, 0.683), junior high school (0.370; 0.287, 0.477), or high school or above (0.446; 0.313, 0.635) education; urban residence (0.639; 0.510, 0.801); and an annual household income of RMB10,000–49,999 (0.765; 0.658, 0.890) or more than RMB50,000 (0.634; 0.487, 0.825). The risk and protective factors for the LOW and HIGH groups were similar, although the estimated ORs were slightly different.
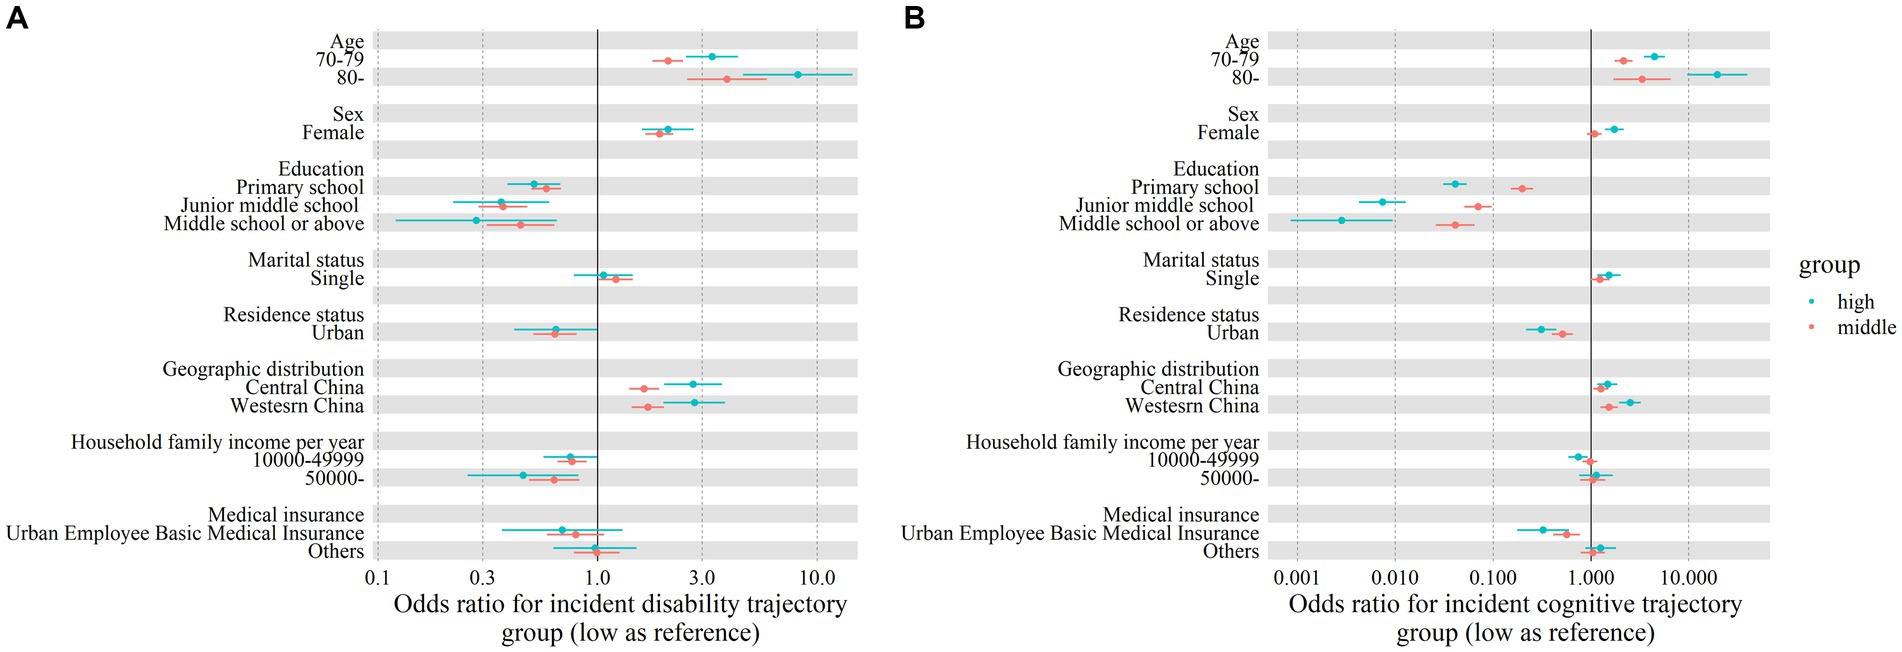
Figure 4. Odds ratios (ORs) and 95% confidence intervals (95% CIs) for factors associated with disability trajectory groups (A) and cognitive function trajectory groups (B). Solid dots and error bars, respectively, denote the OR and 95% CI estimates.
The factors associated with cognitive function trajectories were similar to those associated with physical disability trajectories. Compared with the LOW cognitive function trajectory group, the risk factors for the MIDDLE group were an age of 70–79 years (OR: 2.154; 95% CI: 1.745, 2.659) or 80 years and older (3.330; 1.697, 6.535); and living in the central (1.267; 1.058, 1.518) or western (1.534; 1.250, 1.812) regions of China. The protective factors for the MIDDLE group were primary school (0.198; 0.152, 0.256), junior high school (0.070; 0.051, 0.097), or high school or above (0.041; 0.026, 0.064) education; urban residence (0.512; 0.400, 0.655); and holding medical insurance for urban workers (0.565; 0.413, 0.775). The risk and protective factors for the LOW and HIGH group were similar, although the estimated ORs were slightly different (Figure 4).
The differences in baseline characteristics between the trajectory groups, for both the disabled and non-disabled subgroups, are shown in Table 3. All baseline characteristics were significantly different among the three trajectories of cognitive function, regardless of disability status.
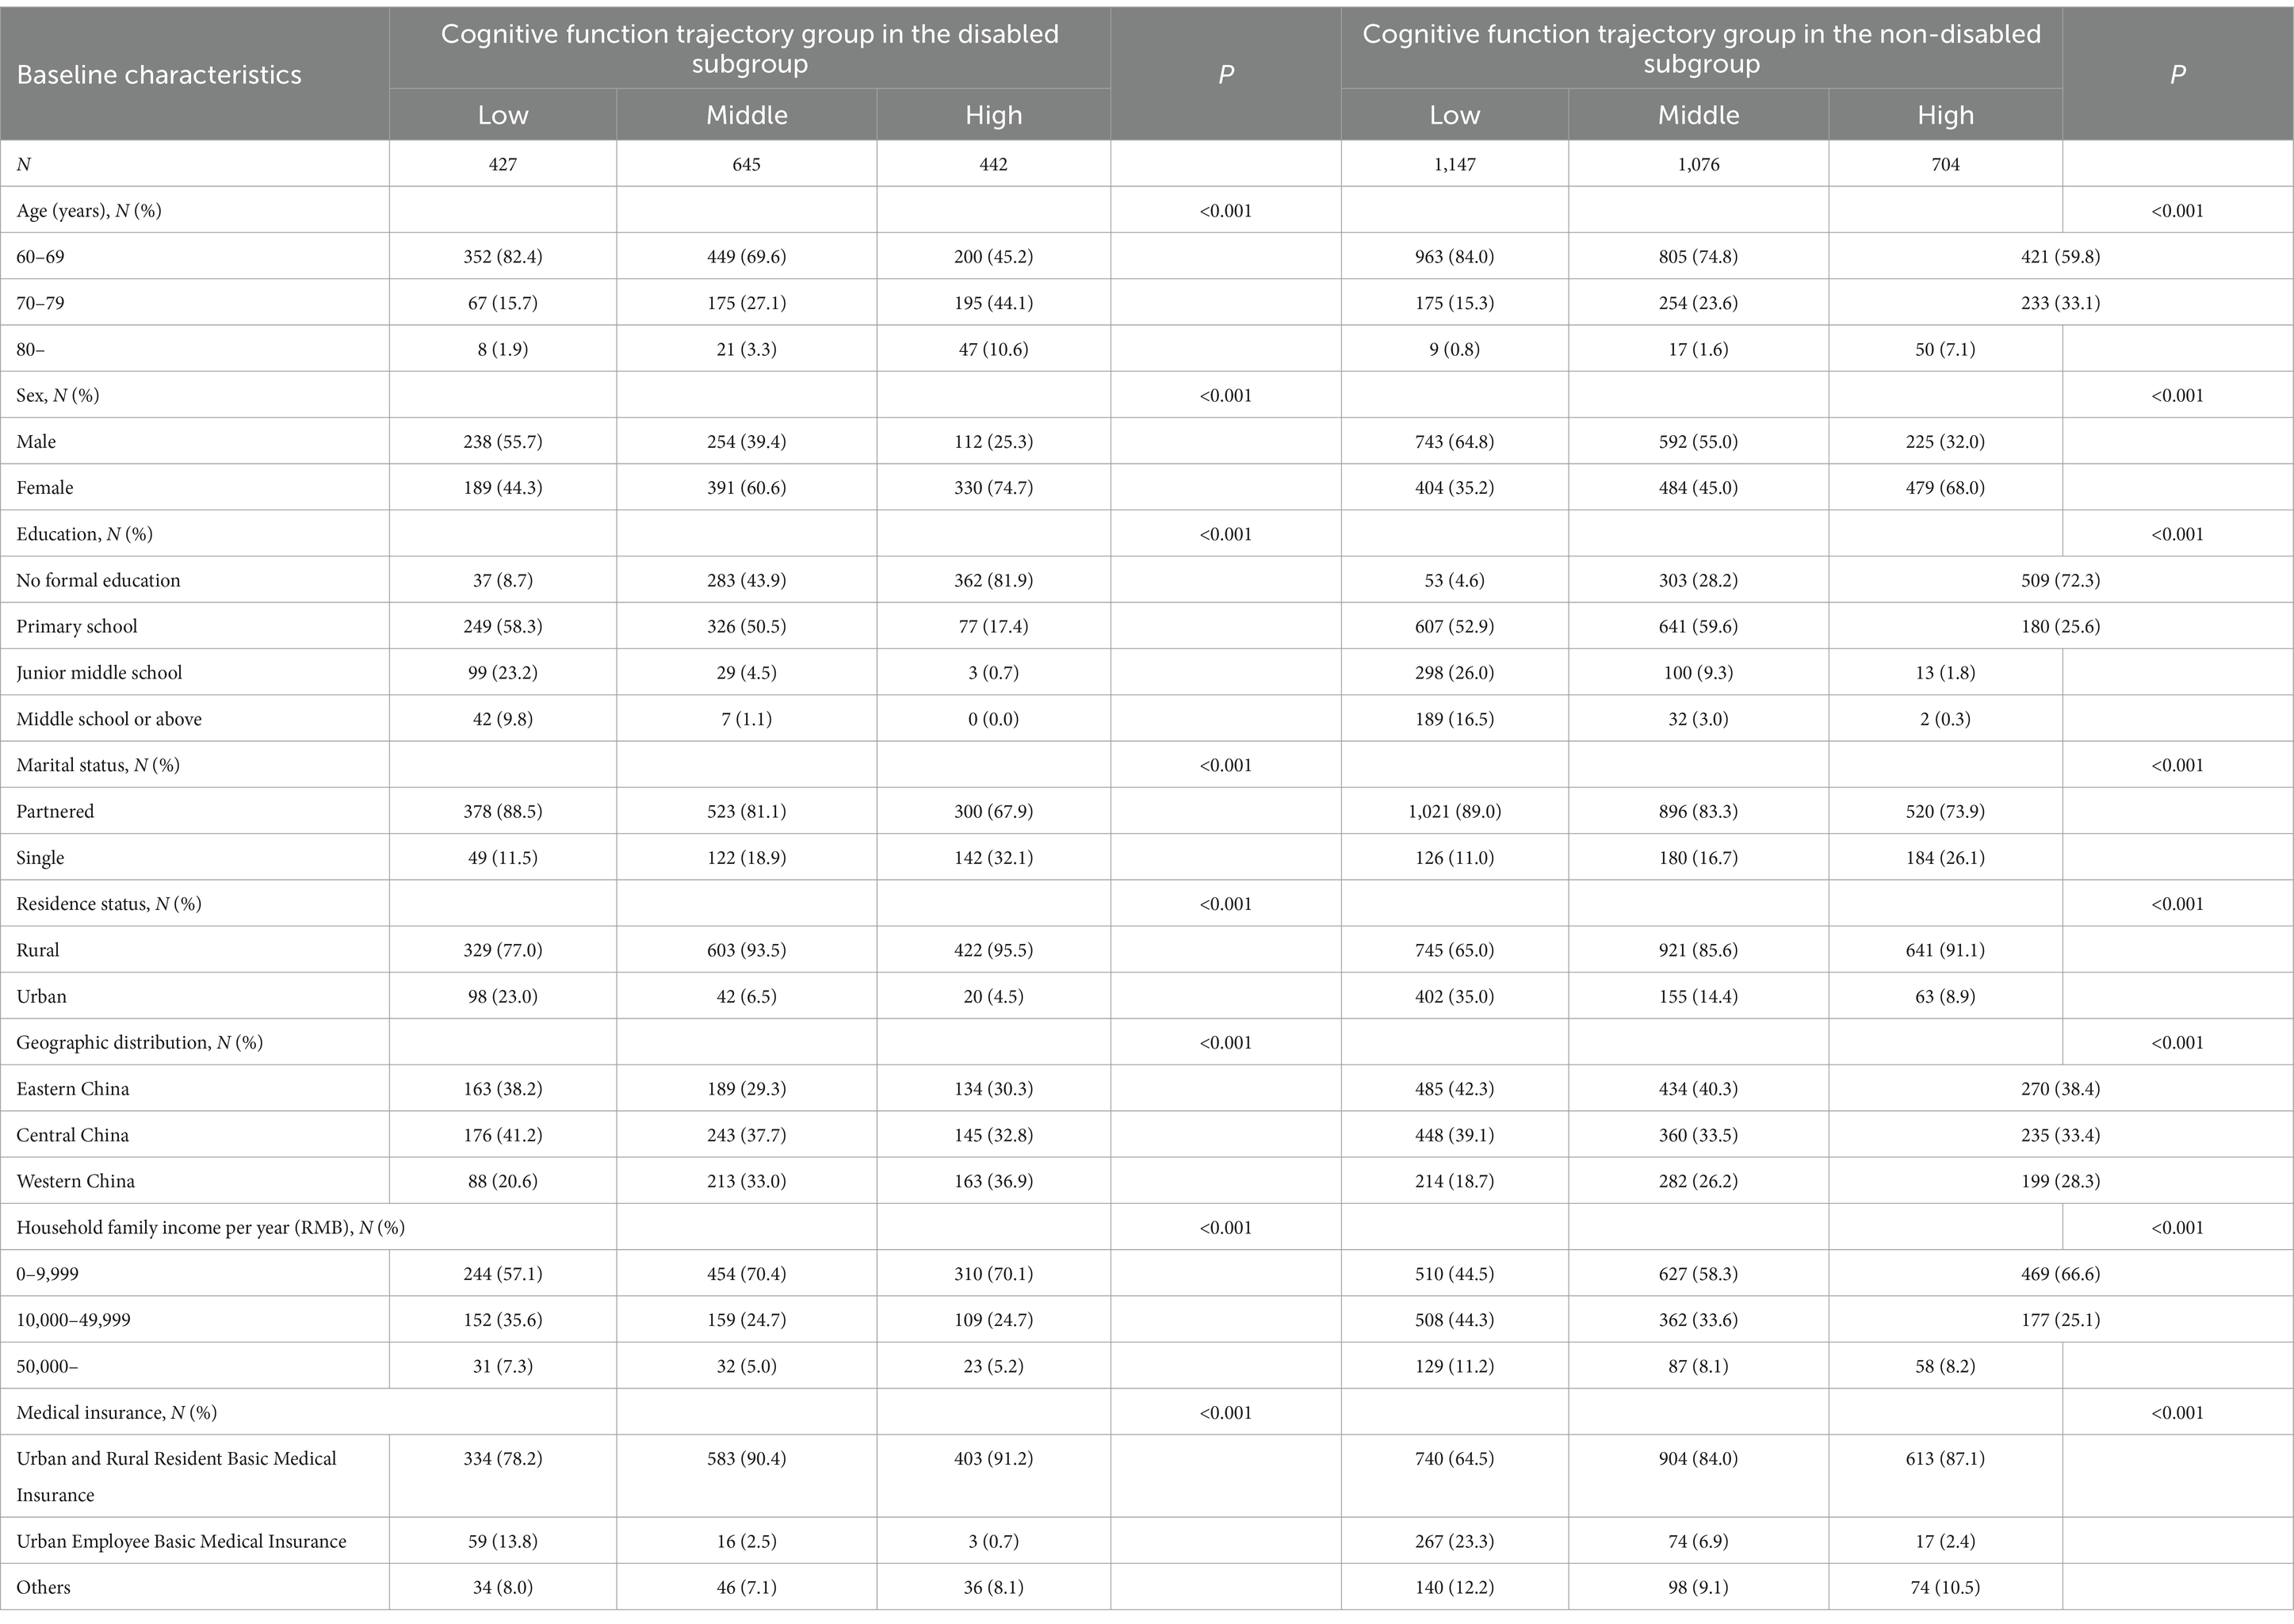
Table 3. Baseline characteristics of the groups in three cognitive function trajectories, by physical disability status.
Sensitivity analyses showed that when examining the factors influencing physical disability trajectories (Supplementary Table S1), cognitive function score was a risk factor for both the MIDDLE group (OR: 1.24; 95:CI: 1.14, 1.34) and HIGH group (1.67; 1.50, 1.85), compared to LOW disability group. No significant interaction effect of cognitive function score with any characteristics was founded. Baseline physical disability score was not associated with cognitive trajectories (Supplementary Table S2), although the interaction of medical insurance and physical disability score was significant. Fourteen types of available comorbidities are summarized in Supplementary Table S3. Hypertension was associated with high cognitive trajectory group (1.58; 1.22, 2.05), compared to low group, and might also interact with education and residence status (Supplementary Table S4) to affect cognitive function trajectory. Regarding physical disability trajectory, hypertension was associated with both middle (1.84; 1.55, 2.19) and high disability trajectory groups (2.08; 1.46, 2.95), but no significant interaction of hypertension with other characteristics was observed (Supplementary Table S5).
Discussion
Based on a large prospective cohort in China, three trajectories for cognitive function and physical disability were identified in people aged 60 and above. Compared with those free of disability at baseline, a larger proportion of older people with disability at baseline showed rapid cognitive deterioration. Furthermore, we found that the trajectories of cognitive function and disability shared mostly the same contributing factors.
The development trajectories of cognitive function in the older Chinese people included in this study were categorized into LOW, MIDDLE, and HIGH groups, representing groups with stable good cognitive function, slightly worse cognitive function with dramatic progression, and the lowest level of cognitive function at baseline followed by rapid progression, respectively. These group features were consistent with the findings of Su et al. in China, in a study that was also based on CHARLS data and applied GBTM (2022) (21), Casanova et al. in the UK (2020) (61), and Hamilton et al. in the US (2021) (22), suggesting that older people from different countries may display similar patterns of progression in cognitive degeneration. However, we did not find a reversal trajectory as observed by Summers et al. in an Australian population, in which 24.7% of people aged over 60 with mild cognitive impairment recovered to a level of unimpaired cognitive function over the following 20 months (62). Another study by Ye et al., based on the Chinese Longitudinal Healthy Longevity Survey cohort of Chinese people aged 65 and above and spanning 12 years, identified a group with a slight improvement in cognitive function over time. This group, accounting for 19.16% of the population, showed moderate levels of cognitive function at baseline and a slight increase in cognitive function by one point (20). The differences in the results of these studies may stem from variation in population characteristics, measurement tools, medical services, and other factors.
Because the causes of disability in older people are complex, the number and shape of disability trajectories have varied widely in previous studies (25, 26, 28, 63, 64). Nevertheless, regardless of the classification model, the disability trajectories of Chinese older people have consistently been categorized into three groups (24, 30, 31, 65–68). Most studies have shown that these groups exhibit the characteristics of a low disability level remaining consistent, a low baseline disability level followed by rapid development, and a high disability level with rapid development, respectively (24, 30, 65). These findings are in line with the trajectories identified in our study.
To the best of our knowledge, this is the first Chinese study to consider both disability and cognitive function together, which is of great significance in shedding light on co-morbidity in the older people. We found that the cognitive function levels in older people were characterized by the same three trajectories regardless of the presence or absence of physical disability at baseline. However, a greater proportion of the older individuals who had limitations in daily activities at baseline showed rapid declines in cognitive function post-baseline. These results to some extent validate the findings of Verlinden et al. (69), who established a link between cognitive function and disability; that is, dementia patients showed memory impairment, a decreased Mini Mental State Examination scale score, IADL restriction, and Basic Activities of Daily Living restriction in the 16 years before dementia diagnosis (69). In other words, physical disability in the older people accelerates the decline in cognitive function, which in turn worsens physical limitations.
In terms of the factors contributing to the identified trajectories of cognitive function, we found that more highly educated older people had higher baseline cognitive levels and were less likely to be on a rapid decline trajectory, which is consistent with previous findings (70–73). These results support the cognitive reserve hypothesis, which states that the brain is able to utilize available neural structures as a backup or reserve, and therefore education early in life can delay the clinical expression of dementia by influencing the brain’s pathological response. This hypothesis has been validated in animal models (74). Casanova et al. indicated that the most prominent predictor of cognitive trajectory is education level (61). Even education in later life has been shown to protect cognitive function (75). As the prevalence and incidence of dementia among the older people in China with low education levels are on the rise (76), we suggest that educational efforts targeting middle-aged and older Chinese adults with low education levels may help reduce their risk of dementia and rapid cognitive deterioration.
Our findings suggest that, to some extent, a high socio-economic status helps maintain a high level of cognitive function and physical ability. In particular, household income was only associated with the trajectory characterized by a low physical disability level at baseline followed by rapid development. As household income decreased, the probability of an older person following this trajectory increased significantly (OR1 = 0.765, OR2 = 0.634). This phenomenon is consistent with the finding of Nusselder (77) that low-income groups were more likely to follow a trajectory characterized by a sudden increase in disability, because they were at an increased risk of disabling chronic diseases due to behaviors that were not beneficial to their health. In addition, Taylor et al. found that education, while effective in preventing the onset of disability, was less effective in slowing the progression of disability at a certain level of income (47). In other words, income may play a more crucial role in preventing disability than education. Therefore, in areas with better economic status, education for the older people may delay dementia, while in economically disadvantaged areas, vigorous economic development and creating economic security for the older people would be effective in reducing the overall degree of disability.
Notably, this study is the first to find that the type of medical insurance also affects the baseline cognitive levels and rate of cognitive decline in older people. In China, medical insurance is divided into two categories: medical insurance for urban workers and medical insurance for urban and rural residents. The former mainly covers employees, and the latter covers urban and rural unemployed people and freelance workers, such as housewives and farmers. Compared with urban and rural residents with medical insurance, urban workers with medical insurance tend to have higher salaries, to enjoy more social security after retirement, and to live in better neighborhoods. In this study, the vast majority of the participants held medical insurance for urban and rural residents. They faced a greater risk of being on the trajectory characterized by the lowest baseline cognitive level and rapid cognitive decline post-baseline. Therefore, we posit that the association between the type of medical insurance and the trajectory of cognitive function exists because this essential indicator encompasses economic income, living environment, and other factors. However, this finding requires further validation through future studies.
We found that women were at a greater disadvantage than men in terms of both baseline cognitive level and rate of cognitive decline. This aligns with the findings of other studies in Chinese older people (17, 72). This association is likely to operate through the mediating effects of nutrition, education, and social participation. Due to traditional norms prevailing in China in the mid-20th century, men enjoyed a higher status in the family, prioritized access to scarce resources like education and food, and higher levels of social participation and social support. Women, in contrast, were more likely to experience malnutrition (45, 78, 79), possess a lower level of education, and face a lack of social interaction (80–82), all of which have been identified in previous studies as risk factors for dementia. Similar patterns have been observed in older people in other developing countries, such as Brazil (83).
In the current study, being partnered played a positive role in maintaining cognitive function in older people. Research has indicated that the impact of marriage on cognition is primarily explained by marital quality and the duration of widowhood. Individuals in high-quality marriages tend to receive emotional support and care from their spouses, so higher marital quality is often associated with higher cognitive function (84). Another study (2019) indicated that the converse was also true, i.e., the cognitive level of widowed older people was lower than that of their non-widowed counterparts, and the likelihood of cognitive decline increased with the duration of widowhood. However, the effects of stressful life events, such as widowhood, on people’s cognitive function were observed to be delayed, with a sharp decline in cognitive function emerging 4 to 6 years after late-life widowhood (85).
This study has some limitations. First, we identified the cognitive function trajectories of older people in disabled and non-disabled participants separately to explore the combined trajectory of physical disability and cognitive function, rather than identifying their covarying trajectory. This is due to the heterogeneity in the methods of assessing cognitive level and physical disability, with the former typically having a scoring system and the latter being assessed by the number of items of daily living in which impairments are experienced. Second, some potentially important variables were not included in the model due to their unavailability. For example, a large number of studies have confirmed that the APOE gene is a high-risk genetic factor for progression of dementia. Not adjusting for this factor may, to some extent, have biased the effect estimates of the factors that were tested.
Conclusion
In this study, the cognitive function trajectories of Chinese older people fell into three characteristic groups: those maintaining the highest level of cognitive function, those with a moderate baseline level of cognitive function and dramatic progression, and those with the lowest baseline level of cognitive function and rapid progression. The disability trajectories also fell into three characteristic groups: a consistently low disability level, a low initial disability level with rapid development, and a high baseline disability level with rapid development. Analyzing cognitive function and physical disability together, we found that compared with those without disability at baseline, a greater proportion of older people with disability at baseline experienced rapid cognitive deterioration. In addition, education, income, type of medical insurance, gender, and marital status were found to be instrumental in the progression of disability and cognitive function impairment in the older population. The results suggest that the Chinese government, focusing on the central and western regions and rural areas, should develop education for the older people and increase their level of economic security to slow the rate of cognitive function decline and disability among this age group in China. These could become important measures to cope with population aging.
Data availability statement
Publicly available datasets were analyzed in this study. This data can be found at: https://charls.charlsdata.com/pages/data/111/zh-cn.html.
Ethics statement
Ethical review and approval was not required for the study on human participants in accordance with the local legislation and institutional requirements. Written informed consent from the patients/participants or the patients’/participants’ legal guardian/next of kin was not required to participate in this study in accordance with the national legislation and the institutional requirements.
Author contributions
SC: Writing – review & editing, Conceptualization, Data curation, Formal analysis, Funding acquisition, Investigation, Methodology, Project administration, Resources, Software, Visualization, Writing – original draft. RY: Data curation, Validation, Writing – review & editing, Formal analysis, Investigation, Writing – original draft. KW: Data curation, Investigation, Methodology, Software, Visualization, Writing – review & editing, Writing – original draft. QW: Formal analysis, Methodology, Supervision, Validation, Writing – review & editing, Investigation. HZ: Project administration, Resources, Supervision, Writing – review & editing, Conceptualization. LL: Project administration, Resources, Supervision, Writing – review & editing. WC: Conceptualization, Data curation, Formal analysis, Funding acquisition, Methodology, Resources, Supervision, Writing – review & editing. LS: Conceptualization, Resources, Supervision, Writing – review & editing.
Funding
The author(s) declare that financial support was received for the research, authorship, and/or publication of this article. This work was supported by the National Natural Science Foundation of China (Grant No. 72274225) and Guangdong Basic and Applied Basic Research Foundation (Grant No. 2023A1515011725).
Conflict of interest
The authors declare that the research was conducted in the absence of any commercial or financial relationships that could be construed as a potential conflict of interest.
Publisher’s note
All claims expressed in this article are solely those of the authors and do not necessarily represent those of their affiliated organizations, or those of the publisher, the editors and the reviewers. Any product that may be evaluated in this article, or claim that may be made by its manufacturer, is not guaranteed or endorsed by the publisher.
Supplementary material
The Supplementary material for this article can be found online at: https://www.frontiersin.org/articles/10.3389/fpubh.2024.1380657/full#supplementary-material
References
1. World Health Organization . (2022). Ageing and health. Available at: https://www.who.int/zh/news-room/fact-sheets/detail/ageing-and-health (Accessed October 26, 2023)
2. El-Metwally, A, Toivola, P, Al-Rashidi, M, Nooruddin, S, Jawed, M, AlKanhal, R, et al. Epidemiology of Alzheimer's disease and dementia in Arab countries: a systematic review. Behav Neurol. (2019) 2019:3935943. doi: 10.1155/2019/3935943
3. Xiang, Y, Vilmenay, K, Poon, AN, Ayanian, S, Aitken, CF, and Chan, KY. Systematic review estimating the burden of dementia in the Latin America and Caribbean region: a Bayesian approach. Front Neurol. (2021) 12:628520. doi: 10.3389/fneur.2021.628520
4. Estimation of the global prevalence of dementia in 2019 and forecasted prevalence in 2050: an analysis for the global burden of disease study 2019. Lancet Public Health. (2022) 7:e105–25. doi: 10.1016/s2468-2667(21)00249-8
5. Li, F, Qin, W, Zhu, M, and Jia, J. Model-based projection of dementia prevalence in China and worldwide: 2020-2050. J Alzheimer's Dis. (2021) 82:1823–31. doi: 10.3233/jad-210493
6. Luo, Y, Su, B, and Zheng, X. Trends and challenges for population and health during population aging – China, 2015-2050. China CDC Weekly. (2021) 3:593–8. doi: 10.46234/ccdcw2021.158
7. Global, regional, and national incidence, prevalence, and years lived with disability for 310 diseases and injuries, 1990-2015: a systematic analysis for the global burden of disease study 2015. Lancet. (2016) 388:1545–602. doi: 10.1016/s0140-6736(16)31678-6
8. Partridge, L, Deelen, J, and Slagboom, PE. Facing up to the global challenges of ageing. Nature. (2018) 561:45–56. doi: 10.1038/s41586-018-0457-8
9. World Health Organization . (2015). World report on ageing and health. Available at: https://iris.who.int/handle/10665/186463 (Accessed October 26, 2023)
10. Anderson, ND . State of the science on mild cognitive impairment (MCI). CNS Spectr. (2019) 24:78–87. doi: 10.1017/s1092852918001347
11. Pandya, SY, Clem, MA, Silva, LM, and Woon, FL. Does mild cognitive impairment always lead to dementia? A review. J Neurol Sci. (2016) 369:57–62. doi: 10.1016/j.jns.2016.07.055
12. Saredakis, D, Collins-Praino, LE, Gutteridge, DS, Stephan, BCM, and Keage, HAD. Conversion to MCI and dementia in Parkinson's disease: a systematic review and meta-analysis. Parkinsonism Relat Disord. (2019) 65:20–31. doi: 10.1016/j.parkreldis.2019.04.020
13. Terrera, GM, Brayne, C, and Matthews, F. One size fits all? Why we need more sophisticated analytical methods in the explanation of trajectories of cognition in older age and their potential risk factors. Int Psychogeriatr. (2010) 22:291–9. doi: 10.1017/s1041610209990937
14. Marioni, RE, Proust-Lima, C, Amieva, H, Brayne, C, Matthews, FE, Dartigues, JF, et al. Cognitive lifestyle jointly predicts longitudinal cognitive decline and mortality risk. Eur J Epidemiol. (2014) 29:211–9. doi: 10.1007/s10654-014-9881-8
15. Xie, H, Mayo, N, and Koski, L. Identifying and characterizing trajectories of cognitive change in older persons with mild cognitive impairment. Dement Geriatr Cogn Disord. (2011) 31:165–72. doi: 10.1159/000323568
16. Smits, LL, van Harten, AC, Pijnenburg, YA, Koedam, EL, Bouwman, FH, Sistermans, N, et al. Trajectories of cognitive decline in different types of dementia. Psychol Med. (2015) 45:1051–9. doi: 10.1017/s0033291714002153
17. Chen, TY, and Chang, HY. Developmental patterns of cognitive function and associated factors among the elderly in Taiwan. Sci Rep. (2016) 6:33486. doi: 10.1038/srep33486
18. Wang, Z, Han, H, Liu, L, and Yu, H. A study of growth mixed models of different potential categories in older adults with mild cognitive impairment. Chinese J Dis Control Prevent. (2018) 22:925–8. doi: 10.16462/j.cnki.zhjbkz.2018.09.013
19. Yu, W, Chen, R, Zhang, M, Li, Z, Gao, F, Yu, S, et al. Cognitive decline trajectories and influencing factors in China: a non-normal growth mixture model analysis. Arch Gerontol Geriatr. (2021) 95:104381. doi: 10.1016/j.archger.2021.104381
20. Ye, L, Qin, L, Xie, B, and Zhu, J. Analysis of the heterogeneous development trajectory of cognitive function in the elderly and its influencing factors. Chinese J Health Stat. (2021) 38:183–7. doi: 10.3969/j.issn.1002-3674.2021.02.006
21. Su, J, and Xiao, X. Factors leading to the trajectory of cognitive decline in middle-aged and older adults using group-based trajectory modeling: a cohort study. Medicine. (2022) 101:e31817. doi: 10.1097/md.0000000000031817
22. Hamilton, CA, Matthews, FE, Donaghy, PC, Taylor, JP, O'Brien, JT, Barnett, N, et al. Prospective predictors of decline v. stability in mild cognitive impairment with Lewy bodies or Alzheimer's disease. Psychol Med. (2021) 51:2590–8. doi: 10.1017/s0033291720001130
23. Taniguchi, Y, Kitamura, A, Murayama, H, Amano, H, Shinozaki, T, Yokota, I, et al. Mini-mental state examination score trajectories and incident disabling dementia among community-dwelling older Japanese adults. Geriatr Gerontol Int. (2017) 17:1928–35. doi: 10.1111/ggi.12996
24. Hu, X . Research on the trends of elderly health from the perspective of life course [Doctor]. Hangzhou: Zhejiang University (2021).
25. Gardeniers, MKM, van Groenou, MIB, Meijboom, EJ, and Huisman, M. Three-year trajectories in functional limitations and cognitive decline among Dutch 75+ year olds, using nine-month intervals. BMC Geriatr. (2022) 22:89. doi: 10.1186/s12877-021-02720-x
26. Nusselder, WJ, Looman, CW, and Mackenbach, JP. The level and time course of disability: trajectories of disability in adults and young elderly. Disabil Rehabil. (2006) 28:1015–26. doi: 10.1080/09638280500493803
27. Tolea, MI, Morris, JC, and Galvin, JE. Trajectory of mobility decline by type of dementia. Alzheimer Dis Assoc Disord. (2016) 30:60–6. doi: 10.1097/wad.0000000000000091
28. Gill, TM, Gahbauer, EA, Han, L, and Allore, HG. The role of intervening hospital admissions on trajectories of disability in the last year of life: prospective cohort study of older people. BMJ. (2015) 350:h2361. doi: 10.1136/bmj.h2361
29. Li, C, Ma, Y, Hua, R, Zheng, F, and Xie, W. Long-term physical activity participation trajectories were associated with subsequent cognitive decline, risk of dementia and all-cause mortality among adults aged ≥50 years: a population-based cohort study. Age Ageing. (2022) 51:71. doi: 10.1093/ageing/afac071
30. Wei, M, Li, J, and Wang, H. Impact of the disability trajectory on the mortality risk of older adults in China. Arch Gerontol Geriatr. (2018) 74:174–83. doi: 10.1016/j.archger.2017.10.015
31. Yu, HW, Chen, DR, Chiang, TL, Tu, YK, and Chen, YM. Disability trajectories and associated disablement process factors among older adults in Taiwan. Arch Gerontol Geriatr. (2015) 60:272–80. doi: 10.1016/j.archger.2014.12.005
32. Huang, X, Zhang, M, and Fang, J. Growth patterns of activity of daily living disability and associated factors among the Chinese elderly: a twelve-year longitudinal study. Arch Gerontol Geriatr. (2022) 99:104599. doi: 10.1016/j.archger.2021.104599
33. Cao, G, Wang, K, Han, L, Zhang, Q, Yao, S, Chen, Z, et al. Visual trajectories and risk of physical and cognitive impairment among older Chinese adults. J Am Geriatr Soc. (2021) 69:2877–87. doi: 10.1111/jgs.17311
34. Li, N, Zhang, L, Du, W, Pang, L, Guo, C, Chen, G, et al. Prevalence of dementia-associated disability among Chinese older adults: results from a national sample survey. Am J Geriatric Psychiatry. (2015) 23:320–5. doi: 10.1016/j.jagp.2014.06.002
35. Han, L, Gill, TM, Jones, BL, and Allore, HG. Cognitive aging trajectories and burdens of disability, hospitalization and nursing home admission among community-living older persons. J Gerontol A Biol Sci Med Sci. (2016) 71:766–71. doi: 10.1093/gerona/glv159
36. Sverdrup, K, Bergh, S, Selbæk, G, Benth, J, Røen, IM, Husebo, B, et al. Trajectories of physical performance in nursing home residents with dementia. Aging Clin Exp Res. (2020) 32:2603–10. doi: 10.1007/s40520-020-01499-y
37. Mouchet, J, Betts, KA, Georgieva, MV, Ionescu-Ittu, R, Butler, LM, Teitsma, X, et al. Classification, prediction, and concordance of cognitive and functional progression in patients with mild cognitive impairment in the United States: a latent class analysis. J Alzheimer's Dis. (2021) 82:1667–82. doi: 10.3233/jad-210305
38. Zang, E, Shi, Y, Wang, X, Wu, B, and Fried, TR. Trajectories of physical functioning among US adults with cognitive impairment. Age Ageing. (2022) 51:139. doi: 10.1093/ageing/afac139
39. Grand, JH, Caspar, S, and Macdonald, SW. Clinical features and multidisciplinary approaches to dementia care. J Multidiscip Healthc. (2011) 4:125–47. doi: 10.2147/jmdh.S17773
40. Yu, L, Boyle, P, Wilson, RS, Segawa, E, Leurgans, S, De Jager, PL, et al. A random change point model for cognitive decline in Alzheimer's disease and mild cognitive impairment. Neuroepidemiology. (2012) 39:73–83. doi: 10.1159/000339365
41. Hayden, KM, Lutz, MW, Kuchibhatla, M, Germain, C, and Plassman, BL. Effect of APOE and CD33 on cognitive decline. PLoS One. (2015) 10:e0130419. doi: 10.1371/journal.pone.0130419
42. Zhu, Y, Li, C, Xie, W, Zhong, B, Wu, Y, and Blumenthal, JA. Trajectories of depressive symptoms and subsequent cognitive decline in older adults: a pooled analysis of two longitudinal cohorts. Age Ageing. (2022) 51:191. doi: 10.1093/ageing/afab191
43. Chou, CY, Chiu, CJ, Chang, CM, Wu, CH, Lu, FH, Wu, JS, et al. Disease-related disability burden: a comparison of seven chronic conditions in middle-aged and older adults. BMC Geriatr. (2021) 21:201. doi: 10.1186/s12877-021-02137-6
44. Cunningham, C, and Hennessy, E. Co-morbidity and systemic inflammation as drivers of cognitive decline: new experimental models adopting a broader paradigm in dementia research. Alzheimers Res Ther. (2015) 7:33. doi: 10.1186/s13195-015-0117-2
45. Borda, MG, Ayala Copete, AM, Tovar-Rios, DA, Jaramillo-Jimenez, A, Giil, LM, Soennesyn, H, et al. Association of malnutrition with functional and cognitive trajectories in people living with dementia: a five-year follow-up study. J Alzheimer's Dis. (2021) 79:1713–22. doi: 10.3233/jad-200961
46. Chen, YM, Tu, YK, Yu, HW, Chiu, TY, Chiang, TL, Chen, DR, et al. Leisure time activities as mediating variables in functional disability progression: an application of parallel latent growth curve modeling. PLoS One. (2018) 13:e0203757. doi: 10.1371/journal.pone.0203757
47. Taylor, MG . Capturing transitions and trajectories: the role of socioeconomic status in later life disability. J Gerontol B Psychol Sci Soc Sci. (2010) 65:733–43. doi: 10.1093/geronb/gbq018
48. Grotz, C, Meillon, C, Amieva, H, Andel, R, Dartigues, JF, Adam, S, et al. Occupational social and mental stimulation and cognitive decline with advancing age. Age Ageing. (2018) 47:101–6. doi: 10.1093/ageing/afx101
49. Clarke, PJ, Weuve, J, Barnes, L, Evans, DA, and Mendes de Leon, CF. Cognitive decline and the neighborhood environment. Ann Epidemiol. (2015) 25:849–54. doi: 10.1016/j.annepidem.2015.07.001
50. Chen, YM, Chiang, TL, Chen, DR, Tu, YK, Yu, HW, and Chiu, WY. Differing determinants of disability trends among men and women aged 50 years and older. BMC Geriatr. (2022) 22:11. doi: 10.1186/s12877-021-02574-3
51. Peking University . (2009). China health and retirement longitudinal study. Available at: https://charls.pku.edu.cn/ (Accessed January 13, 2022)
52. Peking University . (2013). China health and pension panel survey – 2011-2012 national baseline survey user manual. Available at: https://charls.charlsdata.com/Public/ashelf/public/uploads/document/2011-charls-wave1/application/Chinese_users__guide_20130407_.pdf (Accessed April 10, 2021)
53. Peking University . (2018). China health and retirement Longitudial study-wave 4 User’s guide. Available at: https://charls.charlsdata.com/Public/ashelf/public/uploads/document/2018-charls-wave4/application/CHARLS_2018_Users_Guide.pdf (Accessed April 10, 2021)
54. Zhou, Y, Chen, Z, Shaw, I, Wu, X, Liao, S, Qi, L, et al. Association between social participation and cognitive function among middle- and old-aged Chinese: a fixed-effects analysis. J Glob Health. (2020) 10:020801. doi: 10.7189/jogh.10.020801
55. Luo, Y, Pan, X, and Zhang, Z. Productive activities and cognitive decline among older adults in China: evidence from the China health and retirement longitudinal study. Soc Sci Med. (2019) 229:96–105. doi: 10.1016/j.socscimed.2018.09.052
56. Lei, X, Smith, JP, Sun, X, and Zhao, Y. Gender differences in cognition in China and reasons for change over time: evidence from CHARLS. J Econ Ageing. (2014) 4:46–55. doi: 10.1016/j.jeoa.2013.11.001
57. Mary Beth, O, Gwenith, GF, and Herzog, AR. Documentation of cognitive functioning measures in the health and retirement study. Ann Arbor, MI: Institute for Social Research, University of Michigan (2005).
58. Brandt, J, Spencer, M, and Folstein, M. The telephone interview for cognitive status. Neuropsychiatry Neuropsychol Behav Neurol. (1988) 1:111–7.
59. Nagin, DS, Jones, BL, Passos, VL, and Tremblay, RE. Group-based multi-trajectory modeling. Stat Methods Med Res. (2018) 27:2015–23. doi: 10.1177/0962280216673085
60. Jones, BL, and Nagin, DS. A note on a Stata plugin for estimating group-based trajectory models. Sociological methods. Research. (2012) 42:608–13. doi: 10.1177/0049124113503141
61. Casanova, R, Saldana, S, Lutz, MW, Plassman, BL, Kuchibhatla, M, and Hayden, KM. Investigating predictors of cognitive decline using machine learning. J Gerontol B Psychol Sci Soc Sci. (2020) 75:733–42. doi: 10.1093/geronb/gby054
62. Summers, MJ, and Saunders, NL. Neuropsychological measures predict decline to Alzheimer's dementia from mild cognitive impairment. Neuropsychology. (2012) 26:498–508. doi: 10.1037/a0028576
63. Mavandadi, S, Rook, KS, and Newsom, JT. Positive and negative social exchanges and disability in later life: an investigation of trajectories of change. J Gerontol B Psychol Sci Soc Sci. (2007) 62:S361–70. doi: 10.1093/geronb/62.6.s361
64. Kingston, A, Davies, K, Collerton, J, Robinson, L, Duncan, R, Kirkwood, TB, et al. The enduring effect of education-socioeconomic differences in disability trajectories from age 85 years in the Newcastle 85+ study. Arch Gerontol Geriatr. (2015) 60:405–11. doi: 10.1016/j.archger.2015.02.006
65. Wu, X . Types of disability development trajectories in the elderly in China: an application of group-based development modeling. Popolat Res. (2009) 33:54–67.
66. Zimmer, Z, Martin, LG, Nagin, DS, and Jones, BL. Modeling disability trajectories and mortality of the oldest-old in China. Demography. (2012) 49:291–314. doi: 10.1007/s13524-011-0075-7
67. Wu, X, and Liu, L. A study on the development trajectory of self-care ability of the elderly in China. Popul J. (2018) 40:59–71. doi: 10.16405/j.cnki.1004-129X.2018.04.005
68. Zhang, W, and Wang, D. The declining trajectory of the ability of the elderly to take care of themselves before the end of life. Popul J. (2020) 42:70–84. doi: 10.16405/j.cnki.1004-129X.2020.01.006
69. Verlinden, VJA, van der Geest, JN, de Bruijn, R, Hofman, A, Koudstaal, PJ, and Ikram, MA. Trajectories of decline in cognition and daily functioning in preclinical dementia. Alzheimers Dement. (2016) 12:144–53. doi: 10.1016/j.jalz.2015.08.001
70. Rusmaully, J, Dugravot, A, Moatti, JP, Marmot, MG, Elbaz, A, Kivimaki, M, et al. Contribution of cognitive performance and cognitive decline to associations between socioeconomic factors and dementia: a cohort study. PLoS Med. (2017) 14:e1002334. doi: 10.1371/journal.pmed.1002334
71. Hu, R, Zhou, W, Hong, Z, and Zhang, L. A study on the development trajectory of cognitive function in the elderly psychological monthly. Popul J. (2019) 14:170. doi: 10.19738/j.cnki.psy.2019.11.140
72. Hu, X, Gu, S, Sun, X, Gu, Y, Zhen, X, Li, Y, et al. Cognitive ageing trajectories and mortality of Chinese oldest-old. Arch Gerontol Geriatr. (2019) 82:81–7. doi: 10.1016/j.archger.2019.01.018
73. Zahodne, LB, Stern, Y, and Manly, JJ. Differing effects of education on cognitive decline in diverse elders with low versus high educational attainment. Neuropsychology. (2015) 29:649–57. doi: 10.1037/neu0000141
74. Milgram, NW, Siwak-Tapp, CT, Araujo, J, and Head, E. Neuroprotective effects of cognitive enrichment. Ageing Res Rev. (2006) 5:354–69. doi: 10.1016/j.arr.2006.04.004
75. Bindoff, AD, Summers, MJ, Hill, E, Alty, J, and Vickers, JC. Studying at university in later life slows cognitive decline: a long-term prospective study. Alzheimer's Dement. (2021) 7:e12207. doi: 10.1002/trc2.12207
76. Ding, D, Zhao, Q, Wu, W, Xiao, Z, Liang, X, Luo, J, et al. Prevalence and incidence of dementia in an older Chinese population over two decades: the role of education. Alzheimers Dement. (2020) 16:1650–62. doi: 10.1002/alz.12159
77. Nusselder, WJ, Looman, CW, and Mackenbach, JP. Nondisease factors affected trajectories of disability in a prospective study. J Clin Epidemiol. (2005) 58:484–94. doi: 10.1016/j.jclinepi.2004.09.009
78. Hsieh, PC, Wu, SC, Fuh, JL, Wang, YW, and Lin, LC. The prognostic predictors of six-month mortality for residents with advanced dementia in long-term care facilities in Taiwan: a prospective cohort study. Int J Nurs Stud. (2019) 96:9–17. doi: 10.1016/j.ijnurstu.2018.12.013
79. Zhang, Z, Gu, D, and Hayward, MD. Early life influences on cognitive impairment among oldest old Chinese. J Gerontol B Psychol Sci Soc Sci. (2008) 63:S25–33. doi: 10.1093/geronb/63.1.s25
80. Haaksma, ML, Rizzuto, D, Leoutsakos, JS, Marengoni, A, Tan, ECK, Olde Rikkert, MGM, et al. Predicting cognitive and functional trajectories in people with late-onset dementia: 2 population-based studies. J Am Med Dir Assoc. (2019) 20:1444–50. doi: 10.1016/j.jamda.2019.03.025
81. Béland, F, Zunzunegui, MV, Alvarado, B, Otero, A, and Del Ser, T. Trajectories of cognitive decline and social relations. J Gerontol B Psychol Sci Soc Sci. (2005) 60:P320–30. doi: 10.1093/geronb/60.6.p320
82. Griffin, SC, Mezuk, B, Williams, AB, Perrin, PB, and Rybarczyk, BD. Isolation, not loneliness or cynical hostility, predicts cognitive decline in older Americans. J Aging Health. (2020) 32:52–60. doi: 10.1177/0898264318800587
83. Castro-Costa, E, Dewey, ME, Uchôa, E, Firmo, JO, Lima-Costa, MF, and Stewart, R. Trajectories of cognitive decline over 10 years in a Brazilian elderly population: the Bambuí cohort study of aging. Cad Saude Publica. (2011) 27:S345–50. doi: 10.1590/s0102-311x2011001500004
84. Liu, H, Zhang, Z, and Zhang, Y. A national longitudinal study of marital quality and cognitive decline among older men and women. Soc Sci Med. (2021) 282:114151. doi: 10.1016/j.socscimed.2021.114151
Keywords: disability, cognitive function, aging, development trajectory, influencing factors
Citation: Cheng S, Yin R, Wu K, Wang Q, Zhang H, Ling L, Chen W and Shi L (2024) Trajectories and influencing factors of cognitive function and physical disability in Chinese older people. Front. Public Health. 12:1380657. doi: 10.3389/fpubh.2024.1380657
Edited by:
Matthew Lohman, University of South Carolina, United StatesReviewed by:
Feng Han, University of California, Berkeley, United StatesFrancesco Di Lorenzo, Santa Lucia Foundation (IRCCS), Italy
Copyright © 2024 Cheng, Yin, Wu, Wang, Zhang, Ling, Chen and Shi. This is an open-access article distributed under the terms of the Creative Commons Attribution License (CC BY). The use, distribution or reproduction in other forums is permitted, provided the original author(s) and the copyright owner(s) are credited and that the original publication in this journal is cited, in accordance with accepted academic practice. No use, distribution or reproduction is permitted which does not comply with these terms.
*Correspondence: Wen Chen, Y2hlbnc0M0BtYWlsLnN5c3UuZWR1LmNu; Leiyu Shi, bHNoaTJAamh1LmVkdQ==