 Qinghua Tian1,2†Yutong Yang1,2†Qi An1,2Yang Li1,2Qingyao Wang1,2Ping Zhang1,2Yue Zhang1,2Yingying Zhang1,2Lina Mu3Lijian Lei1,2*
- 1Department of Epidemiology, School of Public Health, Shanxi Medical University, Taiyuan, China
- 2MOE Key Laboratory of Coal Environmental Pathogenicity and Prevention, Shanxi Medical University, Taiyuan, China
- 3Department of Epidemiology and Environmental Health, School of Public Health and Health Professions, The State University of New York at Buffalo, Buffalo, NY, United States
Objective: To investigate the relationships between perfluoroalkyl and polyfluoroalkyl substances (PFASs) exposure and glucose metabolism indices.
Methods: Data from the National Health and Nutrition Examination Survey (NHANES) 2017–2018 waves were used. A total of 611 participants with information on serum PFASs (perfluorononanoic acid (PFNA); perfluorooctanoic acid (PFOA); perfluoroundecanoic acid (PFUA); perfluorohexane sulfonic acid (PFHxS); perfluorooctane sulfonates acid (PFOS); perfluorodecanoic acid (PFDeA)), glucose metabolism indices (fasting plasma glucose (FPG), homeostasis model assessment for insulin resistance (HOMA-IR) and insulin) as well as selected covariates were included. We used cluster analysis to categorize the participants into three exposure subgroups and compared glucose metabolism index levels between the subgroups. Least absolute shrinkage and selection operator (LASSO), multiple linear regression analysis and Bayesian kernel machine regression (BKMR) were used to assess the effects of single and mixed PFASs exposures and glucose metabolism.
Results: The cluster analysis results revealed overlapping exposure types among people with higher PFASs exposure. As the level of PFAS exposure increased, FPG level showed an upward linear trend (p < 0.001), whereas insulin levels demonstrated a downward linear trend (p = 0.012). LASSO and multiple linear regression analysis showed that PFNA and FPG had a positive relationship (>50 years-old group: β = 0.059, p < 0.001). PFOA, PFUA, and PFHxS (≤50 years-old group: insulin β = −0.194, p < 0.001, HOMA-IR β = −0.132, p = 0.020) showed negative correlation with HOMA-IR/insulin. PFNA (>50 years-old group: insulin β = 0.191, p = 0.018, HOMA-IR β = 0.220, p = 0.013) showed positive correlation with HOMA-IR/insulin, which was essentially the same as results that obtained for the univariate exposure-response map in the BKMR model. Association of exposure to PFASs on glucose metabolism indices showed positive interactions between PFOS and PFHxS and negative interactions between PFOA and PFNA/PFOS/PFHxS.
Conclusion: Our study provides evidence that positive and negative correlations between PFASs and FPG and HOMA-IR/insulin levels are observed, respectively. Combined effects and interactions between PFASs. Given the higher risk of glucose metabolism associated with elevated levels of PFAS, future studies are needed to explore the potential underlying mechanisms.
1 Introduction
Perfluoroalkyl and polyfluoroalkyl substances (PFASs) are a class of synthetic chemical that is widely used in various human production and daily life applications, such as paper, textiles, furniture, and foam fire extinguishers because of their thermal stability, hydrophobicity, and oil repellency (1–3). PFASs have high migration and contaminated ability and can be detected in environmental samples (such as water and soil), sera from various animal tissues, and human bodies (4–6). Additionally, PFASs have a significant bioaccumulation effect and a long half-life in the human body, making their degradation difficult (7). Animal experiments and epidemiological studies have demonstrated that PFASs have genotoxicity, reproductive toxicity, neurotoxicity, and developmental and endocrine-disrupting effects (8, 9).
There is growing evidence that PFASs are associated with a variety of health problems, with glucose metabolism disorder among them (10). Glucose metabolism disorder can cause many diseases, with diabetes being the most common, and has become a major public health issue (11). FPG, Insulin and homeostasis model assessment for insulin resistance (HOMA-IR) are important detection indices of glucose metabolism. FPG level was highly correlated with the presence of diabetic complications (12). Insulin is secreted by pancreatic β-cells, and human blood insulin levels can assess pancreatic β-cell function (13). Insulin resistance refers to the target organs of insulin action, such as liver, muscle and other reduced sensitivity to insulin action, and the normal physiological response of insulin cannot be performed (14). The most widely used assessment of insulin resistance is HOMA-IR (15). Early identification and control of these indices can reduce the harm of glucose metabolism disorder to the body and improve the prognosis.
Currently, epidemiological studies on the effects of PFASs on glucose metabolism have yielded conflicting and inconclusive results. The Diabetes Prevention Project analyzed the relationship between serum PFASs concentrations and blood glucose indices and found that perfluorooctane sulfonates acid (PFOS) and perfluorooctanoic acid (PFOA) concentrations were positively associated with the function of HOMA-IR, fasting blood glucose and β cells function (1). The level of serum PFASs 1871 adults was measured in the 2013–2014 National Health and Nutrition Examination Survey (NHANES) in the United States revealed that branched-chain PFOA level was positively correlated with increased FPG (10). However, a study on obese children in Ohio found no statistical significance between PFASs and blood glucose levels (16). Nelson et al. analyzed data from NHANES (2003–04) and found no significant association between the PFASs (PFOA, perfluorononanoic acid (PFNA), PFOS, and perfluorohexane sulfonic acid (PFHxS)) and HOMA-IR (2). Although several studies demonstrated a positive association between serum PFASs levels and glucose metabolism indices, various studies have also determined there to be a non-significant or inverse association. Therefore, further investigation into the relationships between PFASs exposure and glucose metabolism is warranted.
At present, the mechanism of PFASs affecting glucose metabolism is also not clear, and some researchers believe that it may be related to the activation of Peroxisome proliferator activated receptors (PPAR) (17, 18). PPAR belongs to the nuclear hormone receptor superfamily that regulates lipid, hormonal, and glucose metabolism and is considered possibly the major target of PFASs (19). PFASs can activate signaling pathways mediated by all PPAR isoforms (PPARα, PPARβ, PPARγ) (20). Moreover, PPARα may be a preferential target for PFAS above the other PPAR isoform (21). Toxicological studies have found that PFOA can also increase insulin sensitivity and glucose tolerance in mice by affecting the PI3K-AKT signaling pathway in the liver, causing an increase in fasting blood glucose level and a decrease in liver glycogen content in mice (22).
Additionally, most of the previous studies have focused on the biological toxicity of individual PFASs; however, in real-life settings, multiple PFASs often co-exist and interact during exposure, uptake, and metabolism processes, and this interaction can result in complex effects on body glucose metabolism. Currently, the specific effects of combined exposure to multiple PFASs on glucose metabolism remain unknown. Therefore, to provide new evidence on the relationships of PFASs exposure and glucose metabolism, we aimed to examine the relationships between exposure to multiple PFASs and glucose metabolism indices in this study by analyzing the NHANES data from 2017 to 2018, using the Least absolute shrinkage and selection operator (LASSO) and multiple linear regression analysis and Bayesian kernel machine regression (BKMR) models.
2 Materials and methods
2.1 Study population
Data on the study participants were obtained from the NHANES databases. NHANES is a unique 2 years cross-sectional survey of the health and nutrition status of the U.S. population that collects data on demographic, socioeconomic, and health-related issues through interviews, standardized exams, and biometric specimen collection. The health screening was conducted at a mobile Screening Center (MEC) after the participants had already participated in a household interview. The methods and processes used by NHANES for data collection are available on NHANES website1. In the current study, we used data from 2017–2018 wave which is the latest test data on PFASs in NHANES.
The total sample size in 2017–2018 was 9,254, of which 1929 were tested for serum PFASs. Considering that type 1 diabetes mellitus accounts for about 90% of total diabetes in children and adolescents and is the most common form of childhood diabetes in most parts of the world (23); at the same time, pregnant women are at risk of gestational diabetes mellitus. 14% of pregnant women worldwide are affected by gestational diabetes mellitus which is a global health problem, affecting a considerable number of pregnant women (24). Therefore, 313 individuals <20 years old, 1,005 individuals who were pregnant, taking anti-hyperglycemic drugs or missed main research indices were excluded. Finally, a total of 611 individuals were included in this study. The National Center for Health Statistics Research Ethics Review Board approved NHANES, and all participants provided written informed consent. The selection process of research participants is summarized in Figure 1.
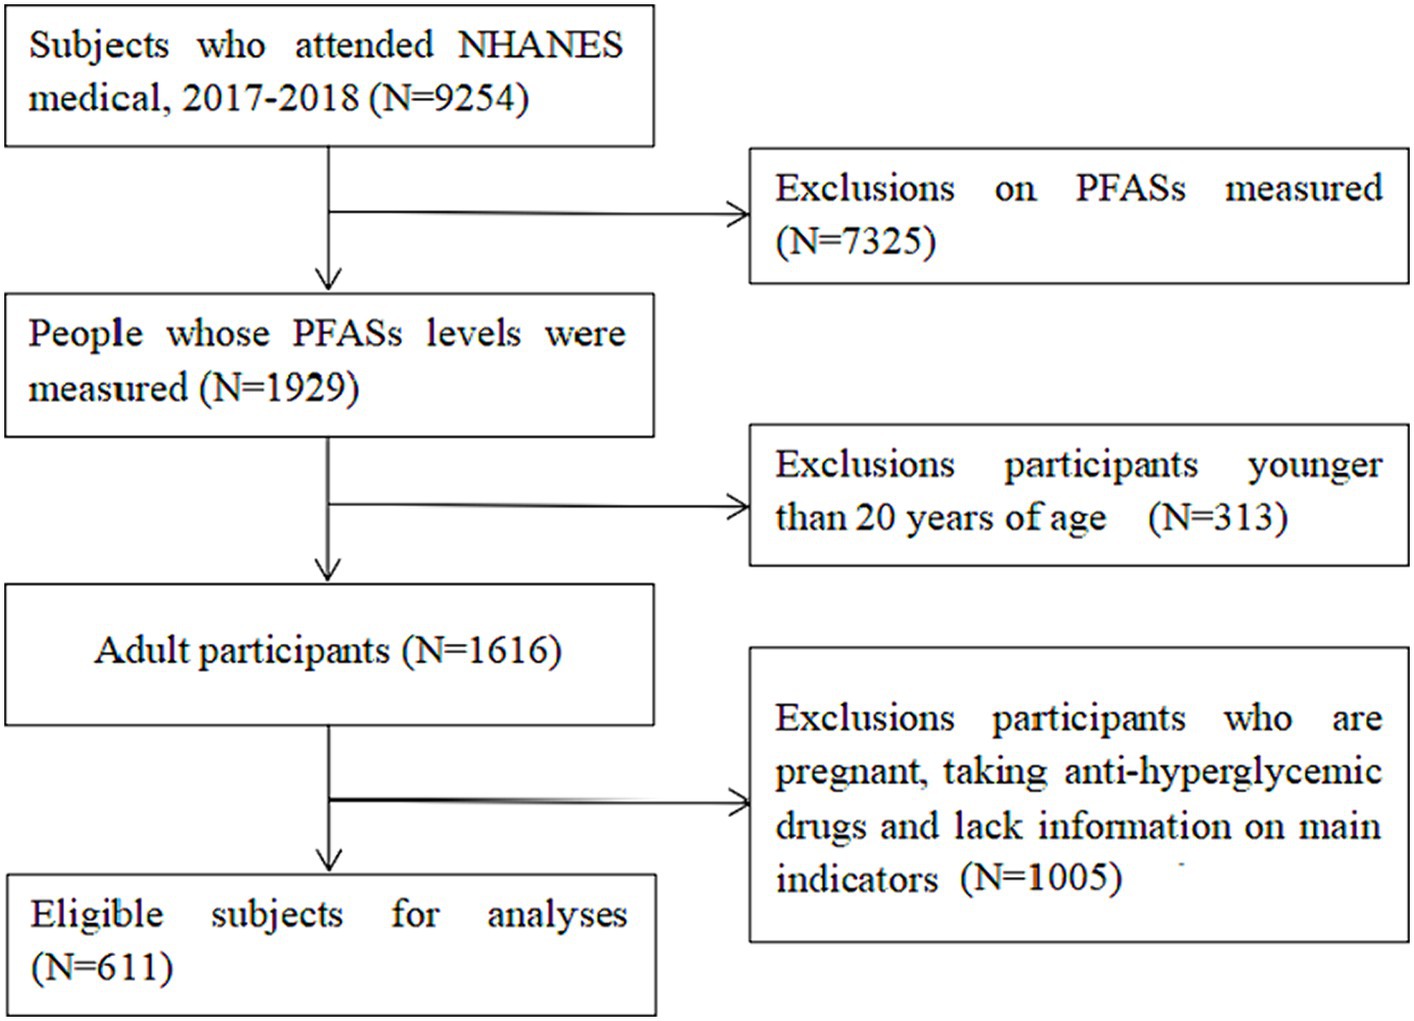
Figure 1. NHANES database research participants screening flow chart. (Data screening from top to bottom as indicated by the arrow).
2.2 Covariates
The demographic database provided information on the gender (male, female), age, race (mexican-American, other Hispanic, non-Hispanic white, non-Hispanic blacks, other races), marital status (married, bereaved spouse, divorce, separation, unmarried, cohabitation), poverty, and education level (less than high school education, high School Degree, university and above). Information on weight and body mass index (BMI) were obtained from obtained from Examination database. Information on smoking, alcohol and leisure-time physical activity were obtained from Questionnaire database. Smoking status was classified as never smoking (fewer than 100 cigarettes or other tobacco products in their life), previously smoking (over 100 cigarettes or other cigarettes in their life but now quit smoking), and currently smoking (100 cigarettes or other cigarettes in their life and still smoking). Drinking status was classified as never drinking (no kind of alcohol in their life), previously smoking (drinking previously, but not in the past 12 months), and now smoking (drinking in the past 12 months). Leisure-time physical activity for each participant was categorized based on the recommended weekly amount of moderate-intensity to vigorous-intensity activity as follows: (1) below, indicating less than 150 min per week; (2) meet, indicating 150 to 300 min per week; (3) exceed, indicating more than 300 min per week.
2.3 Laboratory measurement methods
2.3.1 Blood specimen collection
Each study participants need to meet the 8 to less than 24 h fasting criteria and draw venous blood in a fasting state. The phlebotomist collected study participant’s peripheral venous blood into 2 mL gray tubes for FPG and into 15 mL red top tubes for PFASs and insulin. Centrifuge the 2 mL gray tube to yield plasma and transfer at least 0.5 mL plasma from this tube into 2 mL vessels. Centrifuge the red top tubes to yield serum and remove serum into 5 mL sterile cryovials for PFASs and 2 mL vessels for insulin. Store under appropriate frozen (−30°C) conditions until they are tested.
2.3.2 Measurement of serum PFASs concentration
Online solid phase extraction coupled to high-performance liquid chromatography-turbo ion spray ionization-tandem mass spectrometry was used for the quantitative detection of the PFASs. A total of six perfluorinated compounds, including PFOA, PFOS, perfluorodecanoic acid (PFDeA), PFHxS, PFNA, and perfluoroundecanoic acid (PFUA), were analysed in this study. Notably, the PFOA and PFOS used in this manuscript refer to the sum of linear and branched. (The description of measurements of PFASs for NHANES 2017–2018 presents n-perfluorooctanoic acid (n-PFOA), Branch perfluorooctanoic acid isomers (Sb-PFOA), n-perfluorooctane sulfonic acid (n-PFOS), Perfluoromethylheptane sulfonic acid isomers (Sm-PFOS)). The limits of detection (LOD) of the six PFASs were all 0.1 ng/mL. Following NHANES analysis guidelines, PFASs below the LOD were expressed using LOD/ √2 . Details on the analytical methodology can be found on the NHANES website2.
2.3.3 Measurement of glucose metabolism indices
FPG were determined by hexokinase initiation using the Roche/Hitachi cobas c system (c311). Insulin was measured using the Tosoh AIA system analyzer. Homeostasis model assessment for insulin resistance (HOMA-IR) was calculated as follows: HOMA-IR = FPG (mmol/L) × insulin (mIU/L)/22.5.
2.4 Statistical analysis
We calculated weighted means (±standard deviation [SD]) using the NHANES primary sampling unit, strata, and weights of environmental samples for continuous variables and frequencies (proportions) for categorical variables. Means and standard deviations (SDs) for continuous variables with normally distributed distribution, medians and interquartile ranges (IQRs) for continuous variables with non-normally distributed distribution, and proportions for binary or categorical variables were displayed. The distributions of serum PFAS were generally right-skewed, therefore, were ln-transformed was conducted. Spearman correlation analysis were presented using correlation heat maps.
Cluster analysis was performed based on the concentration of PFASs. K-means algorithm is the most used clustering method, which is simple to operate, computationally efficient, so K-means algorithm was used in this study (25). First, the logarithmic transformation of PFASs concentration was performed to achieve an approximate normal distribution. After the data was standardized, the index of sum of squared error provided by Factoextra package in R 4.2.2 was used to determine the optimal number of clusters. The overall population was divided into separate subgroups using the k-means algorithm. The ratio of the average concentration in each subgroup to the average concentration in the total participants of each PFASs was calculated to further assess the exposure level. The Kruskal–Wallis H and Chi-square tests were used to compare differences in baseline information and the levels of glucose metabolism indices between subgroups. Variables showing significant differences (p < 0.05) were used as covariates for multiple liner regression analysis to control for potential confounding factors.
Since diabetes is often diagnosed before the age of 50 (26); people under the age of 50 are the most active workforce, the working group affected by diabetes imposes a high economic burden on the country, so the study of glucose metabolism in people under 50 is significant (27); considering that glucose metabolism indices are easily influenced by age and the age range of the study population was large, the study participants were categorized into two groups: ≤50 years old and >50 years old for correlation and regression analyses. Next, The Kruskal–Wallis H test was used to compare differences in PFASs levels between different age groups. Then, the mixed effects of PFASs were analyzed using LASSO and BKMR models.
To explore the association of single PFASs with glucose metabolism indices in the mixture of PFASs exposure, and to avoid the potential collinearity among the variables included in the regression model, the multi-PFASs exposure model was established using LASSO regression for the six PFASs based on adjusting the confounding factors of sex, age, alcohol consumption, race, leisure-time physical activity, BMI, weight and poverty ratio. The coefficient distribution of these six PFASs was used as the penalty parameter for LASSO regression path selection, and the PFASs related to glucose metabolism indices were screened using five cross-validations. Subsequently, the selected elements of PFASs were included in the multiple linear regression model and analyzed the regression coeffcients and 95% confidence intervals (95% CI). The variance inflation factor (VIF) was calculated to evaluate the multicollinearity of PFASs in the model. It is generally believed that if the VIF of an independent variable is >10, there is a multicollinearity problem between the independent variable and other independent variables.
Furthermore, we used the BKMR model as part of the sensitivity analysis and further explored the mixed effects of multiple PFASs exposure on glucose metabolism indices. BKMR utilizes a flexible non-parametric approach to assess dose–response relationships, overcoming the disadvantage that conventional methods may be limited by multicollinearity and model selection error, to more reliably assess the health effects of environmental chemical mixtures (28). This study used the BKMR model to present the cumulative effect of the mixture of the six PFASs, the univariate expose-response relationships between PFASs and glucose metabolism indices and the interactions among individual PFASs. The BKMR analysis included the same covariates as the LASSO regression and calculated the posterior inclusion probability (PIP) to quantify the relative importance of each element to glucose metabolism, with values ranging from 0 to 1. The “BKMR” and “ggplot2” packages of R4.2.2 were used to build the BKMR model and present the results. The data were combined and analyzed using R4.2.2 software, and p < 0.05 was presented at the significance level.
3 Results
3.1 General condition of the study participants and distribution of blood PFASs
As shown in Table 1, 611 participants were included in this study comprising 308 males and 303 females, which accounted for 50.4 and 49.6% participants, respectively. Never smokers and individuals with a history of alcohol consumption accounted for 56.3 and 91.3%, respectively, and the median age was 53 years.
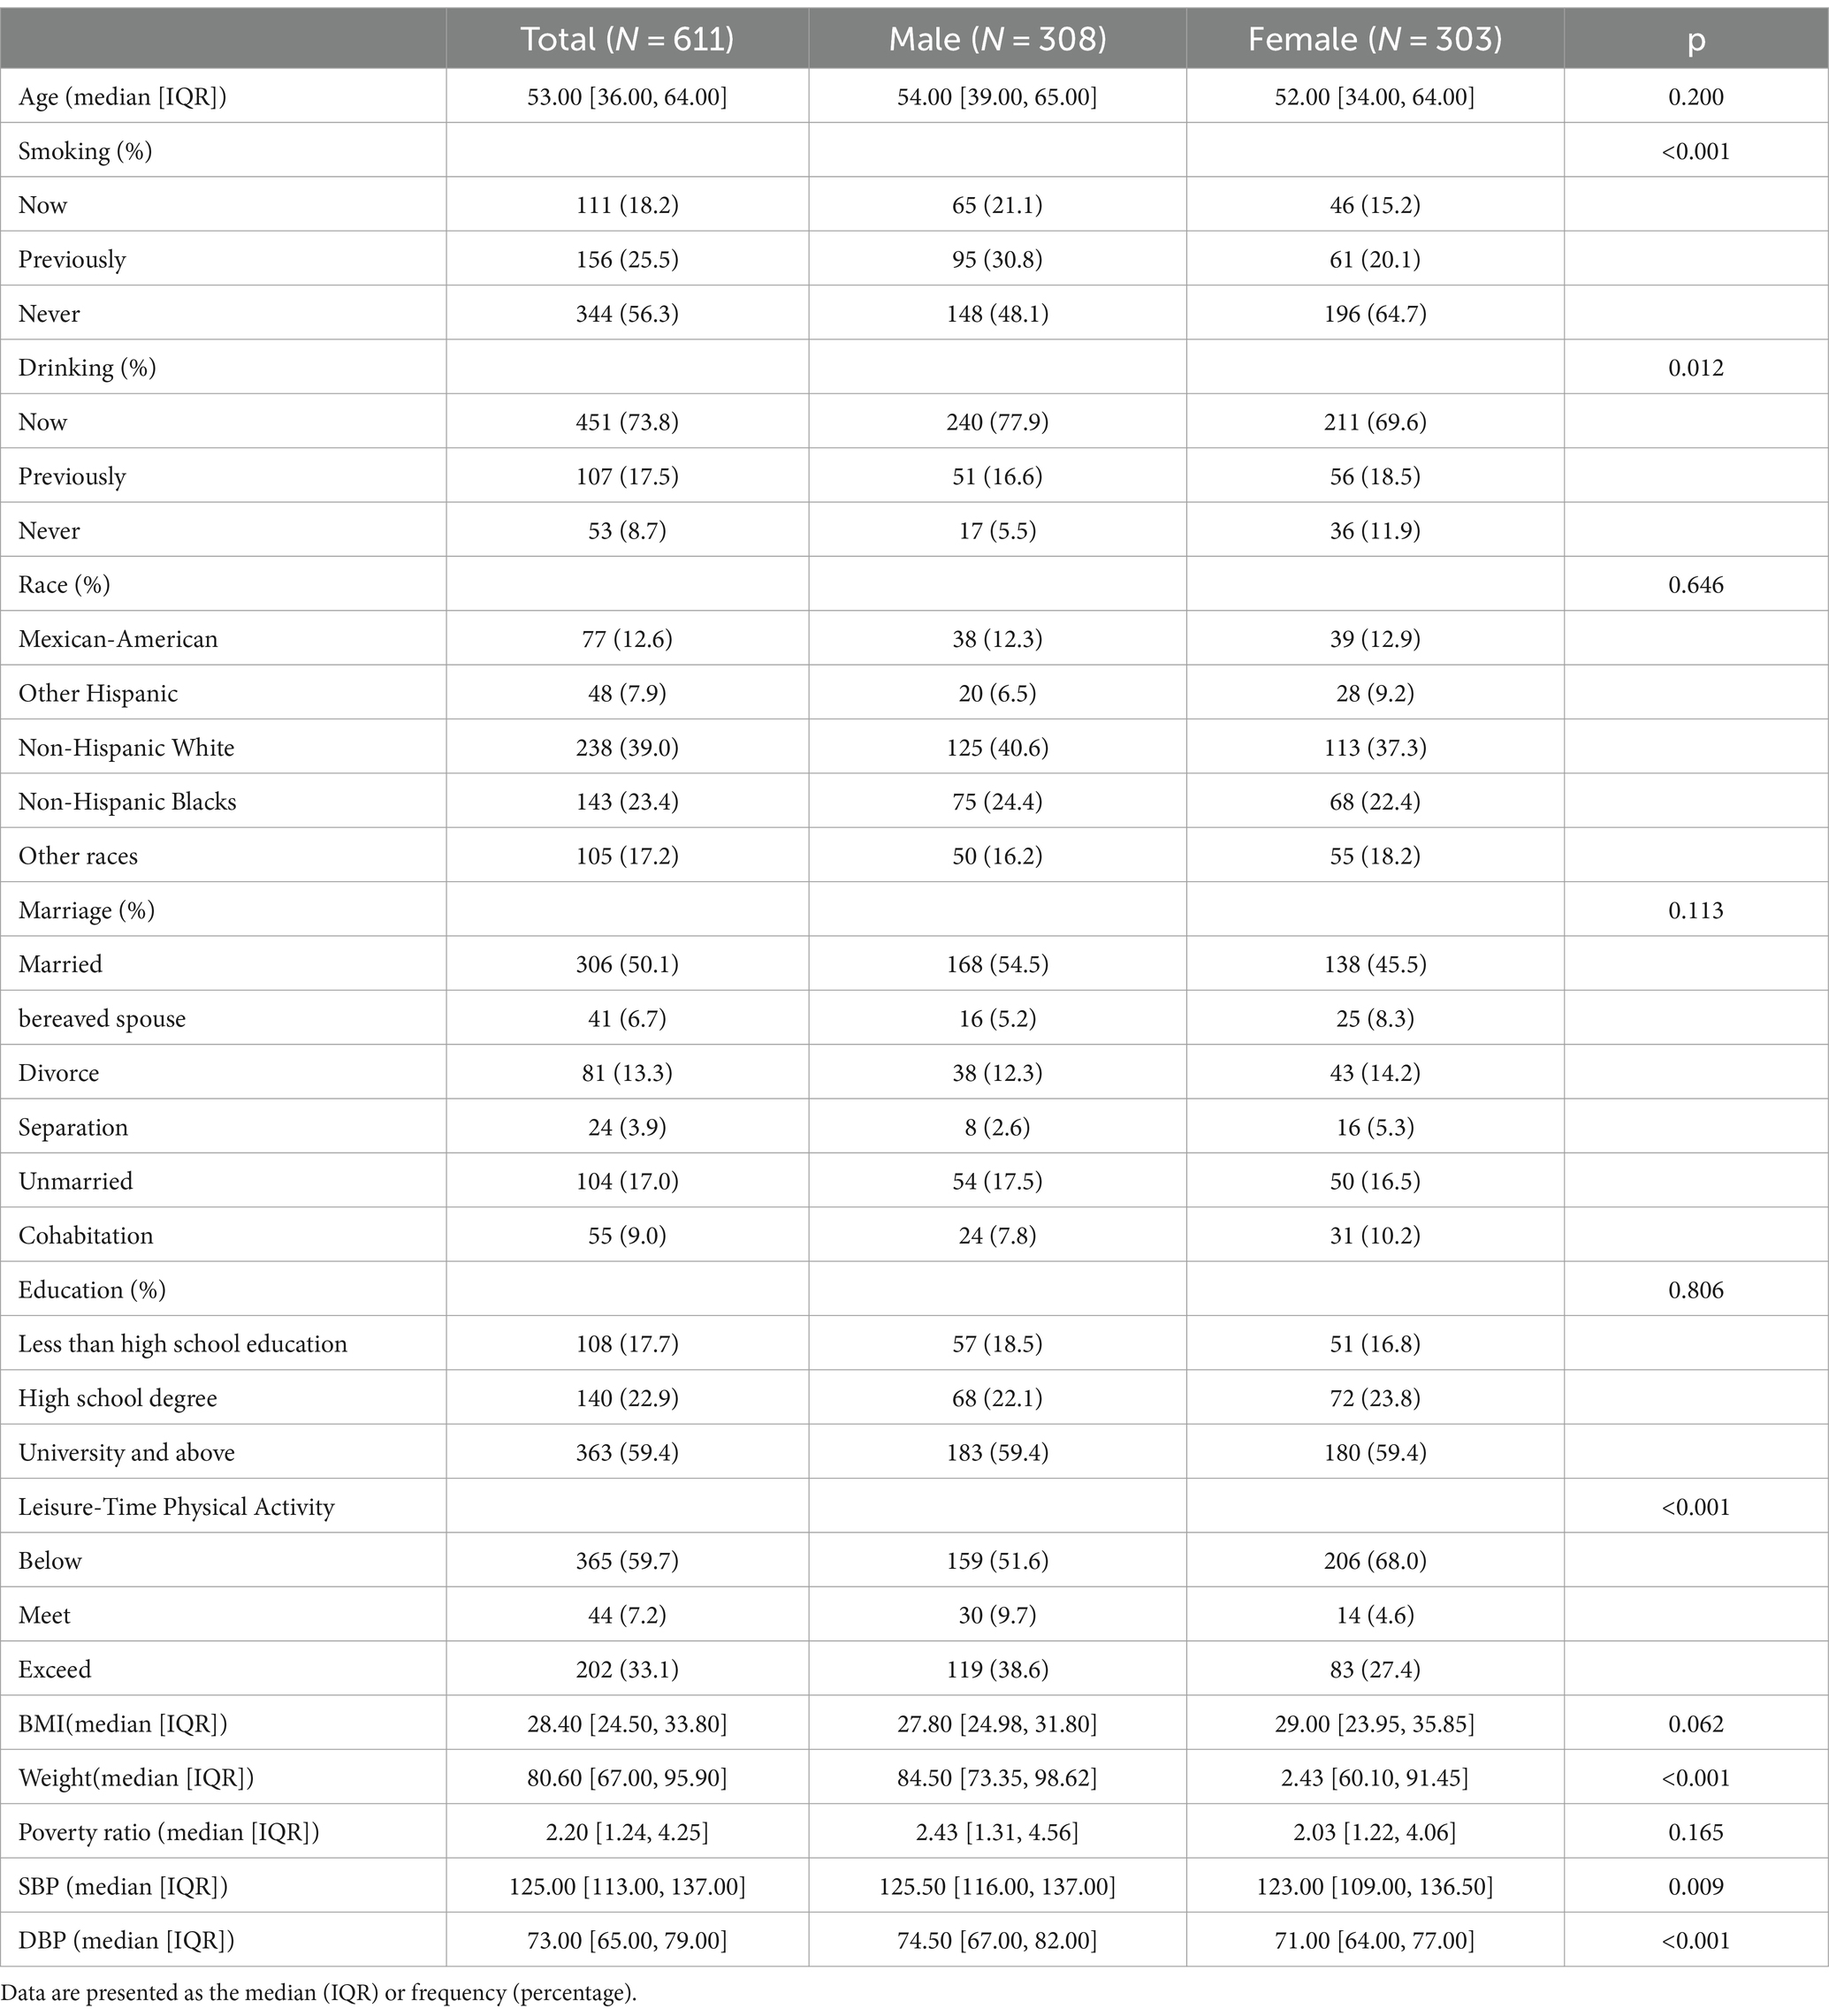
Table 1. Basic characteristics of study participants, grouped by gender (N (%)/M (P25, P75)).
Except for PFUA, the blood detection rate of the other five PFASs exceeded 85%. The detection rate and concentration of PFASs in the blood of the study participants are presented in Table 2. Figure 2 illustrates that the correlation coefficients between PFDeA and PFUA, PFNA and PFUA, and PFNA and PFDeA were 0.85, 0.71, and 0.72, respectively. This suggests a strong correlation between some PFASs (rs > 0.7).
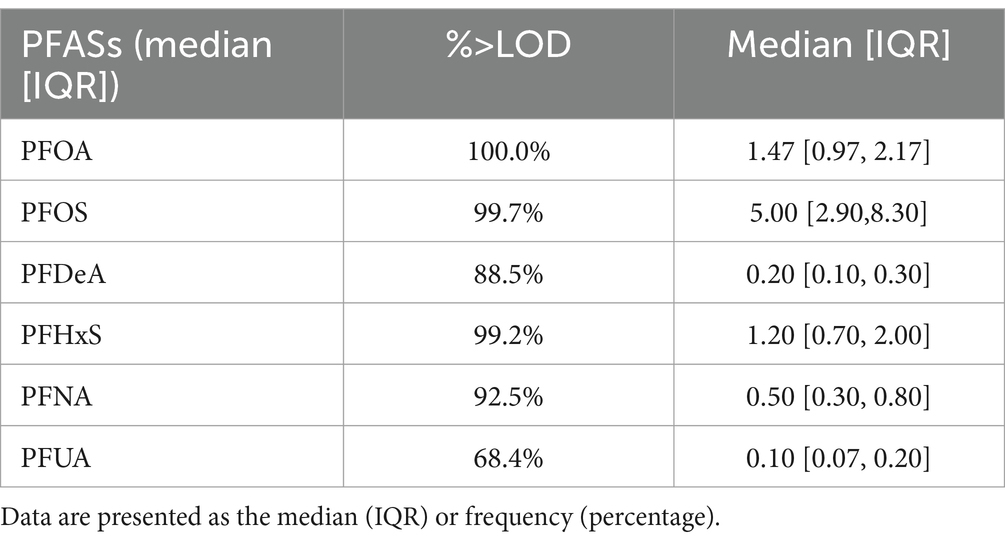
Table 2. Detection rate and concentration of PFASs (ng/mL) in the population (median [IQR]).
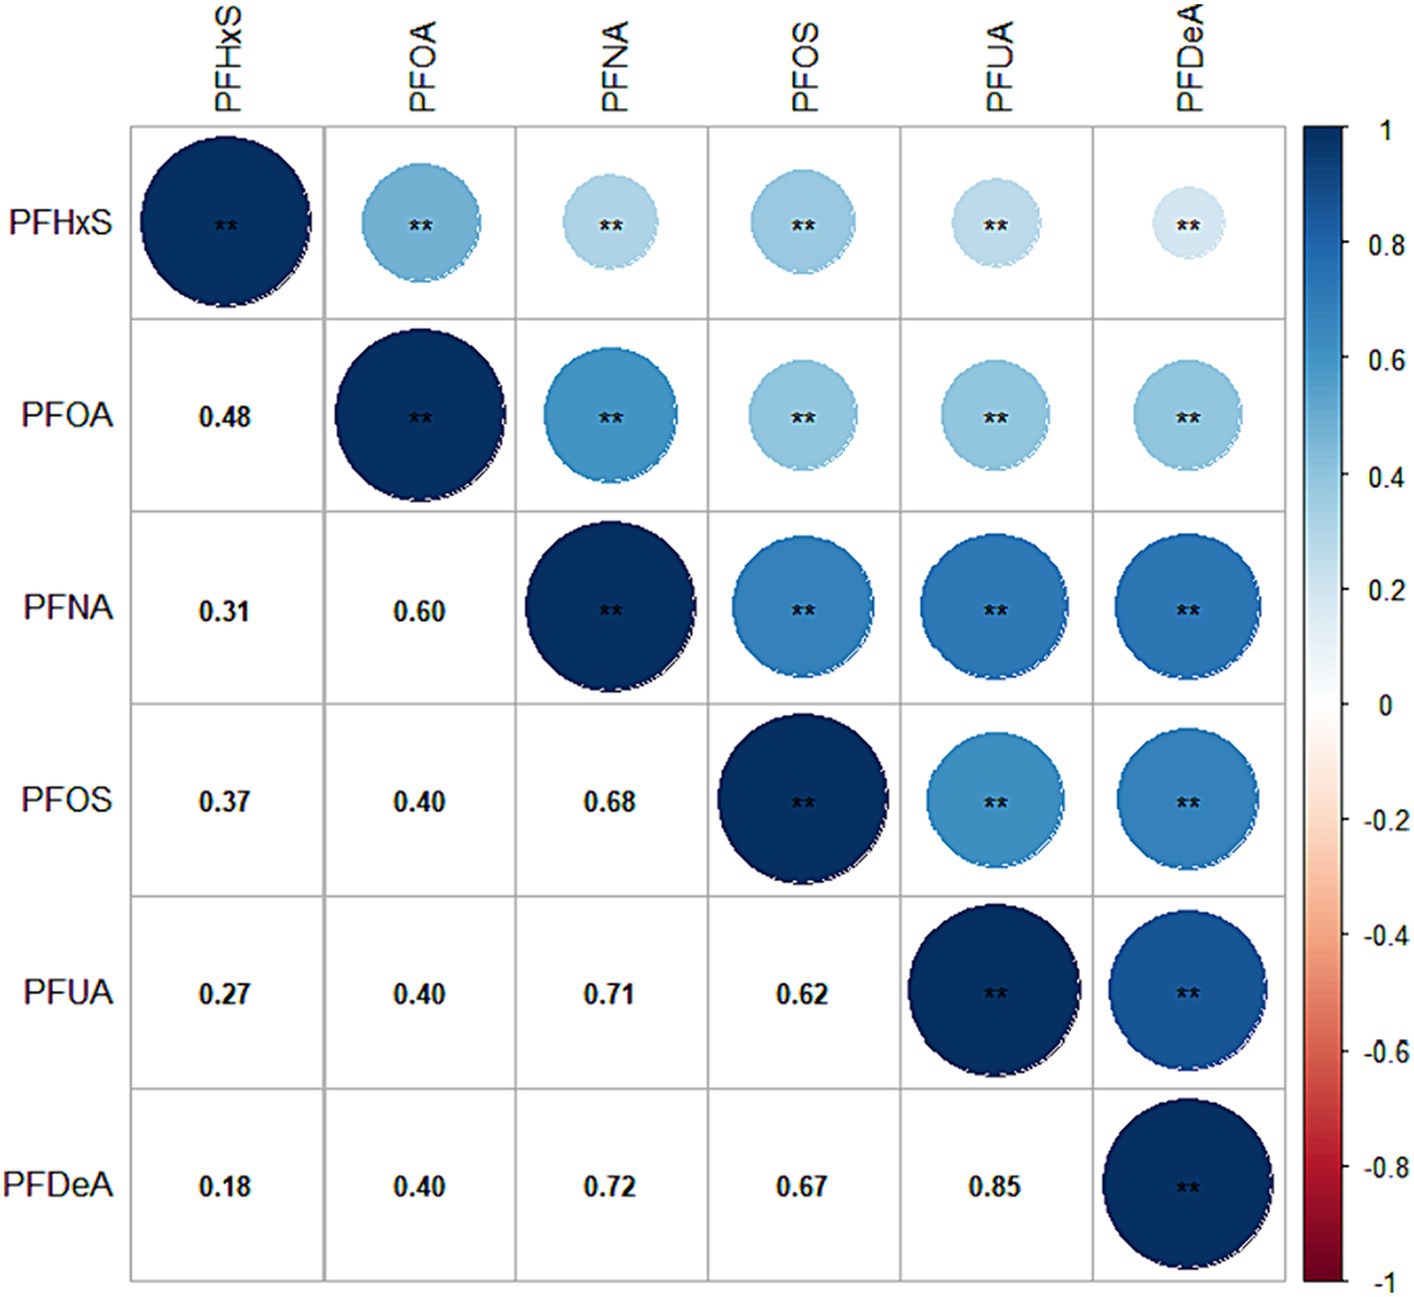
Figure 2. Heat map of PFAS correlation in blood. (The values in the box are the correlation coefficient, with values ranging from −1 to 1).
3.2 Subgroup analysis of the relationship between PFASs and glucose metabolism indices
3.2.1 Cluster analysis based on PFASs exposure
By observing the the cluster heatmap (Figure 3), we found that individuals highly exposed to one type of PFASs were also likely to be exposed to other PFASs simultaneously. As can be seen in the Figure 4, the exposure levels of the six PFASs in subgroup 3 were significantly higher than those in subgroups 2 and 1, while subgroup 2 was significantly higher than subgroup 1. From this, we identified subgroups 1, 2, and 3 as low, medium, and high exposure subgroups, respectively. Figure 5 shows the comparison results of glucose metabolism indices among the three subgroups, with statistically significant differences in FPG among all subgroups and insulin between the high-exposure and low-exposure groups. The trend of FPG and insulin levels showed statistical significance (p < 0.05, Table 3), indicating a linear trend between exposure and these two glucose metabolism indices. Combined with the box plots (Figure 5), it was found that FPG levels showed an elevated trend with increasing exposure to PFASs. However, insulin demonstrated a decreasing trend with increasing exposure to PFASs, indicating an association between PFASs exposure and changes in glucose metabolism levels. The weighted basic characteristics of the three subgroups determined based on cluster analysis are presented in Table 4. Statistically significant differences were observed between the groups in terms of gender, age, alcohol consumption, race, and poverty ratio.
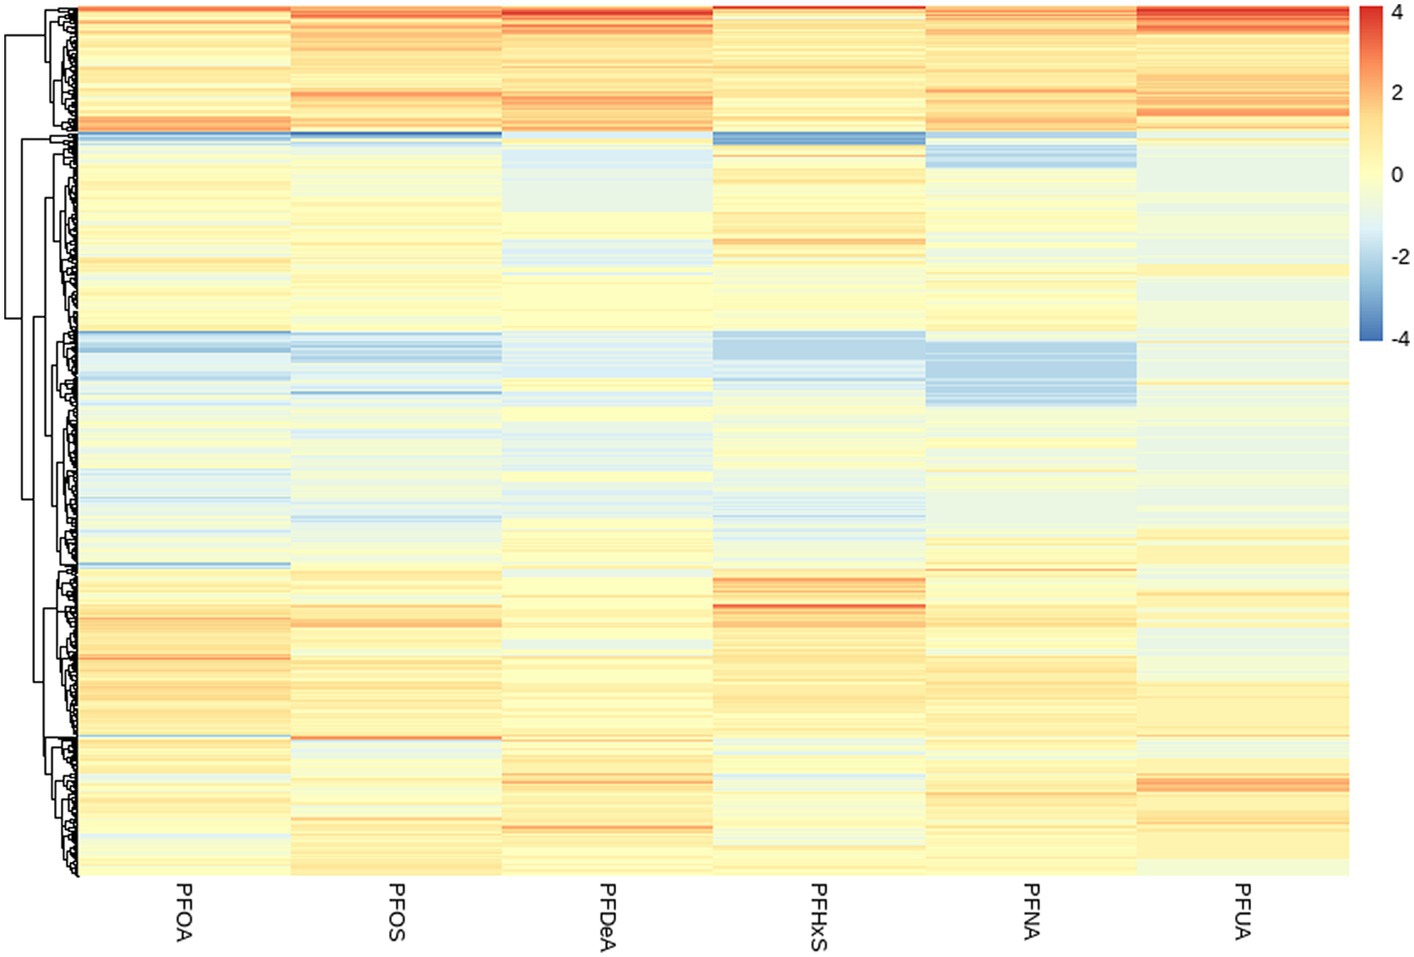
Figure 3. Heat map of clustering based on the concentration of PFASs in blood. (The vertical axis represents different PFASs. The horizontal axis represents the sample).
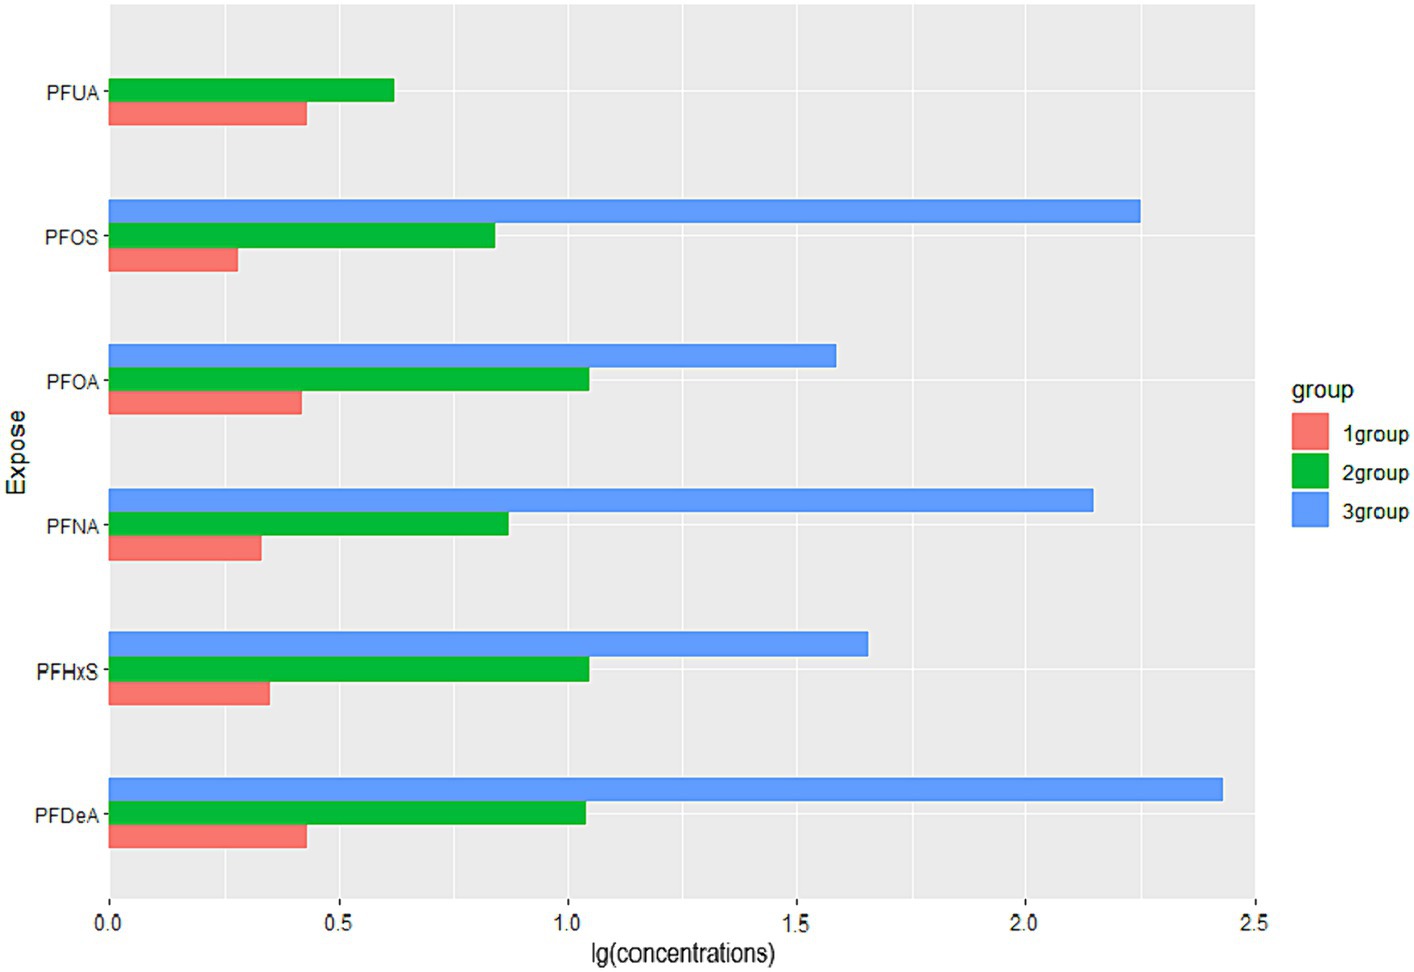
Figure 4. Comparison of PFASs concentrations among three exposure subgroups. (Data are expressed as the ratio of the mean concentration of PFASs in subgroups to the population mean; all groups (n = 6). The horizontal coordinates indicate the relative levels of the mean concentrations of the subgroup PFASs to the overall mean, and the vertical coordinates are the six PFASs).
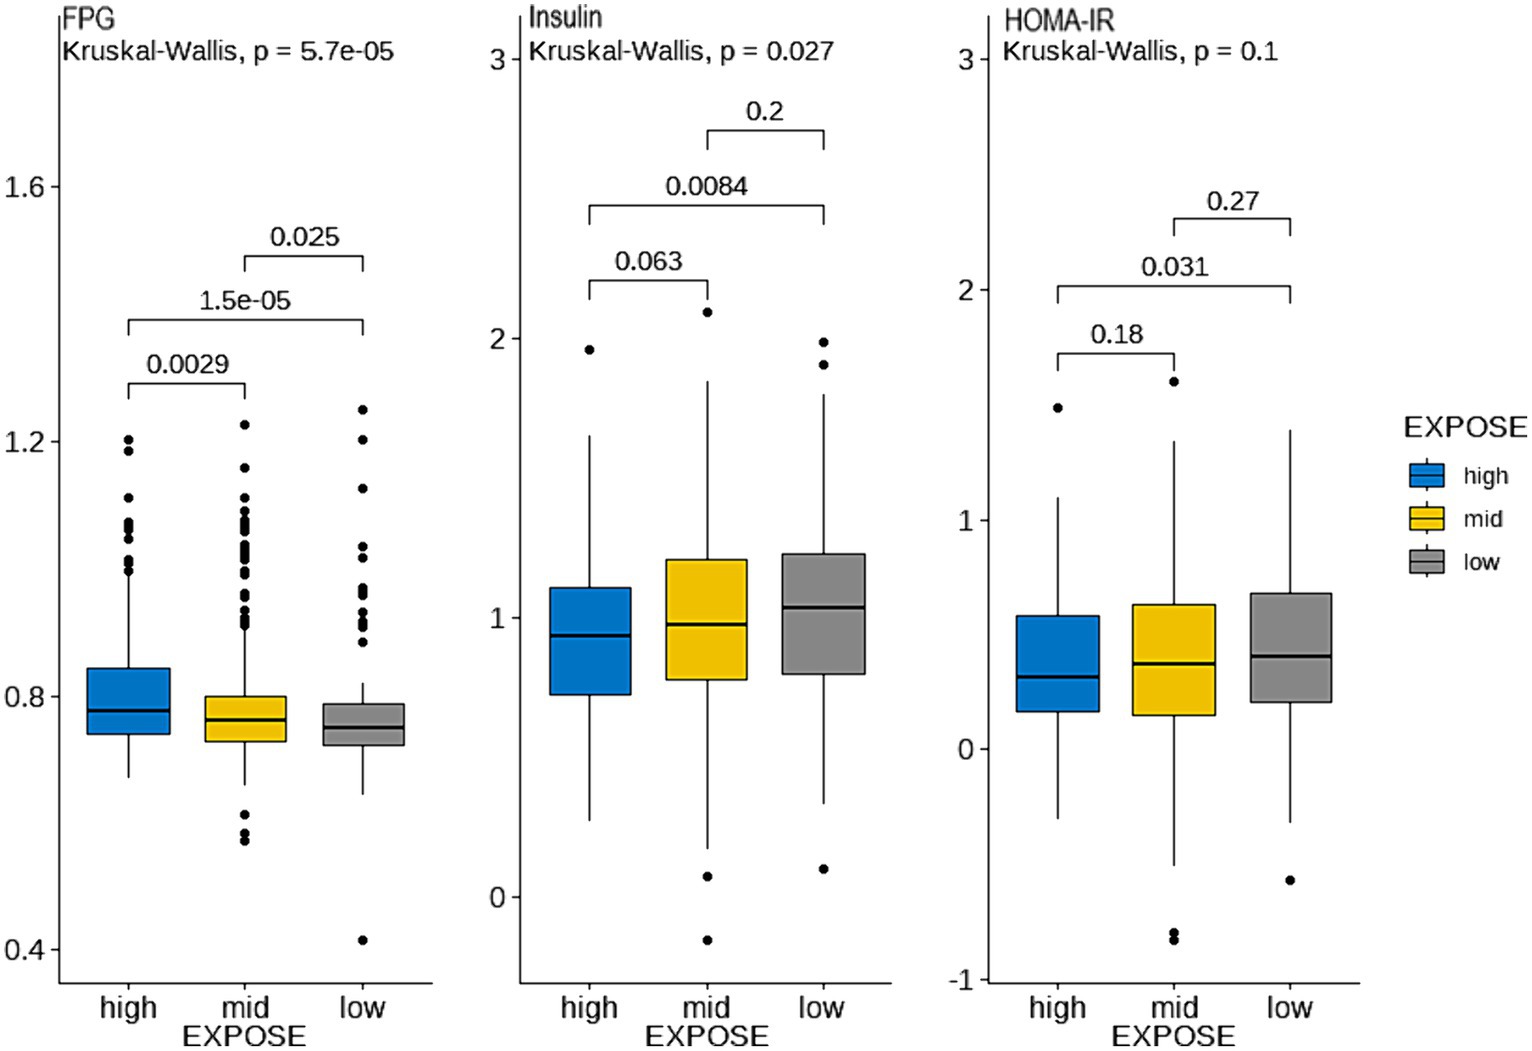
Figure 5. Comparison of glucose metabolism indices between the three exposure subgroups. (Blue, yellow, and gray represent the high, medium, and low exposure groups, respectively. (Data are expressed as mean ± SD; all groups (n = 3)). The ordinate represents the logarithmic concentration of glucose metabolism indices, and the horizontal coordinate is the exposure subgroup).
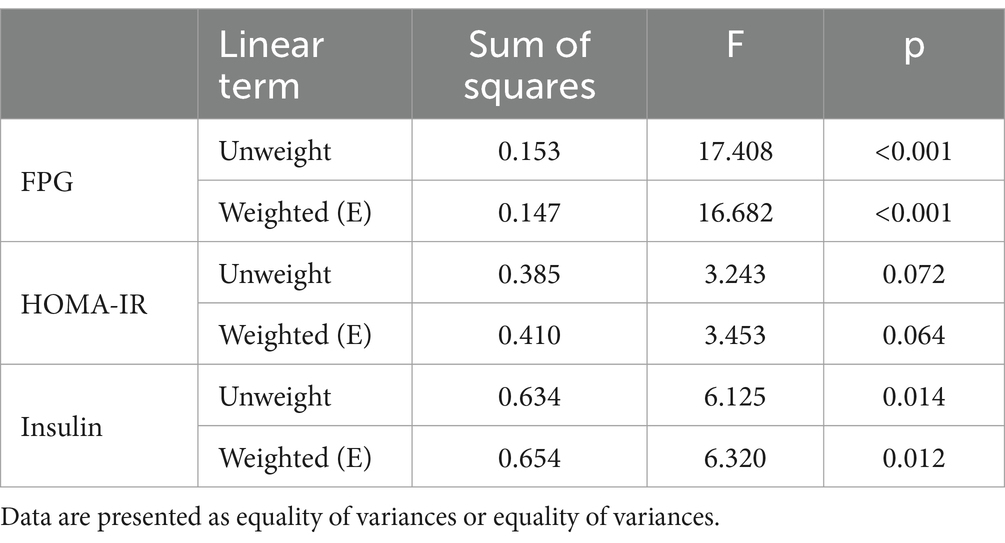
Table 3. Trend test of glucose metabolism indices in three exposure subgroups.
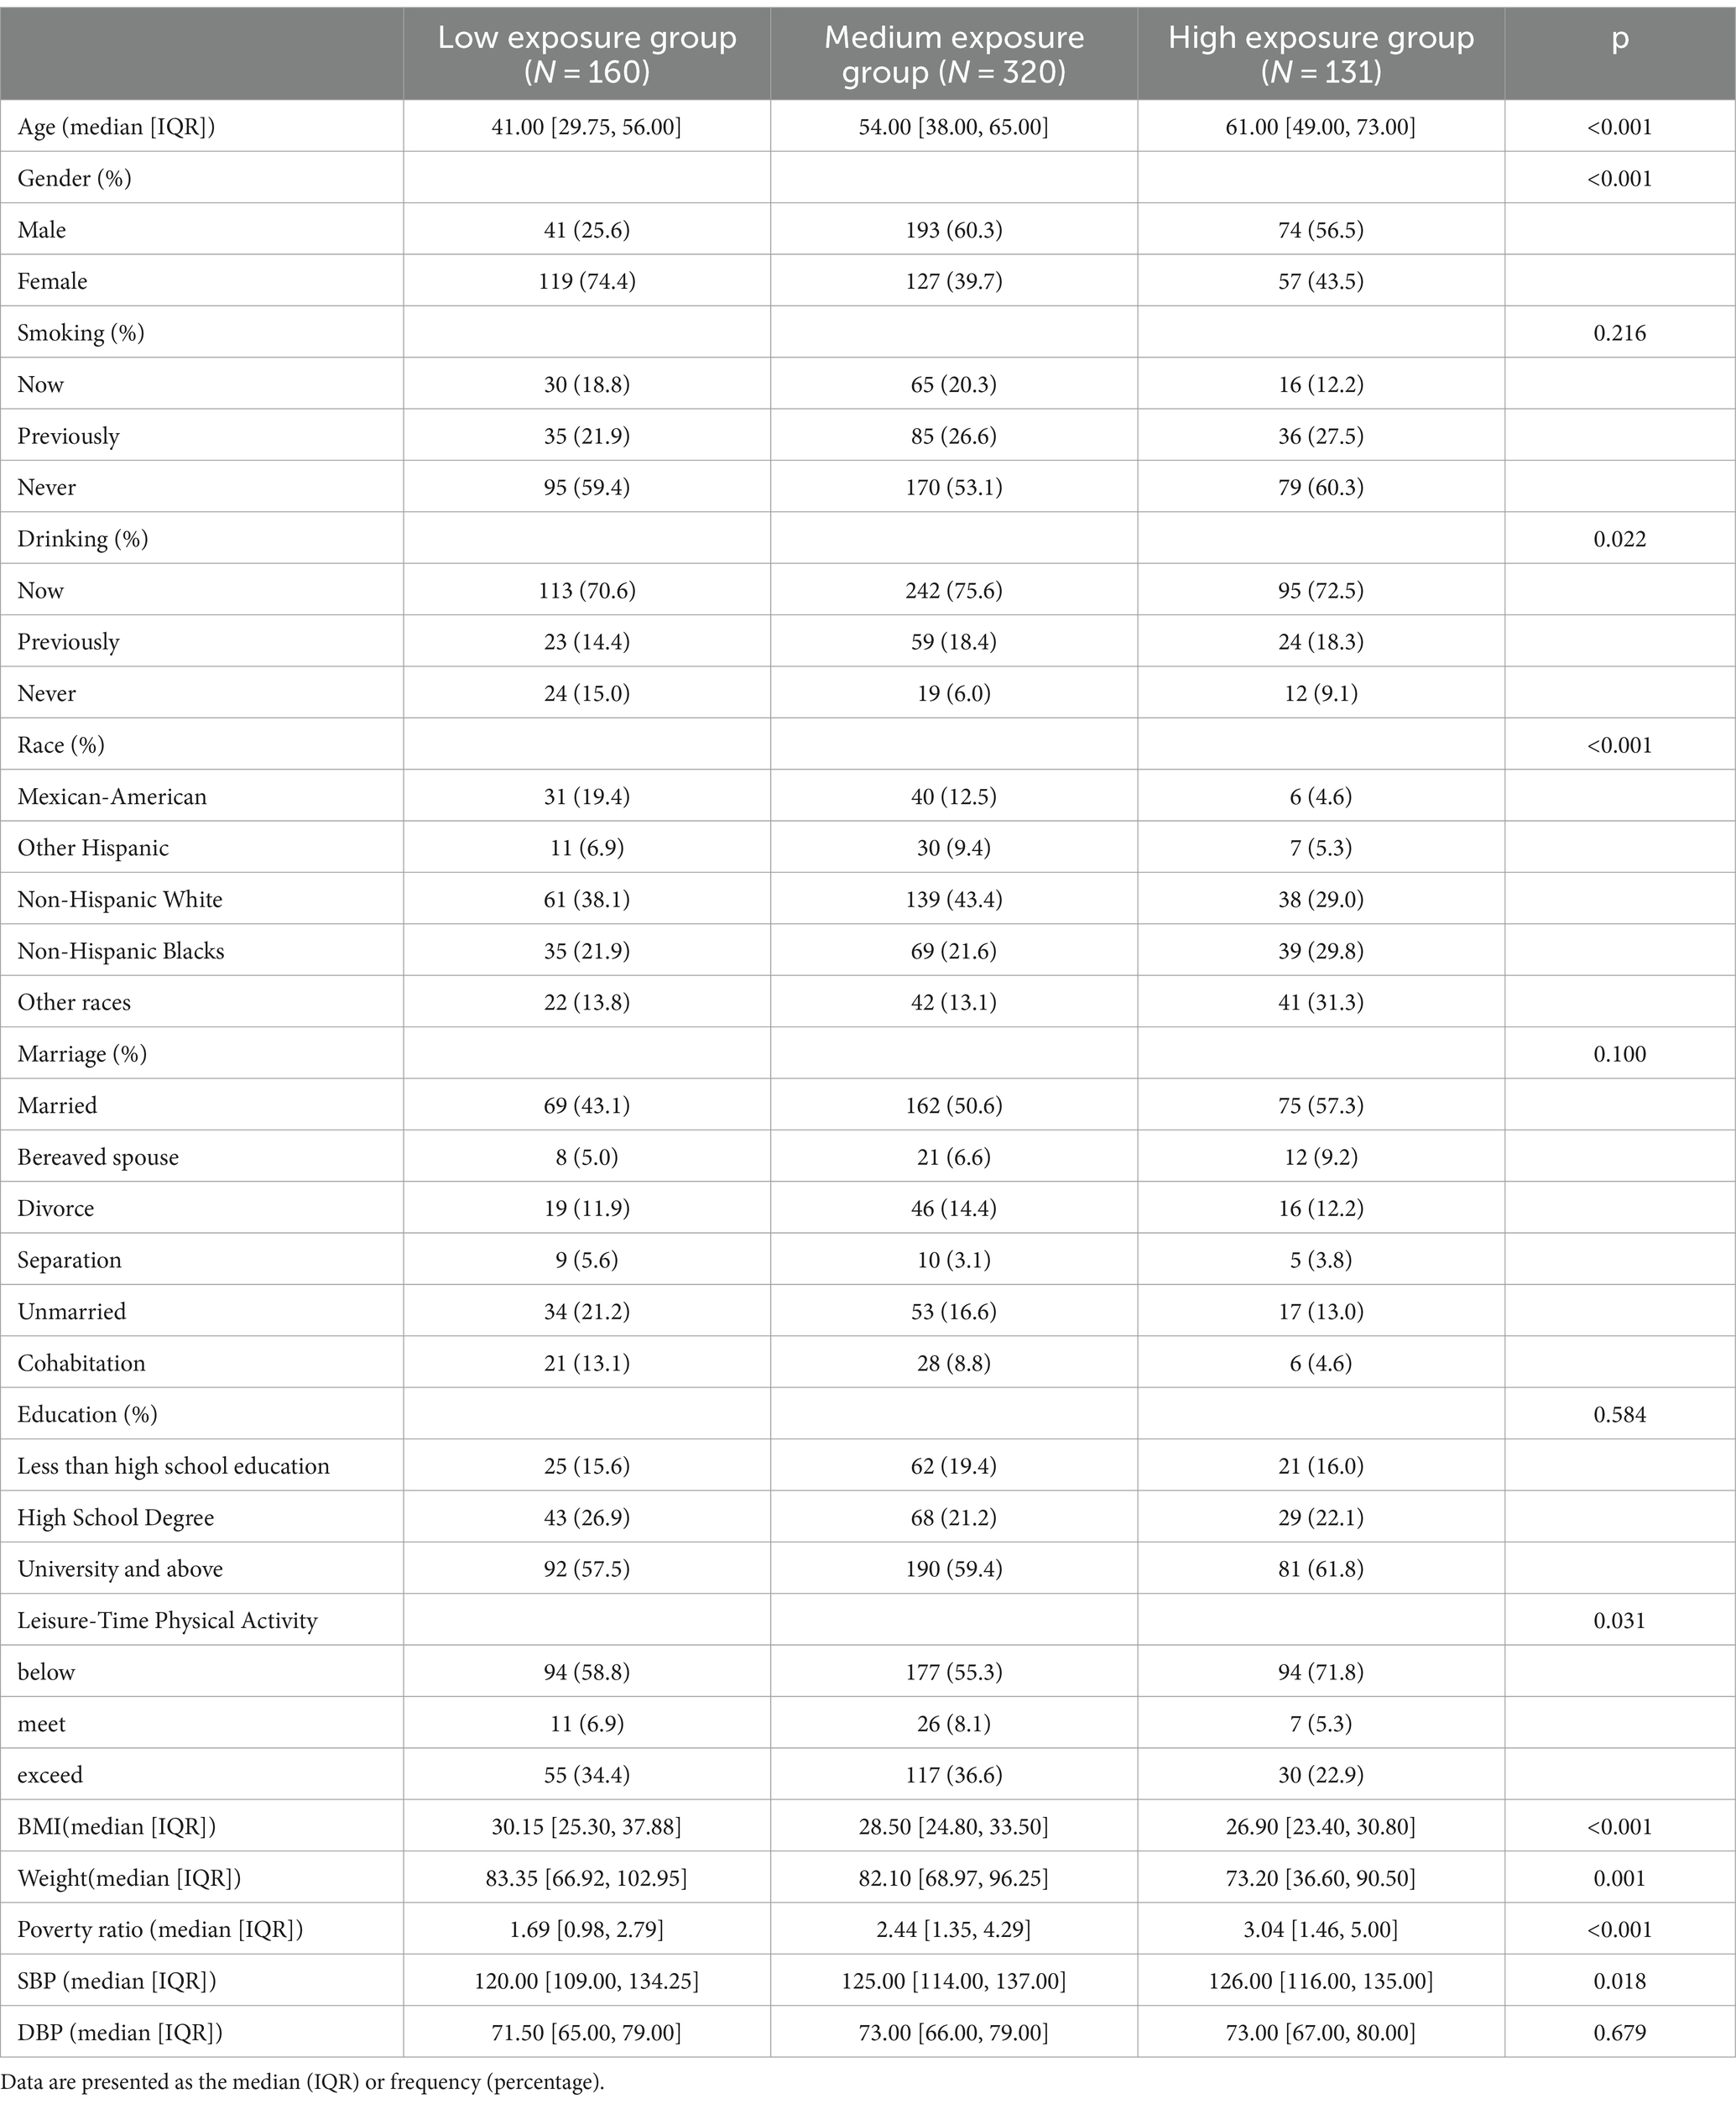
Table 4. Characteristics of the high-, medium-, and low-exposure groups (N (%)/M (P25, P75)).
3.2.2 Comparison of PFASs levels between the two age groups
As shown in Table 5, the differences in serum levels of six PFASs were statistically significant between the two groups with all p < 0.001. Except for PFUA and PFDeA, the remaining four PFASs levels were significantly higher in ≤50 year old group than in >50 year old group.
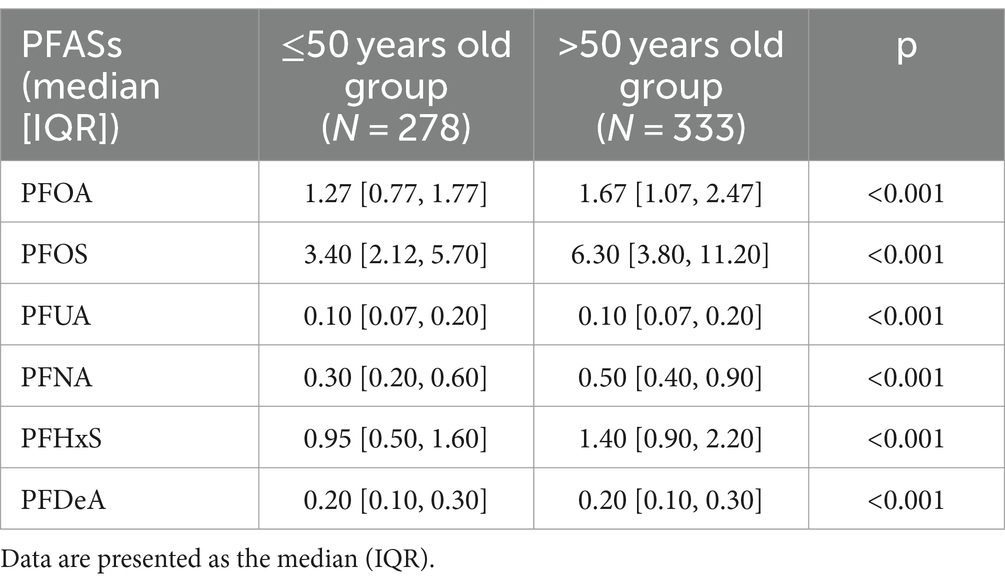
Table 5. Comparison of PFASs levels between the two age groups.
3.3 The relationships of single PFASs and glucose metabolism indices
As shown in Table 6, among aged ≤50 years group, PFHxS (Insuliu:β = −0.194, p < 0.001; HOMA-IR: β = −0.132, p = 0.020) was found to be correlated with insulin and HOMA-IR. In the >50 years old population, PFNA exhibited a positive correlation with FPG (β = 0.059, p < 0.001); insulin and HOMA-IR were negatively correlated with PFUA (Insulin: β = −0.133, p = 0.037; HOMA-IR: β = −0.141, p = 0.041), and PFOA (Insulin: β = −0.159, p = 0.047; HOMA-IR: β = −0.163, p = 0.042) but positively associated with PFNA (Insulin: β = 0.191, p = 0.018; HOMA-IR: β = 0.220, p = 0.013). Additionally, the multiple linear regression models indicated that the VIF of all PFASs was less than 10, indicating no multicollinearity among the PFASs variables in the regression process.
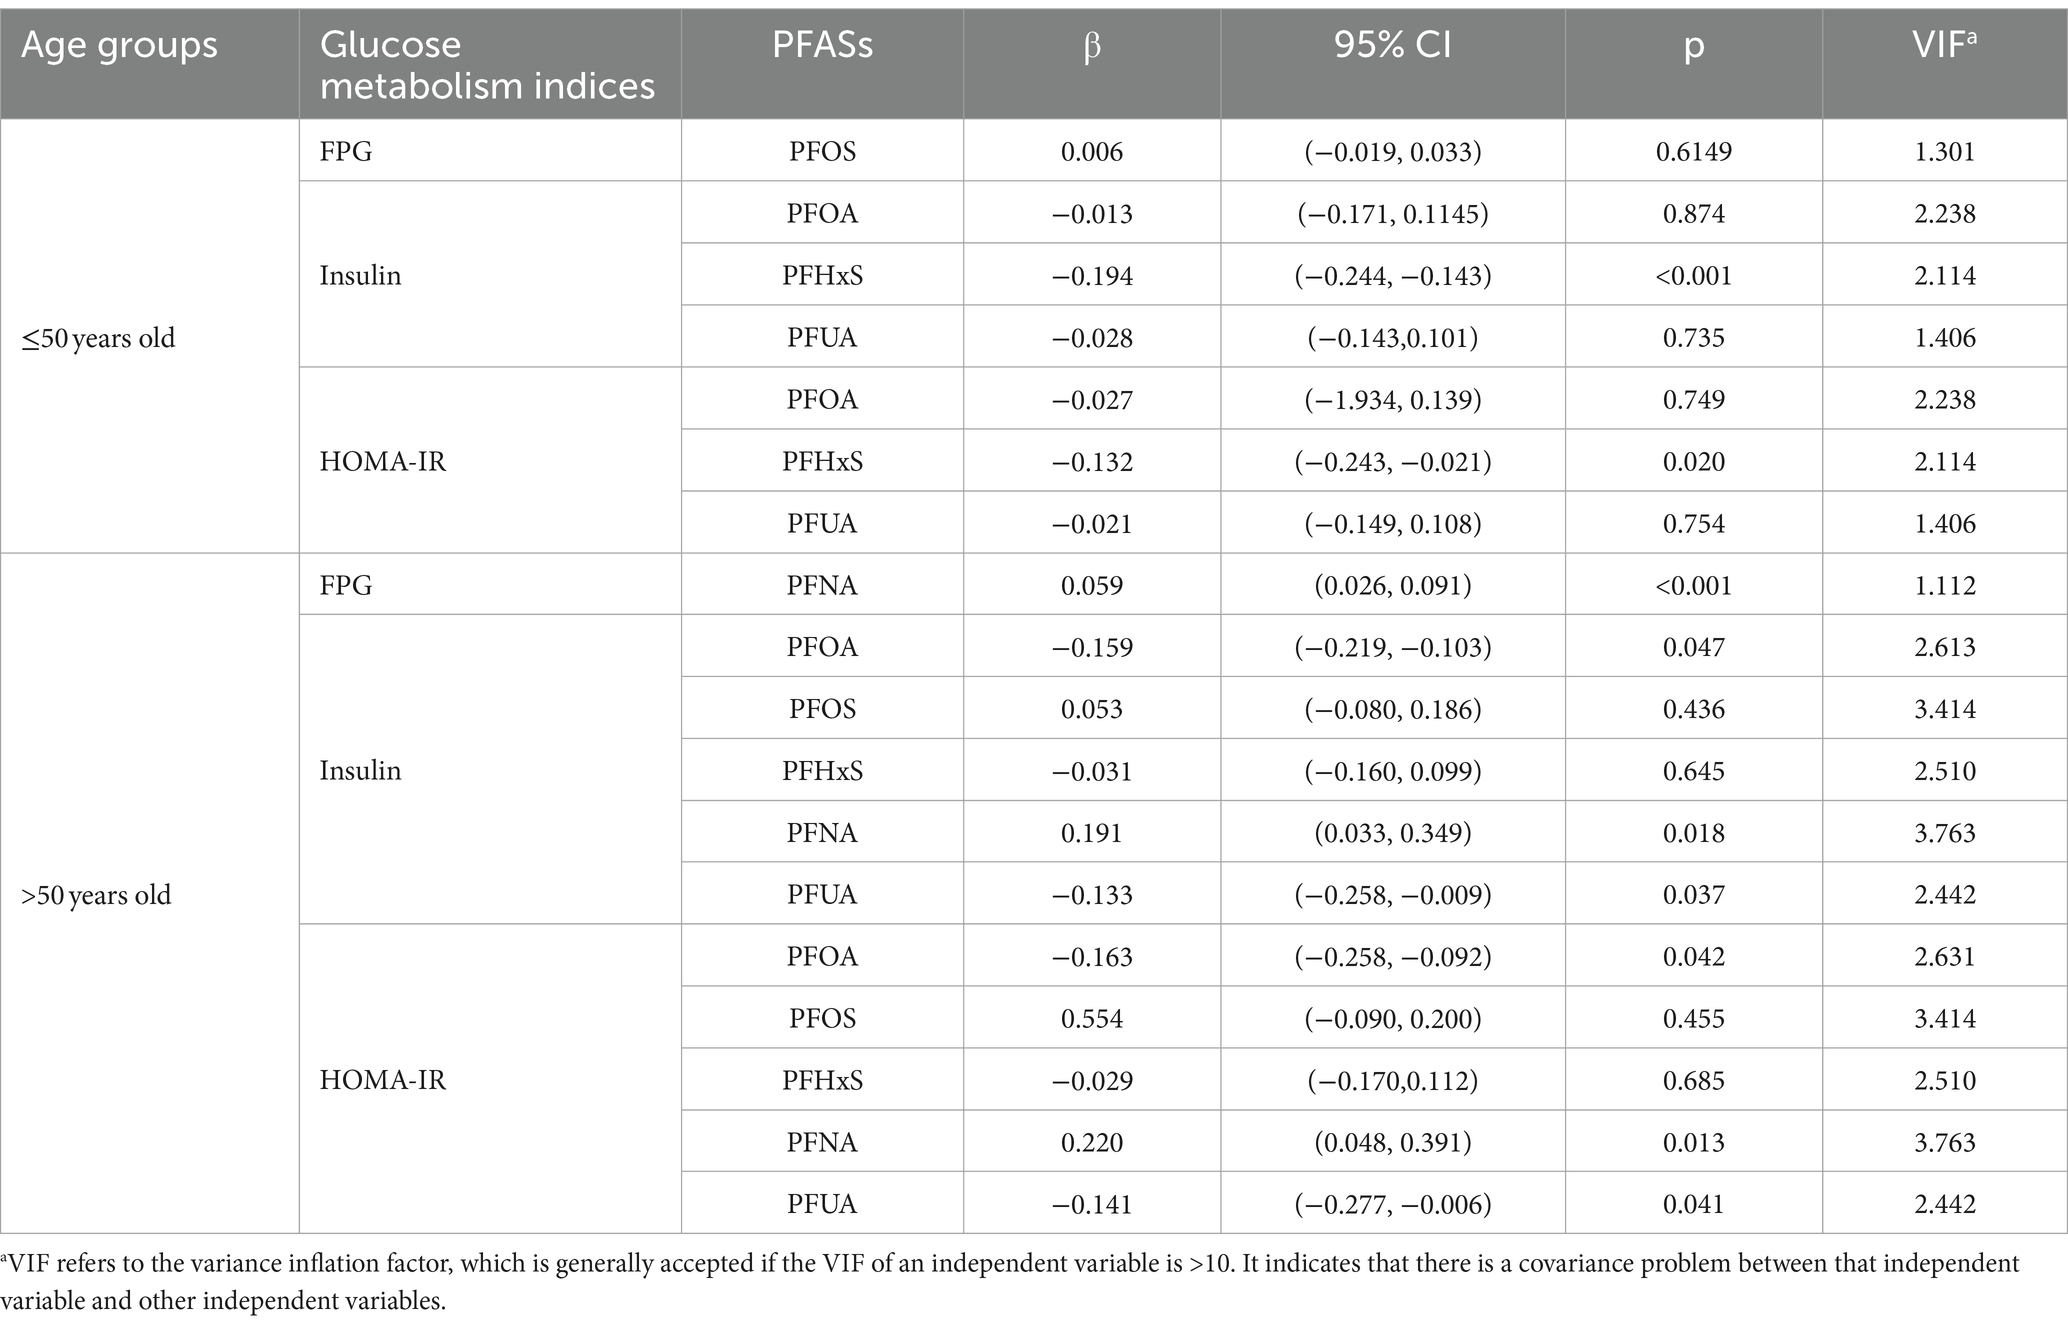
Table 6. Regression coefficients of population glucose metabolism indices and blood PFASs concentrations (95% CI).
3.4 The effects of multiple PFASs on glucose metabolism indices
As shown in Figure 6, in the ≤50 years-old group, the level of FPG showed an increasing trend with the increase of the total level of PFASs mixture. PFOS showed a positive expose-response relationship with FPG. Negative interaction between PFOS and PFHxS may exist. Insulin and HOMA-IR decreased with the increase of the total level of PFASs mixture. Further, PFHxS demonstrated a clear negative linear relationships with these two indices in the expose-response relationship plot, which was consistent with the LASSO regression screening results. As PFNA concentration percentiles changed from low to high, the negative effect of PFOA on insulin/HOMA-IR decreased, indicating the possibility of negative interactions between PFNA and PFOA. The results presented in Table 7 highlight the significant role of PFHxS in the relationships of PFASs on both insulin and HOMA-IR, with the highest PIPs (0.990 and 0.796, respectively).
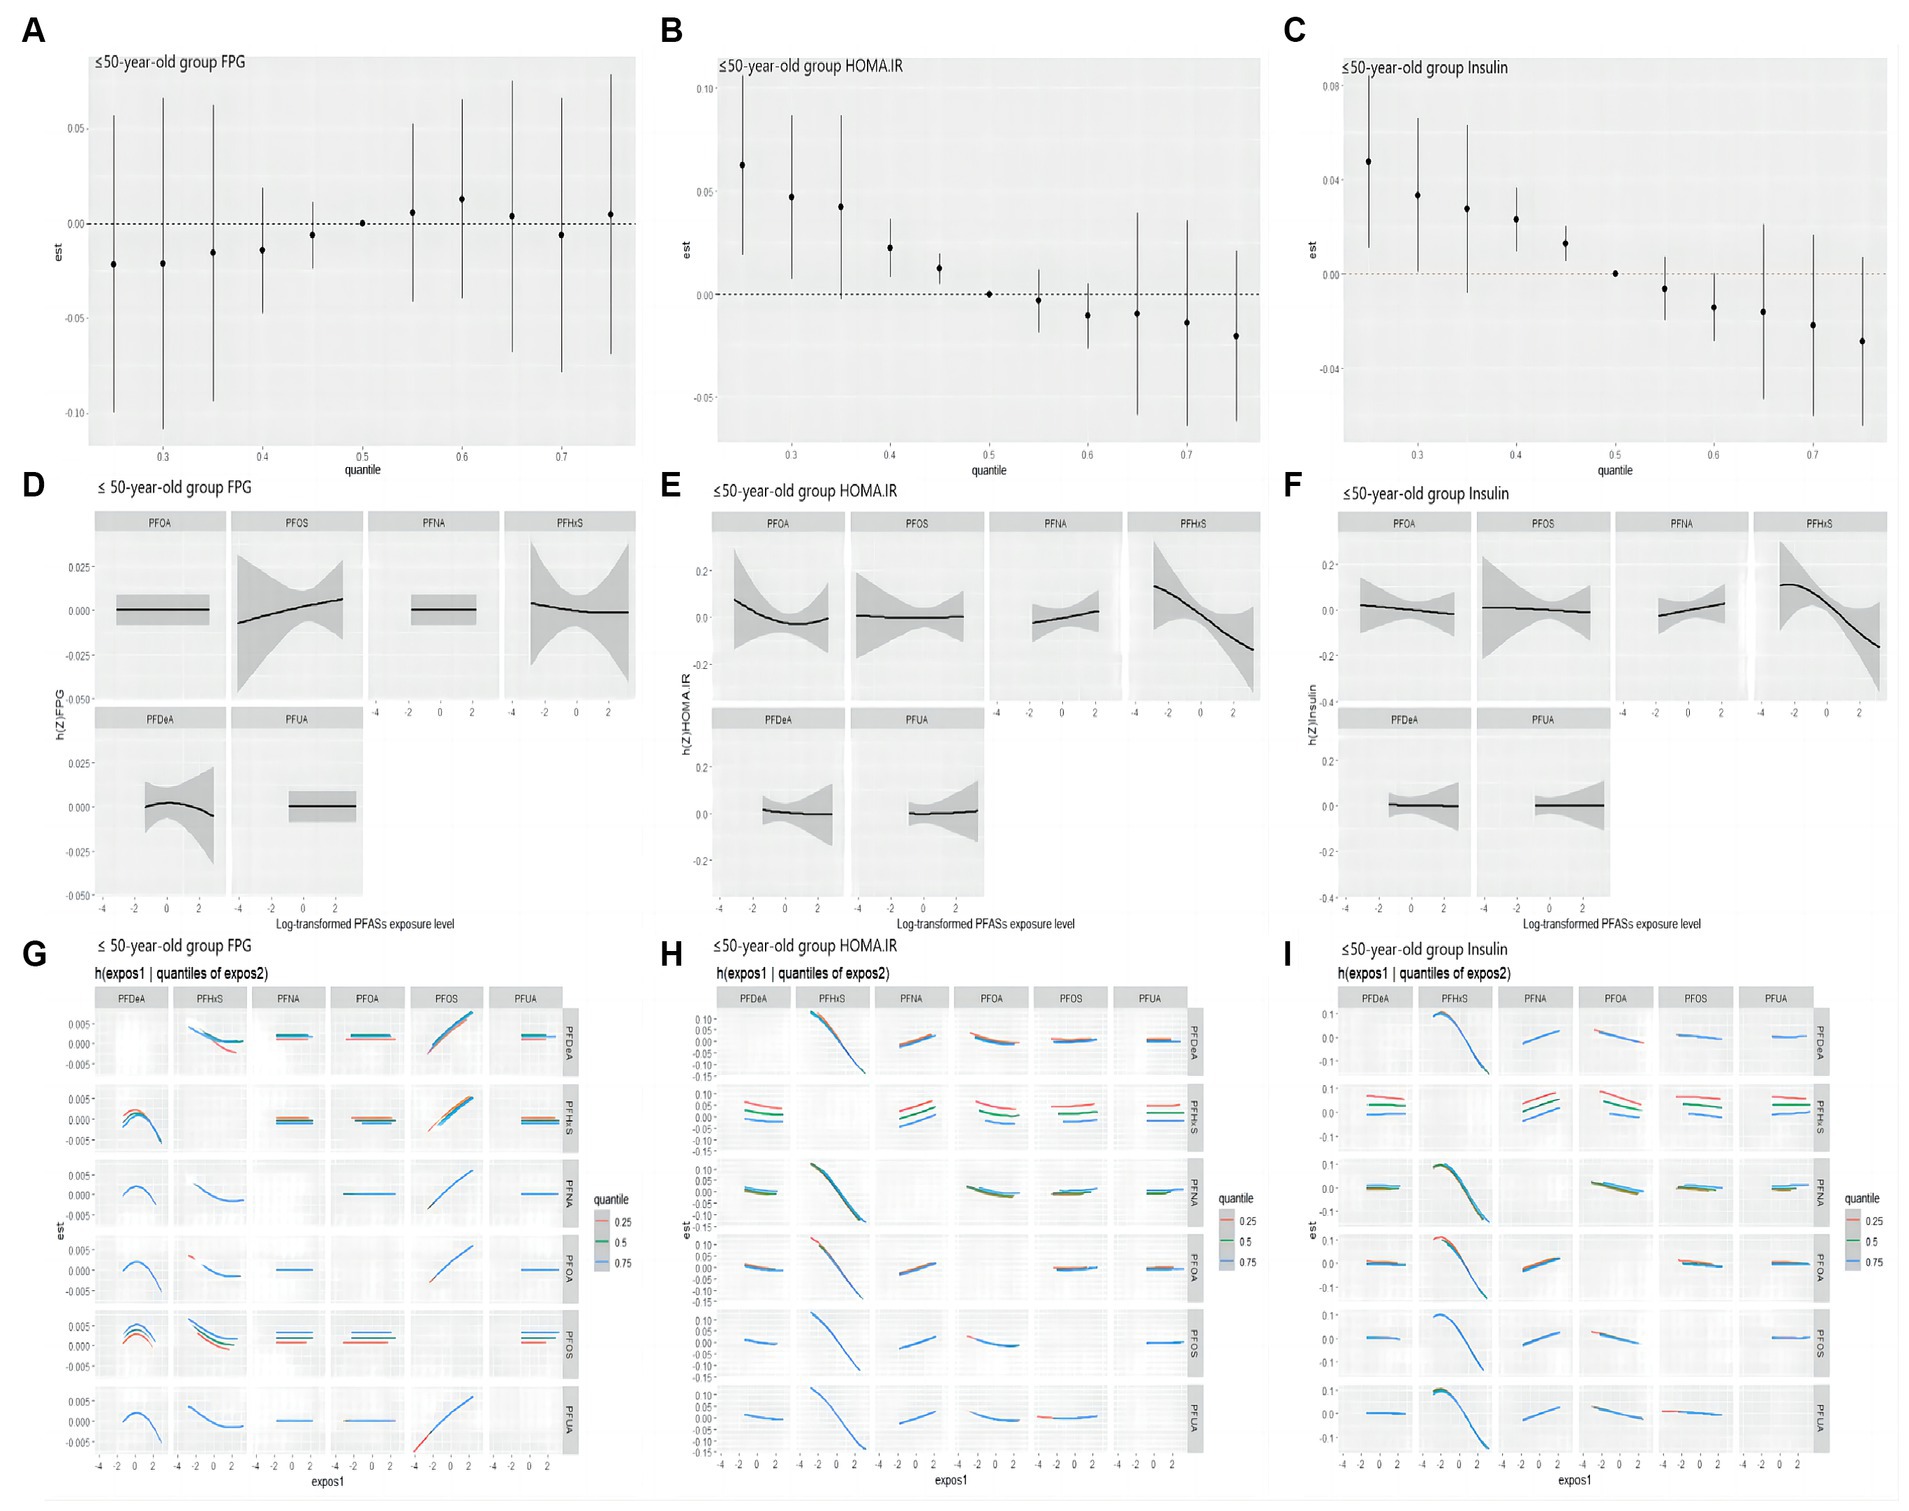
Figure 6. BKMR study the correlation of FPG, HOMA-IR and Insulin with PFASs in the ≤50 years-old group. (A–C): overall effect (95%CI) of PFASs. h(Z) can be interpreted as the correlations of FPG, HOMA-IR and insulin with blood PFASs. (D–F): exposure-response plots of FPG, HOMA-IR and Insulin against each PFAS, with other PFASs held at the median. h(Z) can be interpreted as the correlations of FPG, HOMA-IR and Insulin with blood PFASs. (G–I): bivariate expose-response relationship. Each cell represented the exposure-response curve for the column PFASs when the row PFASs was fixed at 25th, 50th, or 75th percentile and the remaining PFASs were fixed at their medians.
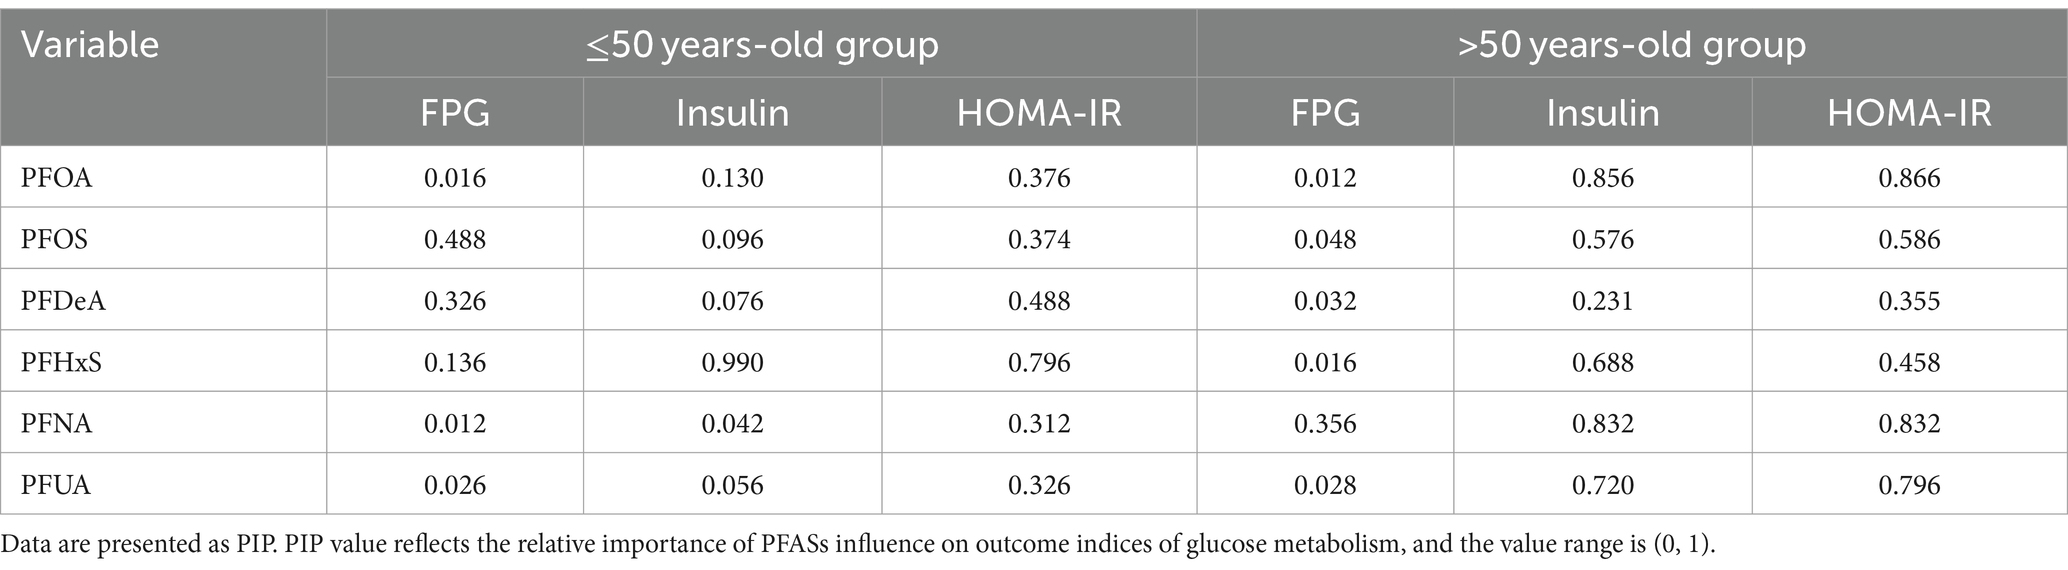
Table 7. A posteriori inclusion probability (PIPs) of the effect of PFASs on glucose metabolism indices.
As shown in Figure 7, in the >50 years-old group, the level of FPG also showed an increasing trend, corresponding to the total PFASs mixture levels. The univariate expose-response diagram showed a linear relationships between the six PFASs and the level of FPG. No interactions were observed between the PFASs. The insulin and HOMA-IR results were similar-both levels demonstrated a downward trend with the increase in the overall level of the PFASs mixture. Furthermore, the univariate expose-response relationships showed that all PFASs had linear relationship with these two indices. PFOA, PFUA and PFHxS showed a negative expose-response relationship with these two indices while PFOS and PFNA demonstrated a positive relationship, which was consistent with the LASSO regression screening results. In the bivariate exposed-response relationship plots of insulin or HOMA-IR, negative interactions were found between PFOA and PFNA/PFOS, and positive interaction was observed between PFOA and PFHxS in the bivariate exposed-response relationship plots of HONA-IR. The results presented in Table 5 highlight the significant role of PFNA in the relationships of PFASs on FPG, with the highest PIPs (0.356).
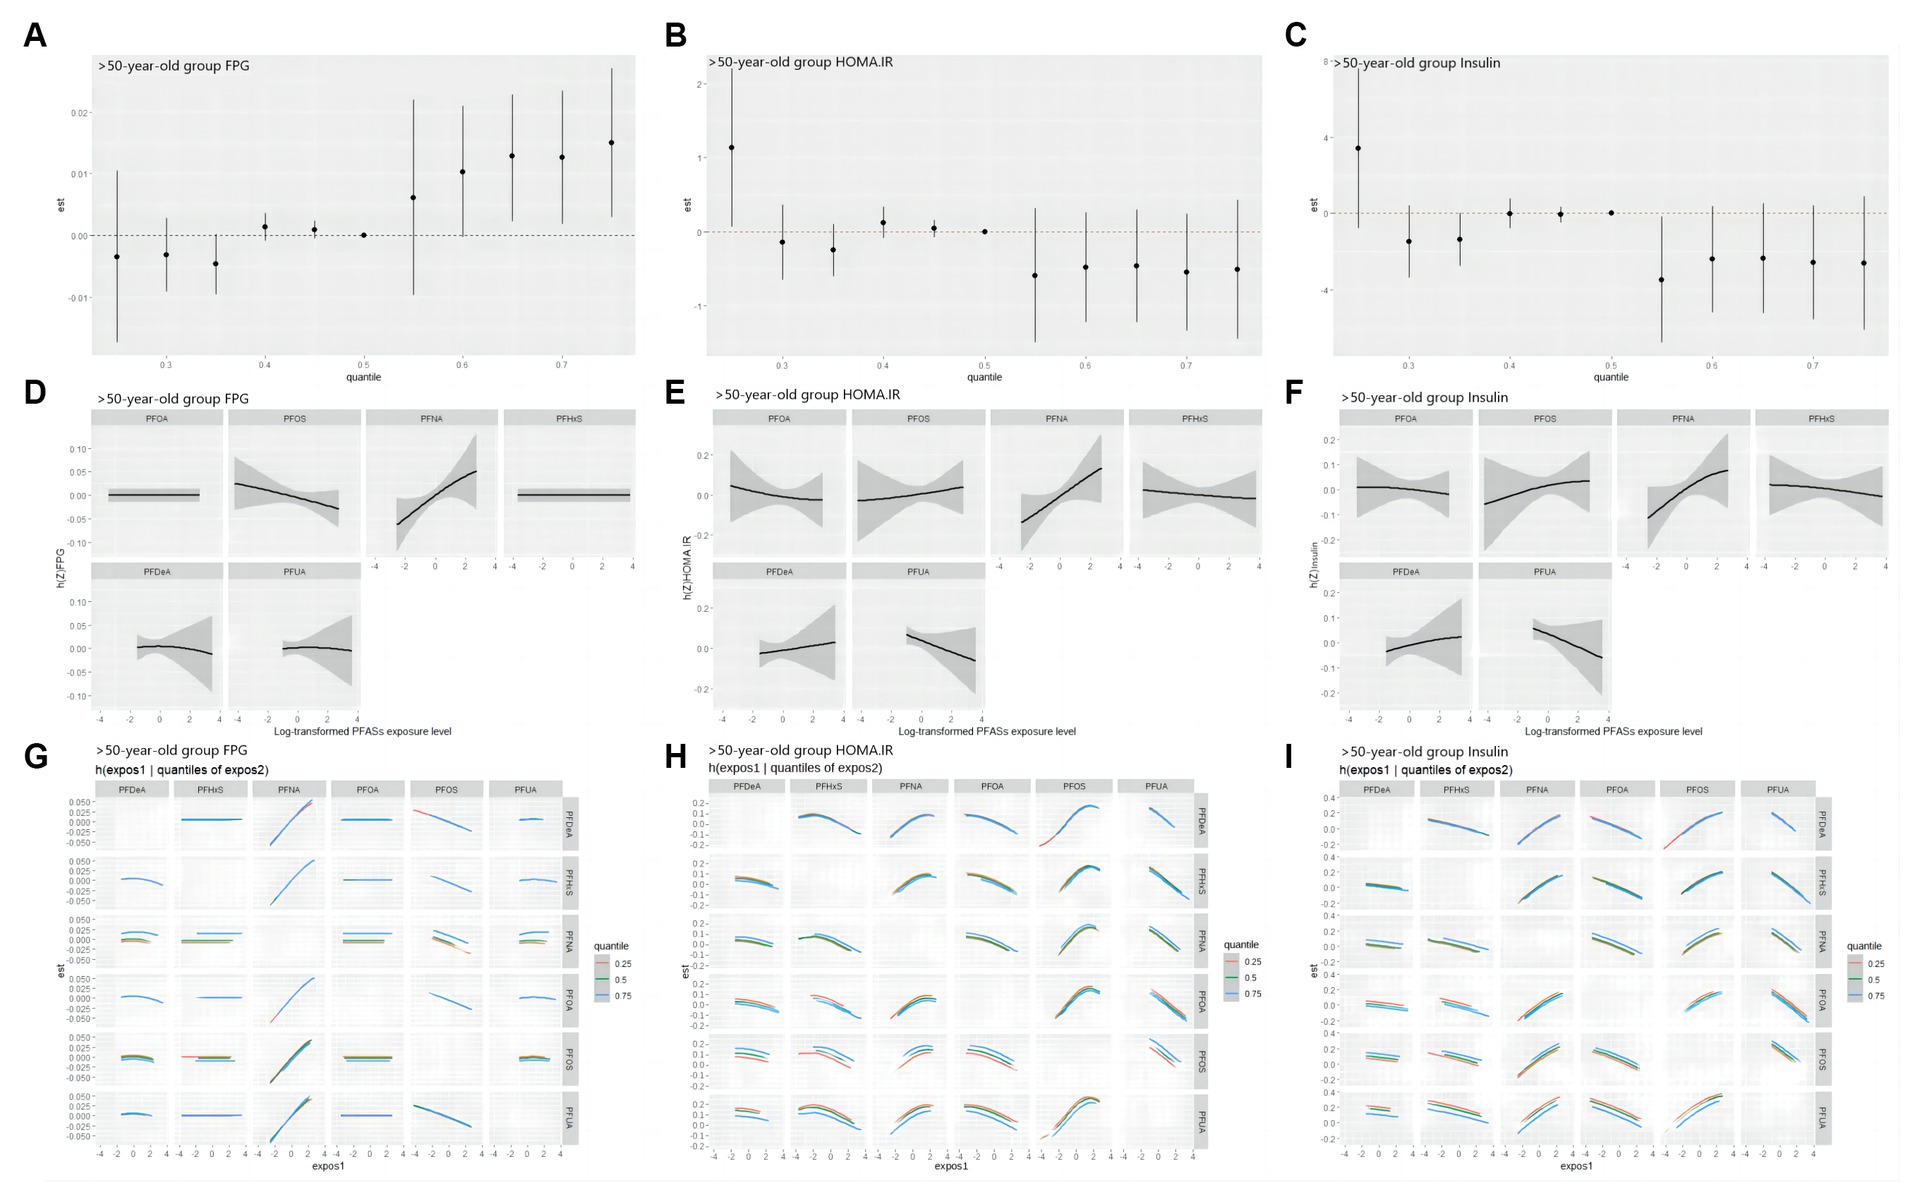
Figure 7. BKMR study the correlation of FPG, HOMA-IR and Insulin with PFASs in the >50 years-old group. (A–C): overall effect (95%CI) of PFASs. h(Z) can be interpreted as the correlations of FPG, HOMA-IR and Insulin with blood PFASs. (D–F): exposure-response plots of FPG, HOMA-IR and Insulin against each PFAS, with other PFASs held at the median. h(Z) can be interpreted as the correlations of FPG, HOMA-IR and insulin with blood PFASs. (G–I): bivariate expose-response relationship. Each cell represented the exposure-response curve for the column PFASs when the row PFASs was fixed at 25th, 50th, or 75th percentile and the remaining PFASs were fixed at their medians.
As shown in Figure 8, all possible interactions between PFASs were summarized, and it was found that PFOA could interact with multiple PFASs, and PFOA played an important role in the combined influence of multiple PFASs on glucose metabolism.
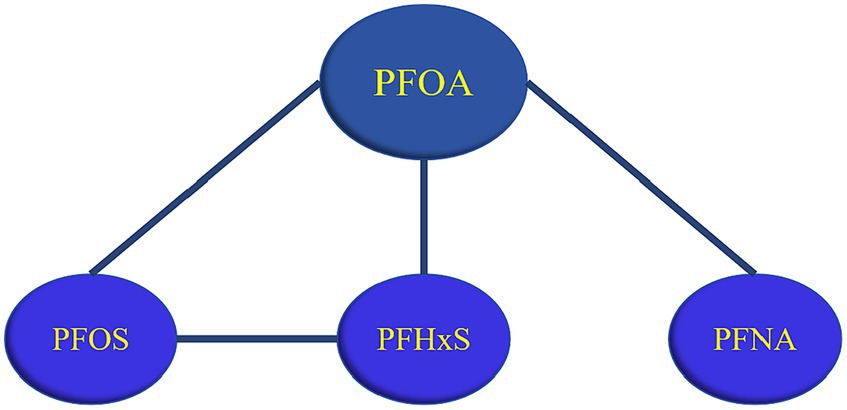
Figure 8. Summary of PFASs interactions. (A line between PFASs indicates possible interaction, with a black line indicating negative interaction and a red line indicating a positive interaction).
4 Discussion
In this study, 611 participants from the 2017–2018 NHANES cohort were selected. Cluster analysis, LASSO regression, and BKMR regression models were used to explore the relationships between the six PFASs and glucose metabolism indices. The results showed that with the increase of PFASs exposure, the FPG level showed an upward trend, while HOMA-IR/insulin demonstrated a downward trend. PFNA and FPG had a positive relationship. PFOA, PFUA, and PFHxS showed negative correlations with HOMA-IR/insulin, whereas PFNA mainly had positive correlation. Negative interactions were observed between PFOA and PFNA/PFOS, PFOS and PFHxS, while positive interactions were found between PFOA and PFHxS. Notably, PFOA can combine with various PFASs (PFOS/PFNA/PFHxS) to affect glucose metabolism indices.
PFASs exposure was closely associated with the level of FPG. The results of this study revealed that higher exposure to PFASs corresponded to a higher level of FPG, with PFNA having the greatest influence. A cross-sectional studies for adolescents and adults demonstrated that elevated serum PFNA concentration was associated with hyperglycemia (95% CI: 1.39–7.16) (29, 30). A nested case-control study also found that mixed PFASs homologs could affect glucose homeostasis by increasing 1 h glucose levels, with PFNA being the main contributor (31). The reason may be that PFNA is a kind of long-chain PFASs that is difficult to degrade and can lead to higher PPARα activation (32), which also explains the prominent position of PFNA in the relationship between PFASs and FPG.
Insulin is a protein hormone synthesized and secreted by islet β cells, which binds to target cell receptors and activates signaling pathways leading to various metabolic changes, most notably increasing glucose uptake and lowering blood glucose levels (33). Another marker of diabetes is insulin resistance that is measured using HOMA-IR. The results of this study demonstrated that exposure to mixed PFASs was associated with lower insulin and HOMA-IR levels, while PFOA, PFUA, and PFHxS were negatively correlated with both. Another study of the NHANES database also found PFASs mixture exposure were associated with decreased INS and HOMA-IR (34). Studies conducted in Cincinnati found a marginal negative correlation between PFOA levels and insulin/HOMA-IR, and another study in the New York reported a negative correlation between PFHxS and both (35, 36), which were consistent with the present study. In addition, we also found that PFNA was positively associated with both insulin and HOMA-IR levels. Zeeshan et al. analyzed data from the “Isomers of C8 Health Project in China,” and also found that PFNA was significant positive associations with insulin and HOMA-IR (37). However, there were some studies with opposite results to the present study. For example, Zeeshan et al. found significant positive correlations between PFOA, PFUA, PFHxS, and both insulin and HOMA-IR (37); some researchers found no significant correlations between PFOA/PFNA/PFHxS and HOMA-IR (2, 38). The analysis of similar and contradictory epidemiological results with this study found that different overall exposure levels in the study population may influence the association of PFASs with indicators of glucose metabolism. The results of studies analyzing populations or countries with lower concentrations of serum PFASs were more consistent with this study, concluding that there was a negative or nonsignificant correlation between PFASs exposure and insulin and HOMA-IR. For instance, the median serum concentration of PFOA was 3.8 ng/mL in NHANES (2003–2004) (2), 2.46 ng/mL in the Canadian Health Measures Survey (2007–2009) (38), and 1.47 ng/mL in this study. In studies where there were significant positive correlations, participants had a higher median PFOA concentration, such as the European Young Heart Study, which measured a median PFOA concentration of 9.7 ng/mL and 9.0 ng/mL in men and women, respectively (39). The biological mechanisms associated with PFASs and insulin resistance are unclear. Animal studies have shown that in mice exposed to PFAS, PFAS negatively regulates the protein kinase B (PKB) pathway in white adipose tissue, resulting in increased glucose and decreased insulin and insulin resistance (40). PFASs also have affinity to PPAR-γ and exposure to PFASs may also trigger expression of store free fatty acids and regulate the transcription of various insulin-related genes through activation of PPAR-γ and ultimately enhance insulin sensitivity (17, 34, 41). Although the findings from toxicology studies provide valuable insights, population data are lacking, so further research is needed to clarify the underlying mechanisms.
The results of this study showed that PFASs had different interactions in different age groups, for example, in terms of the relationships of PFASs and FPG, a negative interaction was observed between PFOS and PFHxS in ≤50 years old groups, while no interaction was found in >50 years old groups. At the same time, the differences in the serum levels of the six PFASs were all statistically significant between the two age groups in this study. Some researchers found that the combined toxic effects between PFASs may vary with the concentration (42). A study found that the toxic effect of high dose PFASs exposure experiment is not the same as that of low dose PFASs exposure experiment, that is, no effect under high dose exposure does not mean that there is no effect under low dose exposure (43, 44). Therefore, different concentrations may explain the different interaction of PFASs in different age groups. Furthermore, the results of the BKMR model indicate that there is an interaction between PFASs, especially between PFOA and multiple PFASs (PFOS/PFUA/PFHxS). PFASs are a large family containing thousands of compounds, of which PFOA is the most typical and most widely used (45). Studies show that PFOA is the final metabolite of various PFASs in the environment (46). Activation of PPAR-α is thought to play a key role in the production of toxic effects by PFASs, and PFOA is a potent agonist of PPAR-α (47). The above may be the reason for the interaction of PFOA and multiple PFASs.
Previous studies have primarily focused on the effects of a single PFAS on glucose metabolism, with limited analysis of mixed exposures, and the toxic mechanism of mixed exposure of PFASs is currently unknown. A study found that the six PFASs (PFHxS, PFOA, PFNA, PFDA, PFUA, and PFDeA) can bind to human G protein-coupled receptor 40 (GPR40), and the increase in intracellular calcium level mediated by GPR40 can promote the fusion of insulin-containing vesicles with plasma, leading to insulin secretion, disrupting glucose homeostasis and ultimately aggravating insulin resistance (48, 49). An animal study found tha the PFAS mixture could cause mitochondrial dysfunction and further disrupt glucose and lipid metabolic pathways, ultimately causing metabolic disorders (50). Further studies are needed to clarify the combined mechanism of action of PFASs in the future.
The strengths of this study are as follows: this study first used the method of cluster analysis to automatically categorize the study participants into three groups based on PFASs exposure levels. By comparing the differences in glucose metabolism levels among these exposure groups, the distribution of PFASs among the participants and the influence of PFASs exposure levels on glucose metabolism indices were effectively presented. Further, unlike previous studies on the health effects of exposure to a single PFAS, this study explores the relationship between exposure to multiple PFASs and glucose metabolism indices. This study used LASSO regression to screen PFASs variables and used the BKMR model to evaluate the overall mixed effects and interactions of multiple PFASs. These two approaches complemented each other.
However, some limitations should be recognized. First, we cannot rule out residual and unmeasured confounders (for example, total fat or high fructose dietary intake), or consumption of foods packaged with food contact materials containing PFASs, which could lead to more PFAS exposure. Additionally, the cross-sectional design could not tell the causal relationship between PFAS exposure and glucose metabolism and biological mechanisms linking PFASs exposure to glucose metabolism have yet to be established. Therefore, further experimental studies are required to explore the relevant mechanisms underlying the association of serum PFASs with glucose homeostasis and metabolic indices.
5 Conclusion
In this study, we analyzed 2017–2018 United States NHANES data to assess the relationships between serum concentrations of the six PFASs and glucose metabolism indices. It was found that PFOA, PFOS, PFUA, PFNA, and PFHxS could play a significant role in the relationships of PFASs and glucose metabolism. Moreover, interactions were observed between PFOS and PFHxS, and PFOA and PFOS/PFHxS/PFNA. Our study provides new evidence for the harmful effects of PFASs exposure; however, further longitudinal studies are needed to confirm these findings and clarify the underlying mechanisms.
Data availability statement
Publicly available datasets were analyzed in this study. This data can be found at: https://www.cdc.gov/nchs/nhanes/.
Ethics statement
The studies involving human participants were reviewed and approved by National Center for Health Statistics Research Ethics Review Board. The participants provided their written informed consent to participate in this study.
Author contributions
QT: Writing – original draft, Visualization, Software, Methodology, Formal analysis, Conceptualization. YY: Writing – review & editing, Visualization, Software, Resources, Data curation, Conceptualization. QA: Writing – review & editing, Software, Methodology. YL: Software, Methodology, Writing – review & editing. QW: Writing – review & editing, Validation, Resources. PZ: Writing – review & editing. YuZ: Writing – review & editing. YiZ: Writing – review & editing, Funding acquisition. LM: Project administration, Writing – review & editing, Supervision, Data curation. LL: Project administration, Writing – review & editing, Supervision, Funding acquisition.
Funding
The author(s) declare financial support was received for the research, authorship, and/or publication of this article. This study was supported by the National Natural Science Foundation of China [grant numbers 81872701, 81273040] and National Natural Science Foundation of China [grant number 82103938].
Acknowledgments
We acknowledge the financial support for this study and the participation of all individuals.
Conflict of interest
The authors declare that the research was conducted in the absence of any commercial or financial relationships that could be construed as a potential conflict of interest.
Publisher’s note
All claims expressed in this article are solely those of the authors and do not necessarily represent those of their affiliated organizations, or those of the publisher, the editors and the reviewers. Any product that may be evaluated in this article, or claim that may be made by its manufacturer, is not guaranteed or endorsed by the publisher.
Abbreviations
PFASs, perfluoroalkyl and polyfluoroalkyl substances; NHANES, National Health and Nutrition Examination Survey; FPG, fasting plasma glucose; HOMA-IR, homeostasis model assessment for insulin resistance; LASSO, least absolute shrinkage and selection operator; BKMR, Bayesian kernel machine regression; PFNA, perfluorononanoic acid; PFOA, perfluorooctanoic acid; PFUA, perfluoroundecanoic acid; PFHxS, perfluorohexane sulfonic acid; PFOS, perfluorooctane sulfonates acid; PFDeA, perfluorodecanoic acid; PPAR, peroxisome proliferator activated receptors; IQR, interquartile range; VIF, variance inflation factor; PIP, posterior inclusion probability; GPR40, human G protein-coupled receptor 40; PPAR-α, peroxisome proliferator-activated receptor alpha; n-PFOA, n-perfluorooctanoic acid; Sb-PFOA, branch perfluorooctanoic acid isomers; n-PFOS, n-perfluorooctane sulfonic acid; Sm-PFOS, perfluoromethylheptane sulfonic acid isomers.
Footnotes
References
1. Cardenas, A, Gold, DR, Hauser, R, Kleinman, KP, Hivert, M-F, Calafat, AM, et al. Plasma concentrations of per-and polyfluoroalkyl substances at baseline and associations with Glycemic indicators and diabetes incidence among high-risk adults in the diabetes prevention program trial. Environ Health Perspect. (2017) 125:107001. doi: 10.1289/EHP1612
2. Nelson, JW, Hatch, EE, and Webster, TF. Exposure to polyfluoroalkyl chemicals and cholesterol, body weight, and insulin resistance in the general U.S. population. Environ Health Perspect. (2010) 118:e72. doi: 10.3410/f.2638970.2302072
3. Liang, Y, Zhou, H, Zhang, J, Li, S, Shen, W, and Lei, L. Exposure to perfluoroalkyl and polyfluoroalkyl substances and estimated glomerular filtration rate in adults: a cross-sectional study based on NHANES (2017-2018). Environ Sci Pollut Res Int. (2023) 30:57931–44. doi: 10.1007/s11356-023-26384-9
4. Butt, CM, Berger, R, Bossi, R, and Tomy, RT. Levels and trends of poly-and perfluorinated compounds in the arctic environment. Sci Total Environ. (2010) 408:2936–65. doi: 10.1016/j.scitotenv.2010.03.015
5. Lindstrom, AB, Strynar, MJ, and Libelo, EL. Polyfluorinated compounds: past, present, and future. Environ Sci Technol. (2011) 45:7954–61. doi: 10.1021/es2011622
6. Zareitalabad, P, Siemens, J, Hamer, M, and Amelung, W. Perfluorooctanoic acid (PFOA) and perfluorooctanesulfonic acid (PFOS) in surface waters, sediments, soils and wastewater – a review on concentrations and distribution coefficients. Chemosphere. (2013) 91:725–32. doi: 10.1016/j.chemosphere.2013.02.024
7. Si, Y, Huang, J, Liang, Z, Liu, G, and Wang, F. Occurrence and ecological risk assessment of perfluoroalkyl substances (PFASs) in water and sediment from an Urban River in South China. Arch Environ Contam Toxicol. (2021) 81:133–41. doi: 10.1016/j.marpolbul.2017.08.009
8. Kahn, LG, Philippat, C, Nakayama, SF, Slama, R, and Trasande, L. Endocrine-disrupting chemicals: implications for human health. Lancet Diabet Endocrinol. (2020) 8:703–18. doi: 10.1016/S2213-8587(20)30129-7
9. Christopher, L, Katherine, A, Colette, H, David, L, Andrea, P-H, and Jennifer, S. Perfluoroalkyl acids: a review of monitoring and toxicological findings. Toxicol Sci. (2007) 99:366–94. doi: 10.1093/toxsci/kfm128
10. Liu, HS, Wen, LL, Chu, PL, and Lin, CY. Association among total serum isomers of perfluorinated chemicals, glucose homeostasis, lipid profiles, serum protein and metabolic syndrome in adults: NHANES, 2013–2014. Environ Pollut. (2017) 232:73. doi: 10.1016/j.envpol.2017.09.019
11. Rachdaoui, N . Insulin: the friend and the foe in the development of type 2 diabetes mellitus. Int J Mol Sci. (2020) 21:1770. doi: 10.3390/ijms21051770
12. Echouffo-Tcheugui, JB, Ali, MK, Griffin, SJ, and Narayan, KMV. Screening for type 2 diabetes and Dysglycemia. Epidemiol Rev. (2011) 33:63–87. doi: 10.1093/epirev/mxq020
13. Newsholme, P, and Krause, M. Nutritional regulation of insulin secretion: implications for diabetes. Clin Biochem Rev. (2012) 33:35–47.
14. Zhao, H, Zhang, Y, Shu, L, Song, G, and Ma, H. Resveratrol reduces liver endoplasmic reticulum stress and improves insulin sensitivity in vivo and in vitro. Drug Des Devel Ther. (2019) 13:1473–85. doi: 10.2147/DDDT.S203833
15. Park, SY, Gautier, J-F, and Chon, S. Assessment of insulin secretion and insulin resistance in human. Diabetes Metab J. (2021) 45:641–54. doi: 10.4093/dmj.2021.0220
16. Khalil, N, Ebert, JR, Honda, M, Lee, M, Nahhas, RW, Koskela, A, et al. Perfluoroalkyl substances, bone density, and cardio-metabolic risk factors in obese 8–12 year old children: a pilot study. Environ Res. (2018) 160:314–21. doi: 10.1016/j.envres.2017.10.014
17. Jp, VH, Jt, T, and Pj, G. Differential activation of nuclear receptors by perfluorinated fatty acid analogs and natural fatty acids: a comparison of human, mouse, and rat peroxisome proliferator-activated receptor-alpha, beta, and gamma, liver X receptor-beta, and retinoid X receptor-alpha. Toxicol Sci. (2006) 92:476–89. doi: 10.1093/toxsci/kfl014
18. Ren, Y, Jin, L, Yang, F, Liang, H, Zhang, Z, Du, J, et al. Concentrations of perfluoroalkyl and polyfluoroalkyl substances and blood glucose in pregnant women. Environ Health. (2020) 19:88. doi: 10.1186/s12940-020-00640-8
19. Grygiel-Górniak, B . Peroxisome proliferator-activated receptors and their ligands: nutritional and clinical implications - a review. Nutr J. (2014) 13:17–7. doi: 10.1186/1475-2891-13-17
20. Li, CH, Ren, XM, Cao, LY, Qin, WP, and Guo, LH. Investigation of binding and activity of perfluoroalkyl substances to the human peroxisome proliferator-activated receptor β/δ. Environ Sci: Processes Impacts. (2019) 21:1908–14. doi: 10.1039/c9em00218a
21. Szilagyi, JT, Avula, V, and Fry, RC. Perfluoroalkyl substances (PFAS) and their effects on the placenta, pregnancy, and child development: a potential mechanistic role for placental peroxisome proliferator-activated receptors (PPARs). Curr Environ Health Rep. (2020) 7:222–30. doi: 10.1007/s40572-020-00279-0
22. Yan, S, Zhang, H, Zheng, F, Sheng, N, Guo, X, and Dai, J. Perfluorooctanoic acid exposure for 28 days affects glucose homeostasis and induces insulin hypersensitivity in mice. Rep. (2015) 5:11029. doi: 10.1038/srep11029
23. Harjutsalo, V, Sjöberg, L, and Tuomilehto, J. Time trends in the incidence of type 1 diabetes in Finnish children: a cohort study. Lancet. (2008) 371:1777–82. doi: 10.1016/S0140-6736(08)60765-5
24. Magliano, DJ, and Boyko, EJ, IDF diabetes atlas 10th edition scientific committee. IDF DIABETES ATLAS. 10th ed. Brussels: International Diabetes Federation (2021). Available at: http://www.ncbi.nlm.nih.gov/books/NBK581934/ (Accessed November 21, 2023)
25. Liu, H, Chen, J, Dy, J, and Fu, Y. Transforming complex problems into K-means solutions. IEEE Trans Pattern Anal Mach Intell. (2023) 45:1–20. doi: 10.1109/TPAMI.2023.3237667
26. van Eersel, MEA, Joosten, H, Gansevoort, RT, Dullaart, RPF, Slaets, JPJ, and Izaks, GJ. The interaction of age and type 2 diabetes on executive function and memory in persons aged 35 years or older. PLoS One. (2013) 8:e82991. doi: 10.1371/journal.pone.0082991
27. Parker, ED, Lin, J, Mahoney, T, Ume, N, Yang, G, Gabbay, RA, et al. Economic costs of diabetes in the U.S. in 2022. Diabetes Care. (2023):dci230085. doi: 10.2337/dci23-0085
28. Zhao, X, Yang, A, Fu, Y, Zhang, B, Li, X, Pan, B, et al. Reduction of mitochondrial DNA copy number in peripheral blood is related to polycyclic aromatic hydrocarbons exposure in coke oven workers: Bayesian kernel machine regression. Environ Pollut. (2020) 260:114026. doi: 10.1016/j.envpol.2020.114026
29. Lin, CY, Chen, PC, Lin, YC, and Lin, LY. Association among serum perfluoroalkyl chemicals, glucose homeostasis, and metabolic syndrome in adolescents and adults. Diabetes Care. (2009) 32:702–7. doi: 10.2337/dc08-1816
30. Yishuang, D, Hongwen, S, Yiming, Y, Yue, M, and Yongcheng, L. Distribution of novel and legacy per−/polyfluoroalkyl substances in serum and its associations with two glycemic biomarkers among Chinese adult men and women with normal blood glucose levels. Environ Int. (2019) 134:105295:105295. doi: 10.1016/j.envint.2019.105295
31. Zang, L, Liu, X, Xie, X, Zhou, X, Pan, Y, and Dai, J. Exposure to per-and polyfluoroalkyl substances in early pregnancy, risk of gestational diabetes mellitus, potential pathways, and influencing factors in pregnant women: a nested case-control study. Environ Pollut. (2023) 326:121504. doi: 10.1016/j.envpol.2023.121504
32. Guruge, KS, Noguchi, M, Yoshioka, K, Yamazaki, E, Taniyasu, S, Yoshioka, M, et al. Microminipigs as a new experimental animal model for toxicological studies: comparative pharmacokinetics of perfluoroalkyl acids. J Appl Toxicol. (2016) 36:68–75. doi: 10.1002/jat.3145
33. Petersen, MC, and Shulman, GI. Mechanisms of insulin action and insulin resistance. Physiol Rev. (2018) 98:2133–223. doi: 10.1152/physrev.00063.2017
34. Yan, W, Bai, R, Zheng, Q, Yang, X, Shi, Y, Yang, R, et al. Concentrations and association between exposure to mixed perfluoroalkyl and polyfluoroalkyl substances and glycometabolism among adolescents. Ann Med. (2023) 55:2227844. doi: 10.1080/07853890.2023.2227844
35. Fassler, CS, Pinney, SE, Xi, C, Biro, FM, and Pinney, SM. Complex relationships between perfluorooctanoate, body mass index, insulin resistance and serum lipids in young girls. Environ Res. (2019) 176:108558. doi: 10.1016/j.envres.2019.108558
36. Trasande, L, Koshy, TT, Gilbert, J, Burdine, LK, Teresam, A, Ghassabian, A, et al. Serum perfluoroalkyl substances in children exposed to the world trade center disaster. Environ Res. (2017) 154:212–21. doi: 10.1016/j.envres.2017.01.008
37. Zeeshan, M, Zhang, Y-T, Yu, S, Huang, W-Z, Zhou, Y, Vinothkumar, R, et al. Exposure to isomers of per-and polyfluoroalkyl substances increases the risk of diabetes and impairs glucose-homeostasis in Chinese adults: isomers of C8 health project. Chemosphere. (2021) 278:130486. doi: 10.1016/j.chemosphere.2021.130486
38. Fisher, M, Arbuckle, TE, Wade, M, and Haines, DA. Do perfluoroalkyl substances affect metabolic function and plasma lipids?—analysis of the 2007–2009, Canadian health measures survey (CHMS) cycle 1. Environ Res. (2013) 121:95–103. doi: 10.1016/j.envres.2012.11.006
39. Domazet, SL, Grøntved, A, Timmermann, AG, Nielsen, F, and Jensen, TK. Longitudinal associations of exposure to Perfluoroalkylated substances in childhood and adolescence and indicators of adiposity and glucose metabolism 6 and 12 years later: the European youth heart study. Diabetes Care. (2016) 39:1745–51. doi: 10.2337/dc16-0269
40. Du, G, Sun, J, and Zhang, Y. Perfluorooctanoic acid impaired glucose homeostasis through affecting adipose AKT pathway. Cytotechnology. (2018) 70:479–87. doi: 10.1007/s10616-017-0164-6
41. Takacs, ML, and Abbott, BD. Activation of mouse and human peroxisome proliferator-activated receptors (alpha, beta/delta, gamma) by perfluorooctanoic acid and perfluorooctane sulfonate. Toxicol Sci. (2007) 95:108–17. doi: 10.1093/toxsci/kfl135
42. Yongle, Z, Jiaxi, T, Mengxue, L, Hefei, W, and Huan, Y. Contamination status of perfluorinated compounds and its combined effects with organic pollutants. Asian J Ecotoxicol. (2021) 16:86–99. doi: 10.7524/AJE.1673-5897.20200229001
43. Herzke, D, Huber, S, Bervoets, L, D’Hollander, W, Hajslova, J, Pulkrabova, J, et al. Perfluorinated alkylated substances in vegetables collected in four European countries; occurrence and human exposure estimations. Environ Sci Pollut Res Int. (2013) 20:7930–9. doi: 10.1007/s11356-013-1777-8
44. Rodea-Palomares, I, Leganés, F, Rosal, R, and Fernández-Piñas, F. Toxicological interactions of perfluorooctane sulfonic acid (PFOS) and perfluorooctanoic acid (PFOA) with selected pollutants. J Hazard Mater. (2012) 201–202:209–18. doi: 10.1016/j.jhazmat.2011.11.061
45. Houde, M, Bujas, TAD, Small, J, Wells, RS, Fair, PA, Bossart, GD, et al. Biomagnification of perfluoroalkyl compounds in the bottlenose dolphin (Tursiops truncatus) food web. Environ Sci Technol. (2006) 40:4138–44. doi: 10.1021/es060233b
46. Lau, C, Butenhoff, JL, and Rogers, JM. The developmental toxicity of perfluoroalkyl acids and their derivatives. Toxicol Appl Pharmacol. (2004) 198:231–41. doi: 10.1016/j.taap.2003.11.031
47. Yang, Q, Xie, Y, Eriksson, AM, Nelson, BD, and DePierre, JW. Further evidence for the involvement of inhibition of cell proliferation and development in thymic and splenic atrophy induced by the peroxisome proliferator perfluoroctanoic acid in mice. Biochem Pharmacol. (2001) 62:1133–40. doi: 10.1016/s0006-2952(01)00752-3
48. Julien, G, and Vincent, P. The role and future of FFA1 as a therapeutic target. Free Fatty Acid Receptors. (2016) 236:e51. doi: 10.1007/164_2016_51
49. Qin, WP, Cao, LY, Li, CH, Guo, LH, Colbourne, J, and Ren, XM. Perfluoroalkyl substances stimulate insulin secretion by islet beta cells via G protein-coupled receptor 40. Environ Sci Technol. (2020) 54:3428–36. doi: 10.1021/acs.est.9b07295
Keywords: perfluoroalkyl and polyfluoroalkyl substances, National Health and Nutrition Examination Survey, glucose metabolism, least absolute shrinkage and selection operator, Bayesian kernel machine regression
Citation: Tian Q, Yang Y, An Q, Li Y, Wang Q, Zhang P, Zhang Y, Zhang Y, Mu L and Lei L (2024) Association of exposure to multiple perfluoroalkyl and polyfluoroalkyl substances and glucose metabolism in National Health and Nutrition Examination Survey 2017–2018. Front. Public Health. 12:1370971. doi: 10.3389/fpubh.2024.1370971
Edited by:
Azubuike Chukwuka, National Environmental Standards and Regulations Enforcement Agency (NESREA), NigeriaReviewed by:
Pramita Sharma, University of Burdwan, IndiaTope Atere, Osun State University, Nigeria
Copyright © 2024 Tian, Yang, An, Li, Wang, Zhang, Zhang, Zhang, Mu and Lei. This is an open-access article distributed under the terms of the Creative Commons Attribution License (CC BY). The use, distribution or reproduction in other forums is permitted, provided the original author(s) and the copyright owner(s) are credited and that the original publication in this journal is cited, in accordance with accepted academic practice. No use, distribution or reproduction is permitted which does not comply with these terms.
*Correspondence: Lijian Lei, wwdlijian@sxmu.edu.cn
†These authors have contributed equally to this work