
94% of researchers rate our articles as excellent or good
Learn more about the work of our research integrity team to safeguard the quality of each article we publish.
Find out more
STUDY PROTOCOL article
Front. Public Health, 15 July 2024
Sec. Planetary Health
Volume 12 - 2024 | https://doi.org/10.3389/fpubh.2024.1366110
 Christopher D. Golden1,2,3*†
 Aaron C. Hartmann4†Emma Gibbons5†
 Gildas Todinanahary6†
 Max F. Troell7,8†Gaelle Ampalaza6Faustinato Behivoke6Jean Marie David6
 Jean-Dominique Durand9
 Aroniaina M. Falinirina6Christopher Frånberg10Frédéric Declèrque6Kimberly Hook11
 Heather Kelahan1Megumi Kirby4
 Karestan Koenen1
 Thomas Lamy9Thierry Lavitra6Franciana Moridy6Marc Léopold12
 Mark J. Little4Jean C. Mahefa6Jovial Mbony6
 Khristopher Nicholas1Aina Le Don Nomenisoa6
 Dominique Ponton13
 Roddy R. Rabarijaona6,14Mihary Rabearison6Sarah A. Rabemanantsoa6Mbolahasina Ralijaona6
 Harinirina S. Ranaivomanana6Hervet J. Randriamady1José Randrianandrasana6
 Hanitra O. Randriatsara15Roddy M. Randriatsara6Madeleine Rasoanirina6
 Michel R. Ratsizafy6Kinasa F. Razafiely6
 Nivohanitra Razafindrasoa16Romario6Marc Y. Solofoarimanana6
 Rocky E. Stroud II11Mandimbilaza Tsiresimiary6Anissa J. Volanandiana6Nadège V. Volasoa17Brooke Vowell5Jessica Zamborain-Mason1,2
The Health Impacts of Artificial Reef Advancement (HIARA; in the Malagasy language, “together”) study cohort was set up in December 2022 to assess the economic and nutritional importance of seafood for the coastal Malagasy population living along the Bay of Ranobe in southwestern Madagascar. Over the course of the research, which will continue until at least 2026, the primary question we seek to answer is whether the creation of artificial coral reefs can rehabilitate fish biomass, increase fish catch, and positively influence fisher livelihoods, community nutrition, and mental health. Through prospective, longitudinal monitoring of the ecological and social systems of Bay of Ranobe, we aim to understand the influence of seasonal and long-term shifts in marine ecological resources and their benefits to human livelihoods and health. Fourteen communities (12 coastal and two inland) were enrolled into the study including 450 households across both the coastal (n = 360 households) and inland (n = 90 households) ecosystems. In the ecological component, we quantify the extent and health of coral reef ecosystems and collect data on the diversity and abundance of fisheries resources. In the social component, we collect data on the diets, resource acquisition strategies, fisheries and agricultural practices, and other social, demographic and economic indicators, repeated every 3 months. At these visits, clinical measures are collected including anthropometric measures, blood pressure, and mental health diagnostic screening. By analyzing changes in fish catch and consumption arising from varying distances to artificial reef construction and associated impacts on fish biomass, our cohort study could provide valuable insights into the public health impacts of artificial coral reef construction on local populations. Specifically, we aim to assess the impact of changes in fish catch (caused by artificial reefs) on various health outcomes, such as stunting, underweight, wasting, nutrient intake, hypertension, anxiety, and depression.
Seafood plays a pivotal role in human nutrition and health, serving as a rich source of essential nutrients that contribute to overall well-being. Abundant in high-quality proteins, omega-3 fatty acids, such as eicosapentaenoic acid (EPA) and docosahexaenoic acid (DHA), and micronutrients like iron, zinc, iodine, selenium, and vitamins D and B12, seafood is essential for thyroid function, immune support, cardiovascular health, and neurological health in many food cultures around the world (1). Given current trajectories in global fish catch declines, the nutritional security of many countries (particularly climate-vulnerable regions of the Global South) is at risk (2, 3). Beyond climate change and other environmental changes (4, 5), local environmental changes and unsustainable fishing practices may also threaten food security, highlighting the importance of local climate mitigation and adaptation interventions that may stabilize food security in the face of rapid environmental change.
The fishery and aquaculture sector directly employed an estimated 600 million people around the world in 2020, resulting in the production of more than 178 million tons of non-algal aquatic foods (6). These aquatic foods were consumed globally at an estimated rate of 20 kilograms per capita, a rate that is expected to increase by an average of 15% globally by 2030. Access to these aquatic animal-source foods and associated nutrients is important as they impact human health through multiple pathways, including (1) reducing micronutrient deficiencies that can result in diseases, (2) providing omega-3 long-chain polyunsaturated fatty acids docosahexaenoic acid (DHA) and eicosapentaenoic acid (EPA) which have been associate with a lower risk of heart disease, and (3) through the dietary displacement of processed meats associated with poor health outcomes (1, 7, 8). Studies have also identified the role that aquatic foods play in meeting dietary diversity requirements (9) and food security at a local level (10). Together this suggests that continued and improved access to aquatic foods is important for those living in Madagascar given micronutrient deficiencies are high (11), and dietary diversity (12) and food security are generally low (13).
Globally, there has been a dearth of evidence empirically linking fisheries to human health outcomes which hinders nutrition-sensitive management approaches (14). Some research has shown the importance of fish access in early childhood to combat linear growth faltering and to foster brain and immune development, with much of this research occurring in South Asia, the Pacific Islands, and Sub Saharan Africa (15–18). Other research in contexts dependent on small-scale fisheries such as Northeastern Madagascar, Kiribati, the Solomon Islands, and First Nation communities in Canada examine the interplay between ecological factors and social environments (namely resource governance) to shape fishing practices, fish catch, and ultimately dietary and health outcomes (10, 19–21). Still others have studied fisher livelihoods, barriers to fish consumption and fish access, household environments and social structures, and mental health outcomes, underscoring the precarity of fishers’ livelihoods as more than just a factor shaping household dietary intake (22–25). However, there has yet to be prospective research linking marine ecological environments, social dimensions of fisher communities and their diets, and clinical epidemiological data on nutritional status and mental health using a robust longitudinal study design outside of Madagascar.
Madagascar is ranked 173rd out of 191 on the Human Development Index (HDI), a composite measure of human wellbeing inclusive of economic and social characteristics (26). A primarily agrarian and tourism dependent economy, Madagascar’s gross domestic product (GDP) growth was strongly stunted by the COVID-19 pandemic and successive natural disasters (27). Following a 7% GDP reduction in 2020 and a mining industry-driven GDP rebound of 6 percent in 2021, successive natural disasters led to a low GDP growth of under 4% in 2022 (28). These crises have contributed to an additional 1.8 million people falling below the international poverty line (USD 2.15 per day) and a poverty rate exceeding 80 percent for the first time since 2012 (29). With poverty compounded by drought, cereal and tuber prices have drastically increased, further pushing vulnerable communities into poverty (30). In addition to high levels of overall poverty, recent years have witnessed an increase in income inequality, with this divergence in wealth accumulation most prominent in urban areas where poverty rates declined and rural areas where poverty rates increased (31).
Approximately 80 percent of Madagascar is primarily employed in agriculture, increasing vulnerability to crop yields, commodity prices, and global trade (29). In some regions in southeastern Madagascar, cassava production has decreased by up to 40 percent in 2023 compared to the previous year’s production (32). Similar trends are observed for other root vegetables such as sweet potato, increasing the risk for food shortages and reduced household income. Nearly 1.5 million people in Madagascar are employed in fishing and aquaculture, and the fishery sector (annual production capacity of $750 million) contributes more than 7% of the national gross domestic product and 6.6% to total exports (33). In Madagascar the small but growing aquaculture industry is being dominated by small-holders farming freshwater fish for domestic food and marine species such as seaweed, sea cucumber and shrimp for export (34, 35). As of 2021, aquaculture produced 11,600 tons of marine algae, 3,300 tons of marine shrimps and 1,300 tons of freshwater fish (34).
Madagascar is one of the most chronically undernourished countries in the world, with a stunting prevalence of nearly 40%, the 10th highest in the world (36). More acutely, it is ranked second in the world of countries experiencing hunger (37). The country also suffers one of the highest maternal mortality rates in the world with 478 deaths per 100,000 live births (38), and with 37.8% of reproductive-aged women (15–49 years) affected by anemia (36). Low birth weight continues to plague child health with 17.1% of infants affected. Near famine-like conditions are present in the southern part of the country due to persistent drought and agricultural failure, leading to widespread food insecurity. National prevalence of wasting is 7.7% in children under 5 years of age, which is higher than the average for the Africa region (6.0%) (36). The nutrition transition has yet to fully take hold of Madagascar, with a low prevalence (1.8%) of overweight children under 5 years of age, a low prevalence of obesity (9.2%) in adult women, and a very low prevalence (3.8%) in adult men (36).
Beyond nutritional issues, Madagascar suffers a high burden of water-borne illness and infectious diseases including malaria and increasing prevalence of non-communicable diseases (39, 40). Diarrheal diseases, driven by infections like Rotavirus (41) and limited access to clean water and sanitation, are the number one cause of death in Madagascar (42). Malaria has been on the rise in Madagascar with an estimated 40% increase in mortality rate between 2015 and 2021 and over five million documented malaria cases in 2021 (43). Other top causes of death include non-communicable diseases like stroke, heart disease, and cirrhosis (42).
The population burden of mental disorders is also likely to be high in Madagascar although limited data exists. The WHO reported that approximately 13% (970 M) of the world’s population lived with mental disorders in 2019 (44). Anxiety and depressive disorders represented 31 and 28.9% of the total mental disorders in 2019, respectively. In 2019, depression itself accounted for 39% of the global burden of mental disorders in disability-adjusted life years (DALYs); it is the second leading cause of global years lived with disability (YLDs), representing 5.6% of all YLDs in 2019 (44). Similar to other low-income countries, Madagascar lacks mental health care specialists. To date, Madagascar has 24 psychiatrists for 27 million people. Non-specialist health workers such as traditional healers and faith healing centers still play essential roles in providing mental care in Madagascar. Mental disorder assessment instruments commonly used in other African countries have not been validated in Madagascar. At health clinics, psychiatric data are lumped into a single composite as mental disorders. Therefore, basic population-based data on mental disorders do not exist for Madagascar, limiting the ability to guide interventions.
The need for population mental health data in Madagascar is urgent given the growing evidence for an association between climate change and mental disorders (45, 46). Madagascar is highly vulnerable to climate change, and, in 2020, drought impacted 1.3 million people (47). Recently, research has confirmed that global climate change is responsible for the increasing frequency and severity of droughts in Southern Madagascar (48). Given the challenges of poverty, food insecurity, climate change, and lack of mental health care specialists, it is likely that the mental health of the Malagasy population will worsen in the coming years without population-based mental health interventions.
The broader impacts of global climate change, such as increasing temperatures, rising sea levels and increased frequency of extreme weather events, severely threatens Madagascar’s rich biodiversity, with implications for local livelihoods and global conservation efforts (49, 50). Approximately five million people are affected by recurring natural disasters, including cyclones, floods, and droughts (51). Recent studies have indicated that the increasing frequency and intensity of cyclones in Madagascar have led to significant damage to critical ecosystems such as coral reefs and thus to significant disruptions in coastal fisheries (52). It results in diminished fish stocks and severe impacts on the livelihoods of local fishing communities, who rely heavily on these resources for their sustenance and economic stability. Beyond these broader factors associated with climate change, overfishing, driven by both local needs and international demand, also threatens marine ecosystems and coastal livelihoods (53, 54).
In the Bay of Ranobe, situated in southwestern Madagascar, these overarching environmental concerns manifest with particular intensity. The bay’s coral reefs, part of the larger Toliara Barrier Reef system, are under stress from overfishing (55, 56), unsustainable tourism practices (57) and global coral bleaching events (58). As fish populations dwindle, local communities, which rely heavily on marine resources, face socio-economic challenges (55). Additionally, sedimentation from upstream deforestation has the potential to smother corals, affecting the health of the entire reef ecosystem (59) and potentially leading to increased algal blooms, both macroalgae (60) and microalgae (61). The Bay of Ranobe, known for its biodiversity and as a significant ecotourism destination, represents a microcosm of Madagascar’s broader environmental struggles, making it a focal point for conservation and sustainable development efforts (55).
Madagascar’s coral reefs are highly valuable ecosystems with biological, socio-economic and cultural importance. Representing a hotspot of biodiversity in the Western Indian Ocean (WIO), Madagascar’s coral reefs extend over ~2,400 km2 along 1,400 km of coastline (62), and they are on par with that of the Coral Triangle (63) and other ecoregions in the WIO (60, 64). These reef habitats are particularly concentrated off the northeast, northwest, and southwest coasts (57, 60). Madagascar’s overall coral reef diversity is comparable to the Coral Triangle, with 380 coral species, 788 reef-associated fish species, and more than 6,000 other benthic marine species (64, 65).
Like most coral reefs worldwide, major bleaching events have affected Madagascar’s coral reefs. Bleaching events were particularly severe in 1998 (a year of global bleaching), followed by 2002, 2012, and 2016 (58, 66, 67). Therefore, the status of coral reefs in Madagascar since 1998 has shown a 30–50% decline in coral cover across the country, losing 20% in the last 20 years (68). The decline was associated with the increase of macroalgae and other non-reef building species reducing habitat for reef-building corals (57, 60). In addition to these climate impacts, overfishing, water pollution, and destructive fishing and gleaning activities have led to negative impacts on reef fisheries resources (56, 59, 69–71).
Artificial reefs have been implemented throughout the world, many with the express purpose of increasing fisheries production in temperate and tropical regions (72). These structures are proposed as a nature-based solution based on the ecological theory that generating new primary production will generate food for larger fish that are caught by humans [reviewed in (73)]. If this food web is created, it is proposed that the artificial reef will produce fish for human consumption in perpetuity.
Artificial reefs are commonly constructed to create new areas of the seafloor that are populated by particular marine communities to enhance fisheries productivity. Most artificial reefs are designed with hard substrates to form a necessary foundation for a reef community and ecosystem (as opposed to soft substrate such as sand). Ecological theory suggests that increasing the amount of benthic habitat for larval and adult fishes should increase their abundances and the abundances of larger fishes that consume them. Still, the question remains of whether artificial reefs increase fish biomass by adding habitat or merely aggregate existing fish populations, allowing for easier capture and compounding overfishing (73, 74). Critical to answering this question is assessing whether the artificial reef produces sufficient food to support a food web and/or increases the carrying capacity of the system, such that primary productivity is produced on the reef and moved up to harvested species.
This study is currently ongoing as we prepare for long-term data collection to evaluate the nutritional and human health benefits of artificial coral reef construction and ecological restoration. The methods are carefully written to establish what has been completed in contrast to activities that are still underway.
We are implementing an in situ before-after-control-impact (BACI) study to empirically test a novel approach designed to speed up ecological succession on artificial coral reefs and increase fish and invertebrate biomass by creating a robust food web. Specifically, we are collecting data before and after building the artificial reefs, among which we are building three control reefs without community seeding and three impact reefs with community seeding. We will seed healthy reef communities onto artificial and control reefs using Autonomous Reef Monitoring Structures or ARMS. ARMS are stacks of settlement plates affixed to the benthos that passively accumulate reef biota from their surroundings via larval dispersal, adult movement, and overgrowth (75). This natural process is being leveraged to collect the biota healthy natural reefs and move them to artificial coral reefs to achieve the aims to: (1) increase habitat diversity, fish and invertebrate diversity, and fish and invertebrate biomass; (2) increase fisheries catch and landings, and (3) improve human health and well-being. We are also assessing how some shallow-water coastal aquaculture practices contribute to human health and well-being and potential socio-ecological trade-offs from interactions with natural ecosystems and future artificial reefs. We are codifying our data collection protocol in a guide to create a tool to quantify interdependencies between reef and human health, which can be used worldwide. All data were collected at the reference sites and will be collected again at the references and on the ARs after the ARs are built, providing before and after AR data of the ecological status of the Bay. Specific comparisons to be made include the difference in community successional patterns on Impact vs. Control ARs (using all metrics listed above), and changes in reef community health and change on reference reefs through time relative to those on the adjacent ARs. This data collection pattern will be mirrored on land to understand impact on human communities affected by these ecological processes.
Our BACI (Before-After-Control-Intervention) study design is being implemented throughout the 170 km2 Bay of Ranobe to empirically determine whether seeding artificial reefs changes benthic community diversity and biomass, fish abundance, fisheries production, fisheries landings, human dietary diversity, human consumption of seafood, and reductions in the incidence of stunting and wasting. Each one of these linkages is considered a sequential hypothesis, first determining the impact of artificial reefs on ecological communities, fish diversity and biomass, then on fisheries production and catch, then on consumption, livelihoods, nutrition and health.
Six artificial coral reefs (ARs) will be built inside the lagoon of the Bay of Ranobe. The AR design mimics spur-and-groove reef, a natural reef formation in which narrow rows of “spurs” comprised of hard substrate with corals and other invertebrates are interspersed with “grooves” of sand. Spur-and-groove was selected because these reef formations exist in the Bay and because they are highly stable under high water flow conditions, as are found at our sites. Each AR will consist of five 50 m spurs that are ~1.5 m high. In aggregate, each AR will cover ~1 ha of the seafloor (5 parallel spurs plus the space in between forming a rectangle). The limestone boulders used to create the spurs are locally quarried and range in size up to ~0.25 m squared. To test the benefits of ARMS seeding on benthic health within and between ARs, each spur will be organized as follows from end-to-end: open space, ARMS only (5), open, ARMS (2) and coral fragments interspersed, open space, coral fragments only, and open space.
To select AR sites the Bay was split into three regions, north, middle, and south. Two AR sites were selected in each region so that one AR will be seeded with healthy reef biota while the other will not. Within each region, the two ARs will be at least 1 km apart and two natural reefs per region (six total) have been selected for monitoring as control sites (Figure 1).
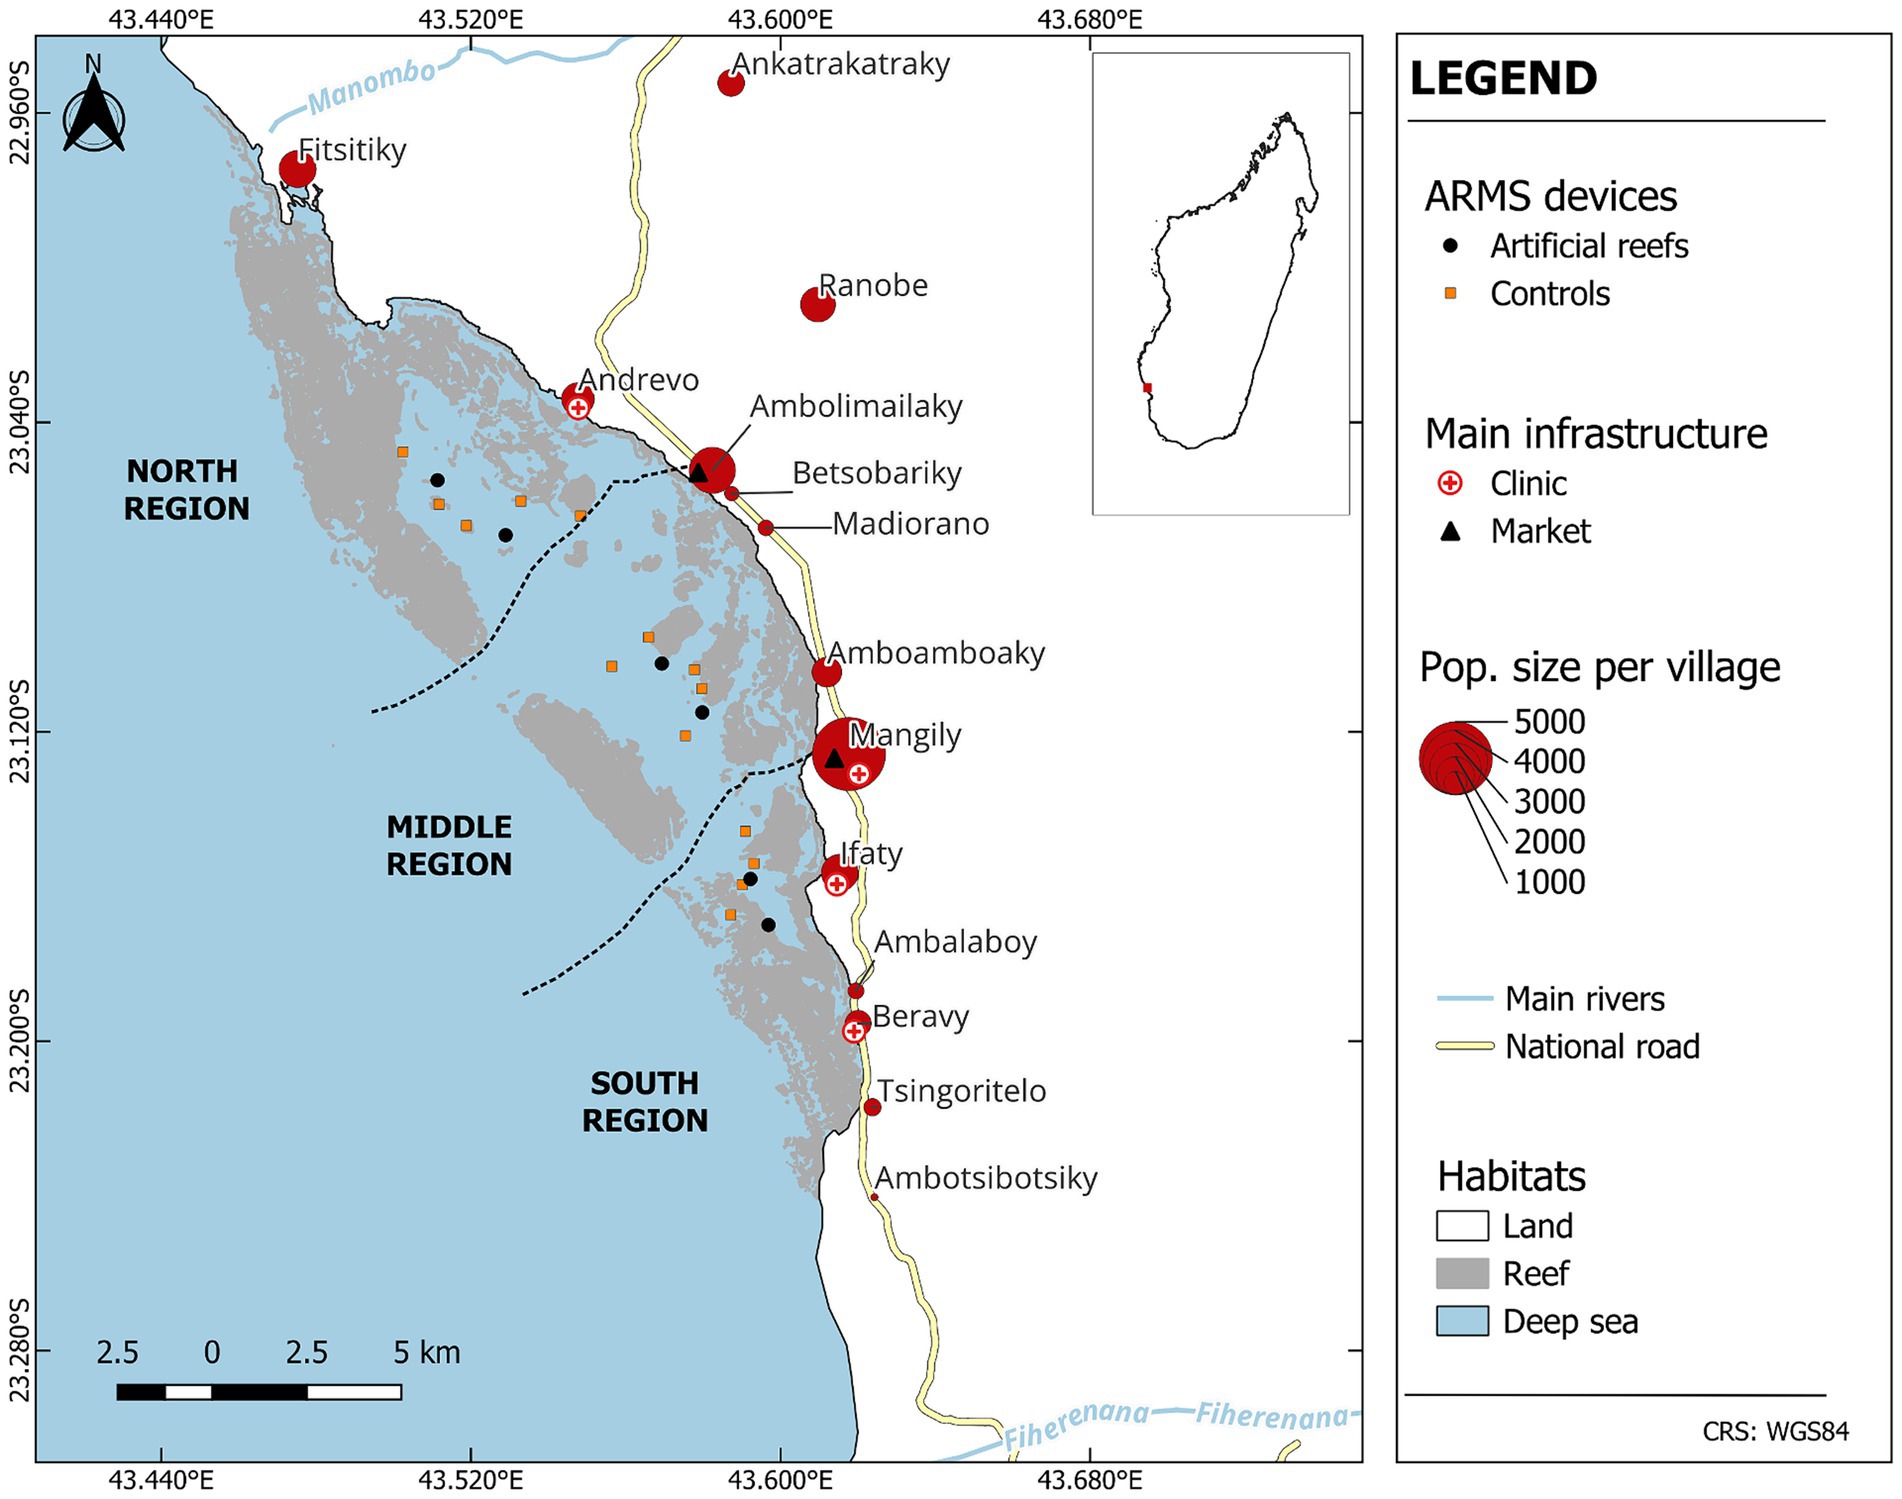
Figure 1. Study location in the Bay of Ranobe. This map highlights our study site in the Bay of Ranobe, including 12 adjacent coastal villages and 2 nearby inland villages. All natural reef areas are colored in gray. Black dots represent the ARMS device locations on artificial reefs that have been installed and are monitored by our team, two per region, whereas red squares represent the ARMS devices on natural reef areas that are also monitored by our team. The ARMS devices will collect biota throughout the study and will be sampled both prior to the artificial reef installation, and over the course of the study. There are no artificial reef structures without ARMS devices so all black dots represent both the artificial reef and its accompanying ARMS device.
The Bay of Ranobe region, situated in the south-west region of Madagascar, may be geographically defined by the Manombo River in the north and the Onilahy River in the south that form the northern and southern borders, respectively (Figure 1). The Bay is a category VI multiple-use protected area coastal lagoon system situated along the southwestern coast of Madagascar. The lagoon system extends ca. 70 km along its southeast-northwest axis, measures ca. 12 km at the widest point, covering ca. 42,404 ha.
There are 12 coastal communities along the Bay that rely on reef fisheries and are home to diverse Malagasy ethnic groups, with the Vezo and Masikoro being the predominant communities. The Vezo, known as traditional semi-nomadic fishermen, have forged a lifestyle tightly intertwined with the marine environment, relying heavily on fishing and gleaning. Conversely, the Masikoro, primarily sedentary herders and farmers, traditionally depended on terrestrial resources for their livelihood. However, a noteworthy shift has occurred in the Bay of Ranobe, as the Masikoro have now adapted and engaged in marine activities through easily accessible means, breaking the traditional link between marine resource exploitation and ethnicity. On the other hand, the Bay is surrounded by more than 5 inland communities adjacent to it, mainly inhabited by Masikoro people.
A full census of 14 communities, 12 coastal and 2 inland, was conducted to understand the overall demographics of the Bay of Ranobe and construct a sampling frame from which a stratified random sample of households could be identified (Table 1; see Supplementary Table 1 for data collected during recruitment). A census survey was done in 12 coastal communities from January to June 2022, followed by a census of 2 inland communities in January 2023 (not comprehensive of the adjacent inland communities adjacent to the Bay, but chosen to represent traditional Masikoro agricultural livelihoods). The census included basic demographic and socio-economic data from every household (e.g., name, sex, age, number of children, occupation, and year of migration for each participant) for the construction of a sampling frame. The census was conducted by a team of five enumerators and five local assistants per community. The enumerators visited each household (n = 4,665), obtained consent to participate in the census, and collected information from the head of the household or a trusted representative if the head was absent. The enumerators carefully recorded responses on a tablet, using the kobocollect application.
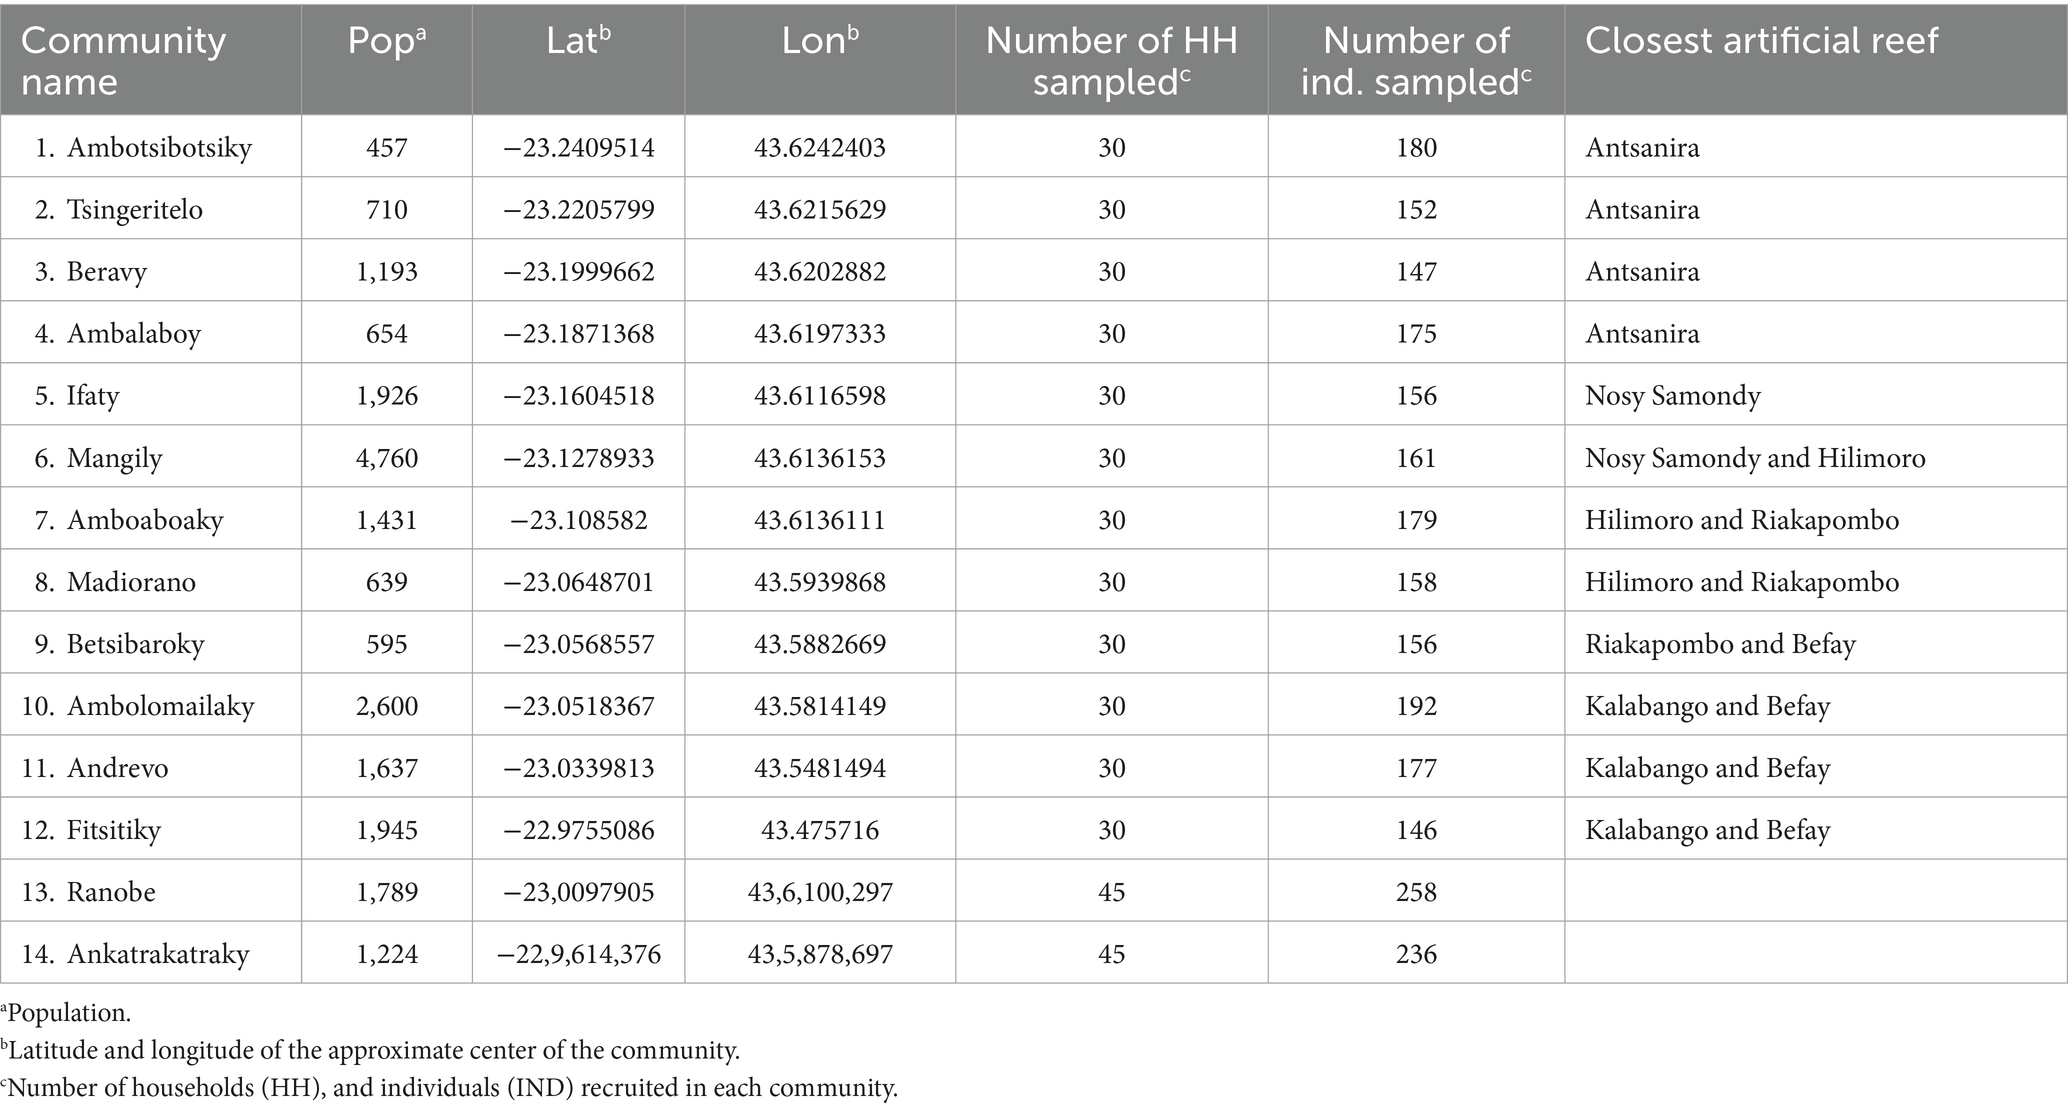
Table 1. Study locations.
The human health team (HJR, AF, CDG) trained five research assistants to collect data. Their training included a deep familiarization with all the questionnaires employed and gauging the level of understanding of respondents during the pilot survey period. The training and pilot survey period lasted 3 weeks. Four enumerators were assigned to conduct surveys in three coastal communities each, while the fifth enumerator was assigned to the two inland communities.
The team recruited and enrolled a total of 450 households across both the coastal (n = 360 households) and inland (n = 90 households) ecosystems (Figure 2). Based on the census data and associated demographic information, our sampling approach considered four distinct categories within the coastal communities. Firstly, for each community, we recruited and enrolled 30 households per community. We sampled 11 households that included at least one individual engaged in fishing and at least one child under the age of 5. Secondly, we sampled 8 households that had at least one fisher but no child under the age of 5. Thirdly, we randomly selected 5 households that had at least one child under the age of 5 but no fisher. Lastly, we included 6 households that had neither a fisher nor a child under the age of 5. These sampling numbers represented approximately 10% of each category across all communities. For the inland communities, we recruited and enrolled 45 households per community, stratifying the sample by those households with at least one farmer (n = 32 in Ranobe and n = 39 in Ankatrakatraky) and households without a farmer (n = 13 in Ranobe and n = 6 in Ankatrakatraky). However, during the sampling process, we accounted for potential non-cooperation from selected households by adding 2 additional households per category as replacements.
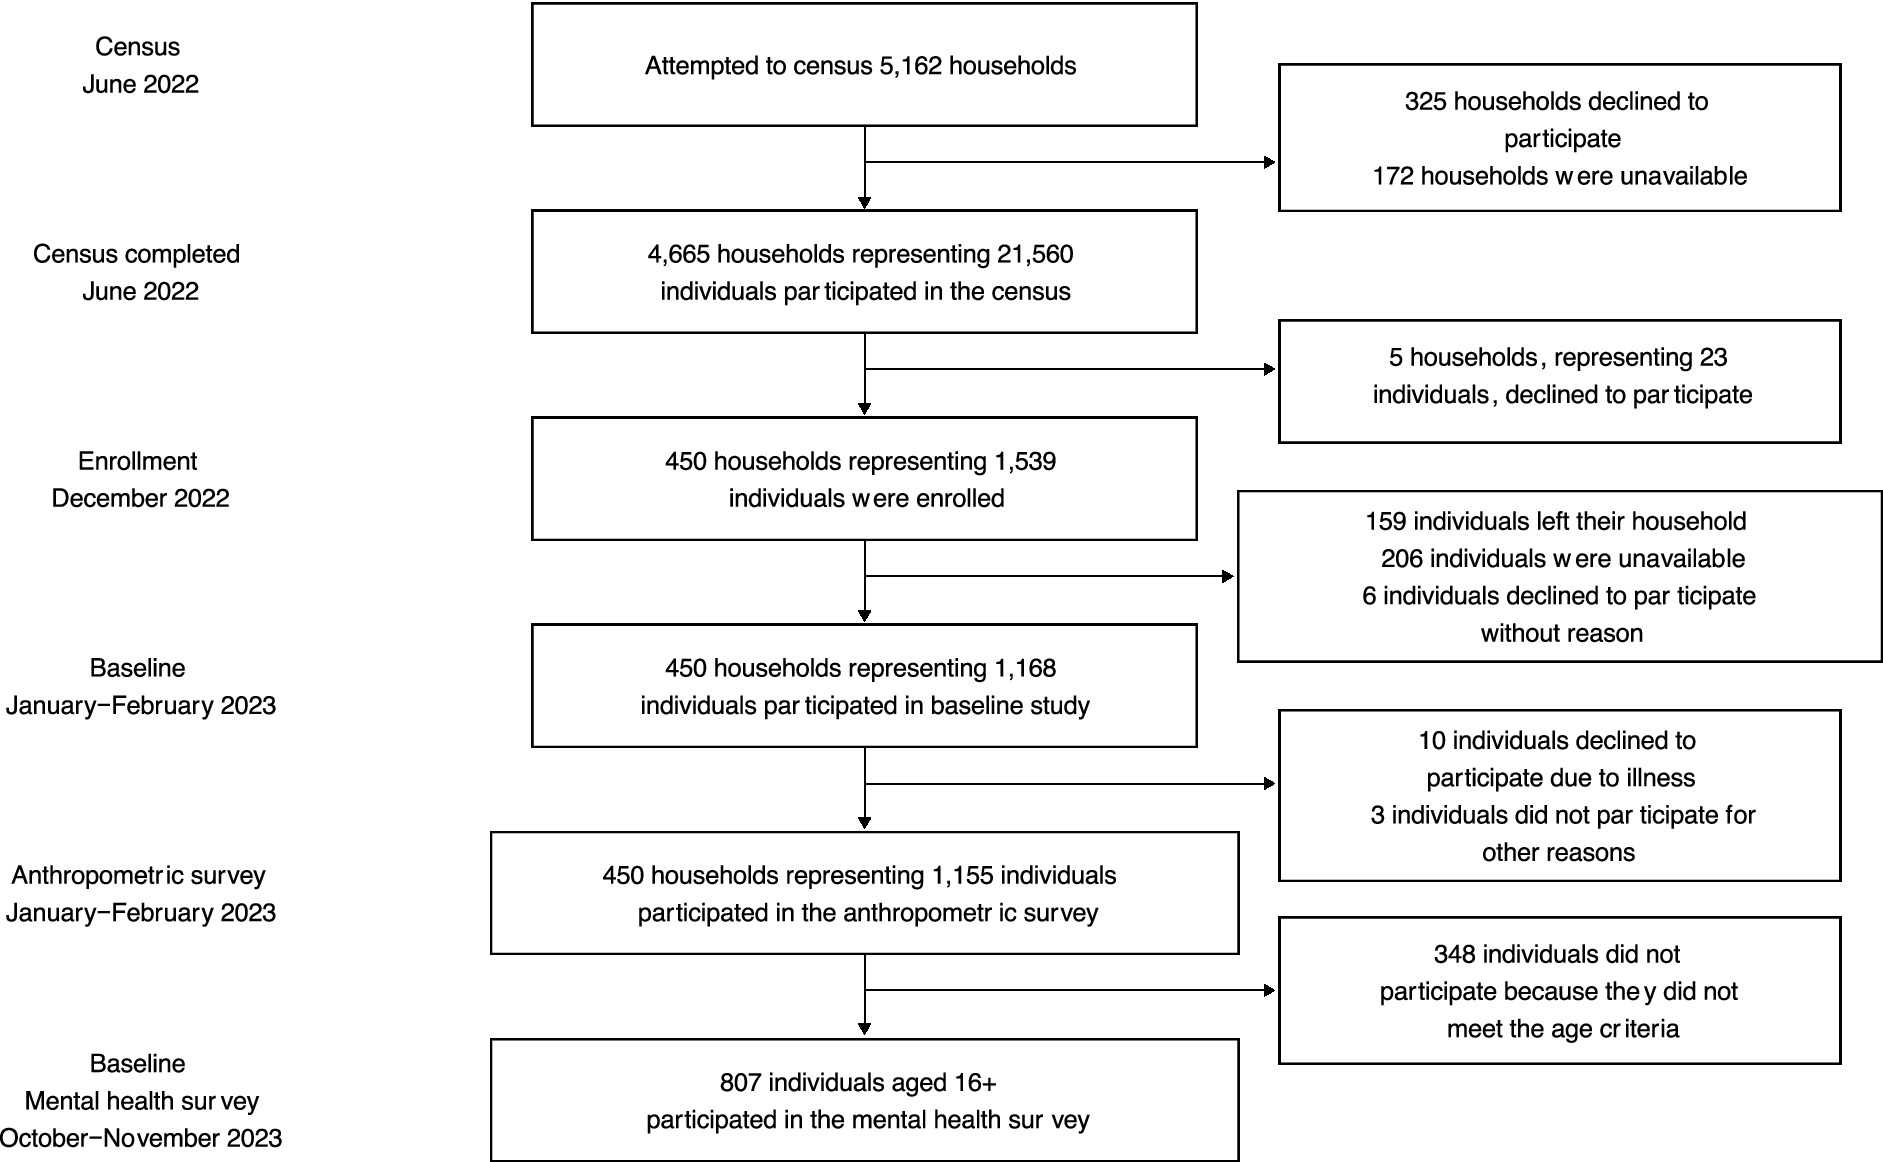
Figure 2. Consort figure (diagram of pop sample and enrollment, etc.). This flow diagram showcases the recruitment, withdrawals, and overall adherence of study participants to date.
Beginning in December 2022, after households were enrolled in the cohort, they began taking part in socio-economic and dietary surveys every 3 months, which will last until at least the end of 2025. The surveys captured information regarding household socio-economics, health, and dietary intake (Table 2; see Supplementary Table 1 for a copy of the survey).
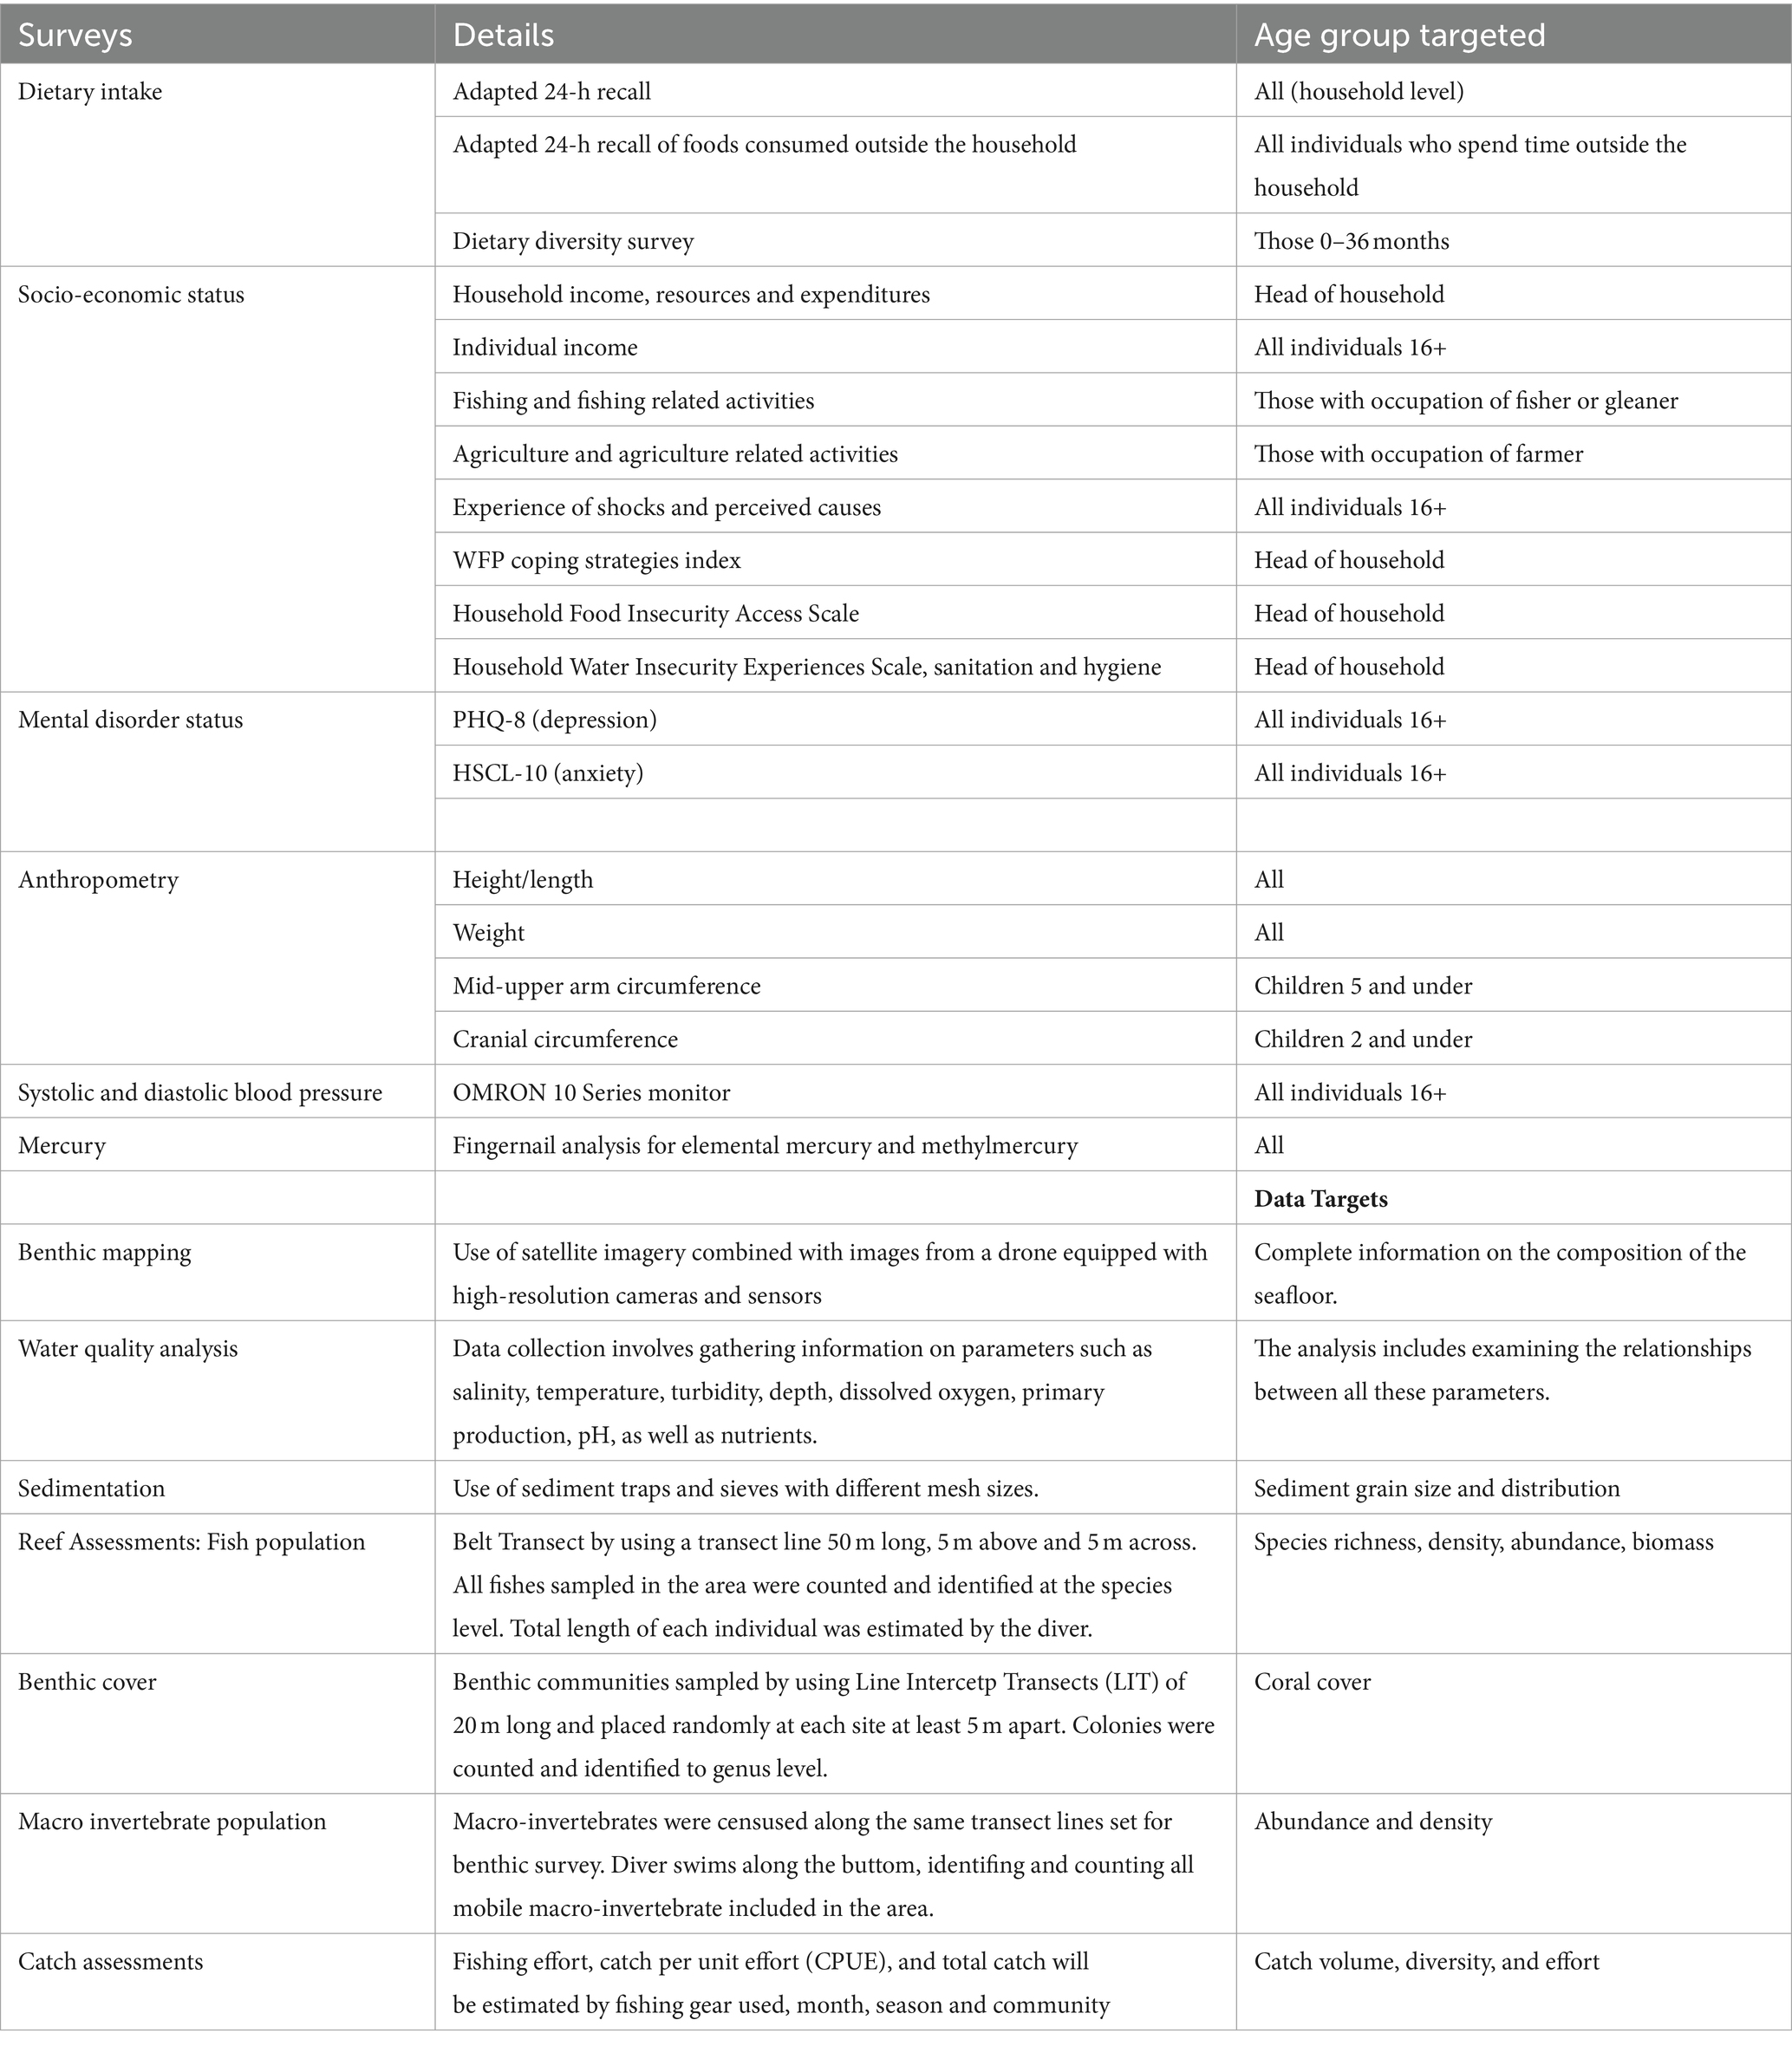
Table 2. Metadata of all surveys, instruments, and targeted populations.
The socio-economic survey was divided in two parts: (1) a household-level module given only to the head of household, and; (2) an individual-level module given to all individuals in the household. For those under 13 years of age, individual-level survey questions were asked of a caregiver identified for that individual. The head of household survey covered demographic questions including occupation and household income sources, both from fishing and non-fishing related activities (e.g., agriculture, other sales, etc.). In-depth questions were asked regarding fishing and fishing-related activities, including questions on the most common types of aquatic foods harvested. Questions were also asked about household resources, such as livestock, and household expenditures on categories like food, healthcare, education, transportation, and housing. To understand coping mechanisms used by the household, the World Food Programme coping strategies index (76) was included alongside the household food insecurity access scale aimed at understanding the behavioral and psychological manifestations of insecure food access (77). To understand constraints around water availability, the Household Water Insecurity Experiences (HWISE) Scale was included with questions on sanitation and hygiene (78).
The individual-level module included questions on individual occupation and income. In-depth questions were asked about participation in fishing and fishing related activities, including time allocated to activities and equipment available for use. Individuals were asked about environmental, economic, and social shocks experienced over the last quarter, such as drought or reduced fish catch, as well as their perception of the cause of that shock. The individual survey also included a detailed health questionnaire and the collection of anthropometric and blood pressure data, detailed below.
To understand dietary intake in the Bay of Ranobe, the socio-economic survey included an adapted 24-h recall administered at the household level, and an individual level survey focused on foods commonly consumed outside the home to complement intake estimations within the household. For the household level survey, the household member identified as the primary food preparer was asked which foods, from a preidentified list of culturally and nutritionally relevant foods (see Supplementary Table 2 for a comprehensive list of foods), the household consumed in the prior day. If a food was identified as consumed, a follow-up question was asked to determine the total portion size consumed by the household of that food. To supplement the household-level survey, each individual in the household was also asked about consumption of foods identified as commonly consumed outside of household meal times, which tend to be shared group meals. The lists of foods asked about were developed based on reported food consumption from previous 24-h recalls conducted in similar populations (79), commonly consumed marine foods identified by local experts, and foods reported as consumed during focus groups prior to the beginning of our surveys.
A primary objective of our research is to understand the mental health implications of climate change and natural resource scarcity. To accomplish this, we set out to develop and validate local, culturally appropriate instruments in the Malagasy language to assess the prevalence of mental health conditions using an adapted version of the Design, Implementation, Monitoring, and Evaluation (DIME) model (80). In 2022 and 2023, the team conducted rapid social studies to identify priority mental health and psychosocial problems relevant to climate change based on local Malagasy experiences and perceptions. The main objectives of the qualitative survey were to identify major mental health and psychosocial issues in adults, and identify terminology used to describe the causes, experiences, and symptoms of mental health in the Bay of Ranobe. First, the team conducted 6 focus group discussions (FGDs) in the Bay of Ranobe to comprehensively list common mental health issues. Second, the team conducted 32 free listing interviews, using the common mental health issues from the FGDs to elicit causes, symptoms, and treatment associated with locally prevalent mental health issues. Third, the team conducted 23 key informant interviews with primary care providers in the Bay of Ranobe, such as traditional healers, religious healers, community health workers, and non-mental health specialists to understand common mental health problems and treatments provided to the patients.
Based on the FGD and free-listing interviews, we adapted the Patient Health Questionnaire 8 (PHQ-8) for depression and the 10-item anxiety subscale from the Hopkins Symptom for anxiety (HSCL-10) to local Malagasy ethnolinguistic groups in southwestern Madagascar. The PHQ-8 is a brief self-reported screening instruments for depression based on the eight criteria for diagnosing depression found in the DSM-5 and found to be a reliable instrument (81–83). Similarly, the HSCL-10 has been adapted and tested for validity and reliability in some non-western countries (84–86). We then supplemented the PHQ-8 and the HSCL-10 with questions based on local idioms for relevant mental health constructs.
Anthropometric data collection includes weight (kg) using a digital bathroom scale. Height (cm) is collected using a portable stadiometer for those over the age of 2 years and length (cm) is collected using infant measurement mats for those under two. For those under 5 years old (<60 months), mid upper arm circumference (MUAC; cm) is collected using color coded MUAC tapes, and cranial circumference (cm) is collected using tape measures. Systolic and diastolic blood pressure is collected using OMRON 10 series monitor for those over the age of 16. Prior to measurement of blood pressure, participants are asked to rest in a seated position with both feet flat on the ground.
Two sites were selected in each of three regions of the Bay for building the artificial reefs (AR). The precise locations of the ARs were selected based on community input (fishers and other community members), proximity to natural reefs, benthos comprised of sand flats, and a depth of 8–12 m. Two sites were selected per region so that each region will have one AR with ARMS seeding (Impact) and one without ARMS seeding (Control). The health status of natural coral reefs in the Bay of Ranobe was also assessed at 33 sites–nearly all reefs in the Bay (Figure 1). Reef health was quantified based on benthic cover from underwater visual census (UVC; stony corals, other invertebrates, algae, etc.), biodiversity from environmental DNA, cryptic biodiversity from autonomous reef monitoring structures or ARMS (species diversity of organisms living within the reef matrix), fish abundances, microorganism diversity (bacteria and viruses), and environmental conditions including temperature, light, oxygen, and current movement (using an Acoustic Doppler Current Profiler; Nortek Eco), all of which are described in more detail below. The baseline study was also used to select four to five natural reef sites per region (the south region only had four natural reef sites) as reference sites for comparisons to the artificial reefs through time. Reference sites were chosen such that they were a similar distance and between 500 and 1,000 m away from the AR sites (Figure 2).
Each month, we are quantifying the distribution and percent cover of macroorganisms living on the benthos (e.g., coral, algae) using Underwater Visual Census (UVC). UVC is carried out using the circular count method in which a diver counts fish along a radius line of 56 cm (87). One count was carried out per site because a circular count of 56 cm is equivalent to 100 m square of area sampled. All species are counted and identified at the genus (macroinvertebrates) and species level (fish). The size of each individual fish is also recorded using the following size classes: 0–5 cm; 5–10 cm; 10–15 cm; 15–20 cm; 20–25 cm and > 30 cm (88). The medians of each size are used to calculate the biomass of each species according to the following equation (FishBase): W = a.Lb, where W is the weight (in g), L is the total length (in cm), and the parameters a and b are species-specific constants.
To complement UVC, environmental DNA or eDNA metabarcoding is used to comprehensively characterize fish diversity (12S gene) and total eukaryotic biodiversity (COI gene) using standard methods (89). Water samples are collected for eDNA isolation in three zones (north, central, and south) of the bay, covering four different habitats in each zone: mangroves, seagrass beds, sands, and natural coral reefs. Within each habitat, two sub-sites per zone were selected, except for mangroves which only occur in the northern and southern zones. As a consequence, three mangrove sub-sites were selected both in the northern and southern zone to compensate for the absence of mangrove in the central zone. Three water sample replicates are taken at each sub-site for a total of 108 samples and 4 controls. Water samples are filtered onto a Sylphium eDNA Dual Filter Capsules (0.22 μm pore size) using a peristaltic Vampire pump until filter obstruction (for a minimum of 5 L of water filtered).
The abundance of cryptic and microscopic species living within the reef matrix are surveyed using Autonomous Reef Monitoring Structures or ARMS. The original PVC and stainless-steel ARMS design was redesigned in this study to be made of limestone because the material is locally sourceable, less expensive, and natural. Fifteen ARMS were deployed to census cryptic and microscopic diversity prior to the implementation of the artificial reefs, three each at five sites chosen to include a “healthy” reef, degraded reef, sand flat, site with an existing artificial reef from a previous project, and the healthy reef site where ARMS seeding is occurring. A UVC method was developed and implemented to quantify benthic succession on ARMS throughout the 18-month deployment period. Monthly, divers identify and count living organisms attached to ARMS (mobile and sessile species) while the ARMS remain in place on the reef. After 18 months of UVC, the traditional approach for ARMS-based censuses were applied in which ARMS are collected from the benthos, disassembled, photographed on all sides of each plate, sorted by motile morphospecies, and scraped of all attached material, which is blended and stored for genetic analyses (90).
The UVC belt transect method is also used to assess water column fish abundance, diversity and biomass in 500 m2 of the study area, providing a fisheries-independent estimate of fish communities. Data are collected along two randomly replicated transect lines 50 m long, 5 m above the benthos, and 5 m wide. All fish sampled are counted and identified at the species level. Total length of each individual is estimated according to the following six size-classes: <10 cm, 10–20 cm, 20–30 cm, 30–40 cm, 40–50 cm, >50 cm. The midpoint of the fish size classes is used to estimate the wet mass of each size class. Fish biomass is calculated for each station using species-specific length-weight equations: W = a.Lb, where W is the weight (in g), L is the total length (in cm), and the parameters a and b are species-specific constants that have been extracted from FishBase.
An initial assessment of the physico-chemical conditions of the Bay of Ranobe was taken prior to building the artificial reefs. These data included temperature, light, dissolved oxygen, and current direction and speed. These data were initially collected at the six sand flat sites selected for artificial reef building and six natural reef sites. Since then, 22 study sites are being similarly monitored throughout the Bay at three-month intervals. This assessment is divided into three parts: benthic mapping, water quality, and sedimentation analysis. Remote sensing techniques are employed for benthic mapping of the entire bay, whereby satellite imagery in conjunction with drone imagery provides a large-scale overview of the benthic habitat. Complementing these, underwater images will be used to generate higher-resolution data regarding the benthic habitat, ensuring a comprehensive collection of visual data.
Measurements of physico-chemical parameters will be conducted at the 22 sites and will include salinity, temperature, turbidity, depth, dissolved oxygen, primary production, and pH. Water samples will also be collected for nutrient analysis, including phosphate, nitrate, nitrite, ammonium, silicate, and sulfate, using laboratory techniques and chemical reagents. These analyses aim to enhance our understanding of the environmental factors influencing the ecosystem. Sediments will be collected at the sites using sediment traps. Subsequently, these sediments will be sorted and measured based on their size to determine their grain size distribution.
Water samples were taken from 22 sites prior to the installation of the artificial reefs to assess a suite of microbiological parameters that are indicators of coral reef state (as described in 91). This sampling consisted of collecting seawater on SCUBA to quantify the concentrations of viruses and bacteria, bacterial biomass, dissolved organic carbon (DOC), nutrients, taxonomic profiles, and functional gene analysis. The ratio of viruses or virus-like particles (VLPs) to microbes (virus-to-microbe ratio or VMRs) has recently been shown to be one of the strongest predictors of coral reef ecosystem health and healthy trophic structuring (92). Here, we incorporated these important viral and microbial indicators into our assessment of coral reef restoration to support fisheries.
From October 2021 to January 2023, we conducted a monthly fisheries survey and fish biodiversity monitoring in the Bay of Ranobe. Team members, working in collaboration with local fishers, quantified fisheries landings (total catch, size distributions) and fish biodiversity by evaluating what was landed on the shore. The fisheries survey includes two components: (i) participatory, self-reported monitoring of fishers’ catches by filling a monitoring sheet after each fishing trip and (ii) a monthly landing survey of the catch to monitor catch diversity. The catch of 103 fishers from 12 communities of the bay were monitored during this time period, distributed according to the five main gears used to target coral reef fishes such as gillnet, handline, speargun, mosquito net trawl, and beach seine (Table 3). After January 2023, surveys and monitoring have continued though at less regular frequency.
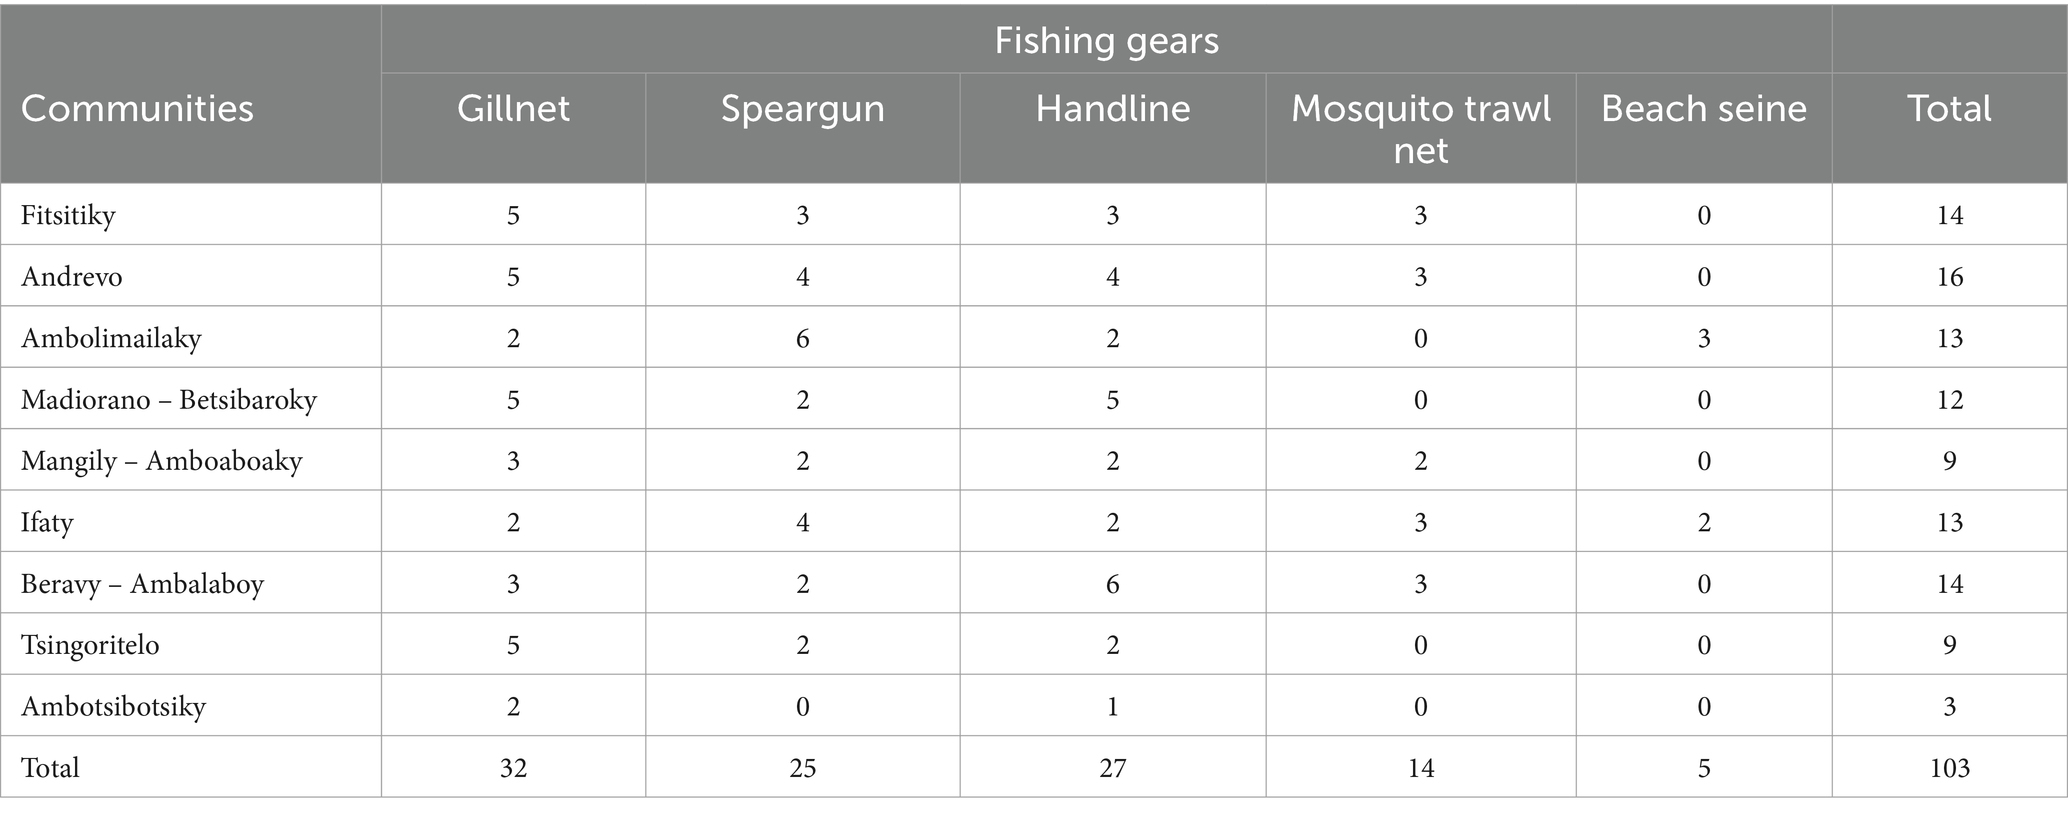
Table 3. Number of fishers per community involved in the catch monitoring each 30 days in the Bay of Ranobe from October 2021.
From October 2021 to January 2023, the daily catches of each fisher were monitored and recorded on a monitoring sheet for a 30-day period. Over that period, all information related to each fishing trip made were recorded such as the total weight of catch per taxon in kg (reef fish, pelagic fish, crabs, sea cucumbers, squid, octopus, gastropods), the number of fishers participating on each boat, the fishing gear used, the fishing ground exploited, and the sale price of the products in Malagasy ariary (MGA). All data were filled out through self-report by the fisher with the supervision of a local assistant. In order to have the spatial distribution of the catch, a GPS tracker was carried on the boat of the fisher monitored during the survey period. These GPS data will allow our team to connect changes in reef system habitat to changes in fish catch and dietary intake patterns.
Catch compositions were monitored once per month per community from the 103 boats surveyed, through a landing survey, taking into account different factors (community, fishing gear, tide). For each fishing trip sampled, the following information was collected by a member of our research team: the weight of total catch across all taxa (in kg), the weight of reef fishes (in kg); fishing gear used, number of fishers on board, and the name of the region fished. Catches from gillnet, handline and speargun were photographed per group of morphospecies (individuals that appear to be the same) on a white board with a smartphone for identification and measurement. For each board of morphospecies photographed, we asked if those fish were for consumption or for sale.
For the case of catches from mosquito net trawl and beach seine, fish are often small and in large quantities. A sample of 1 kg of the total catch (without sorting) was purchased for evaluation at the laboratory in Ifaty. In the laboratory, reef fishes were sorted by morphospecies and then photographed with a photographic set up [(see 93) for details]. Reef fish were identified at family level based on morpho-anatomical characteristics. For each boat monitored, the fish are grouped by morphotype (individuals of the same family that have similar external morphology) and photographed on the same plate. An individual representing this morphotype is then photographed individually and a small piece of fin from this individual is taken to be used for DNA barcoding analysis. The fish tissues were collected every 2 months as part of the landing survey. Using a DNA barcoding approach (94, 95), we identified species after sorting fishes observed in the field according to their morphology.
Interviews were conducted from July to August 2022 with contracted seaweed and sea cucumber farmers in six communities situated in Ranobe Bay (Andrevo, Ambolomailaky and Ifaty) and Toliara Bay (Ankilibe, Antanandreviky and Sarodrano). A total of 178 seaweed farmers and 87 sea cucumber farmers were interviewed. In addition, interviews were also conducted with private aquaculture companies and other stakeholders including fishermen, hotel owners, and responsible government authorities.
The contracted farmers were identified from consultation with key individuals representing the different communities. The semi-structured interviews conducted with farmers covered demography, primary and secondary occupation, incomes, expenditures and information about experiences and perceptions related to farming practices. We interviewed private companies, including Ocean Farmers and Indian Ocean Trepang, for information related to the value-chain and value-adding steps, review of their business models, expansion plans and view on competitors and market developments.
Focus group interviews with fishers were held to discuss their experiences on fishing success since aquaculture practices had been introduced. Additionally, interviews with hotels were conducted to investigate how their business been affected. An additional interview was conducted with the Ministry of Fisheries and the Blue Economy section within the government, assessing legislation, permitting, and emerging issues within the aquaculture sector.
Throughout the duration of the project, we are engaging in regular and structured interactions with all communities involved in our projects to ensure effective communication and to gather comprehensive feedback. These interactions cover project vision, data collection, community needs, and any ways in which our team can elevate community voices to policy makers, all aimed at empowering the community.
Our approach involves frequent, scheduled visits to each village within the intervention area, which range from a minimum of once per quarter to as often as several times per week, depending on the program of work. These visits ensure that our strategies remain inclusive and adaptable to evolving community needs. On occasion, our team has undertaken the initiative of communicating interim research results through poster presentations at community meetings. These sessions facilitated a comprehensive understanding of the objectives of our study within each community, strengthening the trust they place in our research team. More frequently during these meetings, we connect with councils of Masikoro and Vezo elders who are meeting weekly to provide strategic guidance on both project development and community communication. Outside of these councils, we engage directly with various stakeholders, including local leaders and community groups, to facilitate a two-way communication stream that allows for immediate and proactive responses to new developments or concerns. This active involvement not only strengthens our project’s impact but also ensures that the benefits of our research and interventions are fully understood and effectively utilized by the communities we serve.
Our partnership with the RENAFEP women in fisheries network, which includes 2,400 women in the Bay of Ranobe, underscores our commitment to gender inclusivity and promotes women’s empowerment in local fisheries management. We support these women with training in post-harvest fisheries processing, enhancing local trade networks, and improving agency within this sector. This initiative not only uplifts the strength of the network but also significantly contributes to the socio-economic development of the community.
Data collection is not yet complete and therefore analysis has not yet begun. All data will be analyzed with the intention of connecting changes in ecological conditions of the Bay of Ranobe to the availability and harvest of seafood, and the consequent impacts on human livelihoods, nutrition, and health.
Household dietary intake data will be categorized into intake of prespecified food groups identified as culturally and nutritionally important for the community. These food groups will be used to conduct a posteriori dietary pattern analysis, using cluster analysis, where dietary patterns are identified based on differences in mean dietary intake (96). K-means clustering, the most used clustering method for dietary pattern analysis, will be used to minimize the squared Euclidean distance between households, or in other words, minimize the within-cluster variance of each cluster (97). Intake of each prespecified food group will be converted to percent of total household intake, to account for differences in energy intake due to household makeup, for example number of individuals, and individual characteristics, like activity level. The cluster analysis will separate households into mutually exclusive dietary patterns. The number of clusters maintained from the analysis will be selected based on the number that are meaningfully distinct, based on analysis of a scree plot, and interpretable given the cultural context (96). Once dietary patterns have been identified the mean intake of each food group can be calculated for each dietary pattern.
Once dietary patterns are identified, multi-level linear and logistic regression will be used to understand how dietary patterns relate to health outcomes. The exposure of interest will be an indicator for identified household dietary pattern. Outcomes of interest will include Body Mass Index, waist circumference, blood pressure, mid upper arm circumference and probability of experiencing stunting or wasting. Covariates of interest include sex, age, household income, community, and total household energy consumption.
The analysis of the mental health data will be a mixed-method approach: qualitative and quantitative. Based on the free-listing analysis, the local depression and anxiety-like syndromes shared similar signs and symptoms found in the DSM-5 for depression and anxiety disorders. Therefore, the PHQ-8 and HSCL-10 were selected to screen for depression and anxiety disorders. The idioms and vernacular signs and symptoms from the free-listing were used for the cross-cultural adaption of the PHQ-8 and HSCL-10.
The validity and reliability of the PHQ-8 and HSCL-10 will be assessed. Content validity will be assessed using exploratory factors and confirmatory analysis to evaluate if the adapted mental PHQ-8 and HSCL-10 appear to cover the domain coverage for depression and anxiety disorders The internal consistency, such as Cronbach’s alpha, will be computed to evaluate the reliability of the PHQ-8 and HSCL-10. Construct validity will be assessed by examining the relationship between depression and anxiety scores because depression and anxiety are primarily comorbid.
A test–retest reliability will be conducted for approximately 150 individuals from the study population to assess the temporal stability of the PHQ-8 and HSCL-10. The two instruments will be administered twice. A different enumerator will administer the second survey 2 weeks after the first one. The inter-class correlation (ICC) will be computed to quantify the temporal stability of the instruments. Specific symptoms prevalent from the free-listing interviews but not present in the PHQ-8 and HSCL-10 will be added to the cross-cultural adaptation of the two instruments to improve their reliability.
To evaluate the association between seasonality, food insecurity, water insecurity, and mental disorders during four occasions spread across the year, a liner mixed model (LMM) will be used. LMM is suitable for longitudinal psychiatric data, where the main outcomes will be the PHQ-8 and HSCL-10 scores. The main exposures will be food insecurity measured by the Household Food Insecurity Assessment Scale (HFIAS) (77), water insecurity measured by the Household Water Insecurity Experience Scale (78), and a list of shocks inclusive of social, environmental, and economic issues. We will ascertain the degree of depression and anxiety attributable to food and water insecurity and various social, economic, and environmental shocks.
The analyses of ecological data, primarily focusing on biodiversity levels and community distributions (e.g., percentage of corals vs. algae), rely on direct observer counts and on next-generation gene sequencing. UVC methods are used to quantify and map the distributions of species on the benthos (e.g., corals), in the water column (e.g., fishes), and in cryptic habitats on the reef (e.g., sponges growing on ARMS). Supplementing these data, gene sequencing (metabarcoding and metagenomics) will be used to identify microscopic and cryptic diversity on the benthos (ARMS) and in the water column (eDNA).
We will produce detailed benthic maps, which will include information on substrate composition and reef structures. Multivariate analyses will be carried out to determine the parameters that best predict reef health. In addition, a sedimentation distribution will be created using mapping tools after studying the granulometry of the sediments. This cartographic visualization will highlight the different granulometry of sedimentation on the different sites studied.
The abundance of bacterial and virus-like particles (VLPs) will be quantified using SYBR gold staining and epifluorescence microscopy. These are visualized through 0.02 and 0.2 anodisc filtration and microscope slide mounting. The abundance of bacteria and viruses are determined through size classifications (0.2–0.45 μm for bacteria, and 0.02–0.2 μm for VLPs) (98). These data reveal the number of bacteria and viruses per ml, and the virus-to-microbe ratio (VMR). Shotgun sequence data, as described and generated in (99), are collected from the reef water DNA samples through a combination of bioinformatic tools. This includes bacterial and viral functional annotations through the SEED subsystems database (100, 101). Together, these comprehensive environmental microbiological data provide an overview of the taxonomy, ecological functions, and abundances of viruses and microbes across gradients of health and artificial reef sites in the Bay of Ranobe.
Taxonomic and functional analyses from the metagenomes (microbes) and viromes (virus-enhanced metagenomes) will allow for the detection of known microbial and viral pathogens in natural and artificial reef sites in the Bay [as described in (99, 102)]. These data will also provide the first in situ data on pathogens surveyed through shotgun metagenomics in the Bay of Ranobe. While coral reef pathogens (microbial and viral) will be assessed in the samples, runoff-associated pathogens reflective of human infection or wastewater runoff, will also be detected. Together, these data will provide information on the microbial and viral species that may be affecting coral reef health, the humans that rely on them, and potentially those species that are associated with both.
Catch data collected during the survey will be extrapolated to the whole fishery of the Bay of Ranobe following conventional methods of fishery monitoring and assessment (103). Fishing effort, catch per unit effort (CPUE), and total catch will be estimated by fishing gear used, month, season and community. Spatial distribution of the catch and fishing effort will also be evaluated using the data from GPS trackers.
Photographs of morphospecies from the landing survey will be used to measure the total length (TL; in cm) of each individual using the software ImageJ (104). The size distribution of reef fish catches (by species and/or family) in each 1-cm size class will be estimated per fishing gear used and by survey-period. Minimum size at maturity will be used to obtain the proportion of juvenile and adult fish in catch (105, 106).
In preliminary analyses, DNA barcoding was conducted at Montpellier University (UMR MARBEC). A portion of 652 bp of the cytochrome oxidase 1 (COI) was systematically amplified and sequenced for all morphotypes identified (i.e., fish species visually sorted in the field), such that a DNA “fingerprint” was created for each fish specimen visually described as a distinct species in the field. All COI barcodes were uploaded in the Barcode Of Life Datasystems (BOLD) library to obtain a barcode index number (BIN), and is used as an interim taxonomy. A metanalysis of all BINs (i.e., putative fish species based on a distinct gene sequence) recorded in the Bay of Ranobe was done to link a known binomial species name (Genus species) to the BIN. One fish specimen was selected from each BIN and used to create a representative gene barcode or fingerprint for that species. For the representative specimens, the complete 12S ARNr gene was sequenced (i.e., longer than the portion described above) to build a library useful for the metabarcoding of environmental DNA samples (eDNA) (see previous section).
All households were recruited and enrolled, and each individual consented, following our IRB approved study (Protocol #20–1944 and 22–0491, Committee on the Use of Human Subjects, Office of Human Research Administration at the Harvard T.H. Chan School of Public Health). The study was also reviewed and approved by the Ethics Committee of the Ministry of Public Health (N036MSANP/SG/AMM/CERBM), and then stamped by the Division of Mental Health Services at the Malagasy Ministry of Health and by the local medical inspector in Toliara.
Animal care and use protocols were submitted to the Madagascar Ministry of the Environment and Sustainable Development (MEDD) and permitted for all research activities through the following authorizations from MEDD/SG/DGGE/DAPRNE/SCBE 117/22; 060/23; and 310/23.
During a census, we attempted to survey a total of 5,162 households from 14 communities (12 coastal, and 2 inland). Of the 4,554 households in the 12 coastal communities, we enrolled 4,057 households (with 325 households declining to participate and 172 households unavailable at the time of our visit). In the inland communities, all 608 households willingly participated in the census with no households declining or absent during our visit. Overall, we enrolled a total of 4,665 households across 14 communities, comprising a population of 21,560 individuals. In the coastal communities, between 12.4 and 65.1% of the population identified as fishers while between 0.2 and 19.2% of the population identified as farmers (Table 4). In the inland communities, between 71.1 and 92.2% of the population identified as farmers, while there were virtually no fishers living in these communities as it is too distant from the ocean (Table 4).
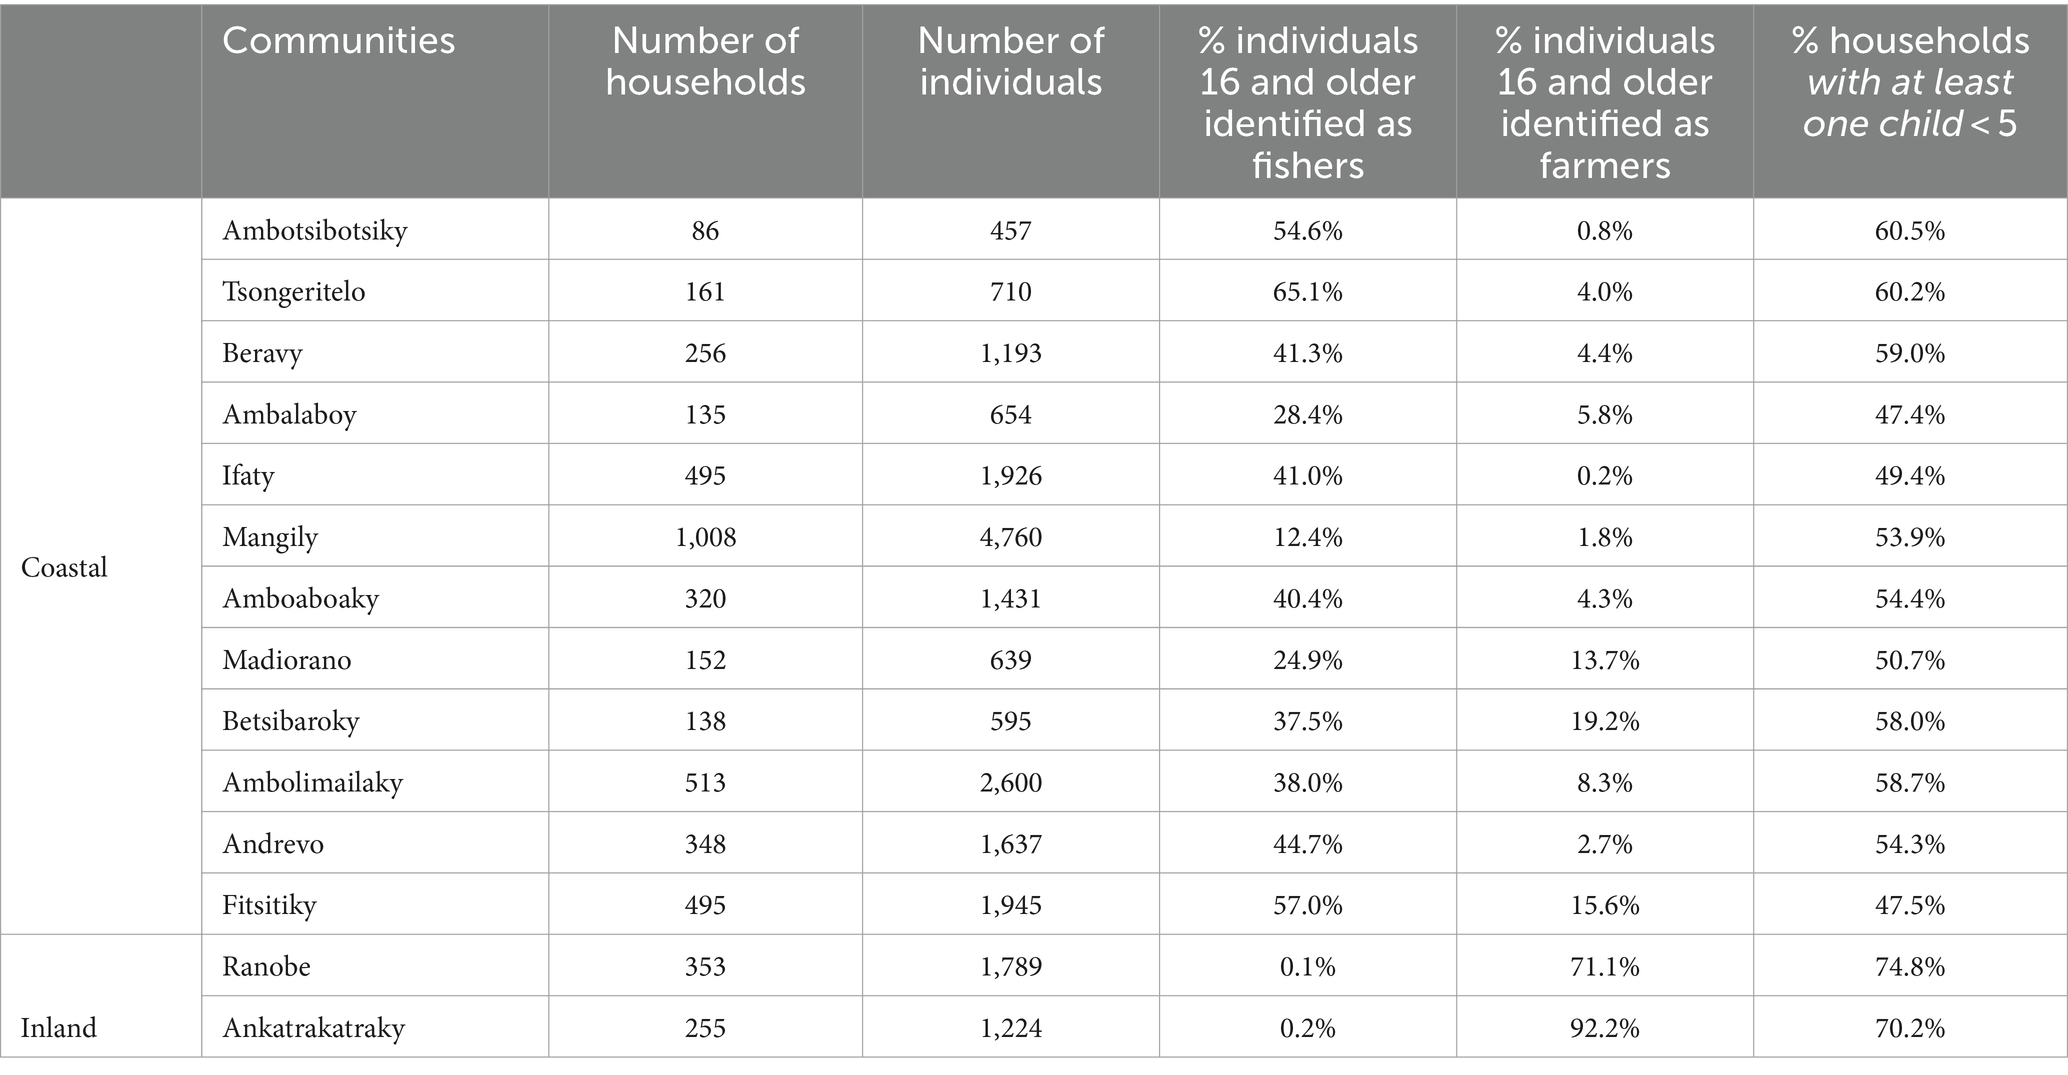
Table 4. Socio-demographic data of enrolled households in the study.
All individuals were assessed for BMI, stunting, wasting, and underweight, finding drastically higher rates of stunting and underweight in inland communities, with rates of wasting being fairly similar between the two regions (Table 5). Severe stunting was three-fold higher in inland communities as compared to coastal communities (62.5% vs. 19.8%) and severe underweight was nearly double in inland communities as compared to coastal communities (21.2% vs. 11.5%).
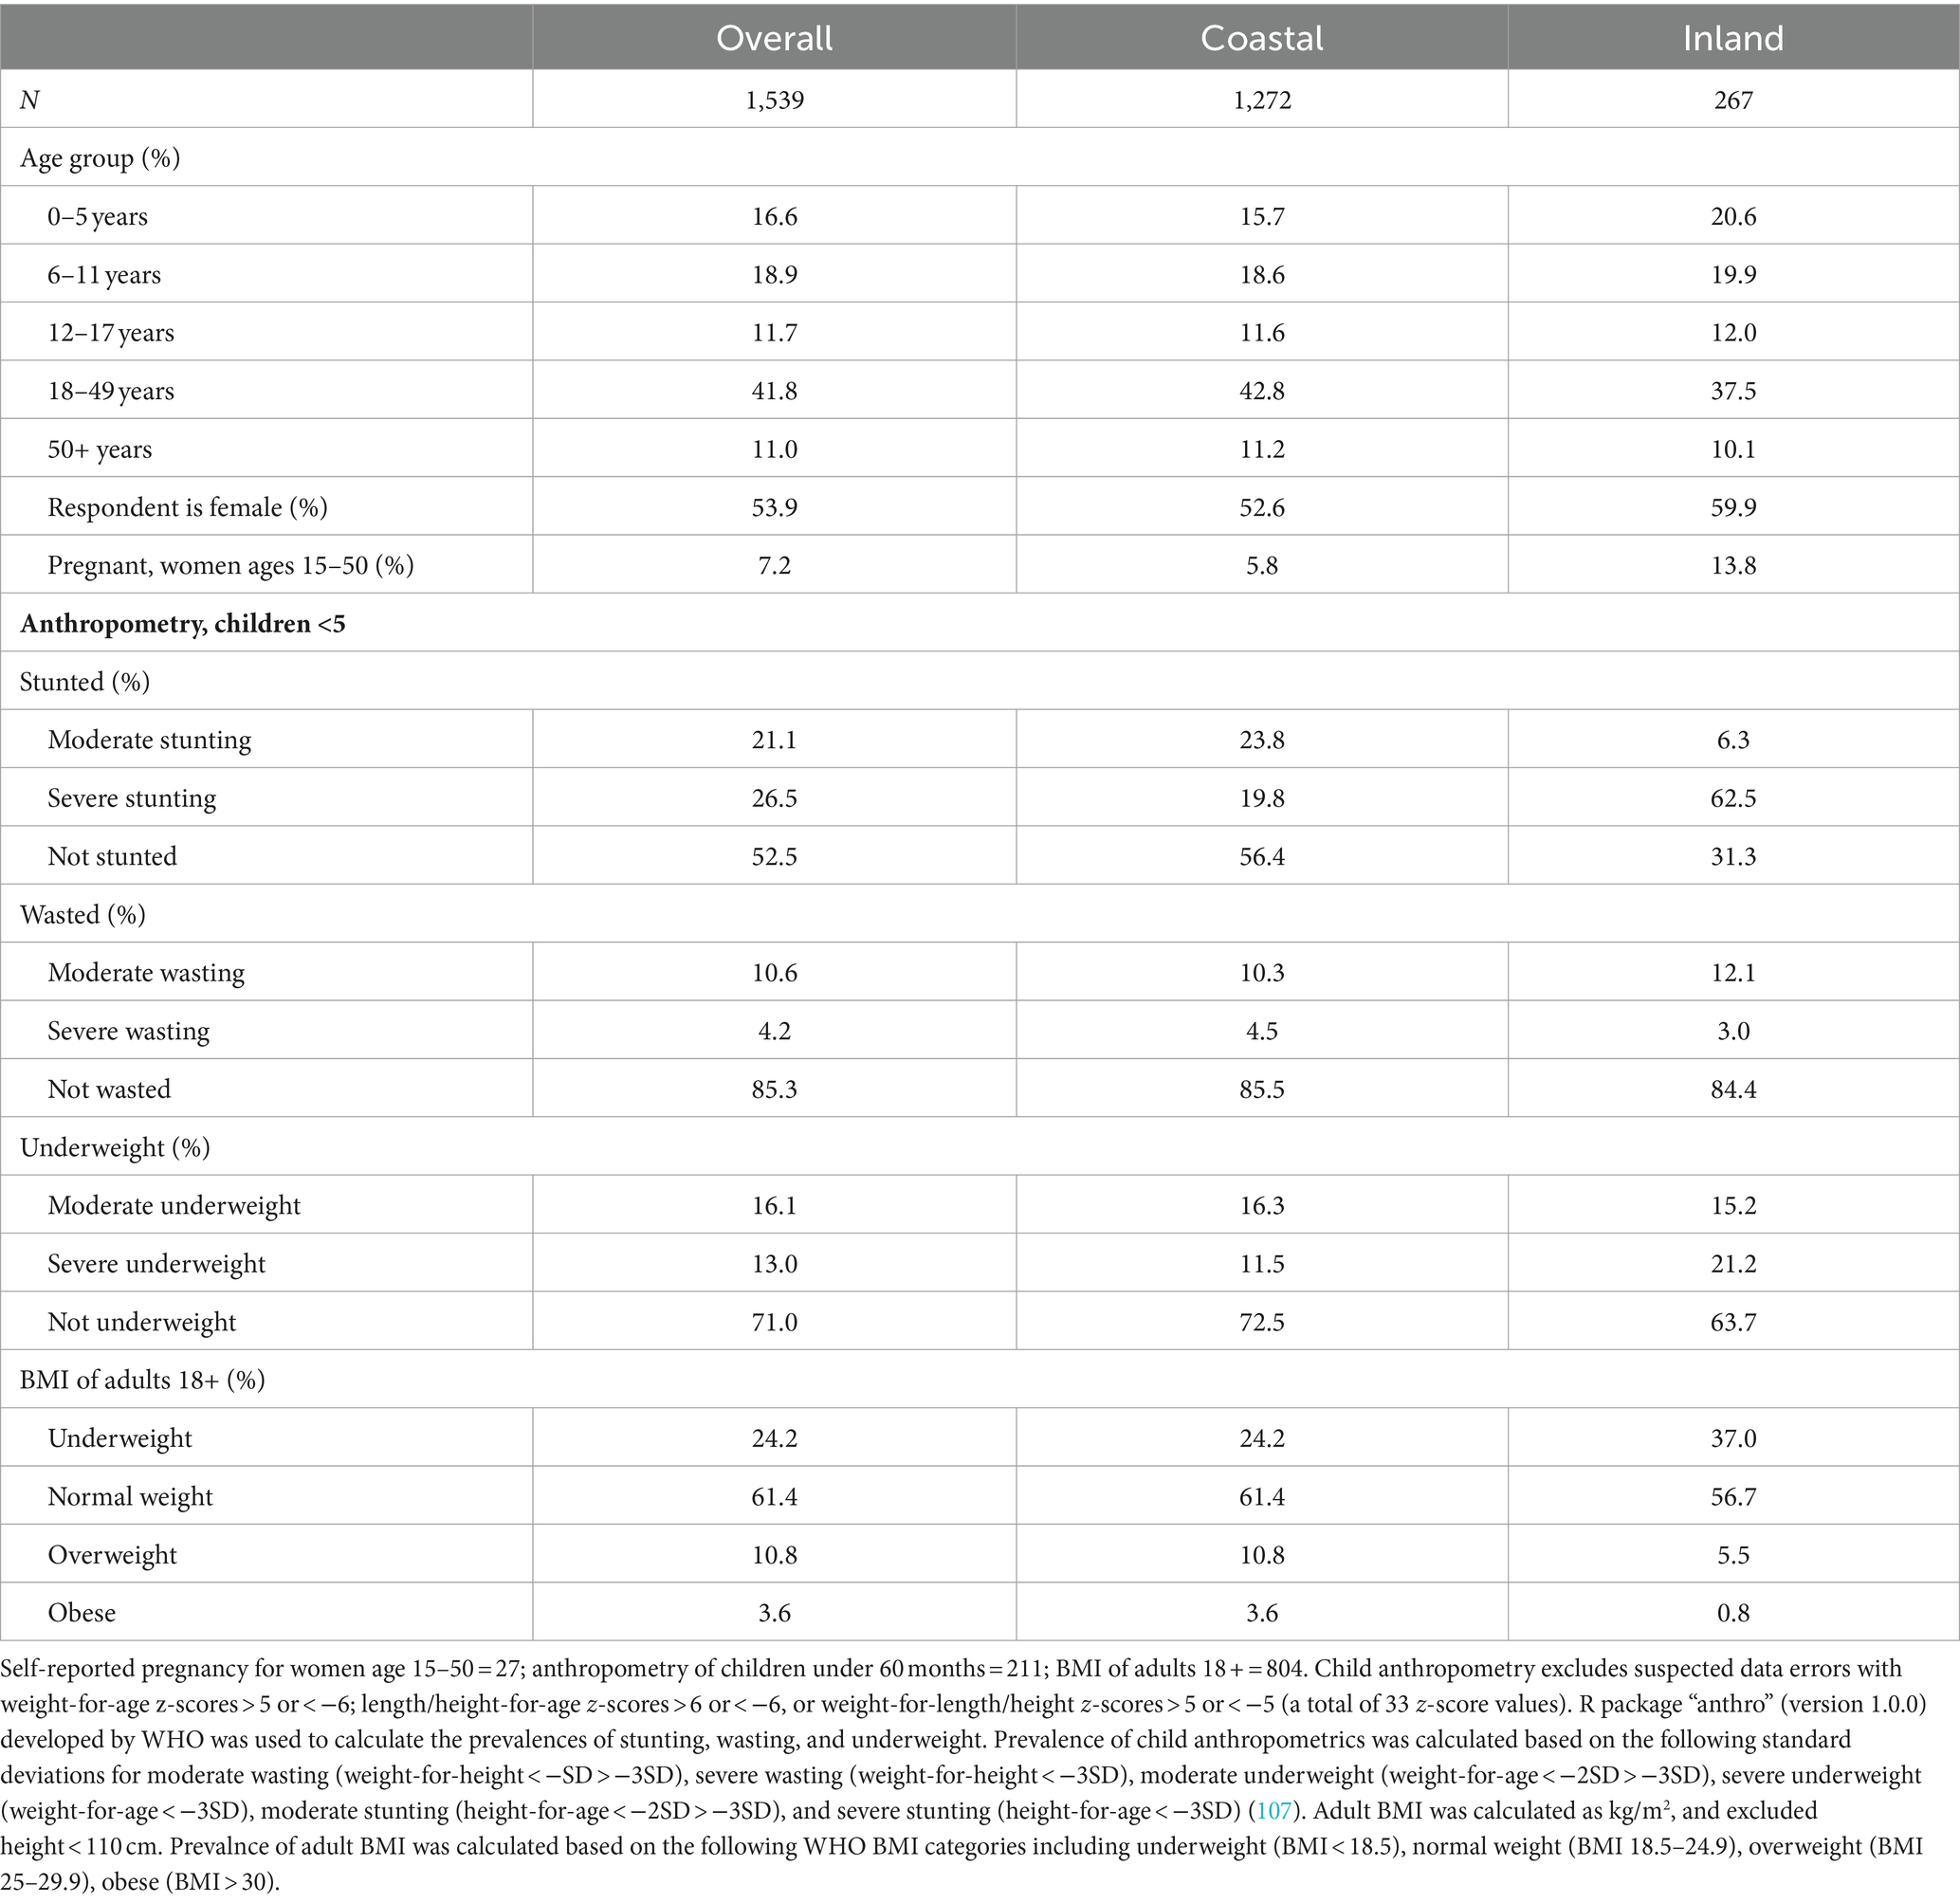
Table 5. Demographic and summary statistics of the enrolled ARMS study population at baseline in January 2023 (for coastal communities) and in April 2023 (for inland communities).
The cohort’s primary asset lies in its longitudinal dietary records, aligning seamlessly with an array of nutritional measures and health-related objectives. Deliberately crafted, the study seeks to unravel the intricate tapestry of nutritional patterns associated with seafood consumption among inhabitants of secluded, seafood-dependent regions in Madagascar. This setting mirrors the challenges faced by numerous areas in sub-Saharan Africa and small island developing states of the Pacific, especially given the escalating prevalence of metabolic diseases and hypertension observed in Madagascar. Additionally, the study’s robustness is underscored by its comprehensive sampling of a diverse population spanning both genders and all age groups. This comprehensive study population within communities enables a nuanced exploration of whether the observed impacts remain consistent across various demographic characteristics, socio-economic statuses, and fisheries governance regimes.
On the flip side, a notable drawback surfaces in the study’s temporal scope of the study and the lack of discrete intervention and control sites, rendering it inadequate for establishing a causative link between artificial coral reef construction, fish catch, and the nutritional or health status of the study participants. Nevertheless, we can envisage potential impacts of artificial reef construction by operating under the assumption that these new reefs will rehabilitate fish biomass, increase fish catch, and improve fisher livelihoods and community nutrition. Leveraging the seasonal fluctuations in fish catch further allows us to infer potential ramifications of diminished fisheries productivity in the future, and the potential nutritional benefits of ecosystem restoration. It is entirely possible that we do not detect an effect of the construction of the artificial reefs; nevertheless, there is no risk to local communities experiencing adverse effects. The worst case scenario is that the extension of artificial reefs in the Bay of Ranobe do not have positive effects on fish biomass, catch, and consumption and therefore produce null effects on food security and health, leading to unmet expectations for the communities.
There are exceedingly rare field research studies attempting to empirically evaluate the human health impacts of environmental degradation and environmental restoration. In essence, there is inadequate evidence that is prospectively collected to examine mechanisms in planetary health. In this study, we aimed to study the constellation of benefits (increased seafood consumption, increased food security, improved nutritional status, reduced cardio-vascular disease risk, and reduced risk of anxiety and depression) that may arise from restoring coral reef ecosystems. We hope that this case study may serve as inspiration for similar research in nutritionally vulnerable coral reef ecosystems around the world.
The studies involving humans were approved by the Committee on the Use of Human Subjects, Office of Human Research Administration at the Harvard T.H. Chan School of Public Health and the Ethics Committee of the Ministry of Public Health in Madagascar. The studies were conducted in accordance with the local legislation and institutional requirements. The ethics committee/institutional review board waived the requirement of written informed consent for participation from the participants or the participants’ legal guardians/next of kin because as literacy is challenging in the region, our team read the recruitment script and the consent form in local languages. A yes/no checkbox was provided on the questionnaire document to verify informed verbal consent was obtained. The animal study was approved by the Ministry of Environment and Sustainable Development in Madagascar (MEDD).
CG: Investigation, Methodology, Project administration, Supervision, Writing – original draft, Writing – review & editing, Conceptualization, Data curation, Funding acquisition. AH: Conceptualization, Data curation, Funding acquisition, Investigation, Methodology, Project administration, Supervision, Writing – original draft, Writing – review & editing. EG: Conceptualization, Funding acquisition, Investigation, Methodology, Project administration, Resources, Supervision, Writing – review & editing. GT: Conceptualization, Data curation, Funding acquisition, Investigation, Methodology, Project administration, Resources, Supervision, Writing – original draft, Writing – review & editing. MTr: Conceptualization, Funding acquisition, Investigation, Methodology, Project administration, Supervision, Writing – review & editing. GA: Investigation, Writing – review & editing. FB: Investigation, Writing – review & editing. JD: Investigation, Writing – review & editing. J-DD: Conceptualization, Funding acquisition, Investigation, Methodology, Resources, Supervision, Writing – original draft, Writing – review & editing. AF: Formal analysis, Investigation, Methodology, Project administration, Writing – original draft, Writing – review & editing. CF: Investigation, Writing – review & editing. FD: Investigation, Writing – review & editing. KH: Supervision, Writing – review & editing. HK: Conceptualization, Investigation, Methodology, Writing – original draft, Writing – review & editing. MK: Writing – review & editing. KK: Conceptualization, Funding acquisition, Methodology, Resources, Supervision, Writing – original draft, Writing – review & editing. ThoL: Conceptualization, Investigation, Methodology, Supervision, Writing – original draft, Writing – review & editing. ThiL: Writing – review & editing. FM: Investigation, Writing – review & editing. MLé: Supervision, Writing – review & editing. MLi: Conceptualization, Investigation, Methodology, Writing – original draft, Writing – review & editing. JMa: Investigation, Writing – review & editing. JMb: Investigation, Writing – review & editing. KN: Investigation, Methodology, Writing – original draft, Writing – review & editing. AN: Investigation, Visualization, Writing – review & editing. DP: Methodology, Writing – review & editing. RRab: Investigation, Writing – review & editing. MihR: Investigation, Writing – review & editing. SR: Investigation, Writing – review & editing. MbR: Investigation, Writing – review & editing. HSR: Investigation, Writing – review & editing. HJR: Conceptualization, Investigation, Methodology, Project administration, Supervision, Writing – original draft, Writing – review & editing. JR: Investigation, Methodology, Project administration, Writing – original draft, Writing – review & editing. HOR: Resources, Validation, Writing – review & editing, Methodology. RRan: Investigation, Writing – review & editing. MaR: Investigation, Writing – review & editing. MicR: Investigation, Writing – review & editing. KR: Investigation, Writing – review & editing. NR: Methodology, Validation, Writing – review & editing. Romario: Investigation, Writing – review & editing. MS: Investigation, Writing – review & editing. RS: Methodology, Project administration, Writing – review & editing. MTs: Investigation, Writing – review & editing. AV: Investigation, Writing – review & editing. NV: Investigation, Writing – review & editing. BV: Project administration, Resources, Writing – review & editing. JZ-M: Formal analysis, Methodology, Writing – review & editing.
The author(s) declare that financial support was received for the research, authorship, and/or publication of this article. We are grateful for the financial support of the Belmont Forum through the National Science Foundation (RISE-2022717 to AH and CG), the South African National Research Foundation (BF-CRA 12854 to GT), Svenska FORMAS (2019–02394 to MFT), the Rose Service Learning Fellowship at Harvard University (KN), Good Planet Foundation to EG, Montpellier University (FISHTAIL project to ThoL, AMALGAM project to J-DD), doctoral grant support (ARTS IRD to AV), the Harvard President’s Climate Change Solutions Fund (to CG and KK), the Harvard Data Science Initiative’s Special Projects Fund (to KK) and the International Laboratory (LMI) MIKAROKA funded by Institut de Recherche pour le Développement, France. We are also thankful for in-kind support from the Madagascar Ministry of Public Health.
A special thanks to all of the fishers, local community members and leaders of communities in the Bay of Ranobe for their immense collaboration with us and their contribution to the implementation of the survey and data collection. We would also like to thank the NGO Reef Doctor for their logistical and material support, especially the great work of their two technicians (Bosco and Mamonto) who assisted us during the landing survey and laboratory work in Ifaty. We are grateful to the Medical Inspector of Toliara II Dr. Fabien Rakotondramanana. We would like to thank Vola Nirina Andrianavalona for the initial mental health fieldwork. We sincerely thank all the participants in the environmental DNA data collection for their warm assistance throughout the data collection, especially the two sailors from the NGO Reef Doctor (Mamonto and Bostata) and also the three IH.SM students (Johanès, Mandimbilaza, and Nasandratra).
The authors declare that the research was conducted in the absence of any commercial or financial relationships that could be construed as a potential conflict of interest.
All claims expressed in this article are solely those of the authors and do not necessarily represent those of their affiliated organizations, or those of the publisher, the editors and the reviewers. Any product that may be evaluated in this article, or claim that may be made by its manufacturer, is not guaranteed or endorsed by the publisher.
The Supplementary material for this article can be found online at: https://www.frontiersin.org/articles/10.3389/fpubh.2024.1366110/full#supplementary-material
BMI, Body Mass Index; CSI, Coping Strategies Index; DIME, Design, Implementation, Monitoring, and Evaluation; DNA, Deoxyribonucleic Acid; FL, Free-listing; FGDs, Focus Group Discussions; HFIAS, Household Food Insecurity Access Scale; HSCL-10, Hopkins Symptom Checklist-10 for anxiety; HSPH, Harvard T.H. Chan School of Public Health; HWISE, Household Water Insecurity Experiences; IH.SM, Institut Halieutiques et des Sciences Marines; MGA, Malagasy ariary; NGO, Non-Governmental Organization; PHQ-8, Patient Health Questionnaire-8 for depression; UMR MARBEC, Unité Mixte de Recherche - MARine Biodiversity, Exploitation and Conservation.
1. Golden, CD, Koehn, JZ, Shepon, A, Passarelli, S, Free, CM, Viana, DF, et al. Aquatic foods to nourish nations. Nature. (2021) 598:315–20. doi: 10.1038/s41586-021-03917-1
2. Golden, CD, Allison, EH, Cheung, WWL, Dey, MM, Halpern, BS, McCauley, DJ, et al. Nutrition: fall in fish catch threatens human health. Nature. (2016) 534:317–20. doi: 10.1038/534317a
3. Tidd, AN, Rousseau, Y, Ojea, E, Watson, RA, and Blanchard, JL. Food security challenged by declining efficiencies of artisanal fishing fleets: a global country-level analysis. Glob Food Sec. (2022) 32:100598. doi: 10.1016/j.gfs.2021.100598
4. Cao, L, Halpern, BS, Troell, M, Short, R, Zeng, C, Jiang, Z, et al. Vulnerability of blue foods to human-induced environmental change. Nat Sustain. (2023) 6:1186–98. doi: 10.1038/s41893-023-01156-y
5. Tigchelaar, M, Cheung, WWL, Mohammed, EY, Phillips, MJ, Payne, HJ, Selig, ER, et al. Compound climate risks threaten aquatic food system benefits. Nature Food. (2021) 2:673–82. doi: 10.1038/s43016-021-00368-9
6. FAO. The state of world fisheries and aquaculture 2022. Towards blue transformation. Rome, FAO. (2022). Available at: https://www.fao.org/3/cc0463en/cc0463en.pdf.
7. Petsini, F, Fragopoulou, E, and Antonopoulou, S. Fish consumption and cardiovascular disease related biomarkers: a review of clinical trials. Crit Rev Food Sci Nutr. (2019) 59:2061–71. doi: 10.1080/10408398.2018.1437388
8. Rimm, EB, Appel, LJ, Chiuve, SE, Djoussé, L, Engler, MB, Kris-Etherton, PM, et al. Seafood long-chain n-3 polyunsaturated fatty acids and cardiovascular disease: a science advisory from the American Heart Association. Circulation. (2018) 138:e35–47. doi: 10.1161/cir.0000000000000574
9. Marinda, PA, Genschick, S, Khayeka-Wandabwa, C, Kiwanuka-Lubinda, R, and Thilsted, SH. Dietary diversity determinants and contribution of fish to maternal and under-five nutritional status in Zambia. PLoS One. (2018) 13:e0204009. doi: 10.1371/journal.pone.0204009
10. Marushka, L, Batal, M, Tikhonov, C, Sadik, T, Schwartz, H, Ing, A, et al. Importance of fish for food and nutrition security among first nations in Canada. Can J Public Health. (2021) 112:64–80. doi: 10.17269/s41997-021-00481-z
11. Golden, CD, Zamborain-Mason, J, Levis, A, Rice, B, Allen, LH, Hampel, D, et al. Prevalence of micronutrient deficiencies across diverse environments in rural Madagascar. Front Nutr. (2024) 11:1389080. doi: 10.3389/fnut.2024.1389080
12. Moursi, MM, Arimond, M, Dewey, KG, Treche, S, Ruel, MT, and Delpeuch, F. Dietary diversity is a good predictor of the micronutrient density of the diet of 6-to 23-month-old children in Madagascar. J Nutr. (2008) 138:2448–53. doi: 10.3945/jn.108.093971
13. Institut National de la Statistique (INSTAT) and ICF. Enquête Démographique et de Santé à Madagascar, 2021. Antananarivo, Madagascar et Rockville, Maryland, USA: INSTAT et ICF (2022).
14. Kawarazuka, N, and Béné, C. Linking small-scale fisheries and aquaculture to household nutritional security: an overview. Food Secur. (2010) 2:343–57. doi: 10.1007/s12571-010-0079-y
15. Byrd, KA, Shieh, J, Mork, S, Pincus, L, O’Meara, L, Atkins, M, et al. Fish and fish-based products for nutrition and health in the first 1000 days: a systematic review of the evidence from low and middle-income countries. Adv Nutr. (2022) 13:2458–87. doi: 10.1093/advances/nmac102
16. Gibson, E, Stacey, N, Sunderland, TCH, and Adhuri, DS. Dietary diversity and fish consumption of mothers and their children in fisher households in Komodo District, eastern Indonesia. PLoS One. (2020) 15:e0230777. doi: 10.1371/journal.pone.0230777
17. Marinda, PA, Chalula, F, Khayeka-Wandabwa, C, Audain, K, and Thilsted, SH. Dietary diversity and nutritional status of children aged 6–59 months from rural fishing and non-fishing communities in Zambia. Sci Afr. (2023) 19:e01527. doi: 10.1016/j.sciaf.2022.e01527
18. O’Meara, L, Cohen, PJ, Simmance, F, Marinda, P, Nagoli, J, Teoh, SJ, et al. Inland fisheries critical for the diet quality of young children in sub-Saharan Africa. Glob Food Sec. (2021) 28:100483. doi: 10.1016/j.gfs.2020.100483
19. Aswani, S, and Furusawa, T. Do Marine protected areas affect human nutrition and health? A comparison between villages in Roviana, Solomon Islands. Coastal Manag. (2007) 35:545–65. doi: 10.1080/08920750701593394
20. Golden, CD, Ayroles, J, Eurich, JG, Gephart, JA, Seto, KL, Sharp, MK, et al. Study protocol: interactive dynamics of coral reef fisheries and the nutrition transition in Kiribati. Front Public Health. (2022) 10:890381. doi: 10.3389/fpubh.2022.890381
21. Golden, CD, Borgerson, C, Rice, BL, Allen, LH, Anjaranirina, EJG, Barrett, CB, et al. Cohort description of the Madagascar health and environmental research-Antongil (MAHERY-Antongil) study in Madagascar. Front Nutr. (2019) 6:109. doi: 10.3389/fnut.2019.00109
22. Coulthard, S, White, C, Paranamana, N, Sandaruwan, KPGL, Manimohan, R, and Maya, R. Tackling alcoholism and domestic violence in fisheries—a new opportunity to improve well-being for the most vulnerable people in global fisheries. Fish Fish. (2020) 21:223–36. doi: 10.1111/faf.12426
23. Michalopoulos, LTM, Baca-Atlas, SN, Simona, SJ, Jiwatram-Negrón, T, Ncube, A, and Chery, MB. “Life at the river is a living hell:” a qualitative study of trauma, mental health, substance use and HIV risk behavior among female fish traders from the Kafue flatlands in Zambia. BMC Womens Health. (2017) 17:15. doi: 10.1186/s12905-017-0369-z
24. Murray, C. L. Unemployment and the mental health of Newfoundland women affected by the fishery closure [Masters, Memorial University of Newfoundland]. (2000). Available at: https://research.library.mun.ca/1570/
25. Rahaman, SN, Das, S, Samanta, S, Ahmed, R, Banerjee, J, Alam, SS, et al. Cross sectional study on the association among hypertension with obesity indicators and dietary patterns of fishing community at coastal regions in India. Clin Epidemiol Global Health. (2024) 27:101573. doi: 10.1016/j.cegh.2024.101573
26. United Nations Development Programme. Human Development Index. In Human Development Reports. United Nations Development Programme. (2021). Available at: https://hdr.undp.org/data-center/human-development-index
27. Harisoa, R, and David, BJ. The economic impact of COVID-19 on African countries: the case of Madagascar. SHS Web Conf. (2023) 163:01039. doi: 10.1051/shsconf/202316301039
28. World Bank Macro poverty outlook for Madagascar. World Bank Group. (2023). Available at: http://documents.worldbank.org/curated/en/099201404122313890/IDU0202690010f45104a7f0b3b102cd5e27b8b7a
29. UN Migration. Madagascar crisis response plan 2023. (2023). Available at: https://crisisresponse.iom.int/response/madagascar-crisis-response-plan-2023
30. Dostie, B, Haggblade, S, and Randriamamonjy, J. Seasonal poverty in Madagascar: magnitude and solutions. Food Policy. (2002) 27:493–518. doi: 10.1016/S0306-9192(02)00063-5
31. Osborne, T, and Belghith, NBH. Shifting fortunes and enduring poverty in Madagascar: recent findings. Washington, DC: World Bank (2016).
32. FEWS NET. Crisis (IPC Phase 3) outcomes to emerge as root and tuber stocks are exhausted | FEWS NET. (2023). Available at: https://fews.net/southern-africa/madagascar/food-security-outlook-update/august-2023
33. World Bank. Madagascar: balancing conservation and exploitation of fisheries resources. World Bank. (2023). Available at: https://www.worldbank.org/en/news/feature/2020/06/08/madagascar-balancing-conservation-and-exploitation-of-fisheries-resources
34. FAO. Statistical query panel—global production by production source. FAO. (2023). Available at: https://www.fao.org/fishery/statistics-query/en/global_production
35. Todinanahary, GGB, Lavitra, T, Andrifanilo, HH, Puccini, N, Grosjean, P, and Eeckhaut, I. Community-based coral aquaculture in Madagascar: a profitable economic system for a simple rearing technique? Aquaculture. (2017) 467:225–34. doi: 10.1016/j.aquaculture.2016.07.012
36. Global Nutrition Report. Global nutrition report: stronger commitments for greater action Development Initiatives (2022). Bristol, UK: Development Initiatives.
37. Global Hunger Index. Global hunger index scores by 2023 GHI rank. Global hunger index (GHI) - peer-reviewed annual publication designed to comprehensively measure and track hunger at the global, regional, and country levels. (2023). Available at: https://www.globalhungerindex.org/ranking.html
38. INSTAT. Enquête Démographique et de Santé de Madagascar 2008–2009. Institut National de la Statistique (INSTAT) et ICF Macro. (2010). Available at: https://www.dhsprogram.com/pubs/pdf/FR236/FR236.pdf
39. Kauffman, K, Werner, CS, Titcomb, G, Pender, M, Rabezara, JY, Herrera, JP, et al. Comparing transmission potential networks based on social network surveys, close contacts and environmental overlap in rural Madagascar. J R Soc Interface. (2022) 19:20210690. doi: 10.1098/rsif.2021.0690
40. Rice, BL, Golden, CD, Randriamady, HJ, Rakotomalala, AANA, Vonona, MA, Anjaranirina, EJG, et al. Fine-scale variation in malaria prevalence across ecological regions in Madagascar: a cross-sectional study. BMC Public Health. (2021) 21:1018. doi: 10.1186/s12889-021-11090-3
41. Randremanana, R, Randrianirina, F, Gousseff, M, Dubois, N, Razafindratsimandresy, R, Hariniana, ER, et al. Case-control study of the etiology of infant diarrheal disease in 14 districts in Madagascar. PLoS One. (2012) 7:e44533. doi: 10.1371/journal.pone.0044533
42. Murray, CJL, Aravkin, AY, Abbafati, C, Abbas, KM, Abbasi-Kangevari, M, Abd-Allah, F, et al. Global burden of 87 risk factors in 204 countries and territories, 1990–2019: a systematic analysis for the global burden of disease study 2019. Lancet. (2020) 396:1223–49. doi: 10.1016/S0140-6736(20)30752-2
43. World Health Organization. World Malaria Report 2022. (2023). Available at: https://www.who.int/teams/global-malaria-programme/reports/world-malaria-report-2022
44. World Health Organization. World mental health report transforming mental health for all. (2022). Available at: https://iris.who.int/bitstream/handle/10665/356119/9789240049338-eng.pdf?sequence=1
45. Burrows, K, Denckla, CA, Hahn, J, Schiff, JE, Okuzono, SS, Randriamady, H, et al. A systematic review of the effects of chronic, slow-onset climate change on mental health. Nat Mental Health. (2024) 2:228–43. doi: 10.1038/s44220-023-00170-5
46. Sharpe, I, and Davison, CM. Climate change, climate-related disasters and mental disorder in low- and middle-income countries: a scoping review. BMJ Open. (2021) 11:e051908. doi: 10.1136/bmjopen-2021-051908
47. World Bank. Risk historical hazards. Climate change knowledge portal for development practitioners and policy makers. World Bank. (2021). Available at: https://climateknowledgeportal.worldbank.org/country/madagascar/vulnerability
48. Rigden, A, Golden, C, Chan, D, and Huybers, P. Climate change linked to drought in southern Madagascar. NPJ Clim Atmos Sci. (2024) 7:1–9. doi: 10.1038/s41612-024-00583-8
49. Gardiner, L. Madagascar’s extraordinary biodiversity: threats and opportunities. (2022). Available at: https://www.repository.cam.ac.uk/handle/1810/344437
50. Virah-Sawmy, M, Willis, KJ, and Gillson, L. Threshold response of Madagascar’s littoral forest to sea-level rise. Glob Ecol Biogeogr. (2009) 18:98–110. doi: 10.1111/j.1466-8238.2008.00429.x
51. WFP. Madagascar country brief. (2023). Available at: https://reliefweb.int/report/madagascar/wfp-madagascar-country-brief-may-2023
52. Carter, AL, Gilchrist, H, Dexter, KG, Gardner, CJ, Gough, C, Rocliffe, S, et al. Cyclone impacts on coral reef communities in Southwest Madagascar. Front Mar Sci. (2022) 9:753325. doi: 10.3389/fmars.2022.753325
53. Gough, CLA, Dewar, KM, Godley, BJ, Zafindranosy, E, and Broderick, AC. Evidence of overfishing in small-scale fisheries in Madagascar. Front Mar Sci. (2020) 7:317. doi: 10.3389/fmars.2020.00317
54. Zamborain-Mason, J, Cinner, JE, MacNeil, MA, Graham, NAJ, Hoey, AS, Beger, M, et al. Sustainable reference points for multispecies coral reef fisheries. Nat Commun. (2023) 14:5368. doi: 10.1038/s41467-023-41040-z
55. Abeare, S. The Vezo communities and fisheries of the coral reef ecosystem in the Bay of Ranobe, Madagascar. University of New Orleans Theses and Dissertations. (2019). Available at: https://scholarworks.uno.edu/td/2685.
56. Bruggemann, JH, Rodier, M, Guillaume, MMM, Andréfouët, S, Arfi, R, Cinner, JE, et al. Wicked social–ecological problems forcing unprecedented change on the latitudinal margins of coral reefs: the case of Southwest Madagascar. Ecol Soc. (2012) 17:1–17. doi: 10.5751/ES-05300-170447
57. Botosoamananto, RL, Todinanahary, G, Razakandrainy, A, Randrianarivo, M, Penin, L, and Adjeroud, M. Spatial patterns of coral community structure in the Toliara Region of Southwest Madagascar and implications for conservation and management. Diversity. (2021) 13:486. doi: 10.3390/d13100486
58. Gudka, M, Obura, D, Mwaura, J, Porter, S, Yahya, S, and Mabwa, R. Impact of the 3rd global coral bleaching event on the Western Indian Ocean in 2016. Global Coral Reef Monitoring Network. (2018) 67:1–67.
59. Sheridan, C, Baele, JM, Kushmaro, A, Fréjaville, Y, and Eeckhaut, I. Terrestrial runoff influences white syndrome prevalence in SW Madagascar. Mar Environ Res. (2014) 101:44–51. doi: 10.1016/j.marenvres.2014.08.003
60. Randrianarivo, M, Guilhaumon, F, Tsilavonarivo, J, Razakandrainy, A, Philippe, J, Botosoamananto, RL, et al. A contemporary baseline of Madagascar’s coral assemblages: reefs with high coral diversity, abundance, and function associated with marine protected areas. PLoS One. (2022) 17:e0275017. doi: 10.1371/journal.pone.0275017
61. Srokosz, MA, and Quartly, GD. The Madagascar bloom: a serendipitous study. J Geophys Res Oceans. (2013) 118:14–25. doi: 10.1029/2012JC008339
62. Cooke, A. Cooke, A & Brand, J, 2012. Madagascar – a guide to marine biodiversity (2012). New York, NY: Wildlife Conservation Society. 176 p.
63. Veron, J. E. N., and Turak, E. In a rapid marine biodiversity assessment of Northwest Madagascar. (2003). Available at: https://press.uchicago.edu/ucp/books/book/distributed/R/bo4370264.html
64. Obura, D. The diversity and biogeography of Western Indian Ocean reef-building corals. PLoS One. (2012) 7:e45013. doi: 10.1371/journal.pone.0045013
65. Gabrié, C, Vasseur, P, Randriamiarana, H, Maharavo, J, and Mara, E. The coral reefs of Madagascar In: TR McClanahan, CRC Sheppard, and DO Obura, editors. Coral reefs of the Indian Ocean their ecology and conservation (2000). New York, NY: Oxford University Press. 411–44.
66. Obura, D. Resilience and climate change: lessons from coral reefs and bleaching in the Western Indian Ocean. Estuar Coast Shelf Sci. (2005) 63:353–72. doi: 10.1016/j.ecss.2004.11.010
67. Wilkinson, C, Lindén, O, Cesar, H, Hodgson, G, Rubens, J, and Strong, AE. Ecological and socioeconomic impacts of 1998 coral mortality in the Indian Ocean: an ENSO impact and a warning of future change? Ambio. (1999) 28:188–96.
68. Obura, D, Gudka, M, Rabi, FA, Gian, SB, Bijoux, J, Freed, S, et al. Coral reef status report for the Western Indian Ocean. Global Coral Reef Monitoring Network (GCRMN)/International Coral Reef Initiative (ICRI) (2017) 144.
69. Andréfouët, S, Guillaume, MMM, Delval, A, Rasoamanendrika, FMA, Blanchot, J, and Bruggemann, JH. Fifty years of changes in reef flat habitats of the Grand Récif of Toliara (SW Madagascar) and the impact of gleaning. Coral Reefs. (2013) 32:757–68. doi: 10.1007/s00338-013-1026-0
70. Lagoin, Y. La pêche côtière malgache dans la région de Tuléar. Bulletin de Madagascar. (1959) 9:95–106.
71. Laroche, J, Razanoelisoa, J, Fauroux, E, and Rabenevanana, MW. The reef fisheries surrounding the south-west coastal cities of Madagascar. Fish Manag Ecol. (1997) 4:285–99. doi: 10.1046/j.1365-2400.1997.00051.x
72. Ramm, LA, Florisson, JH, Watts, SL, Becker, A, and Tweedley, JR. Artificial reefs in the Anthropocene: a review of geographical and historical trends in their design, purpose, and monitoring. Bull Mar Sci. (2021) 97:699–728. doi: 10.5343/bms.2020.0046
73. Layman, CA, and Allgeier, JE. An ecosystem ecology perspective on artificial reef production. J Appl Ecol. (2020) 57:2139–48. doi: 10.1111/1365-2664.13748
74. Paxton, AB, Shertzer, KW, Bacheler, NM, Kellison, GT, Riley, KL, and Taylor, JC. Meta-analysis reveals artificial reefs can be effective tools for fish community enhancement but are not one-size-fits-all. Front Mar Sci. (2020) 7:282. doi: 10.3389/fmars.2020.00282
75. Knowlton, N, Brainard, R, Fisher, R, Moews, M, Plaisance, L, and Caley, MJ In: A McIntyre, editor. Life in the world’s oceans: diversity, distribution, and abundance. Oxford, UK: Blackwell Publishing Ltd. (2010)
76. Maxwell, D., Watkins, B., Wheeler, R., and Collins, G. The coping strategies index: a tool for rapidly measuring food security and the impact of food aid programs in emergencies. Nairobi: CARE eastern and Central Africa regional management unit and the world food Programme vulnerability assessment and mapping unit. (2003). Available at: https://documents.wfp.org/stellent/groups/public/documents/manual_guide_proced/wfp211058.pdf
77. Coates, J., Swindale, A., and Bilinsky, P. Household food insecurity access scale (HFIAS) for measurement of food access: indicator guide. FHI 360/FANTA. (2007). Available at: https://www.fantaproject.org/monitoring-and-evaluation/household-food-insecurity-access-scale-hfias
78. Young, SL, Boateng, GO, Jamaluddine, Z, Miller, JD, Frongillo, EA, Neilands, TB, et al. The household water in security experiences (HWISE) scale: development and validation of a household water insecurity measure for low-income and middle-income countries. BMJ Glob Health. (2019) 4:e001750. doi: 10.1136/bmjgh-2019-001750
79. Golden, CD, Rice, BL, Randriamady, HJ, Vonona, AM, Randrianasolo, JF, Tafangy, AN, et al. Study protocol: a cross-sectional examination of socio-demographic and ecological determinants of nutrition and disease across Madagascar. Front Public Health. (2020) 8:500. doi: 10.3389/fpubh.2020.00500
80. Applied Mental Health Research Group. Design, implementation, monitoring, and evaluation of mental health and psychosocial assistance programs for trauma survivors in low resource countries: a user’s manual for researchers and program implementers (adult version). (2013). Available at: https://hopkinshumanitarianhealth.org/assets/documents/VOT_DIME_MODULE1_FINAL.PDF.
81. Arias de la Torre, J, Vilagut, G, Ronaldson, A, Valderas, JM, Bakolis, I, Dregan, A, et al. Reliability and cross-country equivalence of the 8-item version of the patient health questionnaire (PHQ-8) for the assessment of depression: results from 27 countries in Europe. Lancet Reg Health Eur. (2023) 31:100659. doi: 10.1016/j.lanepe.2023.100659
82. Kroenke, K, and Spitzer, RL. (2002) The PHQ-9: A New Depression Diagnostic and Severity Measure In: Psychiatr. Ann, vol. 32, 509–521.
83. Kroenke, K, Strine, TW, Spitzer, RL, Williams, JB, Berry, JT, and Mokdad, AH. The PHQ-8 as a measure of current depression in the general population. J Affect Disord. (2009) 114:163–73. doi: 10.1016/j.jad.2008.06.026
84. Derogatis, LR, Lipman, RS, Rickels, K, Uhlenhuth, EH, and Covi, L. The Hopkins symptom checklist (HSCL): a self-report symptom inventory. Behav Sci. (1974) 19:1–15. doi: 10.1002/bs.3830190102
85. Haroz, EE, Bass, JK, Lee, C, Murray, LK, Robinson, C, and Bolton, P. Adaptation and testing of psychosocial assessment instruments for cross-cultural use: an example from the Thailand Burma border. BMC Psychol. (2014) 2:31. doi: 10.1186/s40359-014-0031-6
86. Vindbjerg, E, Mortensen, EL, Makransky, G, Nielsen, T, and Carlsson, J. A rasch-based validity study of the HSCL-25. J Affect Dis Rep. (2021) 4:100096. doi: 10.1016/j.jadr.2021.100096
87. Obura, D. Manuel de suivi des récifs coralliens Îles du sud-ouest de l’océan Indien. Comission de l’océan Indien. (2014). Available at: https://www.yumpu.com/fr/document/view/37181760/manuel-de-suivi-des-recifs-coralliens-iles-du-sud-ouest-de-locean-indien
88. Obura, D, and Grimsditch, G. Resilience assessment of coral reefs: assessment protocol for coral reefs, focusing on coral bleaching and thermal stress. Switzerland: IUCN Gland (2009).
89. Taberlet, P, Bonin, A, Zinger, L, and Coissac, E. Environmental DNA: for biodiversity research and monitoring. Oxford, UK: Oxford University Press (2018).
90. Smithsonian. ARMS protocols. (2023). Available at: https://naturalhistory.si.edu/research/global-arms-program/protocols
91. Haas, AF, Knowles, B, Lim, YW, Somera, TM, Kelly, LW, Hatay, M, et al. Unraveling the unseen players in the ocean-a field guide to water chemistry and marine microbiology. JoVE. (2024) 93:e52131.
92. Silveira, CB, Luque, A, Haas, AF, Roach, TNF, George, EE, Knowles, B, et al. Viral predation pressure on coral reefs. BMC Biol. (2023) 21:77. doi: 10.1186/s12915-023-01571-9
93. Andrialovanirina, N, Ponton, D, Behivoke, F, Mahafina, J, and Léopold, M. A powerful method for measuring fish size of small-scale fishery catches using ImageJ. Fish Res. (2020) 223:105425. doi: 10.1016/j.fishres.2019.105425
94. Hebert, PDN, and Gregory, TR. The promise of DNA barcoding for taxonomy. Syst Biol. (2005) 54:852–9. doi: 10.1080/10635150500354886
95. Hubert, N, and Hanner, R. DNA barcoding, species delineation and taxonomy: a historical perspective. DNA Barcodes. (2015) 3:44–58. doi: 10.1515/dna-2015-0006
96. Devlin, UM, McNulty, BA, Nugent, AP, and Gibney, MJ. The use of cluster analysis to derive dietary patterns: methodological considerations, reproducibility, validity and the effect of energy mis-reporting. Proc Nutr Soc. (2012) 71:599–609. doi: 10.1017/S0029665112000729
97. Zhao, J, Li, Z, Gao, Q, Zhao, H, Chen, S, Huang, L, et al. A review of statistical methods for dietary pattern analysis. Nutr J. (2021) 20:37. doi: 10.1186/s12937-021-00692-7
98. Patel, A, Noble, RT, Steele, JA, Schwalbach, MS, Hewson, I, and Fuhrman, JA. Virus and prokaryote enumeration from planktonic aquatic environments by epifluorescence microscopy with SYBR Green I. Nat Protoc. (2007) 2:269–76. doi: 10.1038/nprot.2007.6
99. Little, M, George, EE, Arts, MGI, Shivak, J, Benler, S, Huckeba, J, et al. Three-dimensional molecular cartography of the Caribbean reef-building coral Orbicella faveolata. Front Mar Sci. (2021) 8:627724. doi: 10.3389/fmars.2021.627724
100. Overbeek, R, Olson, R, Pusch, GD, Olsen, GJ, Davis, JJ, Disz, T, et al. The SEED and the rapid annotation of microbial genomes using subsystems technology (RAST). Nucleic Acids Res. (2014) 42:D206–14. doi: 10.1093/nar/gkt1226
101. Silva, GGZ, Green, KT, Dutilh, BE, and Edwards, RA. SUPER-FOCUS: a tool for agile functional analysis of shotgun metagenomic data. Bioinformatics. (2016) 32:354–61. doi: 10.1093/bioinformatics/btv584
102. Roach, TNF, Little, M, Arts, MGI, Huckeba, J, Haas, AF, George, EE, et al. A multiomic analysis of in situ coral–turf algal interactions. Proc Natl Acad Sci. (2020) 117:13588–95. doi: 10.1073/pnas.1915455117
103. Cadima, E. L. Sampling methods applied to fisheries science: a manual (Vol. 434). (2005). Available at: https://www.fao.org/3/a0198e/a0198e.pdf
104. Schindelin, J, Arganda-Carreras, I, Frise, E, Kaynig, V, Longair, M, Pietzsch, T, et al. Fiji—an open source platform for biological image analysis. Nat Methods. (2012) 9:676–82. doi: 10.1038/nmeth.2019
105. Froese, R., and Pauly, D. FishBase. (2023). Available at: www.fishbase.org.
106. Raharinaivo, LR, Jaonalison, H, Mahafina, J, and Ponton, D. How to efficiently determine the size at maturity of small-sized tropical fishes: a case study based on 144 species identified via DNA barcoding from southwestern Madagascar. J Appl Ichthyol. (2020) 36:402–13. doi: 10.1111/jai.14046
Keywords: nutrition, mental health, reef-based food systems, aquatic foods, planetary health, sustainable food systems, Vezo, Masikoro
Citation: Golden CD, Hartmann AC, Gibbons E, Todinanahary G, Troell MF, Ampalaza G, Behivoke F, David JM, Durand J-D, Falinirina AM, Frånberg C, Declèrque F, Hook K, Kelahan H, Kirby M, Koenen K, Lamy T, Lavitra T, Moridy F, Léopold M, Little MJ, Mahefa JC, Mbony J, Nicholas K, Nomenisoa ALD, Ponton D, Rabarijaona RR, Rabearison M, Rabemanantsoa SA, Ralijaona M, Ranaivomanana HS, Randriamady HJ, Randrianandrasana J, Randriatsara HO, Randriatsara RM, Rasoanirina M, Ratsizafy MR, Razafiely KF, Razafindrasoa N, Romario, Solofoarimanana MY, Stroud II RE, Tsiresimiary M, Volanandiana AJ, Volasoa NV, Vowell B, and Zamborain-Mason J (2024) HIARA study protocol: impacts of artificial coral reef development on fisheries, human livelihoods and health in southwestern Madagascar. Front. Public Health. 12:1366110. doi: 10.3389/fpubh.2024.1366110
Edited by:
Paolo Vineis, Imperial College London, United KingdomReviewed by:
Gulnihal Ozbay, Delaware State University, United StatesCopyright © 2024 Golden, Hartmann, Gibbons, Todinanahary, Troell, Ampalaza, Behivoke, David, Durand, Falinirina, Frånberg, Declèrque, Hook, Kelahan, Kirby, Koenen, Lamy, Lavitra, Moridy, Léopold, Little, Mahefa, Mbony, Nicholas, Nomenisoa, Ponton, Rabarijaona, Rabearison, Rabemanantsoa, Ralijaona, Ranaivomanana, Randriamady, Randrianandrasana, Randriatsara, Randriatsara, Rasoanirina, Ratsizafy, Razafiely, Razafindrasoa, Romario, Solofoarimanana, Stroud, Tsiresimiary, Volanandiana, Volasoa, Vowell and Zamborain-Mason. This is an open-access article distributed under the terms of the Creative Commons Attribution License (CC BY). The use, distribution or reproduction in other forums is permitted, provided the original author(s) and the copyright owner(s) are credited and that the original publication in this journal is cited, in accordance with accepted academic practice. No use, distribution or reproduction is permitted which does not comply with these terms.
*Correspondence: Christopher D. Golden, Z29sZGVuQGhzcGguaGFydmFyZC5lZHU=
†These authors have contributed equally to this work and share first authorship
Disclaimer: All claims expressed in this article are solely those of the authors and do not necessarily represent those of their affiliated organizations, or those of the publisher, the editors and the reviewers. Any product that may be evaluated in this article or claim that may be made by its manufacturer is not guaranteed or endorsed by the publisher.
Research integrity at Frontiers
Learn more about the work of our research integrity team to safeguard the quality of each article we publish.