 Lei Liu1,2
 Lanyue Zhang
- 1Chengdu University of Technology, Chengdu, China
- 2Neijiang Normal University, Neijiang, China
- 3Sichuan Institute of Administration, Chengdu, China
- 4Sichuan University Jinjiang College, Meishan, Sichuan, China
The sustainable development of ecologically fragile areas and the implementation of regional coordinated development strategies cannot be separated from the coordinated development and common progress of urbanization and the ecological environment, and this is particularly the case in Southwest China. This study examines the interplay between urbanization and the ecological environment across 26 cities in Southwest China from 2009 to 2019, utilizing 30 statistical indicators to analyze their coupling coordination relationship and its spatiotemporal evolution. The Entropy TOPSIS method, the coupling coordination degree model, and the obstacle factors model were used to calculate the subsystem score, coupling coordination degree, and obstacle factors, respectively. Our findings reveal an upward trajectory in urbanization scores across the 26 cities, juxtaposed with a fluctuating downward trend in ecological environment scores. The coupling coordination degree of urbanization and ecological environment in most cities maintained a rapid upward trend and showed spatial distribution characteristics of “strong core, weak middle, and edge.” Moreover, our analysis identified public transport facilities, aggregate purchasing power, and cultural supply service services as primary obstacle factors impeding the development of coupling coordination degrees. These research results offer valuable insights for informing future endeavors in achieving high-quality development and fostering ecological civilization.
1 Introduction
Global sustainable development is currently confronted with a series of troubles, including over-exploitation, exhaustion of resources, degradation of the ecological environment, and pollution discharge (1). Traditional urbanization (UR) blindly pursues the speed of development, ignores the comprehensive benefits, and pays less attention to the external impact (2). Therefore, rapid urbanization is accompanied by unsatisfactory effects; there will inevitably be “urban diseases” such as resource scarcity, overpopulation, and a reduction in the quality of urban life (3–5), which will cause great pressure on the ecological environment (EE) and exceed its endurance range (6). In addition, the increasingly harsh EE also reversely limits the improvement of urbanization development efficiency and affects the further sustainable and healthy development of urbanization (7, 8). Accordingly, the mature development of UR needs a healthy EE as the carrier, while the change in EE restricts the quality and scale of urbanization development to some extent (9). UR and EE are significant contents of the man–land relationship system and are crucial topics for achieving sustainable development goals (10). The guarantee of the normal and stable progress of the region cannot be separated from the mutual coordination of their development pace. From “Garden City” in the 1890s (11) to “Man and Biosphere Programme” in the 2000s, the form of ecological urbanization is gradually pursued by people.
Urbanization refers to the transition of society from an agrarian way of life to a modern civilized way of life dominated by industry and service trades, with the continuous progress of productivity and the acceleration of industrialization (12). It is manifested as the spatial agglomeration of the population from the countryside to the city, accompanied by a change in the rural economy, culture, lifestyle, and other aspects of the city (13). The main factors influencing urbanization include urban–rural income gap and employment environment (14), government and institutional factors (15), and the spillover effect of big cities (16). The ecological environment is the general term for the living environment and abiotic environment, which is firmly connected with human wellbeing, health, and human settlement safety (17). Environmental degradation and ecological problems will negatively affect the health of the population (18). The main factors affecting the ecosystem include population activity, progress in urbanization, and climate change (19, 20). Coupling is an interaction mechanism between two or more systems (21, 22), which has been broadly applied in the fields of natural science, social science, and humanities. Academia has carried out a lot of exploration of the interactive relationship between UR and EE.
According to different research objects, scholars have analyzed the coupling coordination degree (CCD) of UR and EE from different angles and promoted theoretical innovation, methodical innovation, and practical innovation based on the rich research in existence. The CCD studies of UR and EE are mainly supported by the Environmental Kuznets Curve (23), the theory of urban metabolism (24), and the theory of ecocity (25). There is copious research on the CCD of UR and EE, with much of it focusing on the relationship between UR and individual ecological indicators. For example, studies have explored the coupling characteristics of economic benefit and ecological management in various cities and regions (26), as well as the influence of urbanization on agricultural development (27). Most empirical conclusions revealed that UR has more negative than positive impacts on EE (28). The definition of UR and EE CCD is constantly improving, and the innovation and improvement of new methods and new models are constantly being progressed. At present, there are PSR (29), the coupling coordination degree model (30), the multi-agent model (31), the integrated response model (32), and the PCA model (33), which are the major methods of evaluation. The mainstream methods to determine the index system weight include the entropy weight method and the analytic hierarchy process (34). Dynamic development and trend prediction analysis are also important research directions of CCD of UR and EE, and scholars mainly use spectral analysis (35), the deviation ellipse model (36), and the gray forecast model (37) to conduct relevant empirical tests.
By the end of 2021, according to the resident population of China, the rate of UR was 64.72%, an increase of about 2.6 times from 17.92% in 1978, which is an unprecedented growth rate in the world (38). Urbanization, as a great source of driving force for social progress and improving the standard of living, has also brought about plenty of resources and environmental hazards, including water resource depletion, air pollution, and destruction of ecological diversity, affecting economic transformation and upgrading (39). China is standing at a critical node that promotes the urbanization development model to adapt to the transformation of the economic situation for now, aiming to integrate harmony, ecology, and livable development into urbanization (40). Temporary development at the cost of ecological risks goes against the human-centered principle.
The interaction between UR and EE in the southwest region is prominent. Since the implementation of the Western Development Strategy, the southwest region has become an important growth pole for China’s economic development, relying on abundant labor resources and unique geographical advantages and supported by policies such as the “Belt and Road” and the “China–Myanmar–Bangladesh–India Economic Corridor.” The rapid expansion of cities has highlighted the imbalance in urban–rural development. Therefore, coordinating the development of new-type urbanization and promoting deep integration of urban and rural domains stands as a critical imperative for the future progression of Southwest China. In general, the level of social productivity is lower than that of other regions, the economic base is still very weak, and it is still in the process of expanding urban capacity and improving urban quality (41).
Meanwhile, the southwest region is an important ecological and environmental protection barrier in China, with prominent ecological vulnerability issues. The area exposes extensive karst stratum, leading to poor soil fertility and rapid drainage of rainfall (42). The lack of soil fertility and water resources caused by the above reasons makes the natural ecology of the southwest region extremely fragile (43). Furthermore, with the speeding up of UR, heavy industry has become an essential driving force to boost economic growth, and the pressure on the ecosystem will increase, which will threaten the biodiversity of the ecosystem in the short term so that the cities in Southwest China will show the trend of urbanization and ecological environment imbalance (44). Attaching importance to the harmonious relationship between UR and EE in Southwest China and getting rid of the traditional industrial operation mode of energy-intensive, heavy pollution, and low efficiency can provide favorable help for the less developed areas to improve their urban competitiveness and realize the green rise.
The logical structure of this article is shown in Figure 1. In the background of ecological vulnerability and the rapid development of urbanization, 26 cities in Southwest China are the objects of study. The four levels of demographic, economy, space, and society are the selection of UR index and EE evaluation indicators from three aspects: EE state, EE pressure, and EE response. Based on the evaluation index system, the scores of the two systems were measured separately using the entropy weight TOPSIS method. Furthermore, the CCD model was employed to analyze the evolution process and law of the CCD of EE and UR. Finally, the obstacle factors affecting UR development and EE quality are identified by the obstacle factor model. Specific and feasible policy suggestions are proposed by combining the results of obstacle factor analysis and reality.
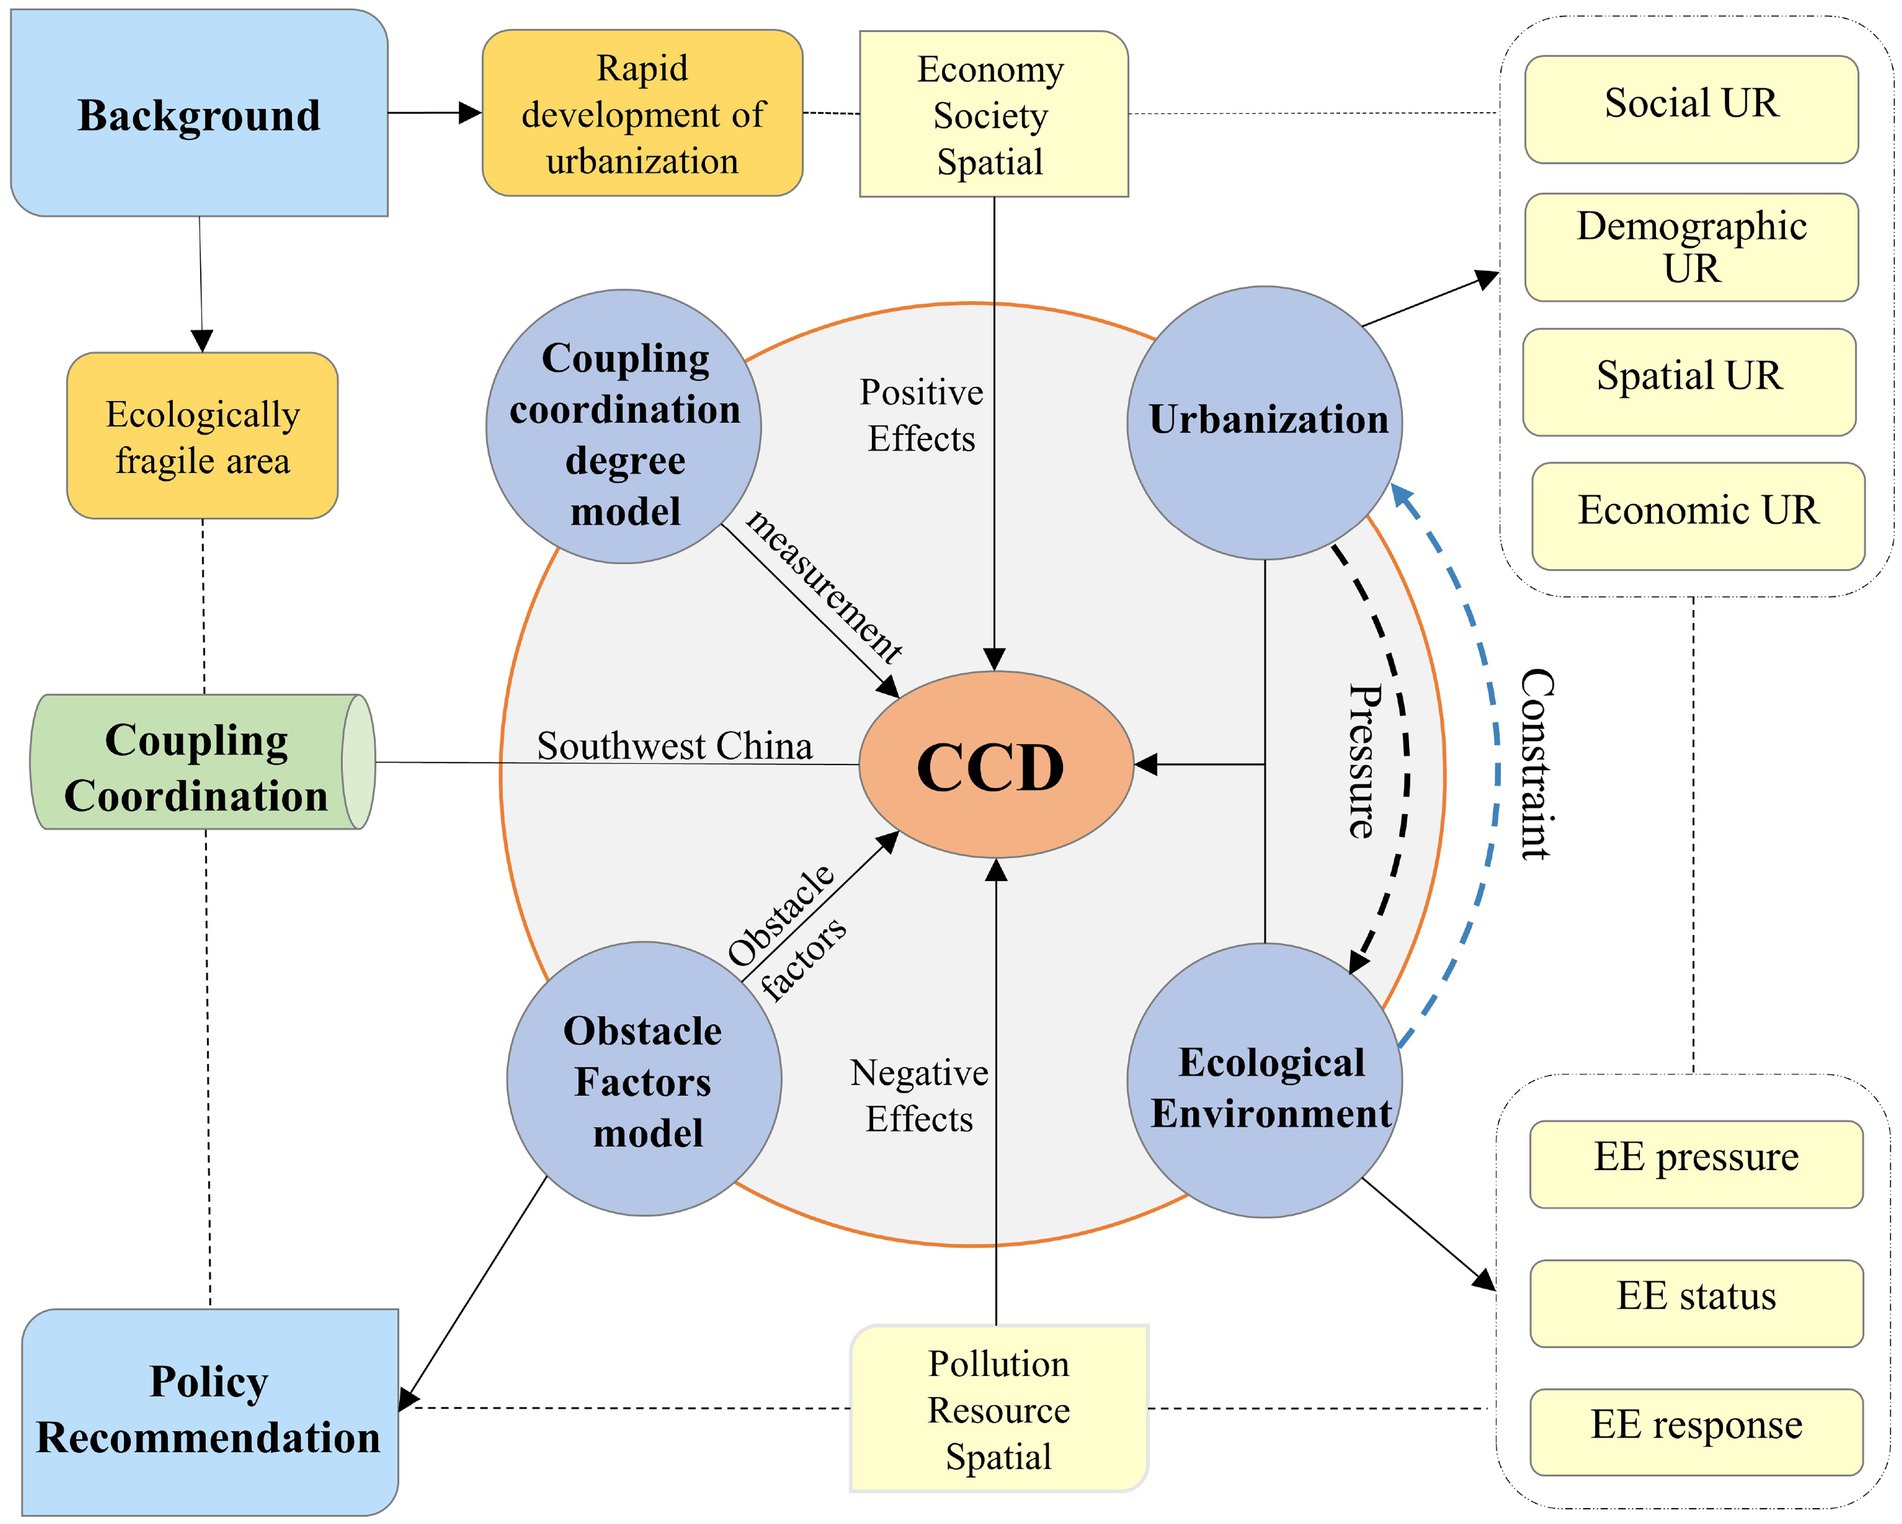
Figure 1. Theoretical framework of this study.
To coordinate the complex interactive relationship between UR and EE, this study takes 26 cities in Southwest China as the research object to carry out the analysis. This article will conduct further research from two aspects. On the one hand, in the evaluation of the CCD of UR and EE in Southwest China, multiple dimensions are included to identify the obstacle factors of the CCD, making the evaluation results of it and its restrictive factors more comprehensive, reasonable, and objective. On the other hand, taking the 26 representative cities of Southwest China as a case study, the spatial–temporal evolution trends of UR, EE, and CCD of both are analyzed for the sake of providing policy recommendations for green and sustainable development in ecologically weak areas and then balancing regional development differences.
2 Research methods and data sources
2.1 Study area
Southwest China, with its vast territory and sparse population, is one of the earliest agricultural areas in China. It has created a splendid culture and promoted the progress of human civilization. It is not only the water conservation area of the middle and lower reaches of the Yangtze River but also the key “source” of ecological balance. However, man-made destruction of vegetation and irrational use of land resources result in barren land, rocky desertification, and frequent disasters. Chongqing, being a provincial-level municipality, does not fit within the same classification as other urban areas, thus rendering comparisons inappropriate. Consequently, the study area does not encompass Chongqing Municipality. Furthermore, given the presence of numerous minority autonomous regions and cities within the Southwest region, the data published by these areas may lack comprehensiveness, resulting in numerous instances of missing data values. Therefore, to uphold the study’s robustness, regions with incomplete data are excluded. Taking these factors into account, 26 cities, excluding Chongqing, were included in this study (Figure 2). The empirical study of the CCD of UR and EE in 26 cities is of valuable significance for improving regional ecological conditions, exploring economic potential, and fostering harmonious social life.
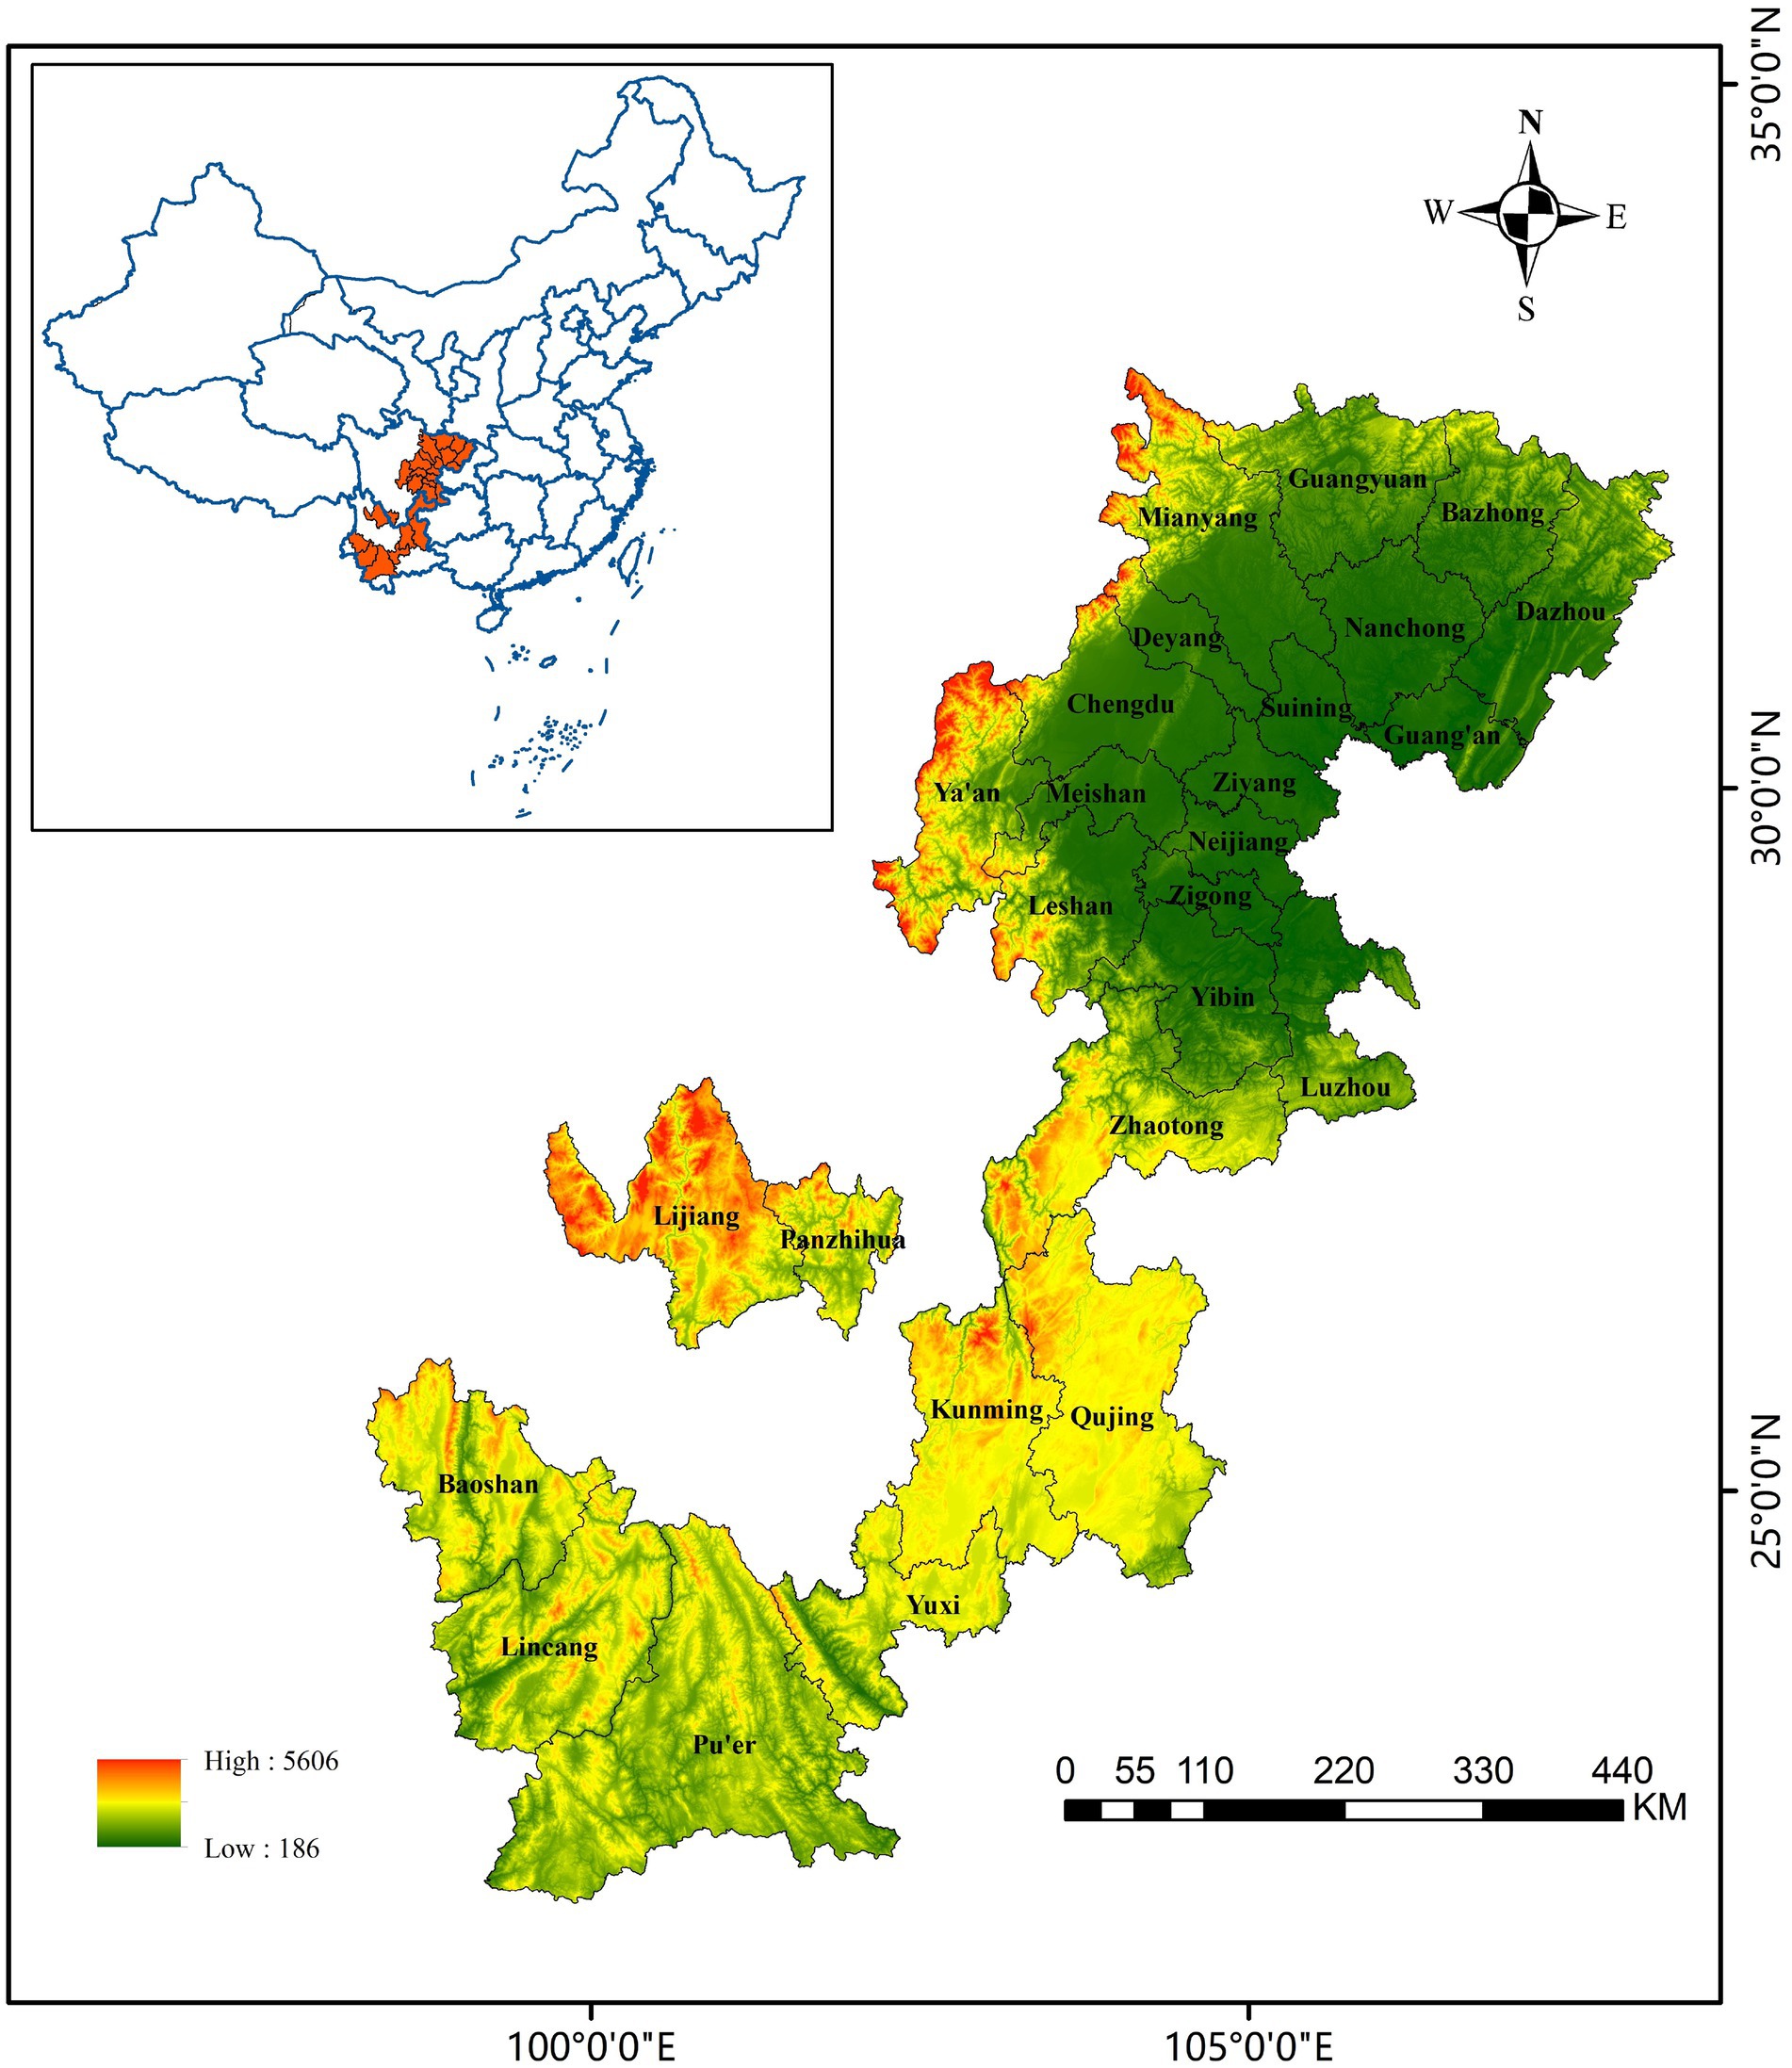
Figure 2. The spatial location of the cities in the Southwest China region.
2.2 Index system construction
Research on the CCD of UR and EE systems is extensive, primarily focusing on the relationship between individual UR indicators and single EE indicators. Notable among these are eco-efficiency indicators such as carbon emission (45), resource status (46), water resources (47), and the Normalized Difference Vegetation Index [NDVI (48);]. However, the ecological environment is characterized by complex and diverse ecosystems, making reliance on a single indicator insufficient for fully assessing ecological quality. Recognizing this limitation, to precisely and all-sided present the comprehensive traits of ecosystems (49), scholars have built many kinds of ecological environment evaluation index systems, including physiological conditions and natural geography, which provide a basis and guarantee for ecosystem health evaluation, ecological protection and restoration, ecological compensation, and ecological carrying capacity evaluation (50, 51).
Furthermore, given the dynamic nature of social and economic development, urbanization represents a multifaceted integration of the social environment, economic status, land use, and population agglomeration. Recognizing that the urbanization of a single population cannot fully represent the level of urbanization, scholars began to consider using more comprehensive indicators (52, 53).
UR and EE systems both contain a variety of dimensions and many influencing factors, which belong to the non-linear complex system. After the interaction and coupling of the two, a more complicated system is formed. Therefore, referring to the frequency of various indicators in existing studies, in line with the principles of comprehensiveness and availability, and combined with the development characteristics of 26 cities, the evaluation index system of UR and EE in Southwest China was established. As shown in Table 1, the positive indicator means that the indicator has a positive promoting effect on urbanization development and ecological environment level, while the negative indicator has a negative inhibiting effect.
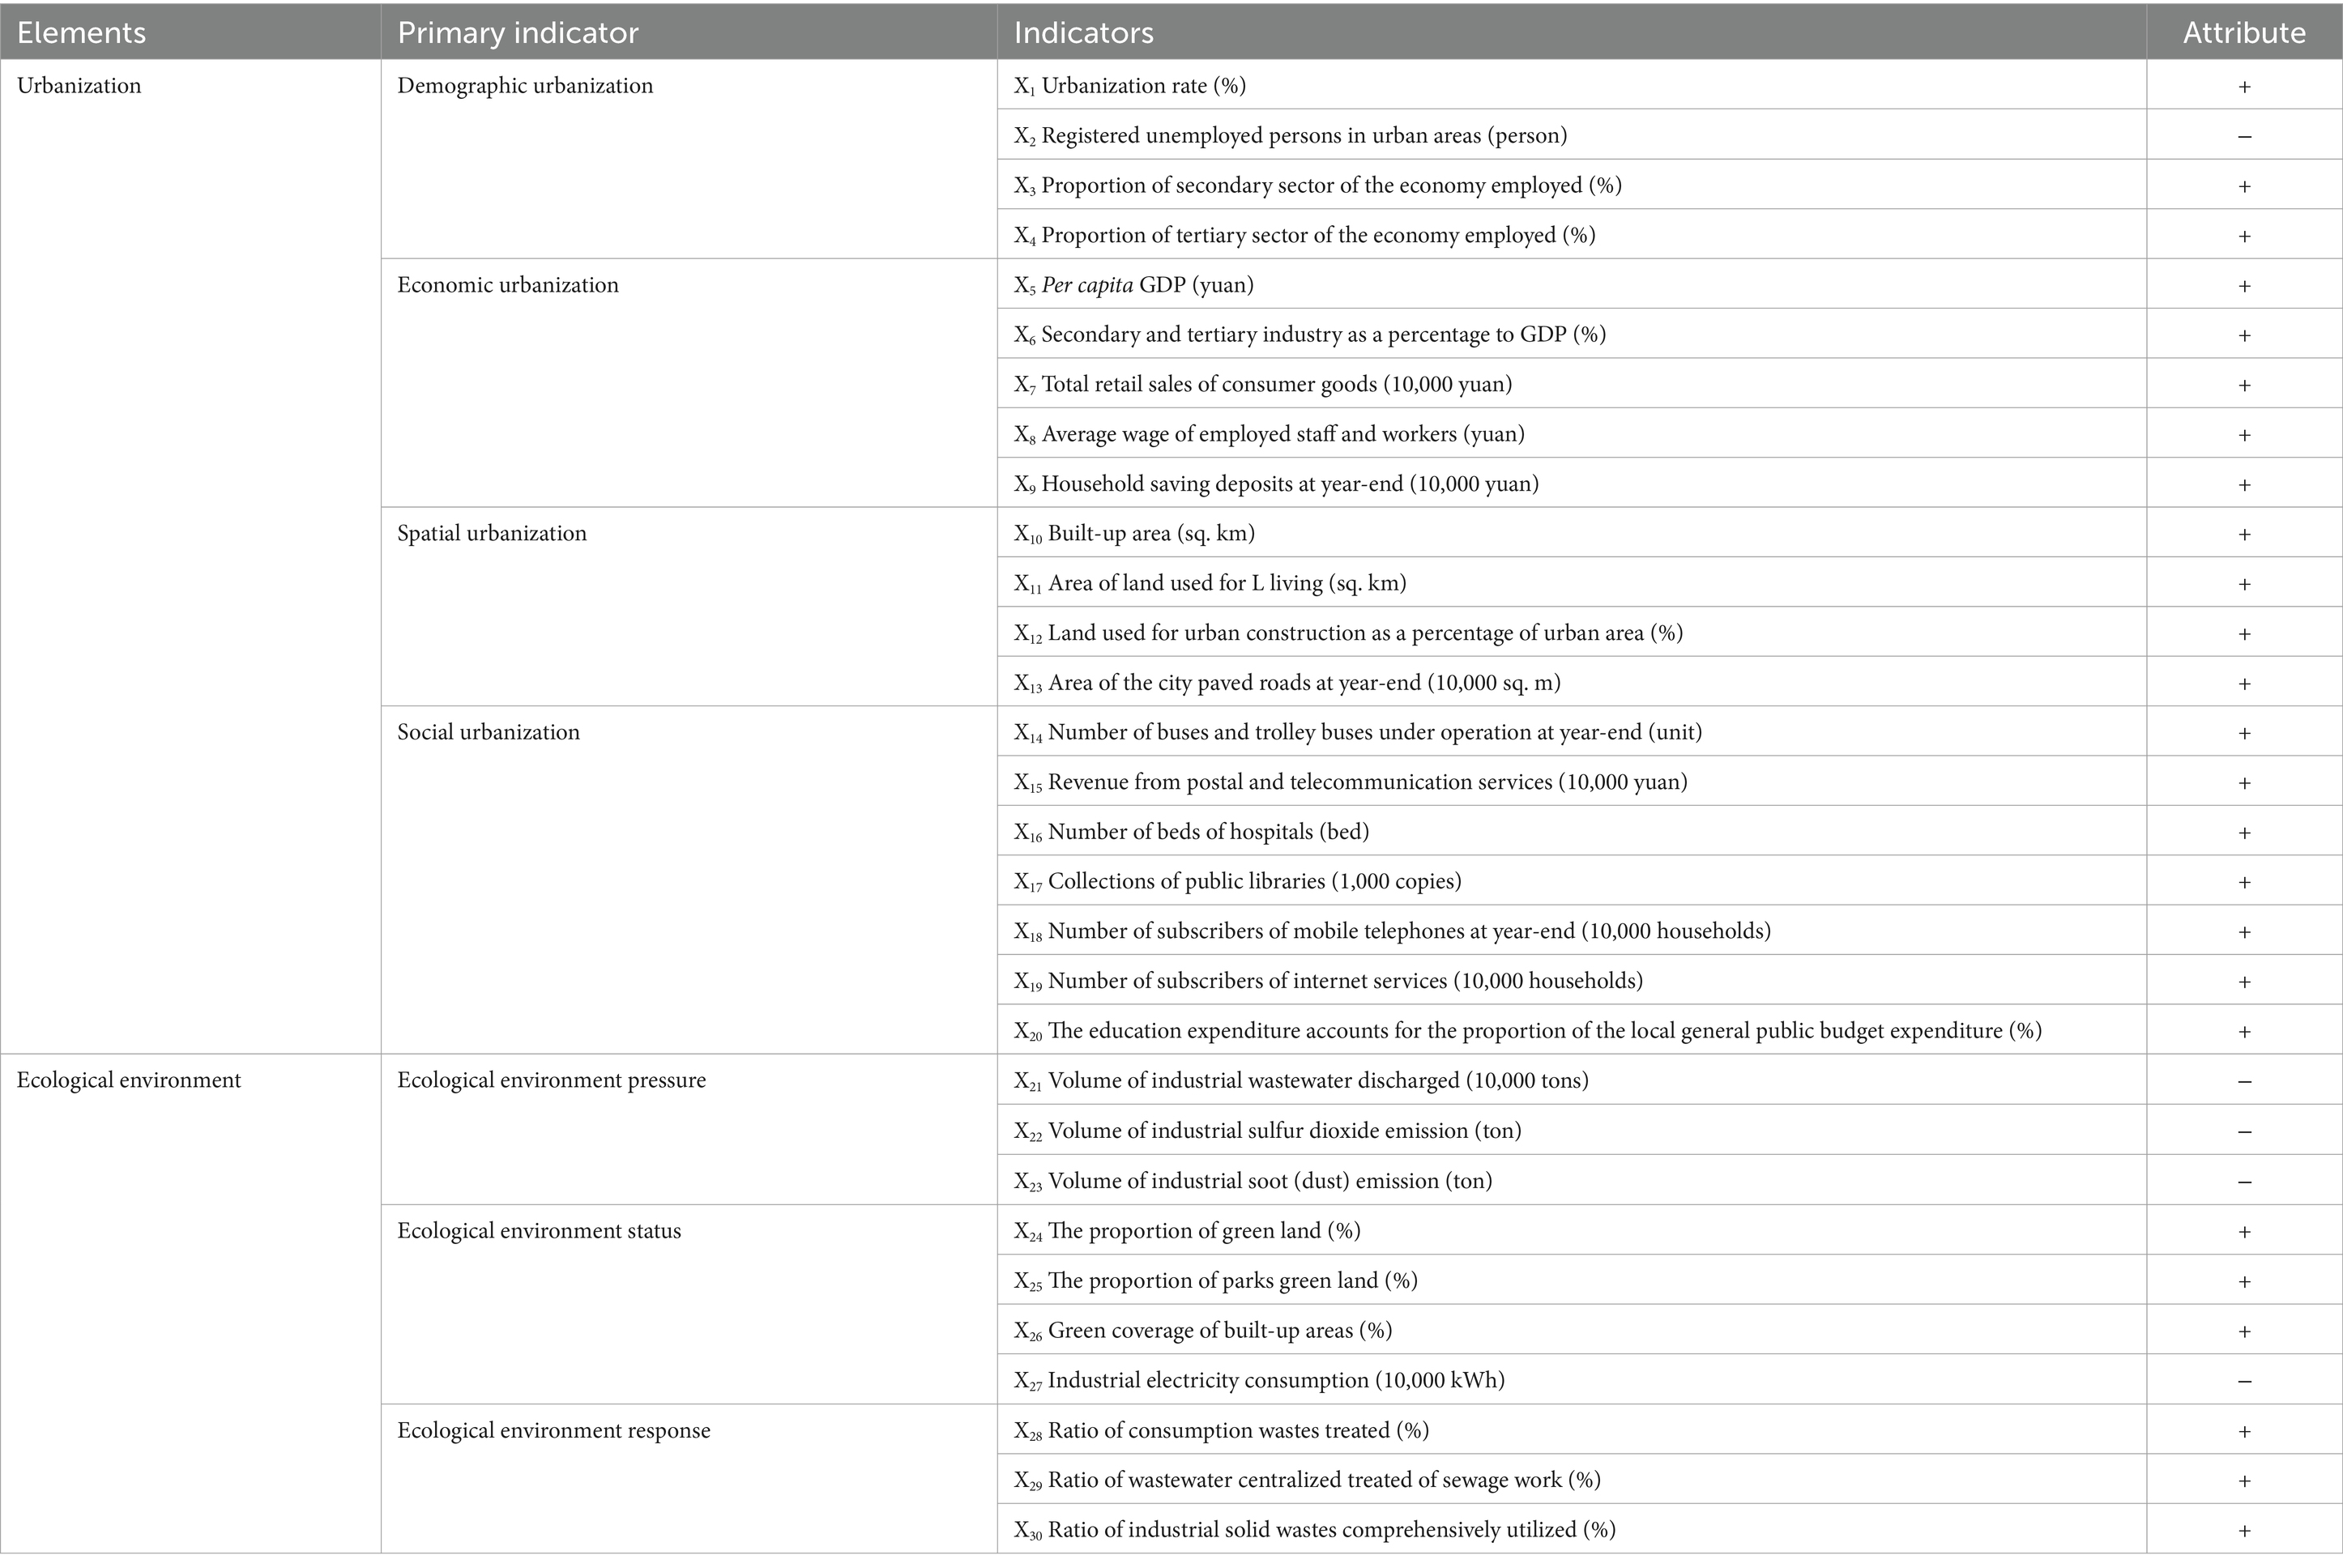
Table 1. Indicator systems of UR and EE (2009–2019).
2.3 Data sources and methodology
2.3.1 Data sources
This study uses the annual data from 2009 to 2019 for UR and EE of 26 cities in Southwest China. The economic and social data ranging from X1 to X30 are obtained from the China Urban Statistical Yearbook (2010–2020), the Sichuan Statistical Yearbook (2010–2020), and the Yunnan Statistical Yearbook (2010–2020). The individual missing values were supplemented by searching the Statistical Yearbook and Statistical Bulletin on National Economic and Social Development for the corresponding years of each province and city. For data with fewer missing years, data from adjacent years were supplemented using linear interpolation. Data with numerous missing years were deleted to ensure the reliability of the results.
2.3.2 The entropy TOPSIS model
The entropy weight TOPSIS method amalgamates the strengths of both the entropy weight method and the TOPSIS method. The entropy weight method serves as an objective weighting approach, determining weights based on the information of each evaluation index. It not only reveals the importance of each index in the decision-making process and reflects the original information of each index but also depicts the changes in index weights over time, thus mitigating subjective bias to some extent and enhancing the scientific rigor of evaluation (54). On the other hand, TOPSIS evaluates the relative merits and demerits among finite objects. The entropy weight TOPSIS method initially calculates the objective weights of indicators using the entropy weight method and then applies the TOPSIS method to evaluate each object. This method’s objectivity mitigates bias stemming from subjective assignment and is suitable for the scientific evaluation of each subsystem. In this study, the index weight is determined by the entropy weight method, and then the TOPSIS method calculates the ideal solution to determine the ranking of the evaluation objects. The calculation steps are listed hereafter: (Equations 1–14)
(1) Construct the global evaluation matrix: Suppose there are cities, indicators, that constitute the initial matrix . The formula is as follows:
(2) Data standardization processing:
The range method is used for standardization. The standardized formula for positive indicators is as follows:
The standardized formula for negative indicators is as follows:
In the formula, represents the standard value of the index of the evaluation object, and represent the maximum and minimum values of the original data, respectively. All values are in [0,1] after normalization.
(3) Calculate information entropy and information entropy redundancy :
Among them when .
(4) Define the weight of each indicator :
(5) Calculate the matrix of weights:
(6) Determine the optimal and the worst solutions:
(7) Calculate the Euclidean distance between each scheme and the optimal, worst solution:
(8) Calculate the comprehensive rating index:
The value represents the advantages and disadvantages of a city’s comprehensive evaluation results in urbanization and EE in a certain year. The larger the value, the higher the evaluation. The stage division of UR and EE is shown in Table 2.
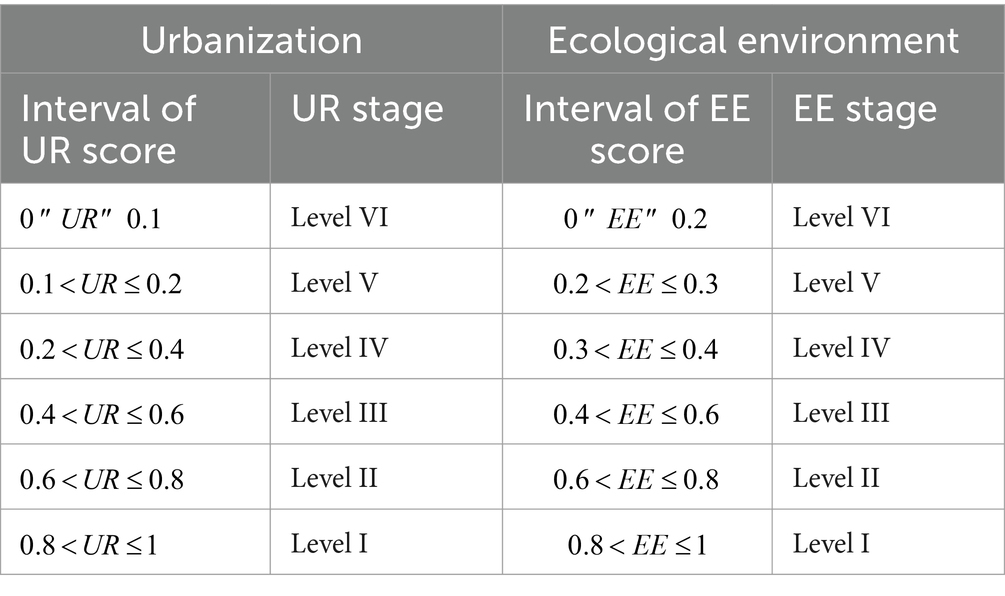
Table 2. Stage division of UR and EE.
2.3.3 The CCD model
The CCD model serves as an analytical tool for assessing the level of coordinated development across various entities. It facilitates the examination of correlations, synergies, and coordination among different subsystems within a regional economic system. The coupling relationship between the UR system and the EE system is modeled through the CCD model as follows: (Equations 15–17)
represents the UR comprehensive score, and represents the EE comprehensive score. represents the CD, represents the CCD, and represents the overall development index of UR and EE. and are specific weights, which are determined by the relative importance of urbanization and the EE system. This study suggests that the two are equally important in the UR–EE interaction coupling system, thus it is taken . According to the actual development of cities in Southwest China, the CCD of UR and EE is divided into five categories, as shown in Table 3.
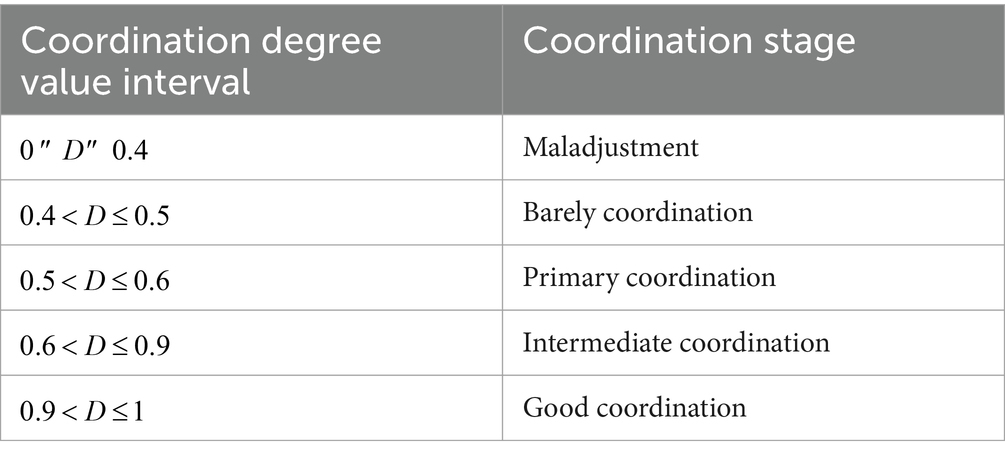
Table 3. Stage division of coupling coordination degree between urbanization and EE.
2.3.4 The obstacle factors model
The obstacle factors model can calculate the obstacle degree of each evaluation index in the comprehensive evaluation, search for key factors that restrict the further development of things, clarify the factors that have the main influence on the evaluation results, and clarify the influence degree of the key constraints. In this study, the obstacle factors model is used to explore the main obstacle factors affecting the CCD of UR and EE for analysis and diagnosis (55). The formula is as follows: (Equation 18)
is the weight of the index, and is the obstacle degree of the index in year.
Based on the preceding analysis, the methodological flowchart of this study is depicted in Figure 3.
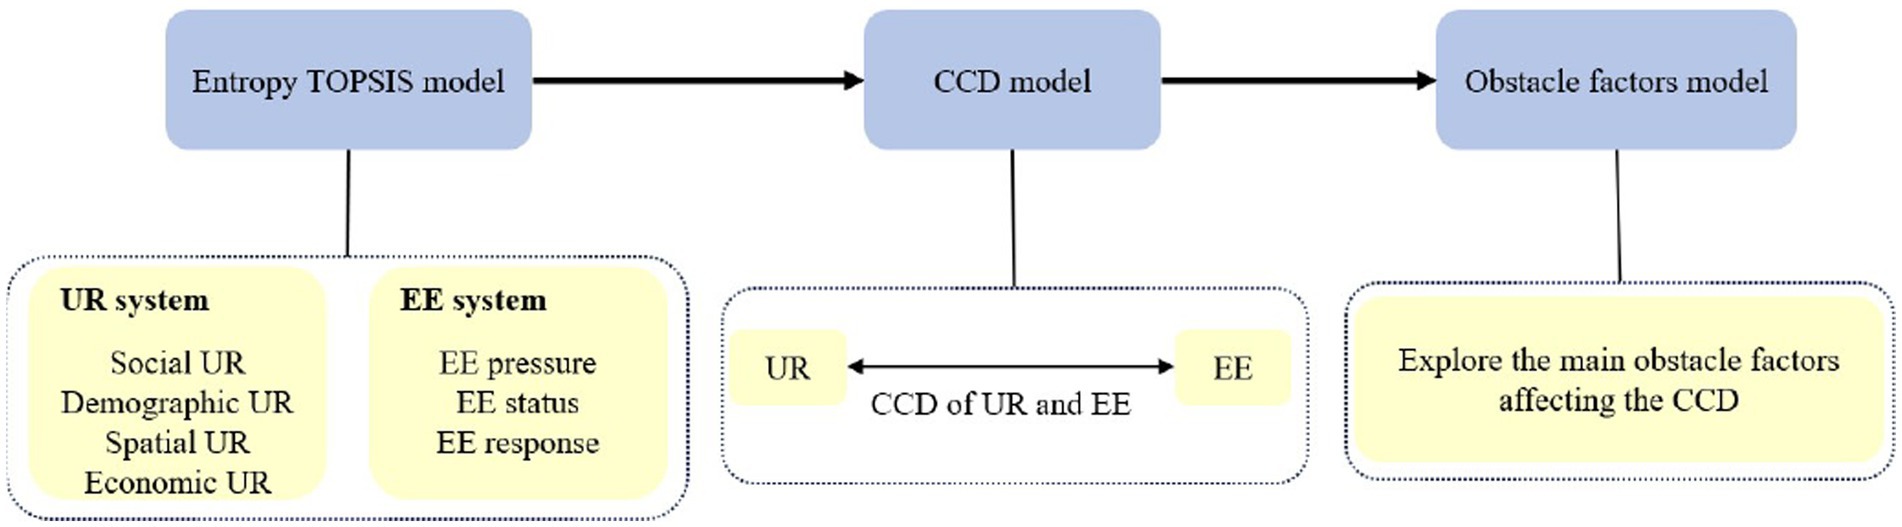
Figure 3. Methodological flowchart of this study.
3 Results
3.1 The analysis of the urbanization subsystem
The fluctuation of UR scores in 26 cities in Southwest China increased. According to the average UR score of each city, with a growth rate of 27.92%, Chengdu increased from 0.743 in 2009 to 0.951 in 2019, which is the highest quality of urbanization in Southwest China, and its score is much higher than other cities. In addition to Chengdu, Kunming is the only city whose average UR score is over 0.4. Most cities have UR scores hovering around 0.1. This shows that provincial capital cities with relatively prominent social and economic strength have the best effect on UR. From the perspective of the growth rate, four cities exceeded 50%, including Nanchong (64.32%), Ya’an (83.50%), Lijiang (59.75%), and Lincang (54.93%). Panzhihua (−5.71%), Deyang (−1.68%), and Kunming (−34.12%) show negative growth. The improvement of UR quality in 26 cities from 2009 to 2019 indicates that cities in Southwest China have achieved remarkable development in industrial transformation and upgrading, people’s living standards, and spatial pattern construction.
The distribution of UR scores of 26 cities in Southwest China presents a significant feature of extreme spatial imbalance, showing the spatial characteristics of “strong core, weak middle, and edge” (Figure 4). Chengdu and Kunming, as the capital cities, have the best performance due to their strong economic strength. The level of urbanization in the remaining 24 cities is still in its infancy, rising gently, and most cities have improved but are ineffective. Specifically, from 2009 to 2012, eight cities achieved stage upgrading, while the remaining 18 cities remained unchanged. The level I cities grew from scratch due to the improvement of Chengdu, and the overall cities showed a significant improvement. From 2012 to 2016, two cities were upgraded, three cities were downgraded, and the remaining 21 cities remained unchanged, showing little change in the overall level. From 2016 to 2019, four cities were upgraded, four cities were downgraded, and the remaining 18 cities remained unchanged, showing a slight decline from 2016. The big difference in the UR scale among cities is mainly because of the difference in geographical location, distribution of population resources, and development strategies.

Figure 4. Spatial–temporal variation of score of UR.
3.2 The analysis of the ecological environment subsystem
The fluctuation of EE scores in Southwest China decreased from 2009 to 2019. According to the average EE score of each city, Chengdu has the best EE quality in Southwest China, and its score rose from 0.769 in 2009 to 0.886 in 2019. Zhaotong has the worst EE quality in Southwest China, and its EE score decreased from 0.217 in 2009 to 0.141 in 2019, with a negative growth rate of 35.15%. In addition to Chengdu, six other cities scored above 0.25 on average, including Zigong (0.444), Deyang (0.264), Suining (0.409), Neijiang (0.254), Nanchong (0.256), and Kunming (0.351). Although most cities are non-resource-based, they still excel in the allocation of natural resources. In the field of growth rate, six cities show positive growth rates, namely, Chengdu (15.26%), Luzhou (34.86%), Neijiang (21.35%), Leshan (5.70%), Yibin (38.78%), and Dazhou (7.77%). The deterioration of EE in 20 cities from 2010 to 2019 indicates that cities in Southwest China have adopted unreasonable practices in the landscaping of the garden, natural resource utilization, and sewage treatment, resulting in an improvement in EE quality that is insignificant.
According to the distribution of EE scores of 26 cities in Southwest China, it can be seen that the spatial distribution pattern of EE score is similar to that of UR score (Figure 5). The overall situation of EE quality development in various cities is not optimistic enough. Individual cities have made steady progress, and the upward trend is gentle. Specifically, from 2009 to 2012, five cities achieved stage upgrades, 10 cities were downgraded, and the remaining 11 cities remained unchanged. The overall level of level I cities increased due to Chengdu’s ecological environment protection from scratch. From 2012 to 2016, only Yuxi achieved stage upgrade; the other seven cities were downgraded; 18 cities remained unchanged; and the overall level decreased. From 2016 to 2019, four cities were upgraded, while one city was downgraded, and the remaining 21 cities remained unchanged, showing little change in the overall level. One of the reasons for this result is that the restoration of EE quality is a long-term process that requires more time and resources. Second, in the current economic situation, ecological compensation, purification of pollution, and expansion of greening are still seen as the “expend” and “sacrifice” of monetary benefits and have not received enough attention from the government and enterprises.
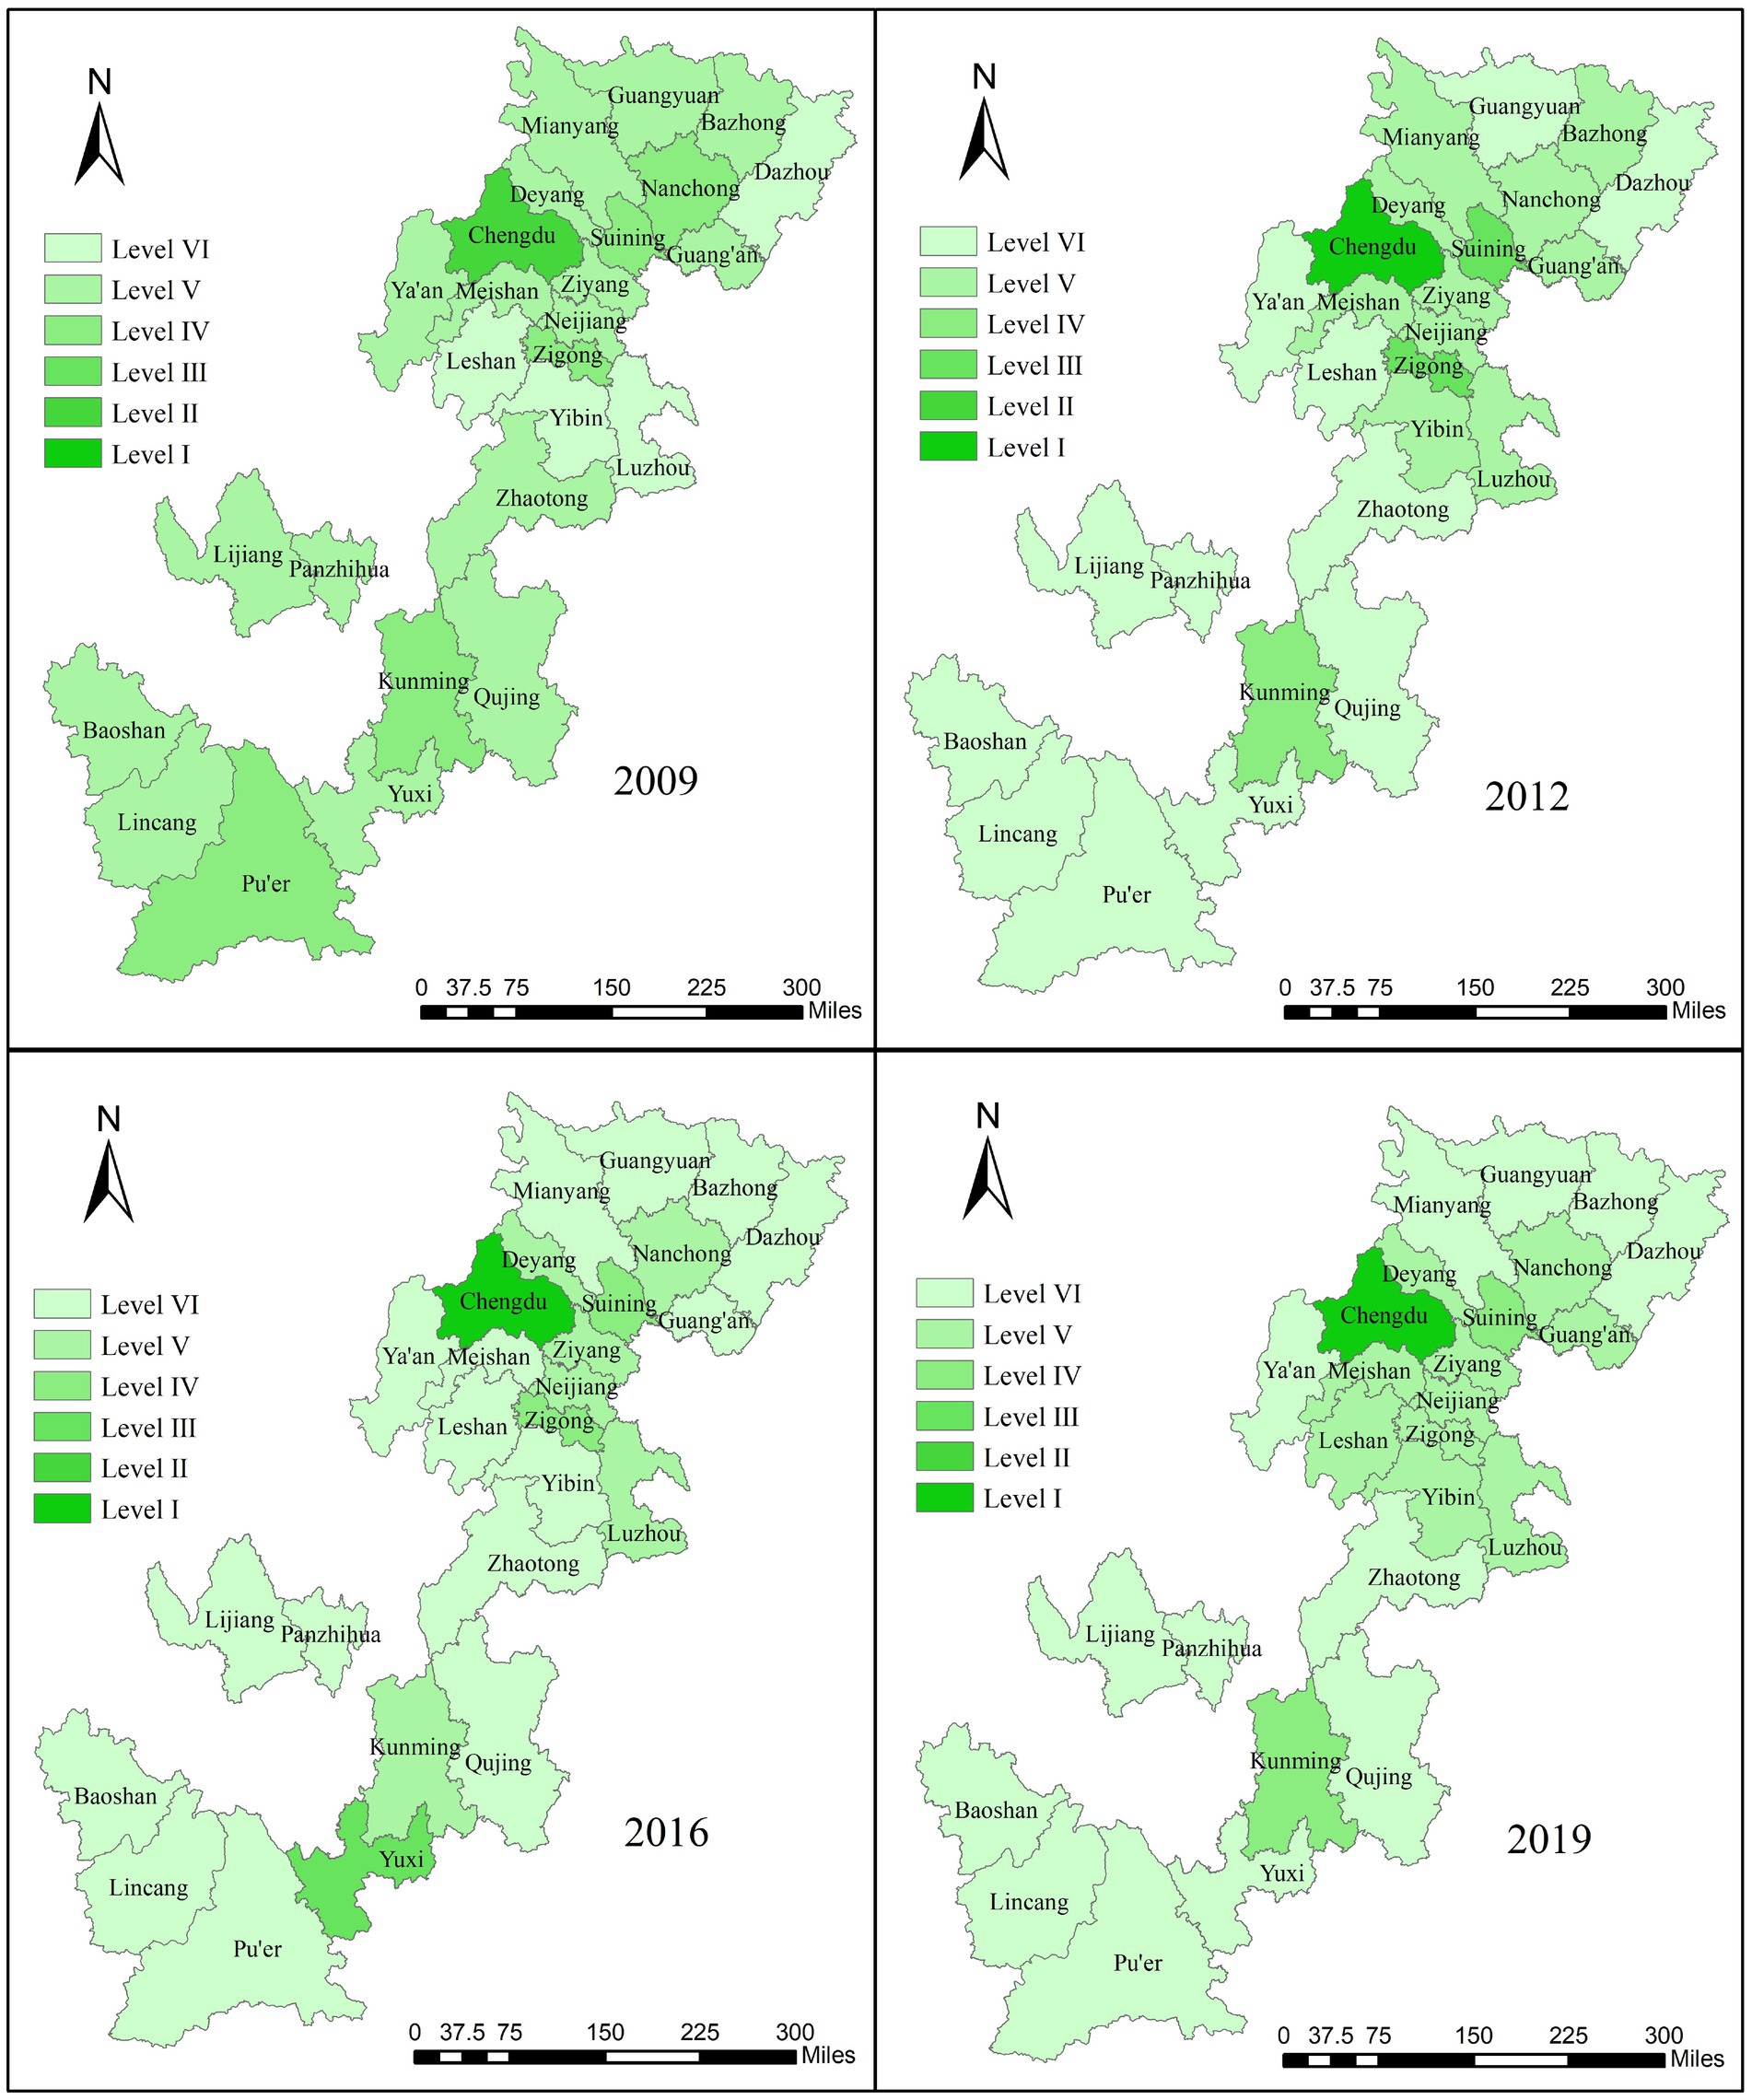
Figure 5. Spatial–temporal variation of score of EE.
3.3 The analysis of the coupling coordination degree
The scores of the CCD of UR and EE in 26 cities of Southwest China were generally gradually upward from 2009 to 2019, between 0.298 and 0.958. The level of CCD in each city is distributed into five types, from imbalance to good coordination, with an overall improvement. In the field of the average CCD score from 2009 to 2019, Chengdu performed the best, increasing from 0.870 to 0.958 with a growth rate of 10.19%. Only Chengdu and Kunming have reached the good coordination and intermediate coordination stages, respectively, with average values of 0.933 and 0.637, and the other 24 cities are in the maladjustment stage and barely coordination stage. According to the growth rate of CCD from 2009 to 2019, Luzhou had the highest average annual growth rate of CCD, which was 17.55%. In addition to Luzhou, four other cities had a growth rate above 10%, including Chengdu (10.19%), Neijiang (15.52%), Yibin (14.08%), and Dazhou (11.29%). Negative growth rates in Kunming (−14.13%) and Qujing (−12.92%) exceed (10%) (Table 4).
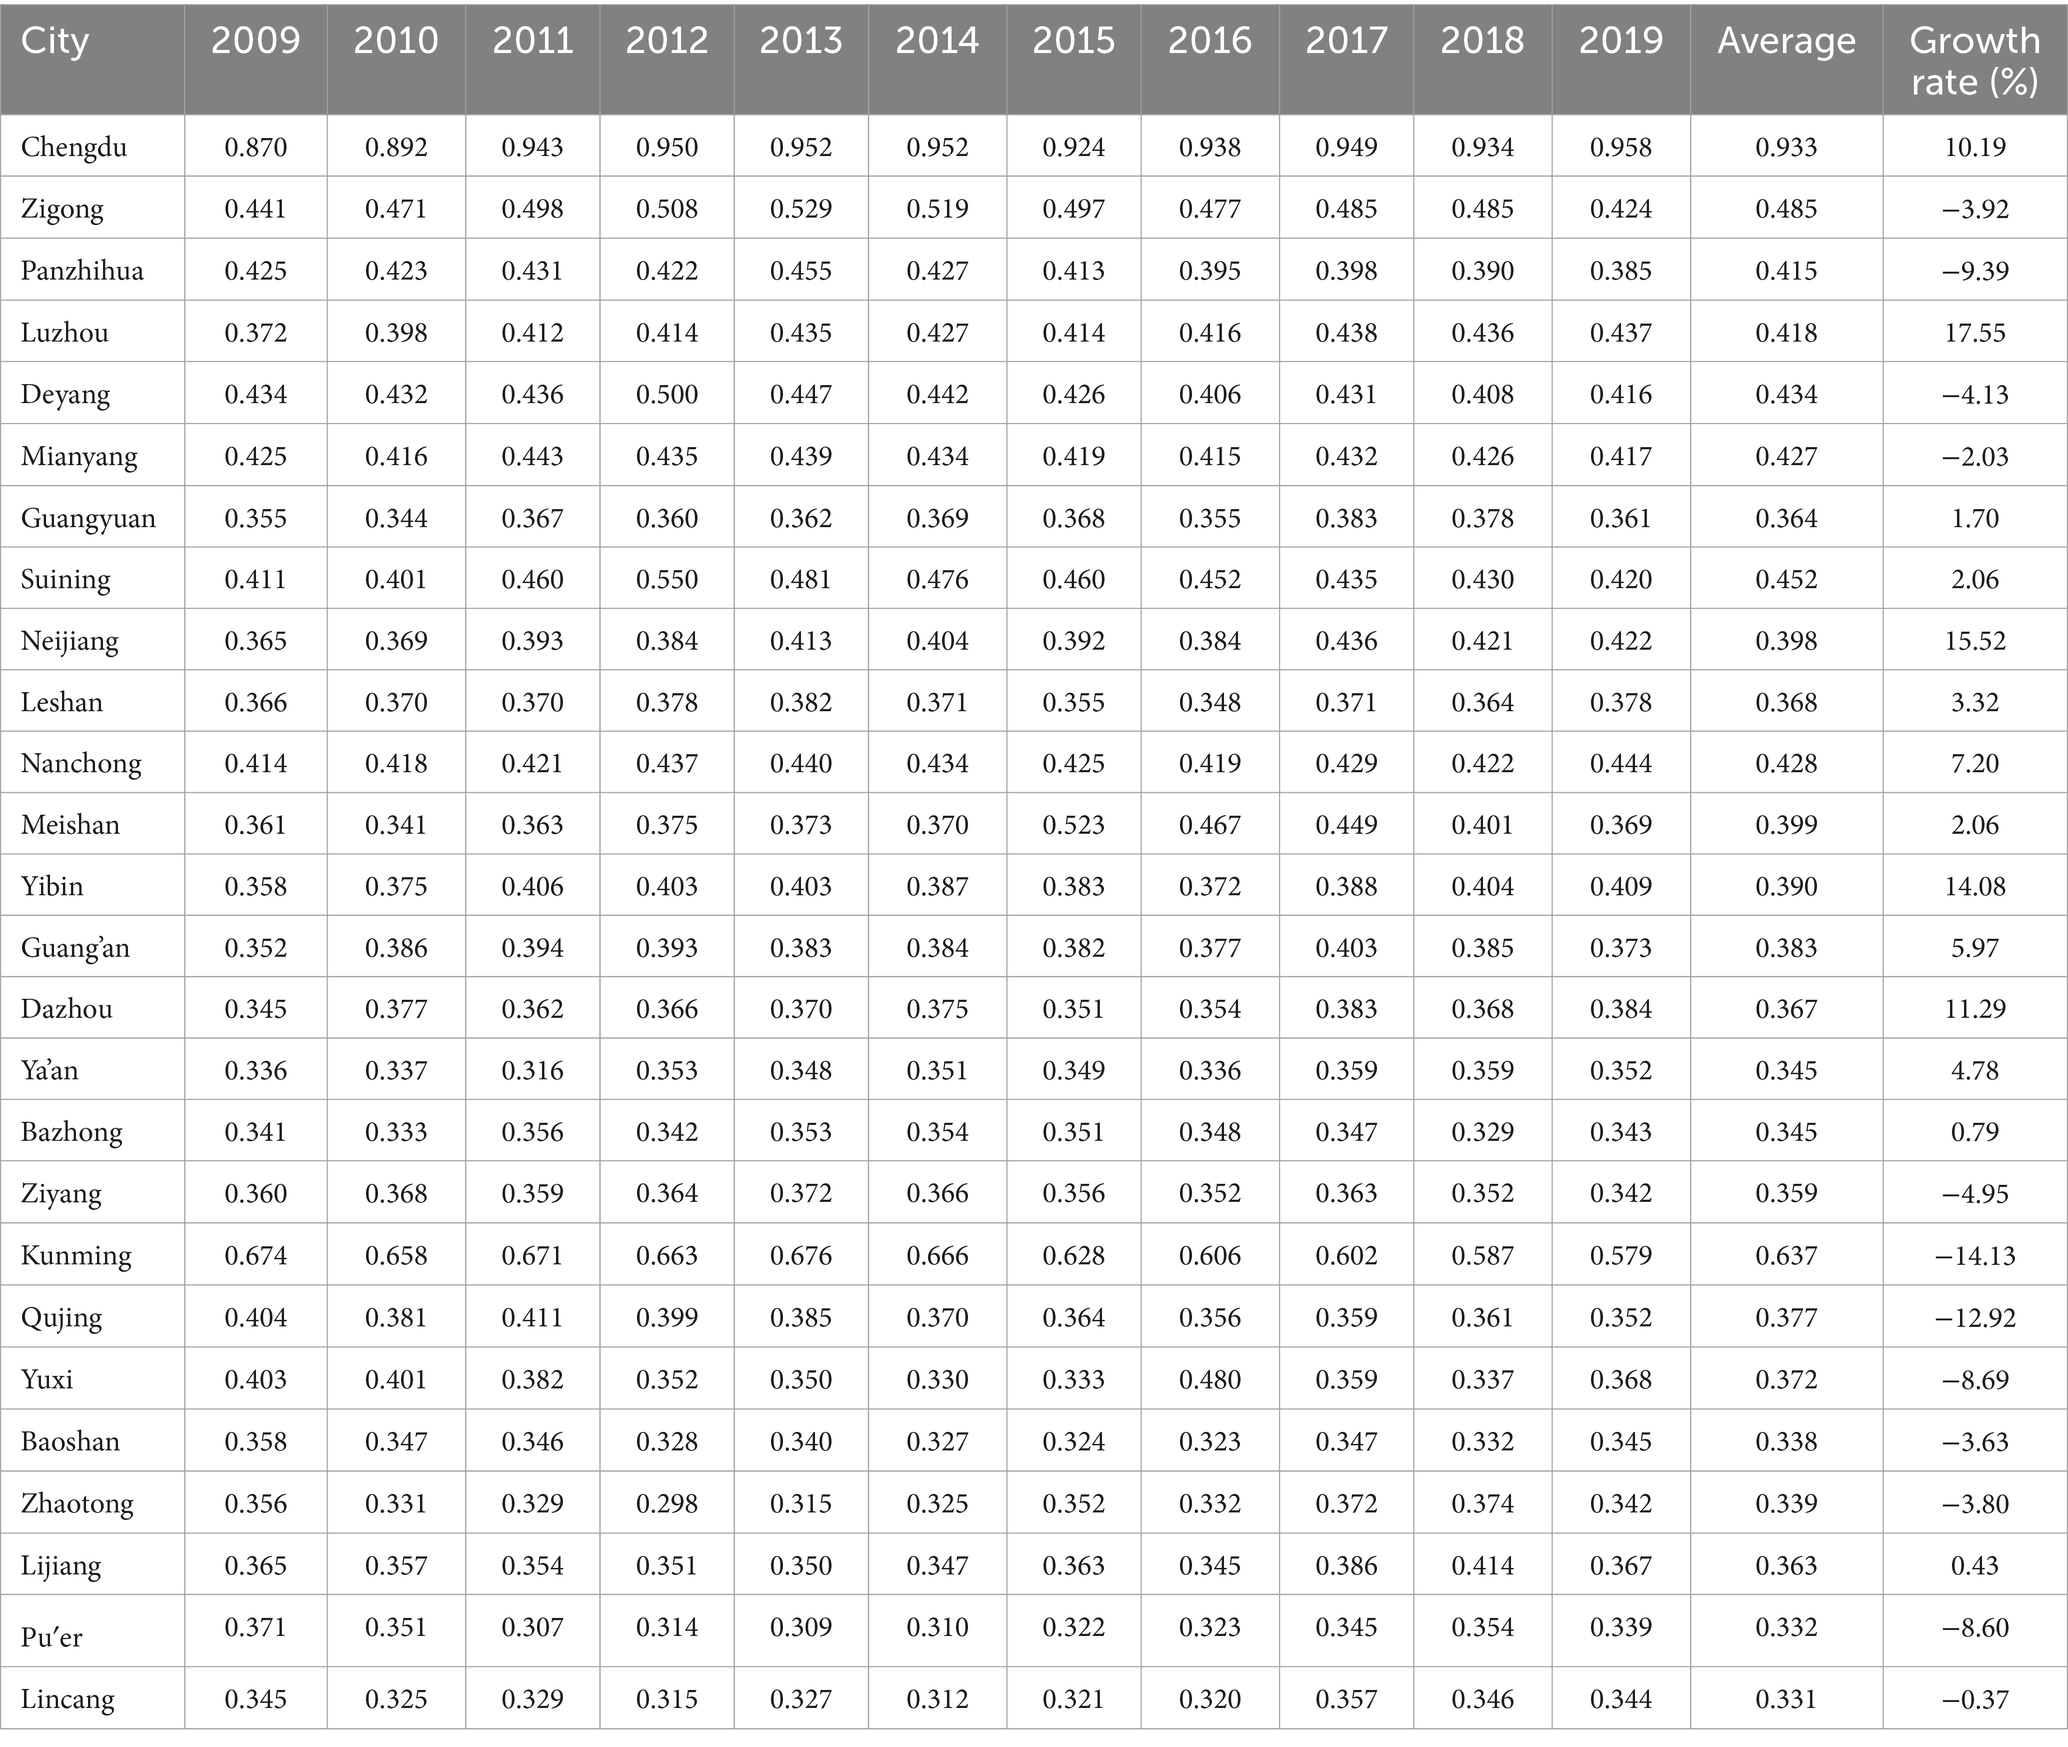
Table 4. CCD of urbanization and EE.
According to ArcGIS10.8, to visualize the spatial differentiation of the CCD in 26 cities in Southwest China in 2009, 2012, 2016, and 2019. The spatial–temporal changes of the CCD are shown in Figure 6. In 2009, only Chengdu and Kunming were in the intermediate coordination level, while other cities were in the disordered state, and the overall CCD was not high, and no cities were in the primary coordination stage or good coordination stage, with large internal differences, indicating that the UR development and EE protection of all cities were in a relatively disharmony state during this period. From 2009 to 2012, five cities were promoted, two cities were decreased, and the remaining 19 cities remained unchanged. Zigong and Suining were promoted to the primary coordination stage, and the overall CCD level was improved. From 2012 to 2016, two cities improved, four cities decreased, 20 cities remained unchanged, and the overall level decreased slightly. From 2016 to 2019, three cities declined, two cities upgraded, and 21 cities remained unchanged, except for Kunming, which was degraded from intermediate coordination to primary coordination, and Chengdu, which remained in the good coordination stage. Although the overall CCD in 2019 improved to a certain extent compared with that in 2009, only Chengdu and Kunming reached coordination, and the scores of the CCD of the remaining cities were still in the disequilibrium stage below 0.5, with “strong core, weak middle, and edge” still prominent.
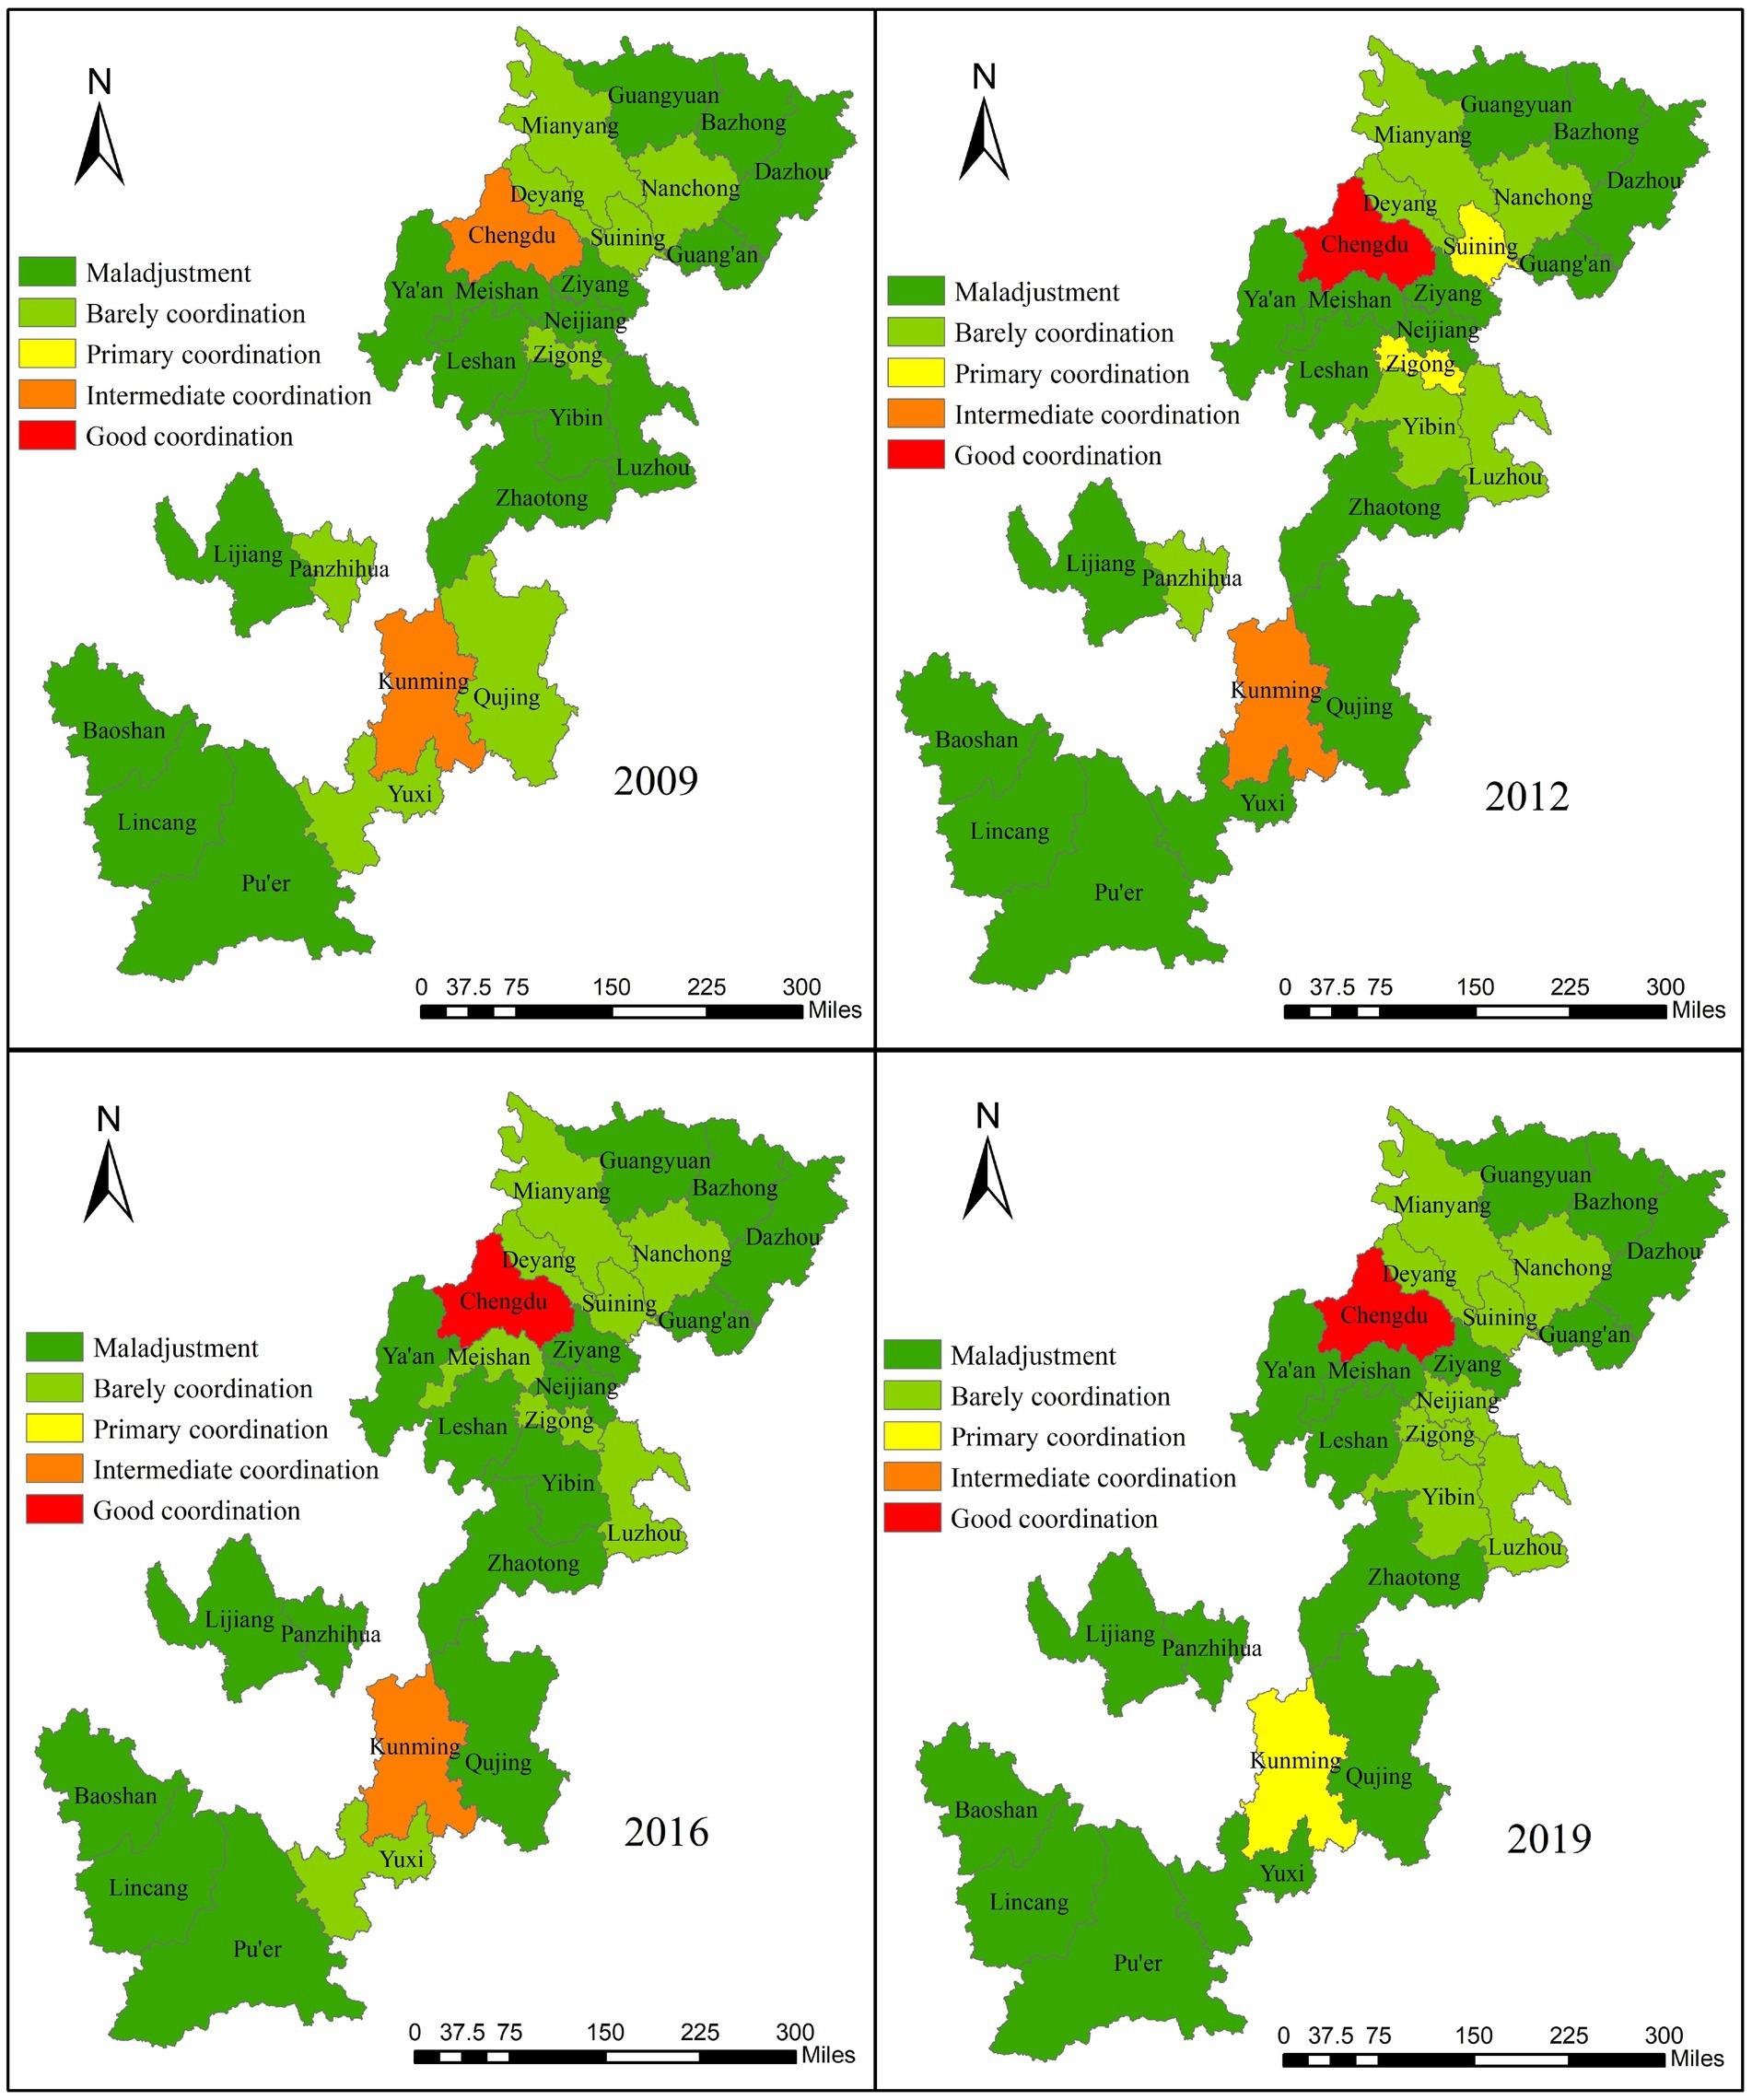
Figure 6. Spatial–temporal variation of coupling coordination degree.
As for the temporal evolution of a single city, the trend evolution of a few cities is stable, and the fluctuation amplitude of most cities is obvious (Figure 7). Most of the cities with large changes show inverted “W“-shaped and inverted “V“-shaped time evolution characteristics, including Panzhihua, Deyang, Mianyang, Guangyuan, Suining, Meishan, Guang‘an, Ziyang, and Yuxi. It can be seen that these cities lack the impetus for economic growth and have failed to deal with the emission of pollutants caused by industrial development, which restricted the improvement of urban social welfare and the prevention ability of regional ecological risks and led to obvious fluctuations of CCD from 2009 to 2019 in these cities. How to optimize the industrial structure and how to improve the urban pollution control capacity is the key direction of urban transformation. It should be noted that Kunming, as the provincial capital, its CCD levels have shown a continuous decline from 2009 to 2019, which failed to grasp its good economic foundation and natural resource advantage.
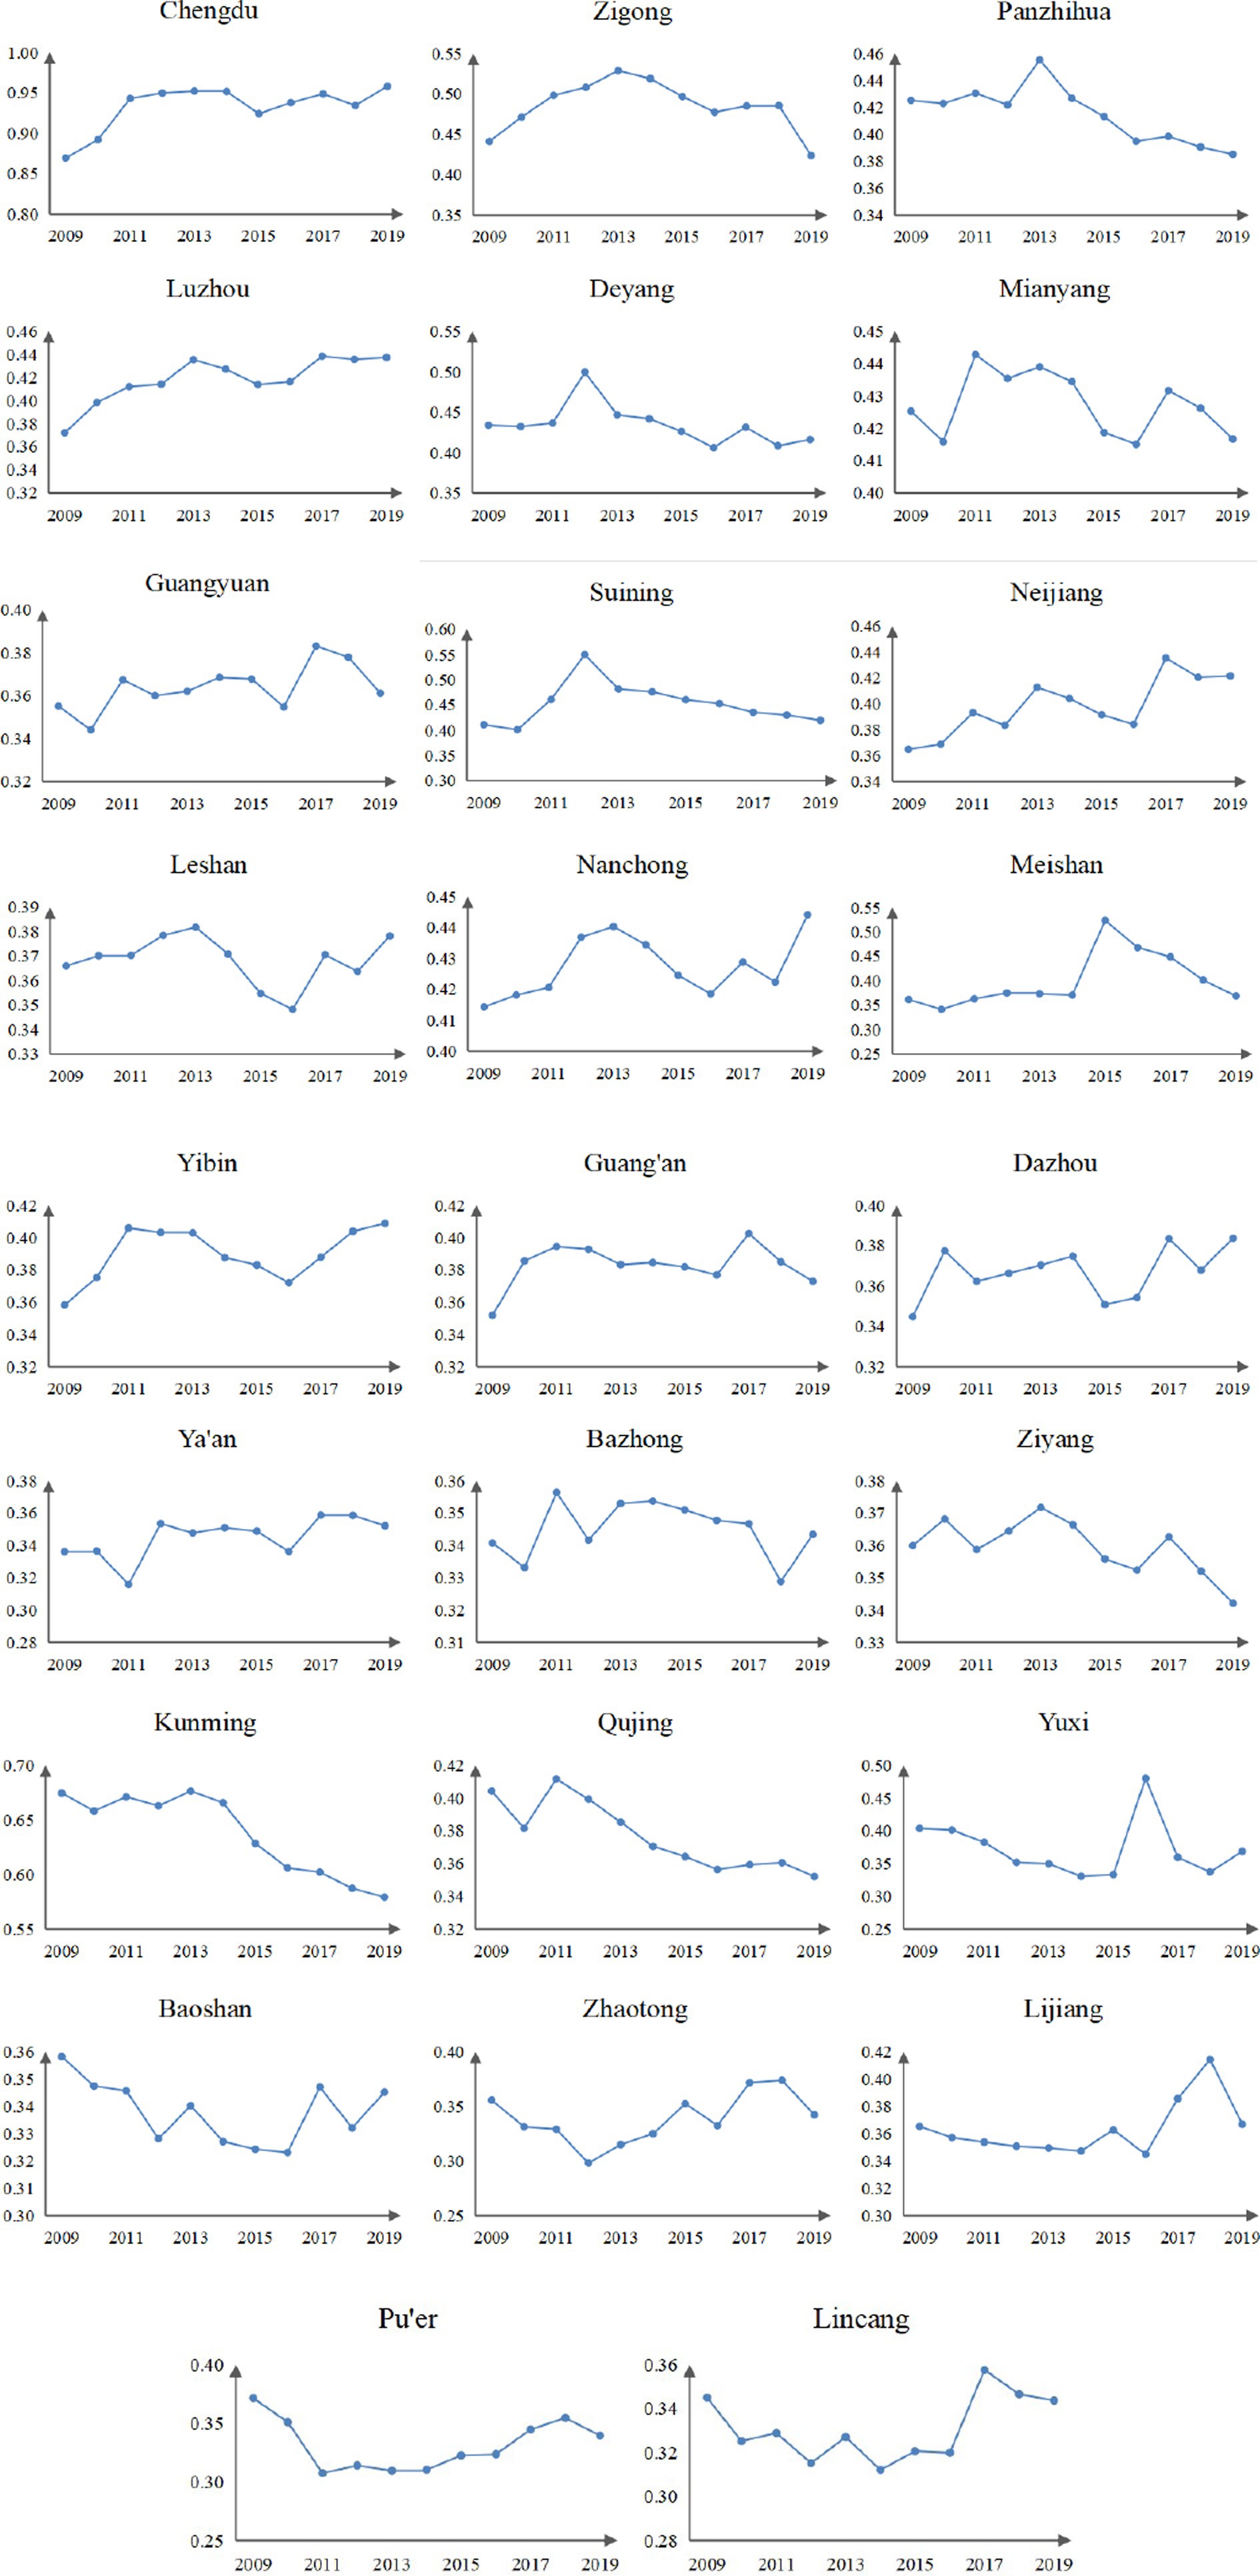
Figure 7. CCD evolution characteristics of 26 cities in Southwest China.
3.4 The analysis of key obstacle factor diagnosis
3.4.1 CCD obstacle degree identification results in 2009
From the perspective of a single index, the degree of obstacle varies greatly (Figure 8), and the average value is [0.12, 12.34%]. The top eight indexes with high obstacle degrees are, respectively, X19 (12.34%), X14 (9.03%), X15 (8.93%), X7 (8.19%), X12 (7.22%), X17 (7.03%), X13 (6.78%), and X10 (5.98%). From the system layer, the order of obstacle degree was social UR (46.04%) > spatial UR (23.05%) > economic UR (13.79%) > EE status (11.10%) > demographic UR (3.36%) > EE response (1.45%) > EE pressure (1.21%), indicating that social services for people’s livelihood are a major constraint on the level of coordination. Among them, in the social UR content, X19 (12.34%), X14 (9.03%), and X15 (8.93%) have greater barriers. In the early stage, the Southwest region had a small economic aggregate and poor infrastructure, which led to problems in the development of information technology, such as a large gap in the development of the Internet; the insufficient total volume of communication bodies; and small stock, low density, and poor connectivity of transportation infrastructure. These are some of the difficulties faced by urbanization. From the aspect of EE quality, EE status (11.10%) has the most prominent restricting effect, and the obstacle degree of X25 (4.71%) in EE level is the largest, showing that the shortage of green space resources and the irrational planning and utilization of land resources are still serious problems.
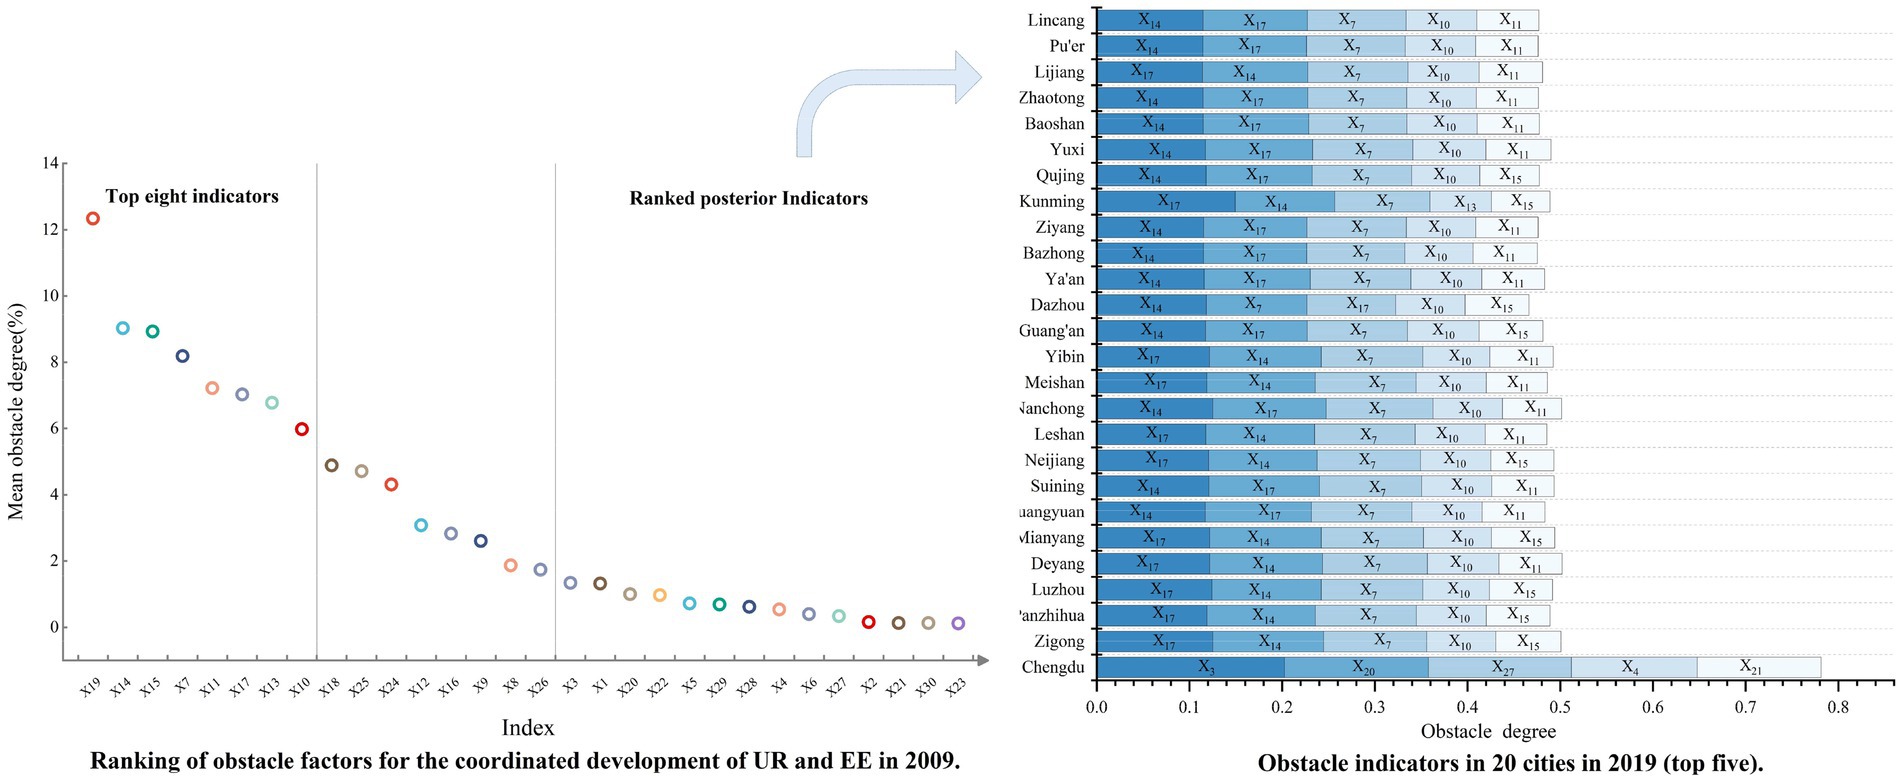
Figure 8. Obstacle factors for the CCD of UR and EE in 2009 and 2019.
3.4.2 CCD obstacle degree analysis in 2019
Compared with 2009, the overall characteristics showed little change (Table 5), and the average value is [0.06, 11.29%]. The top eight indexes with a high obstacle degree in 2019 are, respectively, X17 (11.29%), X14 (11.27%), X7 (10.44%), X10 (7.19%), X11 (6.32%), X15 (6.24%), X13 (5.89%), and X24 (4.93%). From the system layer, the order of obstacle degree was social UR (43.55%) > spatial UR (23.82%) > economic UR (15.90%) > EE status (10.88%) > demographic UR (4.20%) > EE pressure (1.03%) > EE response (0.62%), changed minorly from 2009. Social urbanization is still the most crucial element in curbing the increase in CCD. In the social UR level, X17 (11.29%) became the biggest limiting factor, indicating that there is still room for great progress in the continuous improvement of the public library facilities network system. From the aspect of EE quality, X24 (4.93%) instead of X25 (4.87%) became the biggest factor affecting the degree of obstacle, indicating that increasing urban green space is still an important construction direction. In terms of individual cities, with the exception of Chengdu, the major barriers in most cities are the same as the average. Chengdu has the largest obstacle degree at the demographic UR level, in which X3 (20.24%) is the biggest restricting factor, followed by the EE status level, in which industrial electricity consumption is the biggest restricting factor.

Table 5. System-level obstacles in the coordinated development of UR and EE in 2019.
4 Discussion
It is concluded from the CCD results that the CCD of 26 cities shows an obvious spatial imbalance. On the one hand, provincial capitals and other regional economic centers exhibit high CCD scores. They possess ample resources for resource aggregation, investment attraction, and industrial development. Furthermore, these centers allocate funds to address sustainability challenges, including pollution control and natural disaster management (56, 57). On the other hand, cities in economically underdeveloped and ecologically sensitive areas usually score low on CCD, and they generally lack capital, labor force, and innovation, which usually rely on backward industries with energy-extensive consumption and high emissions to keep the economy running, ignoring the oriented function of environmental management in industrial operation (58–60). The unilateral pursuit of interests often overlooks the imperative of EE protection, thereby impeding the symbiotic relationship between UR and EE (61, 62). Additionally, Luzhou and Kunming are both resource-based cities, and empirical findings indicate divergent trends in their CCD growth rates. Luzhou demonstrates a positive growth trajectory, whereas Kunming’s CCD shows a negative trend. This difference stems primarily from Kunming’s heavy reliance on environmental protection funds, coupled with inadequate investment in ecological technologies for ecological construction (63). There are many resource-based cities in Southwest China; however, intensive mining activities will lead to excessive consumption of resources in cities, resulting in soil erosion, land subsidence, biodiversity destruction, and groundwater pollution, and further widening the regional development gap (64). The conceptual framework for the CCD impact mechanism is shown in Figure 9.
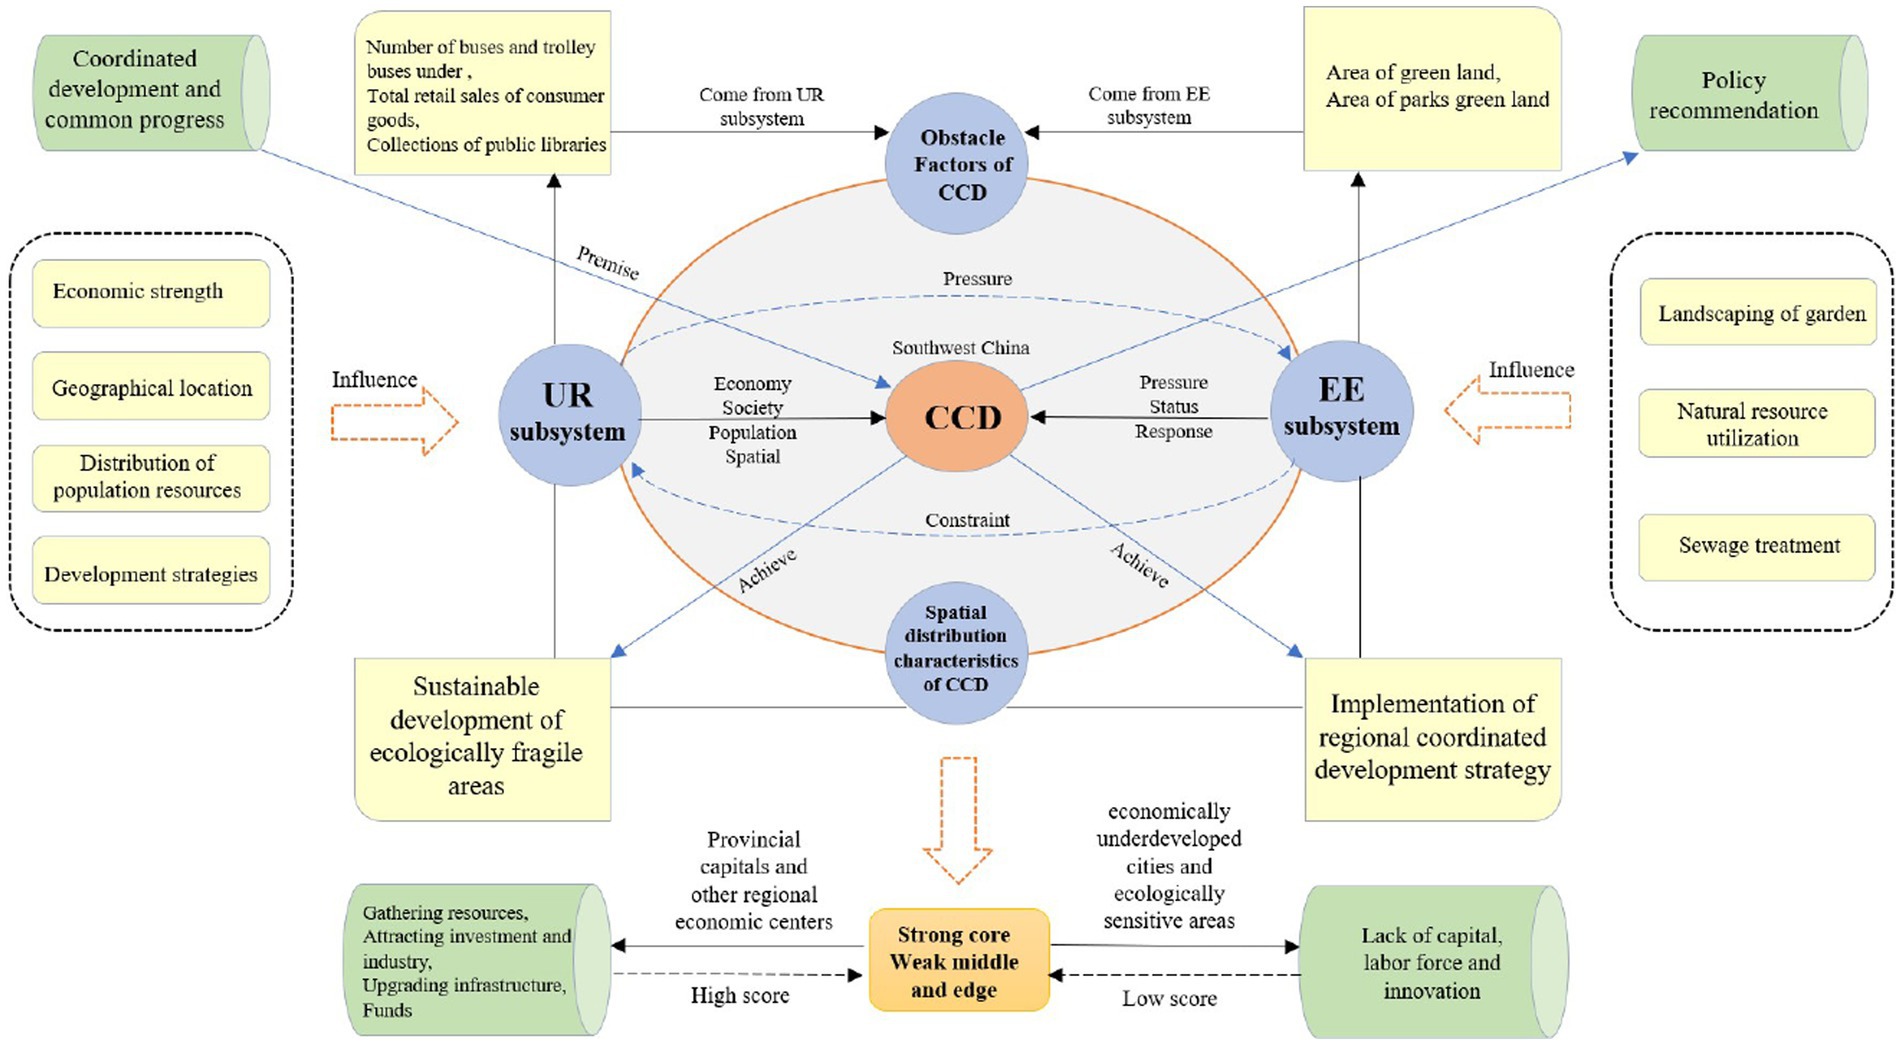
Figure 9. Conceptual framework for the CCD impact mechanism.
The result of this study is consistent with the findings of Cai et al. (65), Li et al. (66), and Feng and Li (67), where the CCD between UR and EE varies considerably across regions at different stages of economic development. However, there are some studies that draw different conclusions. For example, Wu et al. (44) investigated urban agglomerations in northeastern China, revealing a consistent spatial pattern in the CCD of UR and EE systems. This pattern contrasts significantly with the findings presented in our study. The disparity can be attributed to the distinct economic development trajectories and ecological challenges between Northeast China and Southwest China. Specifically, Northeast China grapples with high levels of pollutant emissions as its primary environmental concern, coupled with relatively sluggish economic growth and minimal regional disparities, resulting in a stable spatial pattern. As discussed earlier, the prioritization of the ecological environment should not come at the expense of urbanization progress. Therefore, the insights gleaned from our study offer valuable guidance for ecologically fragile regions, akin to Northeast China, characterized by slower urbanization rates. In such areas, our findings advocate for prioritizing development initiatives, with a focus on fostering low-energy-consuming high-tech industries to propel regional economic advancement.
From the results of the obstacle factors model, the transition characteristics from 2009 to 2019 are characterized by two barrier factors: EE response and EE pressure. In 2009, EE response (1.45%) > EEE pressure (1.21%). In 2019, EE pressure (1.03%) > EE response (0.62%). From the contribution, both EE response and EE pressure are decreasing their hindering effect on CCD. However, the progress of EE response is in excess of EE pressure. It indicates that from 2009 to 2019, the government has taken vigorous measures to protect the environment, but more efforts need to be invested to truly alleviate environmental problems. In terms of specific indicators, the obstacle factor with the most significant contribution in 2009 is X19 (12.34%), and the most significant obstacle factor in 2019 is X17 (11.29%). The result reflects the progress of UR in China. In 2009, internet service users were still the most significant obstacle factor, and by 2019, its hindering effect on the CCD had been minimal. The 2009–2019 is the era of high-speed development of the internet and technology-driven, and the innovation has changed people’s lifestyles and facilitated the process of UR.
According to the obstacle factor analysis results in 2019, there are several obstacles that affect the CCD of UR and EE in Southwest China. In terms of UR quality, social UR has the greatest effect on CCD; among them, grassroots cultural services and travel convenience significantly have the strongest restraining effect on urban construction. The Southwest region has a remote geographical location, slow economic development, a relatively weak ability to absorb advanced technology and introduce advanced cultural systems and concepts, and public infrastructure, including cultural services and travel services, is still insufficient (68, 69). In addition, for the spatial UR subsystem layer, the obstacle degree of built-up area is the largest, mainly because the population explosion and the lack of living space seriously threaten the ecological quality of Southwest China (70). Due to topographic restrictions, most cities in Southwest China have limited space for construction. This persistent urban land structure deformity, coupled with the encroachment upon agricultural and ecological land, results in various ecological challenges such as inefficient land resource utilization, environmental pollution, and imbalanced urban–rural development (71, 72). Therefore, urban planning strategies in southwestern China must give due consideration to topographical constraints and transportation accessibility. In the policy system of UR, the social and cultural needs of the people should be met in addition to the pursuit of economic growth.
Economic urbanization is one of the main systems that hinder the development of CCD, among which the consumption level is the most restrictive degree by ensuring and building up people’s wellbeing. China’s Southwest cities are abundant in species and energy reserves and play a considerable role in ecological security, but they have fragile ecological environments, complex ecosystems, low productivity, and relatively backward socio-economic conditions, which leads to lagging economic development, insufficient consumer spending power, and affecting harmonious development with EE (73, 74). As the most widely distributed geomorphic region in China, the Southwest region has the characteristics of high sensitivity, low stability, and ecological vulnerability, which leads to serious land use problems, including soil erosion and rocky desertification in recent years, and has a serious inhibition effect on the promotion of greening in Southwest China (75, 76).
In terms of EE quality, EE status exerts the most significant influence on CCD. Among these factors, the reduction of green land poses the greatest hindrance to CCD enhancement. This finding aligns with the research conducted by Fu et al. (77). Vegetation coverage serves as a critical indicator for assessing EE. It not only regulates the dynamic balance of carbon budgets and mitigates the upward trend of greenhouse gases but also sustains biodiversity, serving as a vital component for achieving ecosystem resilience (78, 79). Furthermore, vegetation coverage plays a pivotal role in enhancing urban ecological environments, meeting recreational needs, shaping urban landscapes, beautifying surroundings, and mitigating disasters (80). Neglecting green space construction undermines ecological security, thereby disrupting the close relationship between UR and EE in Southwest China (81). Therefore, it is crucial for Southwest China to prioritize the preservation of adequate green space within its urban planning strategies. As part of the policy framework for ecological civilization construction, it is imperative to establish minimum requirements for key indicators such as vegetation coverage and park green space area.
5 Conclusion and policy implications
5.1 Conclusion
(1) From 2009 to 2019, the UR score of Southwest China showed an increasing trend, and the EE index showed a fluctuating downward trend. However, there were still obvious spatial and temporal differences. Due to the gap in economic strength, Chengdu and Kunming scored significantly higher than the other 24 cities, and it showed the spatial characteristics of Chengdu as the high-value center, followed by Kunming, while the average score of other cities hovered just approximately 0.1. Only six cities showed a trend of positive growth in EE quality.
(2) The urbanization level and EE quality of Southwest China show a relatively good coupling coordination relationship. The CCD level of most cities maintains a rapid upward trend, and the imbalance-type cities are significantly reduced and gradually improved. The spatial distribution still presents visible non-equilibrium traits between cities. Most cities have low CCD levels, showing a spatial distribution pattern with prominent characteristics of “strong core, weak middle, and edge.” In space, it gradually forms a development pattern with Chengdu as the core and Kunming as the small core area. The type of CCD is still mainly in the coordination stage.
(3) Obstacle analysis. In terms of the UR subsystem, the obstacle factors that affect CCD in Southwest China are mainly the number of buses and trolley buses under operation at year-end, the total retail sales of consumer goods, and collections of public libraries. In terms of the EE subsystem, the obstacle factors restricting the development of CCD are mainly areas of green land and areas of park green land, and this influencing factor shows a greater degree of inhibition than other factors.
5.2 Policy implications
(1) Tailor regional development strategies to local contexts. Our investigation reveals an imbalance in coupling coordination across cities in the Southwest region, with disparities between developed and less developed cities. To address this imbalance, cities in Southwest China should leverage their existing resource strengths and implement targeted measures to mitigate regional development gaps. For instance, Chengdu and Kunming can serve as focal points for regional development, acting as hubs to stimulate economic growth in surrounding non-provincial capital cities. This can be achieved by fostering the development of upstream and downstream industrial chains and establishing cross-regional cooperative organizations with robust feedback mechanisms. Additionally, efforts should be made to de-emphasize administrative divisions, encouraging deeper collaboration and innovation between cities.
(2) Adhering to the principle of people-centeredness and promoting the healthy and systematic development of UR. Our analysis identifies that grassroots cultural services and travel convenience significantly have the strongest restraining effect on urban construction. In response, the Southwest region should prioritize comprehensive coverage of social public services, local cultural amenities, and innovative urban and rural management practices. This includes enhancing transportation infrastructure, promoting the use of metro or light rail systems, and improving pedestrian and lane construction. Additionally, efforts should be made to elevate the cultural quality of the population by expanding access to public amenities such as libraries, museums, and cultural exhibition halls, ultimately aiming to benefit the populace. Simultaneously, it is essential not to constrain the urbanization process in the name of environmental protection. Encouraging rural-to-urban migration and steadily advancing reforms in urban settlement and household registration systems are crucial steps to foster sustainable urbanization.
(3) Enhance EE protection and restoration efforts. Our findings underscore the significance of preserving green spaces as the foremost factor impeding CCD. In response, cities in the Southwest region should prioritize urban green space planning and development. This includes expanding green spaces within communities, city parks, and other areas, as well as increasing the construction of wetlands, lakes, greenways, and ecological corridors. Moreover, strict adherence to arable land protection regulations is essential. Furthermore, initiatives should target key high-energy-consuming industries to promote the upgrade of pollution control equipment for smog, sulfur dioxide, and nitrogen oxide. Additionally, comprehensive measures should be taken to enhance the quality of the water environment. Emphasis should be placed on supporting the adoption of clean energy and renewable resources while fostering the cultivation and recruitment of personnel skilled in pollution control technology. Finally, the development of low-carbon, environmental, and green tourism sectors should be actively encouraged.
There are still a few limitations to this study that need further improvement and exploration. On the one hand, due to the workload of data collection in the construction of the index system, the selection of the number of indicators is relatively simple and insufficient, and some areas that are difficult to collect data are removed. In future research, it can be further enriched and supplemented to make the index system more representative and urban samples in the region more comprehensive. On the other hand, considering the importance of relevant indicators and in order to make the sample data as continuous as possible and avoid the sample size limitation, the missing values of part of the original data are supplemented, which may lead to a slight deviation between the data and the real value. Future data processing should reduce the probability of such cases. In further relevant research, the spatial scale can be expanded, and the research unit can be reduced from the municipal level to the district and county level, aiming to make the assessment more comprehensive and accurate. In addition, the new poverty phenomenon in the urbanization of ecologically fragile areas, the ecological poverty governance path, and the optimization of human–land coordination mode are important topics that need to be paid attention to. It will provide useful impetus to the exploration and study of the mechanisms of UR and EE and also to achieve the United Nations Sustainable Development Goals.
Data availability statement
The data analyzed in this study is subject to the following licenses/restrictions: data is obtained from the corresponding author upon reasonable request. Requests to access these datasets should be directed to LL: MTAwMDEwOTdAbmp0Yy5lZHUuY24=.
Author contributions
LL: Conceptualization, Funding acquisition, Investigation, Resources, Software, Writing – original draft, Writing – review & editing. YG: Formal analysis, Supervision, Validation, Visualization, Writing – original draft, Writing – review & editing. YL: Data curation, Formal analysis, Visualization, Writing – original draft. LZ: Writing – original draft, Writing – review & editing.
Funding
The author(s) declare that financial support was received for the research, authorship, and/or publication of this article. This study was supported by the Natural Science Foundation of Sichuan Province, grant number 24NSFSC4419; the Sichuan Philosophy and Social Science Foundation project, grant number SCJJ23ND426; the Chengdu Soft Science Research Project, grant number 2023-RK00-00214-ZF; the Tuojiang River Basin High-quality Development Research Center, grant number TJGZL2023-06; and the Research Centre for Sci-tech Innovation and New Economy of the Chengdu-Chongqing Economic Circle, grant number CYCX2022YB018.
Conflict of interest
The authors declare that the research was conducted in the absence of any commercial or financial relationships that could be construed as a potential conflict of interest.
Publisher’s note
All claims expressed in this article are solely those of the authors and do not necessarily represent those of their affiliated organizations, or those of the publisher, the editors and the reviewers. Any product that may be evaluated in this article, or claim that may be made by its manufacturer, is not guaranteed or endorsed by the publisher.
References
1. Xing, L, Xue, MG, and Hu, MS. Dynamic simulation and assessment of the coupling coordination degree of the economy-resource-environment system: case of Wuhan City in China. J Environ Manag. (2019) 230:474–87. doi: 10.1016/j.jenvman.2018.09.065
2. Guan, XL, Wei, HK, Lu, SS, Dai, Q, and Su, HJ. Assessment on the urbanization strategy in China: achievements, challenges and reflections. Habitat Int. (2018) 71:97–109. doi: 10.1016/j.habitatint.2017.11.009
3. Majumder, S, Roy, S, Bose, A, and Chowdhury, IR. Multiscale GIS based-model to assess urban social vulnerability and associated risk: evidence from 146 urban centers of eastern India. Sustain Cities Soc. (2023) 96:104692. doi: 10.1016/j.scs.2023.104692
4. Roy, S, Basak, D, Bose, A, and Chowdhury, IR. Citizens’ perception towards landfill exposure and its associated health effects: A PLS-SEM based modeling approach. Environ Monit Assess. (2023) 195:134. doi: 10.1007/s10661-022-10722-4
5. Roy, S, Majumder, S, Bose, A, and Chowdhury, IR. Hilly terrain and housing wellness: geo-visualizing spatial dynamics of urban household quality in the Himalayan town of Darjeeling, India. Singap J Trop Geogr. (2024). doi: 10.1111/sjtg.12533
6. Liu, L, Lei, Y, Fath, BD, Hubacek, K, Yao, H, and Liu, W. The spatio-temporal dynamics of urban resilience in China's capital cities. J Clean Prod. (2022) 379:134400. doi: 10.1016/j.jclepro.2022.134400
7. Chen, J . Rapid urbanization in China: A real challenge to soil protection and food security. Catena. (2007) 69:1–15. doi: 10.1016/j.catena.2006.04.019
8. Roy, S, Bose, A, Singha, N, Basak, D, and Chowdhury, IR. Urban waterlogging risk as an undervalued environmental challenge: An integrated MCDA-GIS based modeling approach. Environ Chall. (2021) 4:100194. doi: 10.1016/j.envc.2021.100194
9. Gai, M, Wang, XQ, and Qi, CL. Spatiotemporal evolution and influencing factors of ecological civilization construction in China. Complexity. (2020) 2020:1–14. doi: 10.1155/2020/8829144
10. Xiao, Y, Wang, R, Wang, F, Huang, H, and Wang, J. Investigation on spatial and temporal variation of coupling coordination between socioeconomic and ecological environment: A case study of the loess plateau, China. Ecol Indicat. (2022) 136:108667. doi: 10.1016/j.ecolind.2022.108667
11. Hall, P, Hardy, D, Howard, E, and Ward, C. To-morrow: A peaceful path to real reform. London: Routledge (2006).
12. Shi, YJ, Zhu, Q, Xu, LH, Lu, ZW, Wu, YQ, Wang, XB, et al. Independent or influential? Spatial-temporal features of coordination level between urbanization quality and urbanization scale in China and its driving mechanism. Int J Environ Res Public Health. (2020) 17:1587. doi: 10.3390/ijerph17051587
13. Moomaw, RL, and Shatter, AM. Urbanization and economic development: a bias toward large cities? J Urban Econ. (1996) 40:13–37. doi: 10.1006/juec.1996.0021
14. Michaels, G, Rauch, F, and Redding, SJ. Urbanization and structural transformation. Q J Econ. (2012) 127:535–86. doi: 10.1093/qje/qjs003
15. Cai, YY, Selod, H, and Steinbuks, J. Urbanization and land property rights. Reg Sci Urban Econ. (2018) 70:246–57. doi: 10.1016/j.regsciurbeco.2018.04.007
16. Meijers, EJ, Burger, MJ, and Hoogerbrugge, MM. Borrowing size in networks of cities: City size, network connectivity and metropolitan functions in Europe. Pap Reg Sci. (2016) 95:181–99. doi: 10.1111/pirs.12181
17. Zhu, DY, Chen, T, Wang, ZW, and Niu, RQ. Detecting ecological spatial-temporal changes by remote sensing ecological index with local adaptability. J Environ Manag. (2021) 299:113655. doi: 10.1016/j.jenvman.2021.113655
18. Roy, S, Bose, A, Basak, D, and Chowdhury, IR. Towards sustainable society: The sustainable livelihood security (SLS) approach for prioritizing development and understanding sustainability: An insight from West Bengal, India. Environ Dev Sustain. (2023):1–32. doi: 10.1007/s10668-023-03456-x
19. Cumming, GS, Buerkert, A, Hoffmann, EM, Schlecht, E, von Cramon-Taubadel, S, and Tscharntke, T. Implications of agricultural transitions and urbanization for ecosystem services. Nature. (2014) 515:50–7. doi: 10.1038/nature13945
20. Eigenbrod, F, Bell, VA, Davies, HN, Heinemeyer, A, Armsworth, PR, and Gaston, KJ. The impact of projected increases in urbanization on ecosystem services. Proc R Soc B Biol Sci. (2011) 278:3201–8. doi: 10.1098/rspb.2010.2754
21. He, FH, Gu, LJ, Wang, T, and Zhang, ZH. The synthetic geo-ecological environmental evaluation of a coastal coal-mining city using spatiotemporal big data: A case study in Longkou, China. J Clean Prod. (2017) 142:854–66. doi: 10.1016/j.jclepro.2016.07.011
22. Xiao, Y, Zhong, JL, Zhang, QF, Xiang, X, and Huang, H. Exploring the coupling coordination and key factors between urbanization and land use efficiency in ecologically sensitive areas: A case study of the loess plateau, China. Sustain Cities Soc. (2022) 86:104148. doi: 10.1016/j.scs.2022.104148
23. Grossman, GM, and Krueger, AB. Economic growth and the environment. Q J Econ. (1995) 110:353–77. doi: 10.2307/2118443
24. Newman, PW . Sustainability and cities: extending the metabolism model. Landsc Urban Plan. (1999) 44:219–26. doi: 10.1016/S0169-2046(99)00009-2
25. Register, R . Ecocity Berkeley: Building cities for a healthy future. Berkeley, CA: North Atlantic Books (1987).
26. Sun, Y, and Cui, Y. Evaluating the coordinated development of economic, social and environmental benefits of urban public transportation infrastructure: case study of four Chinese autonomous municipalities. Transp Policy. (2018) 66:116–26. doi: 10.1016/j.tranpol.2018.02.006
27. Martellozzo, F, Amato, F, Murgante, B, and Clarke, KC. Modelling the impact of urban growth on agriculture and natural land in Italy to 2030. Appl Geogr. (2018) 91:156–67. doi: 10.1016/j.apgeog.2017.12.004
28. Singh, P, Kikon, N, and Verma, P. Impact of land use change and urbanization on urban heat island in Lucknow city, Central India. A remote sensing based estimate. Sustain Cities Soc. (2017) 32:100–14. doi: 10.1016/j.scs.2017.02.018
29. Rapport, DJ, and Singh, A. An ecohealth-based framework for state of environment reporting. Ecol Indic. (2006) 6:409–28. doi: 10.1016/j.ecolind.2005.05.003
30. Qi, YY, Farnoosh, A, Lin, L, and Liu, H. Coupling coordination analysis of China's provincial water-energy-food nexus. Environ Sci Pollut Res. (2022) 29:23303–13. doi: 10.1007/s11356-021-17036-x
31. An, L, Zvoleff, A, Liu, JG, and Axinn, W. Agent-based modeling in coupled human and natural systems (CHANS): lessons from a comparative analysis. Ann Assoc Am Geogr. (2014) 104:723–45. doi: 10.1080/00045608.2014.910085
32. Sunde, MG, He, HS, Hubbart, JA, and Urban, MA. An integrated modeling approach for estimating hydrologic responses to future urbanization and climate changes in a mixed-use midwestern watershed. J Environ Manag. (2018) 220:149–62. doi: 10.1016/j.jenvman.2018.05.025
33. Zhang, R, and Jiao, H. Coupling and coordination between urbanization and ecological environment in China. J Arid Land Resour Environ. (2015) 29:12–7.
34. Zeng, P, Wei, X, and Duan, Z. Coupling and coordination analysis in urban agglomerations of China: urbanization and ecological security perspectives. J Clean Prod. (2022) 365:132730. doi: 10.1016/j.jclepro.2022.132730
35. Chen, J . Research for the coupling relationship between ecological environment and urbanization in Fujian Province based on spectral analysis. Res Soil Water Conserv. (2010) 17:163–8.
36. Xing, L, and Fang, B. Spatial-temporal pattern and coordinated development of urbanization and ecological environment in Jiangsu Province. Journal of Nanjing Normal University. Nat Sci. (2018) 41:131–7.
37. Zhou, X. and Zibibula·Simayi (2012). Dynamic analysis on urbanization and ecological environment of the Turpan City. Res Soil Water Conserv 19: 159–163.
38. Yu, B . Ecological effects of new-type urbanization in China. Renew Sust Energ Rev. (2021) 135:110239. doi: 10.1016/j.rser.2020.110239
39. Luo, Q, Zhou, J, Zhang, Y, Yu, B, and Zhu, Z. What is the spatiotemporal relationship between urbanization and ecosystem services? A case from 110 cities in the Yangtze River Economic Belt, China. J Environ Manag. (2022) 321:115709. doi: 10.1016/j.jenvman.2022.115709
40. Liu, Y, Xiao, HW, Lv, YK, and Zhang, N. The effect of new-type urbanization on energy consumption in China: a spatial econometric analysis. J Clean Prod. (2017) 163:S299–305. doi: 10.1016/j.jclepro.2015.10.044
41. Zhang, JF, Sun, J, Ma, BB, and Du, WP. Assessing the ecological vulnerability of the upper reaches of the Minjiang River. PLoS One. (2017) 12:825. doi: 10.1371/journal.pone.0181825
42. Guo, F, Jiang, G, Yuan, D, and Polk, JS. Evolution of major environmental geological problems in karst areas of southwestern China. Environ Earth Sci. (2013) 69:2427–35. doi: 10.1007/s12665-012-2070-8
43. Hartmann, A, Goldscheider, N, Wagener, T, Lange, J, and Weiler, M. Karst water resources in a changing world: review of hydrological modeling approaches. Rev Geophys. (2014) 52:218–42. doi: 10.1002/2013RG000443
44. Wu, Y, Zong, T, Shuai, CY, Liao, SJ, Jiao, LD, and Shen, LY. Does resource environment carrying capacity have a coercive effect on urbanization quality? Evidence from the Yangtze River Economic Belt, China. J Clean Prod. (2022) 365:132612. doi: 10.1016/j.jclepro.2022.132612
45. Ali, R, Bakhsh, K, and Yasin, MA. Impact of urbanization on CO2 emissions in emerging economy: evidence from Pakistan. Sustain Cities Soc. (2019) 48:101553. doi: 10.1016/j.scs.2019.101553
46. Ahmed, Z, Asghar, MM, Malik, MN, and Nawaz, K. Moving towards a sustainable environment: the dynamic linkage between natural resources, human capital, urbanization, economic growth, and ecological footprint in China. Resources Policy. (2020) 67:101677. doi: 10.1016/j.resourpol.2020.101677
47. Rashid, H, Manzoor, MM, and Mukhtar, S. Urbanization and its effects on water resources: An exploratory analysis. Asian J Water Environ Pollut. (2018) 15:67–74. doi: 10.3233/AJW-180007
48. Leveau, LM, and Isla, FI. Predicting bird species presence in urban areas with NDVI: An assessment within and between cities. Urban For Urban Green. (2021) 63:127199. doi: 10.1016/j.ufug.2021.127199
49. Qureshi, S, Alavipanah, SK, Konyushkova, M, Mijani, N, Fathololomi, S, Firozjaei, MK, et al. A remotely sensed assessment of surface ecological change over the Gomishan wetland, Iran. Remote Sensing. (2020) 12:989. doi: 10.3390/rs12182989
50. He, J, Wang, S, Liu, Y, Ma, H, and Liu, Q. Examining the relationship between urbanization and the eco-environment using a coupling analysis: case study of Shanghai, China. Ecol Indic. (2017) 77:185–93. doi: 10.1016/j.ecolind.2017.01.017
51. Roy, S, Bose, A, Majumder, S, Roy Chowdhury, I, Abdo, HG, Almohamad, H, et al. Evaluating urban environment quality (UEQ) for class-I Indian city: an integrated RS-GIS based exploratory spatial analysis. Geocarto Int. (2022) 2153932. doi: 10.1080/10106049.2022.2153932
52. Gu, CL . Urbanization: processes and driving forces. Sci China Earth Sci. (2019) 62:1351–60. doi: 10.1007/s11430-018-9359-y
53. Roy, S, Majumder, S, Bose, A, and Chowdhury, IR. GWPCA-based spatial analysis of urban vitality: a comparative assessment of three high-altitude Himalayan towns in India. J Spat Sci. (2023):1–28. doi: 10.1080/14498596.2023.2267011
54. Li, M, Sun, H, Singh, VP, Zhou, Y, and Ma, M. Agricultural water resources management using maximum entropy and entropy-weight-based TOPSIS methods. Entropy. (2019) 21:364. doi: 10.3390/e21040364
55. Chen, Y, Zhu, MK, Lu, JL, Zhou, Q, and Ma, WB. Evaluation of ecological city and analysis of obstacle factors under the background of high-quality development: taking cities in the Yellow River Basin as examples. Ecol Indic. (2020) 118:106771. doi: 10.1016/j.ecolind.2020.106771
56. Bose, A, Basak, D, Roy, S, Chowdhury, IR, Abdo, HG, Aldagheiri, M, et al. Evaluation of urban sustainability through perceived importance, performance, satisfaction and loyalty: An integrated IPA–SEM-based modelling approach. Sustain For. (2023) 15:9788. doi: 10.3390/su15129788
57. Chen, J, Zhao, D, He, B, and Stanojevic, S. How do fiscally created one-city monopolies cause intra-provincial inequality in China? Land Use Policy. (2022) 120:106228. doi: 10.1016/j.landusepol.2022.106228
58. Cheng, RH, and Li, W. Evaluating environmental sustainability of an urban industrial plan under the three-line environmental governance policy in China. J Environ Manag. (2019) 251:109545. doi: 10.1016/j.jenvman.2019.109545
59. Liu, J, Hou, X, Wang, Z, and Shen, Y. Study the effect of industrial structure optimization on urban land-use efficiency in China. Land Use Policy. (2021) 105:105390. doi: 10.1016/j.landusepol.2021.105390
60. Tang, Q, Wang, J, and Jing, Z. Tempo-spatial changes of ecological vulnerability in resource-based urban based on genetic projection pursuit model. Ecol Indic. (2021) 121:107059. doi: 10.1016/j.ecolind.2020.107059
61. Roy, S, Majumder, S, Bose, A, and Roy Chowdhury, I. Does geographical heterogeneity influence Urban quality of life? A case of a densely populated Indian City. Pap Appl Geogr. (2023) 9:395–424. doi: 10.1080/23754931.2023.2225541
62. Zeng, LJ, Wang, JF, Zhang, JS, Sun, ZM, and Gonzalez, E. A path matching model on new urbanization in mineral resource abundant regions. Resour Policy. (2021) 73:102214. doi: 10.1016/j.resourpol.2021.102214
63. Xia, C, and Li, Y. Evaluation of ecological construction in Kunming using the DPSIR model. Evaluation. (2018) 9:1338. doi: 10.14716/ijtech.v9i7.2489
64. Liang, L, Chen, M, Luo, X, and Xian, Y. Changes pattern in the population and economic gravity centers since the reform and opening up in China: the widening gaps between the south and north. J Clean Prod. (2021) 310:127379. doi: 10.1016/j.jclepro.2021.127379
65. Cai, J, Li, X, Liu, L, Chen, Y, Wang, X, and Lu, S. Coupling and coordinated development of new urbanization and agro-ecological environment in China. Sci Total Environ. (2021) 776:145837. doi: 10.1016/j.scitotenv.2021.145837
66. Li, J, Lei, J, Li, S, Yang, Z, Tong, Y, Zhang, S, et al. Spatiotemporal analysis of the relationship between urbanization and the eco-environment in the Kashgar metropolitan area, China. Ecol Indicat. (2022) 135:108524. doi: 10.1016/j.ecolind.2021.108524
67. Feng, Y, and Li, G. Interaction between urbanization and eco-environment in the Tibetan plateau. J Geogr Sci. (2021) 31:298–324. doi: 10.1007/s11442-021-1838-8
68. Bian, J, Ren, H, and Liu, P. Evaluation of urban ecological well-being performance in China: A case study of 30 provincial capital cities. J Clean Prod. (2020) 254:120109. doi: 10.1016/j.jclepro.2020.120109
69. Fang, CL, Ma, HT, and Wang, J. A regional categorization for "new-type urbanization" in China. PLoS One. (2015) 10:e0134253. doi: 10.1371/journal.pone.0134253
70. Yang, S, Li, C, Lou, H, Luo, Y, Wang, P, Zhang, J, et al. The impact of Urban expansion on plant diversity change in karst regions of Southwest China. Chin Geogr Sci. (2022) 32:493–505. doi: 10.1007/s11769-022-1279-z
71. Liu, ZF, Ding, MH, He, CY, Li, JW, and Wu, JG. The impairment of environmental sustainability due to rapid urbanization in the dryland region of northern China. Landsc Urban Plan. (2019) 187:165–80. doi: 10.1016/j.landurbplan.2018.10.020
72. Roy, S, Majumder, S, Bose, A, and Chowdhury, IR. Spatial heterogeneity in the urban household living conditions: A-GIS-based spatial analysis. Ann GIS. (2024) 30:81–104. doi: 10.1080/19475683.2024.2304194
73. Sun, M, Yang, R, Li, X, Zhang, L, and Liu, Q. Designing a path for the sustainable development of key ecological function zones: A case study of Southwest China. Global Ecol Conserv. (2021) 31:e01840. doi: 10.1016/j.gecco.2021.e01840
74. Yu, X . Coal mining and environmental development in Southwest China. Environ Dev. (2017) 21:77–86. doi: 10.1016/j.envdev.2016.12.001
75. Li, WJ, Wang, Y, Xie, SY, and Cheng, X. Spatiotemporal evolution scenarios and the coupling analysis of ecosystem health with land use change in Southwest China. Ecol Eng. (2022) 179:106607. doi: 10.1016/j.ecoleng.2022.106607
76. Shi, KF, Yang, QY, Li, YQ, and Sun, XF. Mapping and evaluating cultivated land fallow in Southwest China using multisource data. Sci Total Environ. (2019) 654:987–99. doi: 10.1016/j.scitotenv.2018.11.172
77. Fu, S, Zhuo, H, Song, H, Wang, J, and Ren, L. Examination of a coupling coordination relationship between urbanization and the eco-environment: a case study in Qingdao, China. Environ Sci Pollut Res. (2020) 27:23981–93. doi: 10.1007/s11356-020-08683-7
78. Fu, BJ, Wang, S, Liu, Y, Liu, JB, Liang, W, and Miao, CY. Hydrogeomorphic ecosystem responses to natural and anthropogenic changes in the loess plateau of China. Annu Rev Earth Planet Sci. (2017) 45:223–43. doi: 10.1146/annurev-earth-063016-020552
79. Yuan, J, Xu, YP, Xiang, J, Wu, L, and Wang, DQ. Spatiotemporal variation of vegetation coverage and its associated influence factor analysis in the Yangtze River Delta, eastern China. Environ Sci Pollut Res. (2019) 26:32866–79. doi: 10.1007/s11356-019-06378-2
80. He, S, Luo, D, and Guo, K. Analysis of factors affecting the coordinated development of urbanization and the ecological resource environment in Southwest China based on data mining. J Urban Plan Dev. (2021) 147:04021034. doi: 10.1061/(ASCE)UP.1943-5444.0000730
Keywords: urbanization, ecological environment, coupling coordination degree, obstacle factors model, Southwest China
Citation: Liu L, Guo Y, Li Y and Zhang L (2024) Examining the complex relationship between Urbanization and ecological environment in ecologically fragile areas: a case study in Southwest China. Front. Public Health. 12:1358051. doi: 10.3389/fpubh.2024.1358051
Edited by:
Mohiuddin Md. Taimur Khan, Washington State University Tri-Cities, United StatesReviewed by:
Indrajit Chowdhury, University of North Bengal, IndiaXufeng Cui, Zhongnan University of Economics and Law, China
Copyright © 2024 Liu, Guo, Li and Zhang. This is an open-access article distributed under the terms of the Creative Commons Attribution License (CC BY). The use, distribution or reproduction in other forums is permitted, provided the original author(s) and the copyright owner(s) are credited and that the original publication in this journal is cited, in accordance with accepted academic practice. No use, distribution or reproduction is permitted which does not comply with these terms.
*Correspondence: Lanyue Zhang, emhhbmdsYW55dWVAc2N1amouZWR1LmNu