 Joost de Winter
 Tom Driessen1†
 Dimitra Dodou
- 1Faculty of Mechanical Engineering, Delft University of Technology, Delft, Netherlands
- 2Transporteffect BV & Chauffeursnieuws, Nijmegen, Netherlands
Introduction: Despite their important role in the economy, truck drivers face several challenges, including adapting to advancing technology. The current study investigated the occupational experiences of Dutch truck drivers to detect common patterns.
Methods: A questionnaire was distributed to professional drivers in order to collect data on public image, traffic safety, work pressure, transport crime, driver shortage, and sector improvements.
Results: The findings based on 3,708 respondents revealed a general dissatisfaction with the image of the industry and reluctance to recommend the profession. A factor analysis of the questionnaire items identified two primary factors: ‘Work Pressure’, more common among national drivers, and ‘Safety & Security Concerns’, more common among international drivers. A ChatGPT-assisted analysis of textbox comments indicated that vehicle technology received mixed feedback, with praise for safety and fuel-efficiency improvements, but concerns about reliability and intrusiveness.
Discussion: In conclusion, Dutch professional truck drivers indicate a need for industry improvements. While the work pressure for truck drivers in general may not be high relative to certain other occupational groups, truck drivers appear to face a deficit of support and respect.
1 Introduction
Given the Netherlands’ strategic position as a gateway to Europe and its port infrastructure, the truck driving profession plays a key role in the economic success of the country. As of 2021, approximately 91,000 professional truck drivers were registered in the Netherlands (1).
Truck drivers face various challenges that can affect their well-being, such as long working hours and extended periods away from home, which may adversely impact mental health and familial relationships (2–7). Additionally, the sedentary nature of the truck driving profession involves health risks such as obesity (8–10). Another challenge faced is the pressure to meet tight delivery schedules, which can result in fatigue and compromised road safety (2, 11–13). A study among truck drivers by Wijngaards et al. (14) showed that the driving itself, as well as the rest breaks and administrative tasks, are associated with greater momentary happiness compared to logistical work and the delivery/pickup of goods.
Truck drivers also grapple with adapting to the evolving technological landscape, including the adoption of advanced driver assistance systems (ADAS), such as adaptive cruise control (ACC) and lane keeping assistance (LKA) systems, as well as digital tools that aim to improve safety and efficiency (15). While new technologies offer potential benefits, they can also generate resistance (16), cause apprehension about job displacement (17), and require truck drivers to acquire new skills (18–20). Semeijn et al. (21), for example, reported that the digital tachograph is a source of stress.
Various studies have been undertaken on the topic of ADAS, typically using driving simulators and focusing on passenger vehicles (22–24). Current literature suggests a preference among truck drivers for a silent cabin environment (25, 26). Certain systems, such as autonomous emergency braking (AEB) and warning systems, are likely beneficial from a safety perspective (27, 28). However, these systems exhibit a propensity for false interventions/alarms, rendering them as annoying or intrusive (29–32). Camera systems and ADAS that reduce blind spots, on the other hand, have been met with approval by truck drivers (33). Still, which ADAS are perceived by truck drivers as useful and which as less useful has not yet been well documented in the literature.
1.1 Research aim
Although certain pain points in the trucking industry have been documented [e.g., tight schedules, stress, and fatigue (34–37)], there is still limited knowledge about how truck drivers experience their daily work. This is particularly relevant in recent years, as factors such as driver shortages (38) and the introduction of new technologies are playing increasingly large roles.
The aim of this study is to document the experiences of Dutch truck drivers. A large-scale questionnaire was conducted by Transporteffect BV (which is engaged in advisory services and mediation within the transportation sector) and foundation Chauffeursnieuws (a website focused on the transport industry). Although the results of the questionnaire have been published in raw form on the organization’s website (39), they have not yet been subjected to scientific evaluation. This paper analyzes the results of this questionnaire, which includes responses from over 3,700 drivers, through a multivariate statistical approach and through a ChatGPT-aided text summarization approach. This analysis allowed for making informed statements about the experiences of drivers and to determine whether there are relevant patterns in their experiences, which may potentially correlate with individual differences such as gender, age, and type of work (national vs. international). By better understanding truck driver experiences, policymakers and industry stakeholders could make more informed decisions to improve the working conditions and job satisfaction of truck drivers.
2 Methods
2.1 Questionnaire design
The questionnaire header indicated that Chauffeursnieuws & Transporteffect aimed to address the long-neglected concerns of professional drivers and promote their welfare. It stated that by providing a platform for drivers to voice their opinions, the organizations were committed to creating a positive impact on the transportation sector.
The questionnaire was administered in Dutch and consisted of 68 questions divided into 9 parts. It included 51 multiple-choice questions, 1 checkbox question, and 15 open comment boxes that provided the option to the respondent to elaborate on the preceding multiple-choice questions.
Part 1: Introduction (Q2–Q6) gathered general information about the respondents. Example questions included: “Your gender?” (Q2) with response options Male and Female, and “Are you a professional driver?” (Q3) with response options Yes and No.
Part 2: Organizations (Q7–Q12) focused on the respondents’ involvement and opinions on trade unions and other organizations. For example, “Are you a member of a trade union?” (Q7) with response options Yes and No, and “CNV – What grade would you give?” (Q9), with response options 1 (Very bad) to 5 (Very good), and No opinion.
Part 3: Image (Q13–Q17) dealt with the public image of drivers and related topics. Example questions were: “Do you think the image of the driver needs to be improved?” (Q13) and “Do you think a mobile toilet (DIXI) at companies is a good solution for drivers?” (Q14), both with response options No, Yes, and Neutral.
Part 4: Traffic safety (Q18–Q30) explored the respondents’ views on various traffic safety issues. Example questions included: “Do you think a stand-alone air conditioner contributes to road safety in Europe?” (Q18) with response options Yes, No, and No opinion, and “Do you find text signs with information adequate for international traffic?” (Q21) with response options No – creates dangerous situations, No, Yes, and No opinion.
Part 5: Work pressure (Q31–Q39) investigated the respondents’ experiences and opinions about work pressure. Example questions were: “Do you experience high work pressure?” (Q31) with response options No, Yes – every day, Yes – 1 or 2 times per week, and Yes – 1 time per month on average, and “Do you think work pressure should be addressed?” (Q35) with response options Yes, No, and No opinion.
Part 6: Transport crime (Q40–Q44) focused on transport crime issues and their impact on the respondents. Example questions included: “Have you dealt with transport crime?” (Q40) with response options Yes – regularly, Yes – sometimes, and No, and “Do you report all forms of crime to the authorities? Or via https://meldpunt-transport.nl/’’ (Q42) with response options No – small events not, No – never, Yes – only big events, and Yes – all events.
Part 7: Driver shortage (Q45–Q56) explored the respondents’ perceptions of the driver shortage and related topics. Example questions were: “Do you feel the demand for professional drivers has increased?” (Q45) with response options Yes – much more demand, Yes – a little more, No – not more than in the last 10 years, and No opinion, and “Do you find the hourly wage sufficient compared to similar jobs?” (Q47) with response options Yes, No, and No opinion.
Part 8: General questions (Q57–Q66) dealt with various topics, including paid parking and the European Mobility Package [EU regulations to improve road transport conditions (40)]. Example questions included: “Do you think paid parking for trucks is a solution?” (Q57) with response options Yes – better facilities, Yes – only if well organized, No – only take money from the sector, No – no rest possible, and No opinion, and “What do you think of the current European Mobility Package?” (Q62) with response options 1 (Bad) to 5 (Very good).
Part 9: The concluding section (Q67–Q68) provided space for respondents to share their opinions on the most important changes needed in the sector and any additional comments or suggestions. The two questions were: “Open question: What is, in your opinion, the first thing that needs to change in the sector? (Please provide 1 answer)” (Q67), and “Comments and suggestions that you could not include in the questions can be written below.” (Q68).
The open comment boxes were present in each part: Part 2 (Q12), Part 3 (Q17), Part 4 (Q25, Q28, Q30), Part 5 (Q34, Q39), Part 6 (Q44), Part 7 (Q51, Q53), Part 8 (Q58, Q60, Q63), and Part 9 (Q67, Q68). For an overview of all questions, please refer to the Data availability section.
2.2 Questionnaire dissemination
The questionnaire was administered in September and October 2021, with invitations disseminated through the website www.transporteffect.com and the corresponding LinkedIn and Facebook pages, platforms for sharing truck-related news articles.
2.3 Data pre-processing
In total, 3,845 respondents completed the questionnaire. Of these, 137 indicated that they were not professional truck drivers and were therefore excluded from the analysis, leaving 3,708 respondents. The questionnaire contained 51 multiple-choice items, which were analyzed separately from the open comment boxes. One question (Q15, about mobile toilets) was excluded because we considered it unclear.
The 50 remaining questions were divided into three categories:
• Driver-related questions (Q2: “Your gender?,” Q3: “Are you a professional driver?,” Q4: “Where do you primarily drive?” (1: National, 2: Benelux + Ruhr area, 3: International), Q5: “How old are you?”).
• General outcome questions (Q13: “Do you think the image of the driver needs to be improved?,” Q16: “What is your general impression of the image of the professional driver?,” Q46: “Would you recommend the profession to family or acquaintances?,” Q56: “What grade would you generally give to the professional driver’s profession?,” Q64: “How do you see the future as a Dutch professional driver?”).
• Forty-one, more specific, questions.
The driver-related questions and general outcome questions were used as criterion variables, while the remaining questions were subjected to a multivariate statistical analysis.
Response options for questions were not always on an ordinal scale and sometimes included Not applicable, No opinion, or Do not know choices. Therefore, the response options were sorted from low to high, response options that were equivalent on an ordinal scale (for example, No – creates dangerous situations and No) were combined, and the Not applicable/No opinion/Do not know options were marked as missing responses, since such responses cannot be used in standard linear statistical methods. For an overview of the response frequency distributions pertaining to each question, please refer to the Data availability section.
The number of times No opinion, Not applicable, or Do not know were answered was low for some questions (e.g., 0.2% for Q50, “Do you think the driver’s profession gets the respect it deserves?”). However, for some questions, these responses were more frequent. For example, for the question “Do you report all forms of crime to the authorities? or via https://meldpunt-transport.nl/’’ (Q42), 42.4% reported Not applicable, presumably because these drivers had not experienced any crime.
Regarding the grading of different unions and trade organizations (Q8–Q11), there was also a high prevalence of No opinion responses (26.0, 44.0, 32.8, and 24.9%), likely because drivers were not members or had not dealt with every organization. Since the aim of our research was to assess the general sentiment of drivers, not specific organizations, these four questions were combined into one by averaging, reducing the percentage of missing data for this question to 10.0%.
As the overall number of missing responses was low (6.9% of the 3,708 × 38 matrix of numbers), it was decided to impute these missing values, approximately preserving the means and intercorrelations between item responses. Specifically, missing data were imputed using the nearest-neighbor method, whereby the missing data in the 3,708 respondents × 38 questions matrix were imputed with the value of the nearest-neighbor row according to the Euclidean distance.
2.4 Statistical analysis
The mean scores on the 38 questions were interpreted to describe key patterns. Following this, the data (3,708 × 38 matrix of numbers) were subjected to exploratory maximum likelihood factor analysis. This statistical method aims to explain the correlations among variables by identifying latent factors that influence these variables; it is frequently used in the analysis of questionnaire data to reveal underlying psychological constructs (41). The number of factors to extract was based on the screen plot, a graphical representation where eigenvalues (corresponding to the percentage of variable explained) of the correlation matrix are plotted in descending order. The plot generally begins with a steep slope before leveling off, creating an elbow-like shape. The point at which the slope starts to level off is deemed the optimal number of factors to retain (42).
Subsequently, the factor loadings were orthogonally rotated using the Varimax method. Although it could be expected that underlying factors would correlate positively, an orthogonal rotation was chosen. This was done because we were interested in the discriminative power of the factors and their relationship with driver characteristics (rather than a ‘general positivity’ that may be expressed in multiple factors). Factor scores were calculated using the weighted least-squares method. The factor scores were subsequently standardized to have a mean of 0 and a standard deviation of 1.
The scores on the extracted factors were then correlated with the aforementioned criterion variables. Note that Q3 (“Are you a professional driver?”) was not used in this analysis because we only included respondents who answered Yes to this question; hence, this item exhibits no variance.
2.5 Text analysis: summaries of open comment boxes
The questionnaire contained a number of open comment boxes. Traditional methods such as content analysis and thematic analysis involve human raters examining the text for specific themes [(e.g., 43, 44)]. However, these methods come with the disadvantage of subjectivity and limited reproducibility (45, 46).
Recently, large language models have emerged as a promising alternative. ChatGPT has been shown to perform well in reading comprehension and other linguistic tasks (47–50). In this paper, we will use it for two purposes: summarizing open-ended responses and extracting sentiment from responses.
In summarization applications, ChatGPT’s capabilities have been shown in various fields (51), including clinical texts (52) and news items (53). Regarding sentiment analysis, research has shown that ChatGPT can generate mean sentiment scores that correlate strongly with human sentiment ratings and with VADER sentiment analysis, an existing sentiment analysis model (54). ChatGPT has also been found to outperform humans in extracting the stance and topics of tweets (55, 56), and surpass state-of-the-art models in analyzing various types of texts such as customer reviews, social media posts, and news items (57).
We used a custom script to upload the responses for each open comment box to OpenAI’s API (GPT-4, model: gpt-4-0125-preview; date: March 2, 2024). The responses were accompanied by the following prompt: “Please make a very very short summary of the respondents’ comments shown above, IN ENGLISH; do not enumerate.” The parameter temperature, which determines the degree of randomness of the output, was set to 0 to yield a nearly deterministic output.
Although ChatGPT can properly handle potential gibberish responses or ‘empty’ responses such as a single character (54), we have nonetheless applied a filter whereby only text responses of 4 or more characters were included in the input to ChatGPT. By excluding extremely short responses, we ensured our sample size was more accurately represented by respondents who offered feedback.
2.6 Text analysis: vehicle aids and on-board computer
A key research question of this study focuses on drivers’ perceptions of technology. The responses to the open-ended question regarding vehicle aids (Q30; “Comment: vehicle aids”) featured numerous comments on specific assistance systems, predominantly concerning the following four types:
• Adaptive cruise control (ACC)
• Lane departure warnings (LDW)/Lane keeping assistance (LKA)
• Emergency braking/AEB
• Camera systems and smart mirrors
For the comments in Q30, we manually identified the system(s) being referred to in the comment (Appendix A). Then, for each of the systems, the corresponding quotes were fed to GPT-4, with the following prompt:
What do the users think about the discussed system? Give a very short summary; do not enumerate.
The same prompt was used for the responses to the open-ended question regarding the onboard computer (Q34; “Comment: on-board computer”).
Finally, numerical sentiment scores were generated for the comments for each of the four ADAS in Q30, through the following prompt:
These text messages are obtained from a textbox in a questionnaire about technology in trucks. I need you to provide a single sentiment rating about the technology being discussed in the comments, from 1 (extremely negative) to 100 (extremely positive). Only report a single number between 1 and 100, rounded to two decimals. no text!
A bootstrapping approach was adopted for this process (54, 58), where all comments per ADAS (Q30) were sorted in random order, and the mean score over 1,000 attempts was taken as an overall indicator of sentiment. The use of this method was deemed necessary because the way ChatGPT operates brings a certain randomness to the output. By averaging over a large number of repetitions under effectively identical conditions (only the order of the comments differs), a statistically reliable assessment is obtained of how ChatGPT judges the sentiment of the respondents’ texts.
3 Results
3.1 Driver-related questions
A total of 3,708 respondents were included in the study, with 3,541 (95%) identifying as male (Q2). The age distribution of the respondents (Q5) was as follows: 270 individuals aged 18–25, 969 aged 25–40, 884 aged 40–50, 1,175 aged 50–60, and 410 aged 60–75 years old. In terms of driving regions (Q4), 1,483 respondents reported being national drivers, 1,552 identified as international drivers, 666 specified driving in the Benelux & Ruhr area (i.e., Belgium, Netherlands, Luxembourg, and the Ruhr industrial region in Western Germany), while 7 respondents indicated that the question was not applicable to them.
3.2 General outcome questions
Respondents expressed some concerns about the image of their industry, hesitancy to recommend the career to others, and a neutral to slightly negative outlook on the future. Specifically:
• 88.1% (3265) of respondents believe the image of the driver needs improvement, 7.3% (269) remain neutral, and 4.7% (174) disagree (Q13).
• The general impression of the image of the professional driver leans toward negative, with a mean score on the scale of 1 (Very negative) to 5 (Very positive) of 2.62 (Q16).
• 68.7% (2,549 respondents) would not recommend the profession of a professional driver to family or acquaintances, while 31.3% (1,159 respondents) would recommend it (Q46).
• Responding to the question, “What grade would you generally give to the professional driver’s profession?,” the mean grade provided by respondents was 6.27 out of 10 (Q56). The most common grade was 7 (n = 1,006).
• Finally, the majority of the respondents have a neutral to slightly negative outlook on the future, with a mean of 4.48 on a scale of 1 (Very negative) to 10 (Very positive) (Q64). The most frequently selected grade was 5 (n = 770).
3.3 Specific questions: mean ratings
The questionnaire used different response options for the questions, including yes/no and scales of 1–3 or 1–5. This differentiation aimed to better match the nature of each question, and may increase respondent engagement while reducing yea-saying bias (59). However, it inhibits direct comparison of items based on their mean score.
Table 1 shows mean scores for the 38 items, with a ‘normalized mean’ column ranging from 0 to 1, which allows a clearer view of the drivers’ agreement with statements across items. The results are interpreted below on this 0 to 1 scale.
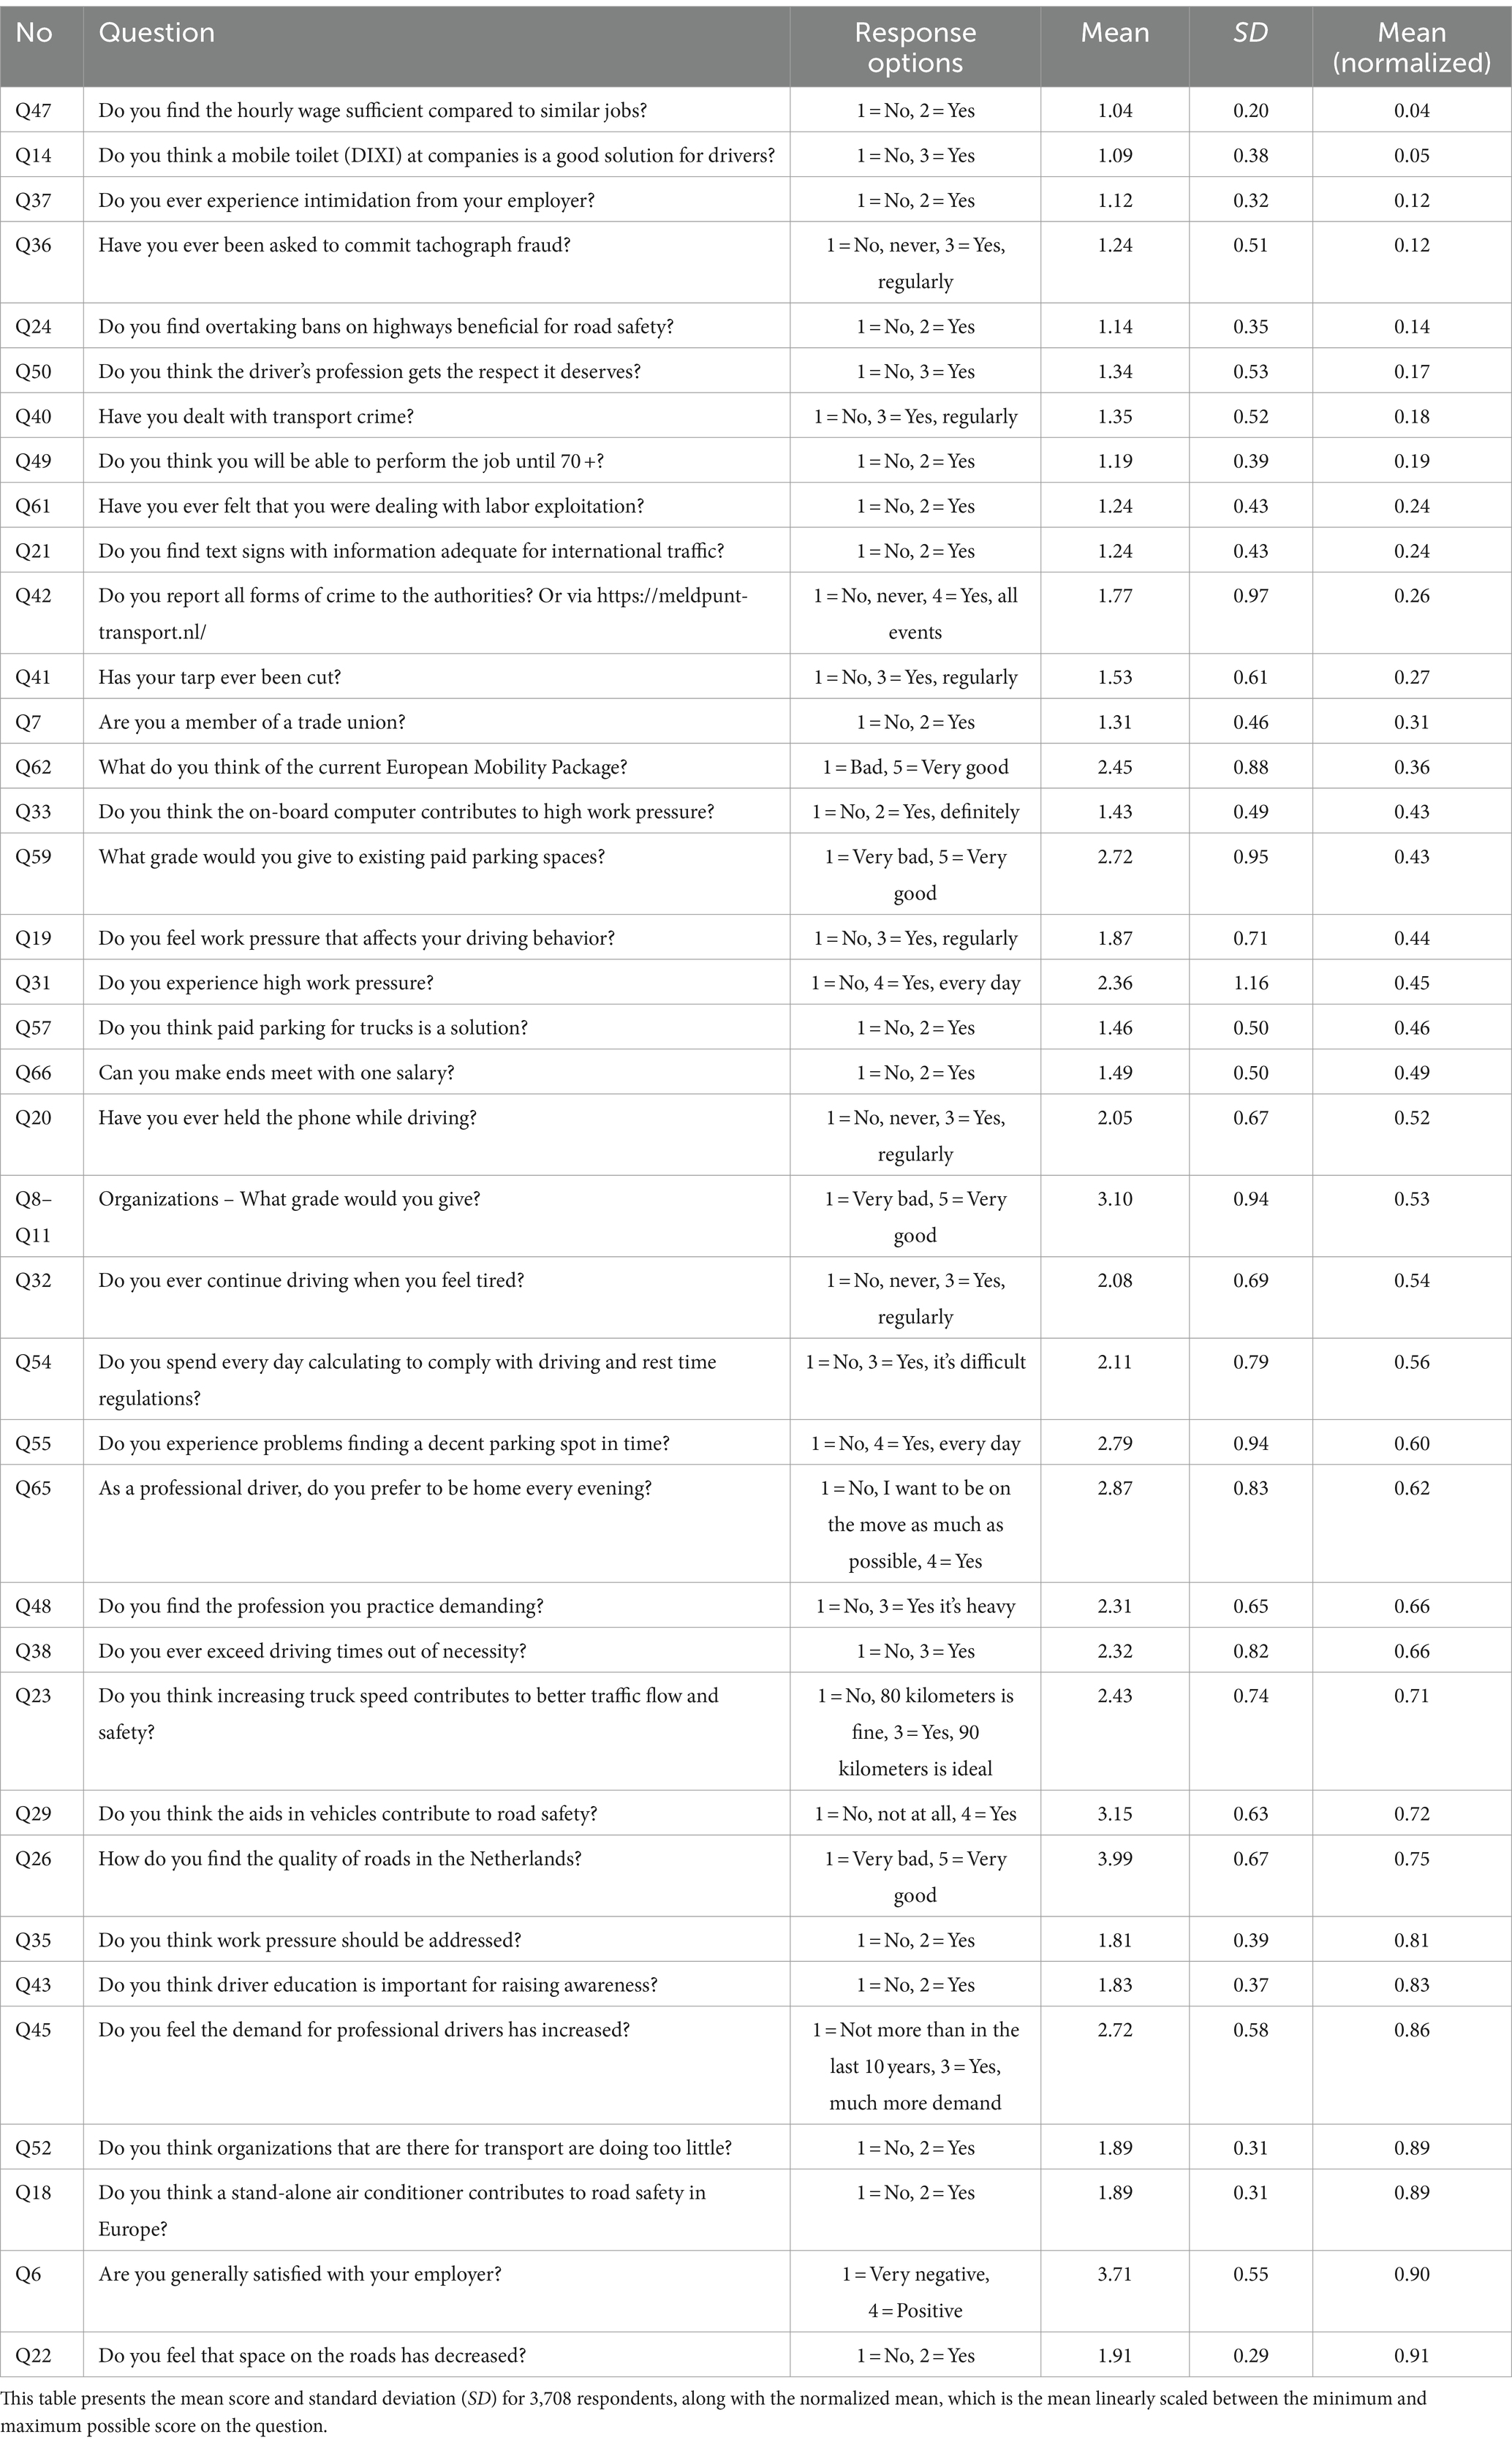
Table 1. Overview of the 38 items subjected to statistical analysis.
Regarding workplace and road safety, the use of mobile toilets at companies received a low score of 0.05 (Q14). Overtaking bans on highways scored only 0.14 (Q24). Aids in vehicles were assigned a score of 0.72, indicating a general agreement about their contribution to road safety (Q29). Furthermore, respondents found that a stand-alone air conditioner contributes to road safety (Q18, score: 0.89). A score of 0.91 was reported for the feeling that space on the roads has decreased, indicating a universal observation (Q22).
Regarding work pressure, a score of 0.45 was observed for drivers experiencing high work pressure (Q31), with a score of 0.44 regarding the feeling that work pressure affects their driving behavior (Q19). A high score of 0.81 was obtained for the belief that work pressure should be addressed (Q35).
In terms of compensation and financial aspects, a low score of 0.04 was found for the sufficiency of the hourly wage compared to similar jobs (Q47), while a score of 0.49 indicated that nearly half of the drivers find it difficult to make ends meet with one salary (Q66).
As for work-related issues, while most drivers reported that they are satisfied with their employers (0.90; Q6) and have not experienced labor exploitation (Q61) or intimidation (Q37) from their employers, a portion of respondents reported such issues (0.24 and 0.12, respectively). Additionally, a score of 0.18 was observed for having dealt with transport crime (Q40).
When considering work-life balance, a score of 0.62 was obtained for drivers who prefer to be home every evening (Q65). On the other hand, a score of 0.66 was obtained for drivers who exceed driving times out of necessity (Q38). This points to the difficulty some drivers face in maintaining a balance between work and personal life.
In the context of infrastructure, the quality of roads in the Netherlands received a high score of 0.75 (Q26). However, drivers reported a score of 0.60 for experiencing problems finding a decent parking spot in time (Q55).
Finally, regarding the perception of the profession and industry-related organizations, a score of 0.17 was reported for the belief that the truck driver’s profession receives the respect it deserves (Q50). A high score of 0.83 was obtained for the importance of driver education for raising awareness (Q43), while 0.86 was reported for the increased demand for professional drivers (Q45). However, a high score of 0.89 was observed for the belief that organizations supporting transport are doing too little (Q52).
3.4 Specific questions: factor analysis
The results from the 38 questions were subjected to a factor analysis in order to extract underlying factors. The scree plot (Figure 1) indicated that the extraction of two factors would be appropriate, though the percentage of explained variance was not high. However, this may not impact the reliability of the constructs as long as a large number of variables correlates with the factor (60).
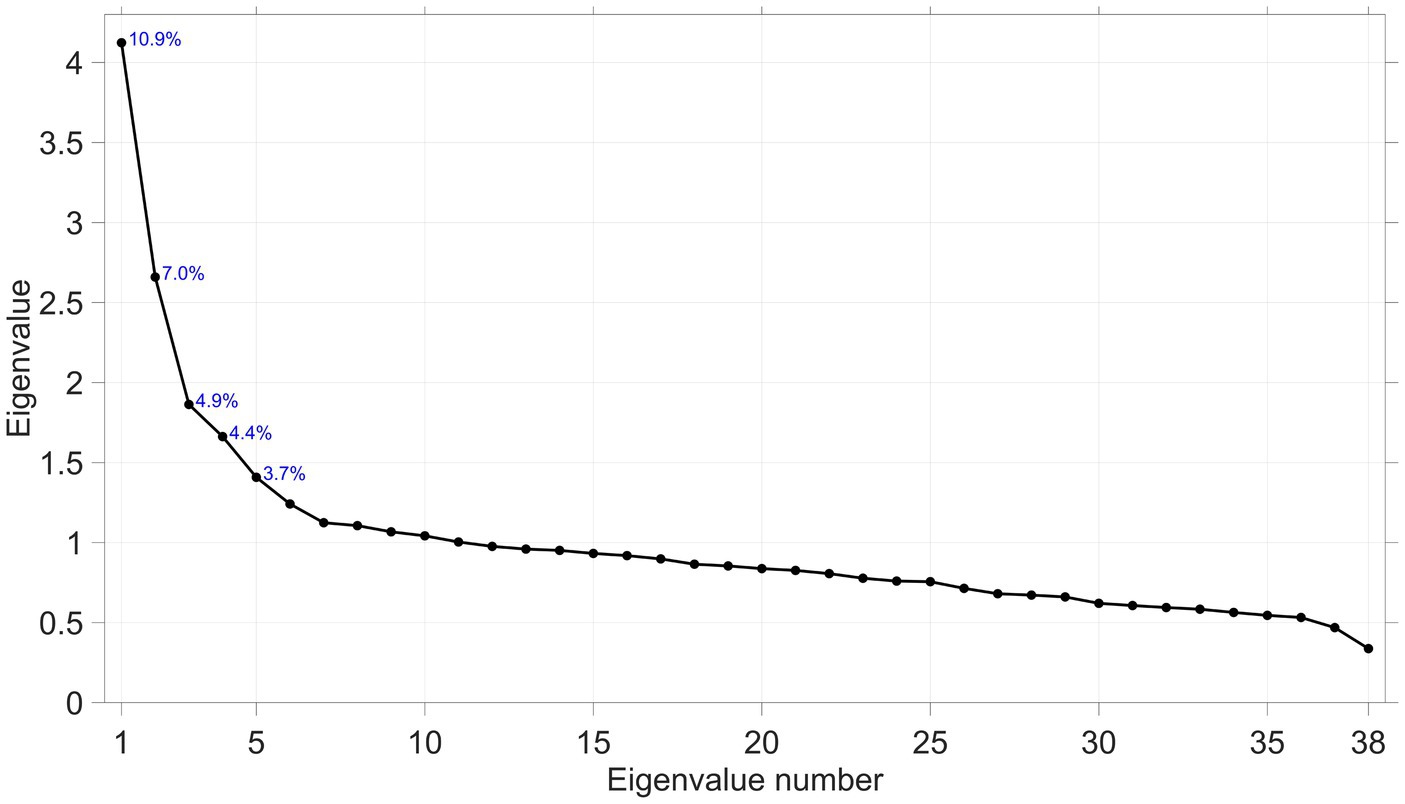
Figure 1. Scree plot of the 38 × 38 correlation matrix.
The Varimax-rotated loadings (please refer to the Data availability section) allowed us to interpret the two factors as follows: (1) Work Pressure and (2) Safety & Security Concerns. More specifically:
Factor 1: Work Pressure. Items with high loadings on this factor relate to work pressure and its impact on drivers. The strongest loadings relate to experiencing high work pressure (0.75; Q31; and 0.74; Q19). Other high loadings involve ever experiencing intimidation from one’s employer (0.45; Q37), experiencing the profession as demanding (0.45; Q48), being satisfied with one’s employer (-0.44; Q6), continuing to drive when feeling tired (0.46; Q32), the on-board computer contributing to high work pressure (0.46; Q33), and having ever felt that one was dealing with labor exploitation (0.42; Q61).
Factor 2: Safety & Security Concerns. Items with high loadings on this factor are related to the security and working conditions of drivers. The strongest loadings are related to dealing with transport crime (0.49; Q40), having one’s tarp cut (0.45; Q41), experiencing problems finding decent parking spots (0.51; Q55), and exceeding driving times out of necessity (0.45; Q38). Variables related to international driving showed strong loadings as well: preferring being home every evening (-0.49; Q65) and opinion about the European Mobility Package (-0.39; Q62).
The reported crimes (Q44) primarily involve diesel theft, alongside other offenses such as vehicle or container break-ins, and theft of personal belongings or cargo. Incidents of stowaways and intimidating encounters with migrants have also been noted.
Next, factor scores were calculated and correlated with the driver-related questions and the general outcome questions. The results in Table 2 show that there are small gender differences, with women being slightly more burdened by work pressure and men slightly more by crime. This latter finding can be explained by the increased likelihood of men being international drivers.
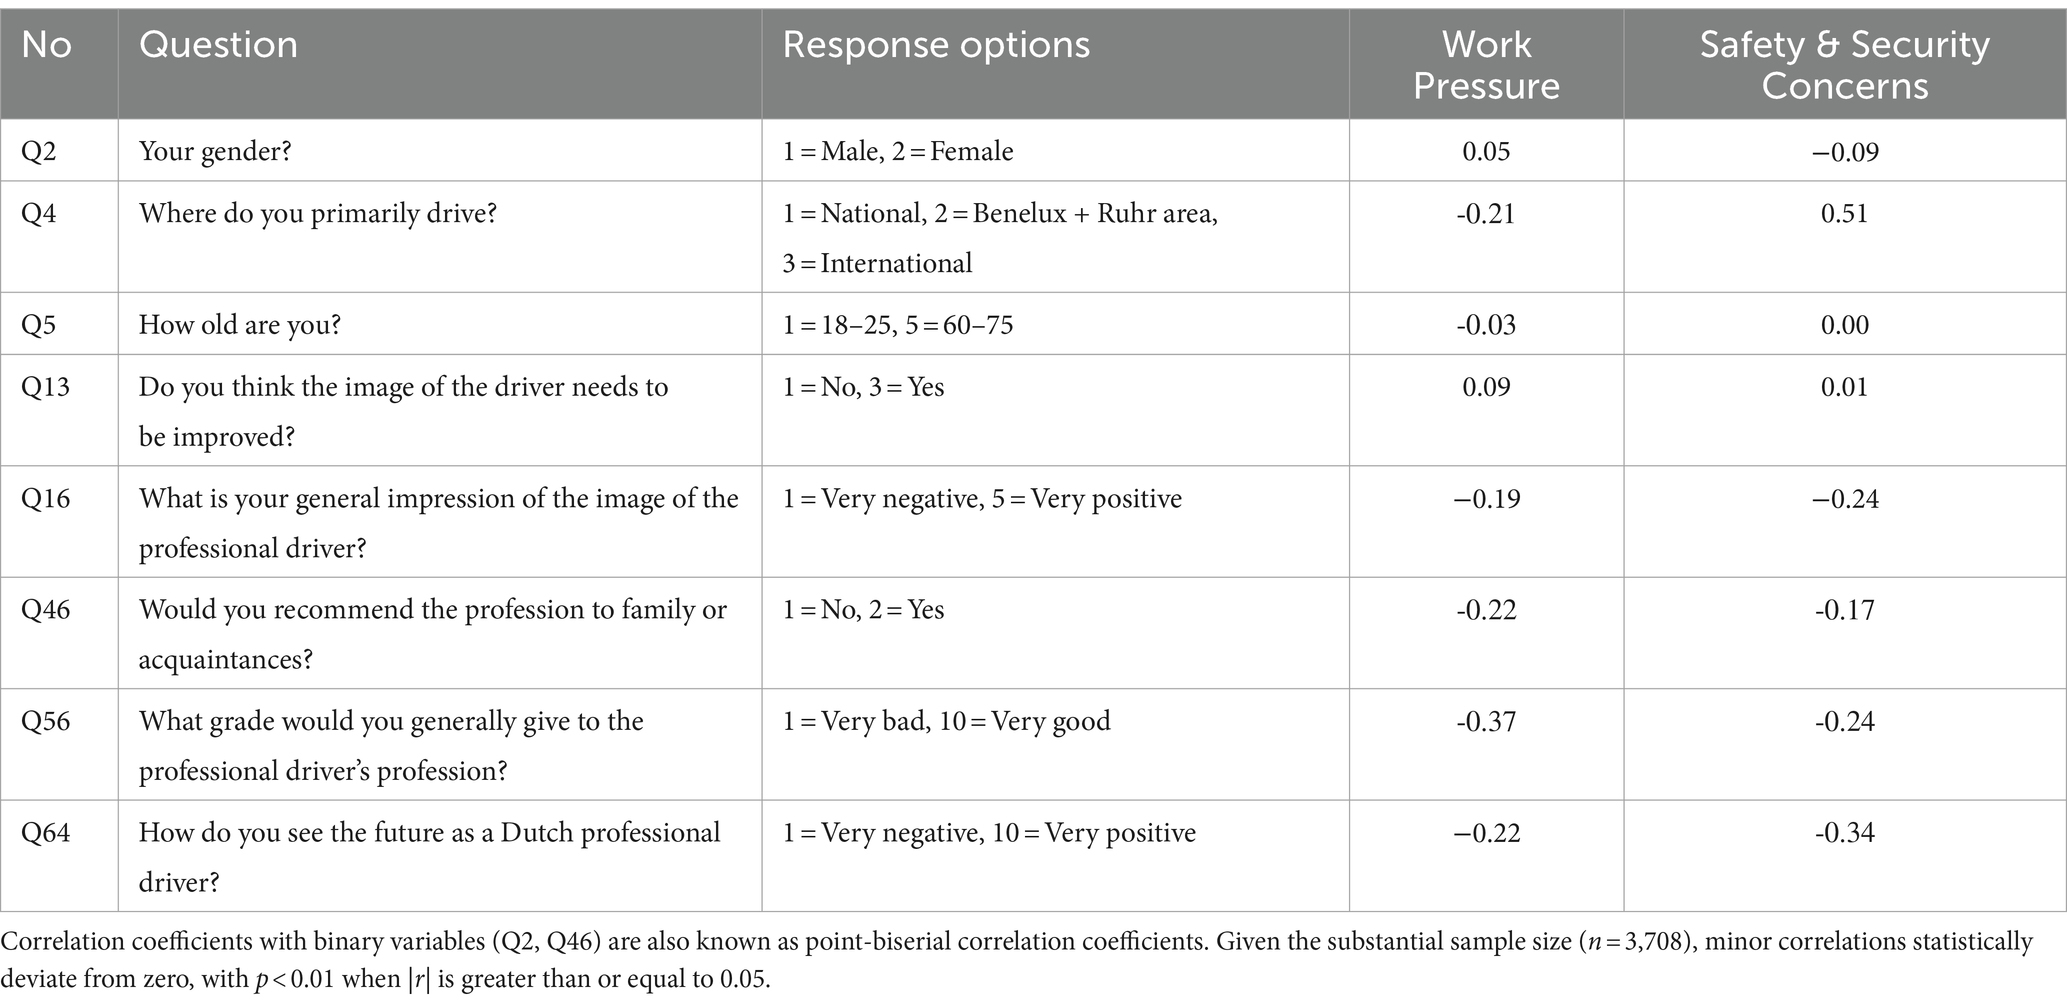
Table 2. Correlation coefficients between item responses and factor scores.
The factor scores consistently correlate with the outcome measures, such as the respondents’ impression of the image of the truck driver (Q16), whether they would recommend the profession to family or acquaintances (Q46), the score they attribute to the profession as a whole (Q56), and how they view the future (Q64). Work Pressure is primarily associated with the impression of the profession now (Q56), while Safety & Security Concerns are more strongly associated with whether the future is judged optimistically (Q64).
Finally, a trend emerges wherein Work Pressure is relatively high among drivers operating nationally, while Safety & Security Concerns are relatively high among international drivers (Q4). The mean (SD) scores for Work Pressure are 0.22 (0.98) for national drivers, 0.05 (0.95) for drivers in the Benelux/Ruhr Area, and -0.23 (0.99) for international drivers.
On the other hand, the mean (SD) scores for Safety & Security Concerns are -0.57 (0.90) for national drivers, 0.00 (0.86) for Benelux/Ruhr Area drivers, and 0.55 (0.82 for international drivers. The difference in these experiences between national and international drivers is visually illustrated in Figure 2.
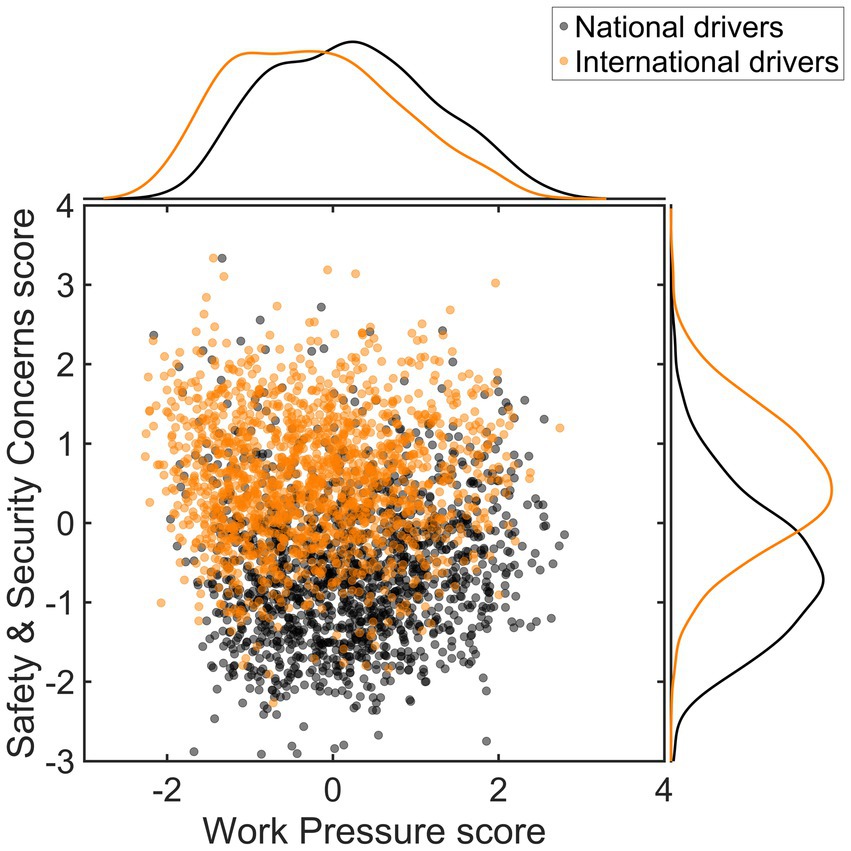
Figure 2. Scatter and kernel density estimate plot of factor scores, differentiating between national drivers (n = 1,483) and international drivers (n = 1,552).
3.5 Text analysis: summaries of open comment boxes
Appendix B provides summaries of respondents’ comments regarding the 15 open-ended questions presented in the questionnaire. These summaries reveal themes that encompass a wide array of subjects, including the perceived commitment of organizations, concerns surrounding driving times, availability of parking spaces, and the contentious issue of overtaking bans for trucks. Given that the summaries of the 15 open comment boxes still contain a lot of information, and sometimes in a redundant form, we asked ChatGPT to generate a single meta-summary using the following prompt.
Formulate a very concise summary from the following summaries without mentioning specific persons or organizations.
The meta-summary generated by ChatGPT is as follows:
Truck drivers express widespread dissatisfaction with their profession, citing undervaluation, mistreatment, and poor working conditions. They highlight issues such as unsanitary facilities, lack of respect from employers, clients, and the public, and the negative impact of foreign drivers. Concerns also include dangerous road conditions due to overtaking bans, inadequate education on blind spots, and mixed opinions on technological aids, which some say decrease attentiveness. Many criticize trade unions and employer organizations for not effectively representing their interests, particularly regarding wages and working conditions. The use of onboard computers is seen as increasing work pressure and invading privacy. Criminal activities like diesel theft and insufficient secure parking are major concerns, alongside the high costs and poor quality of paid parking facilities. Drivers call for improved treatment, compensation, and better enforcement of regulations to ensure fair competition and working conditions, emphasizing the need for higher wages, more flexible working hours, and better parking and rest facilities.
3.6 Text analysis: vehicle aids
In addition to the general summary of the open comment boxes provided above, we conducted an analysis specifically focusing on the evaluation of technologies in the vehicle. The results of this analysis are shown in Table 3.
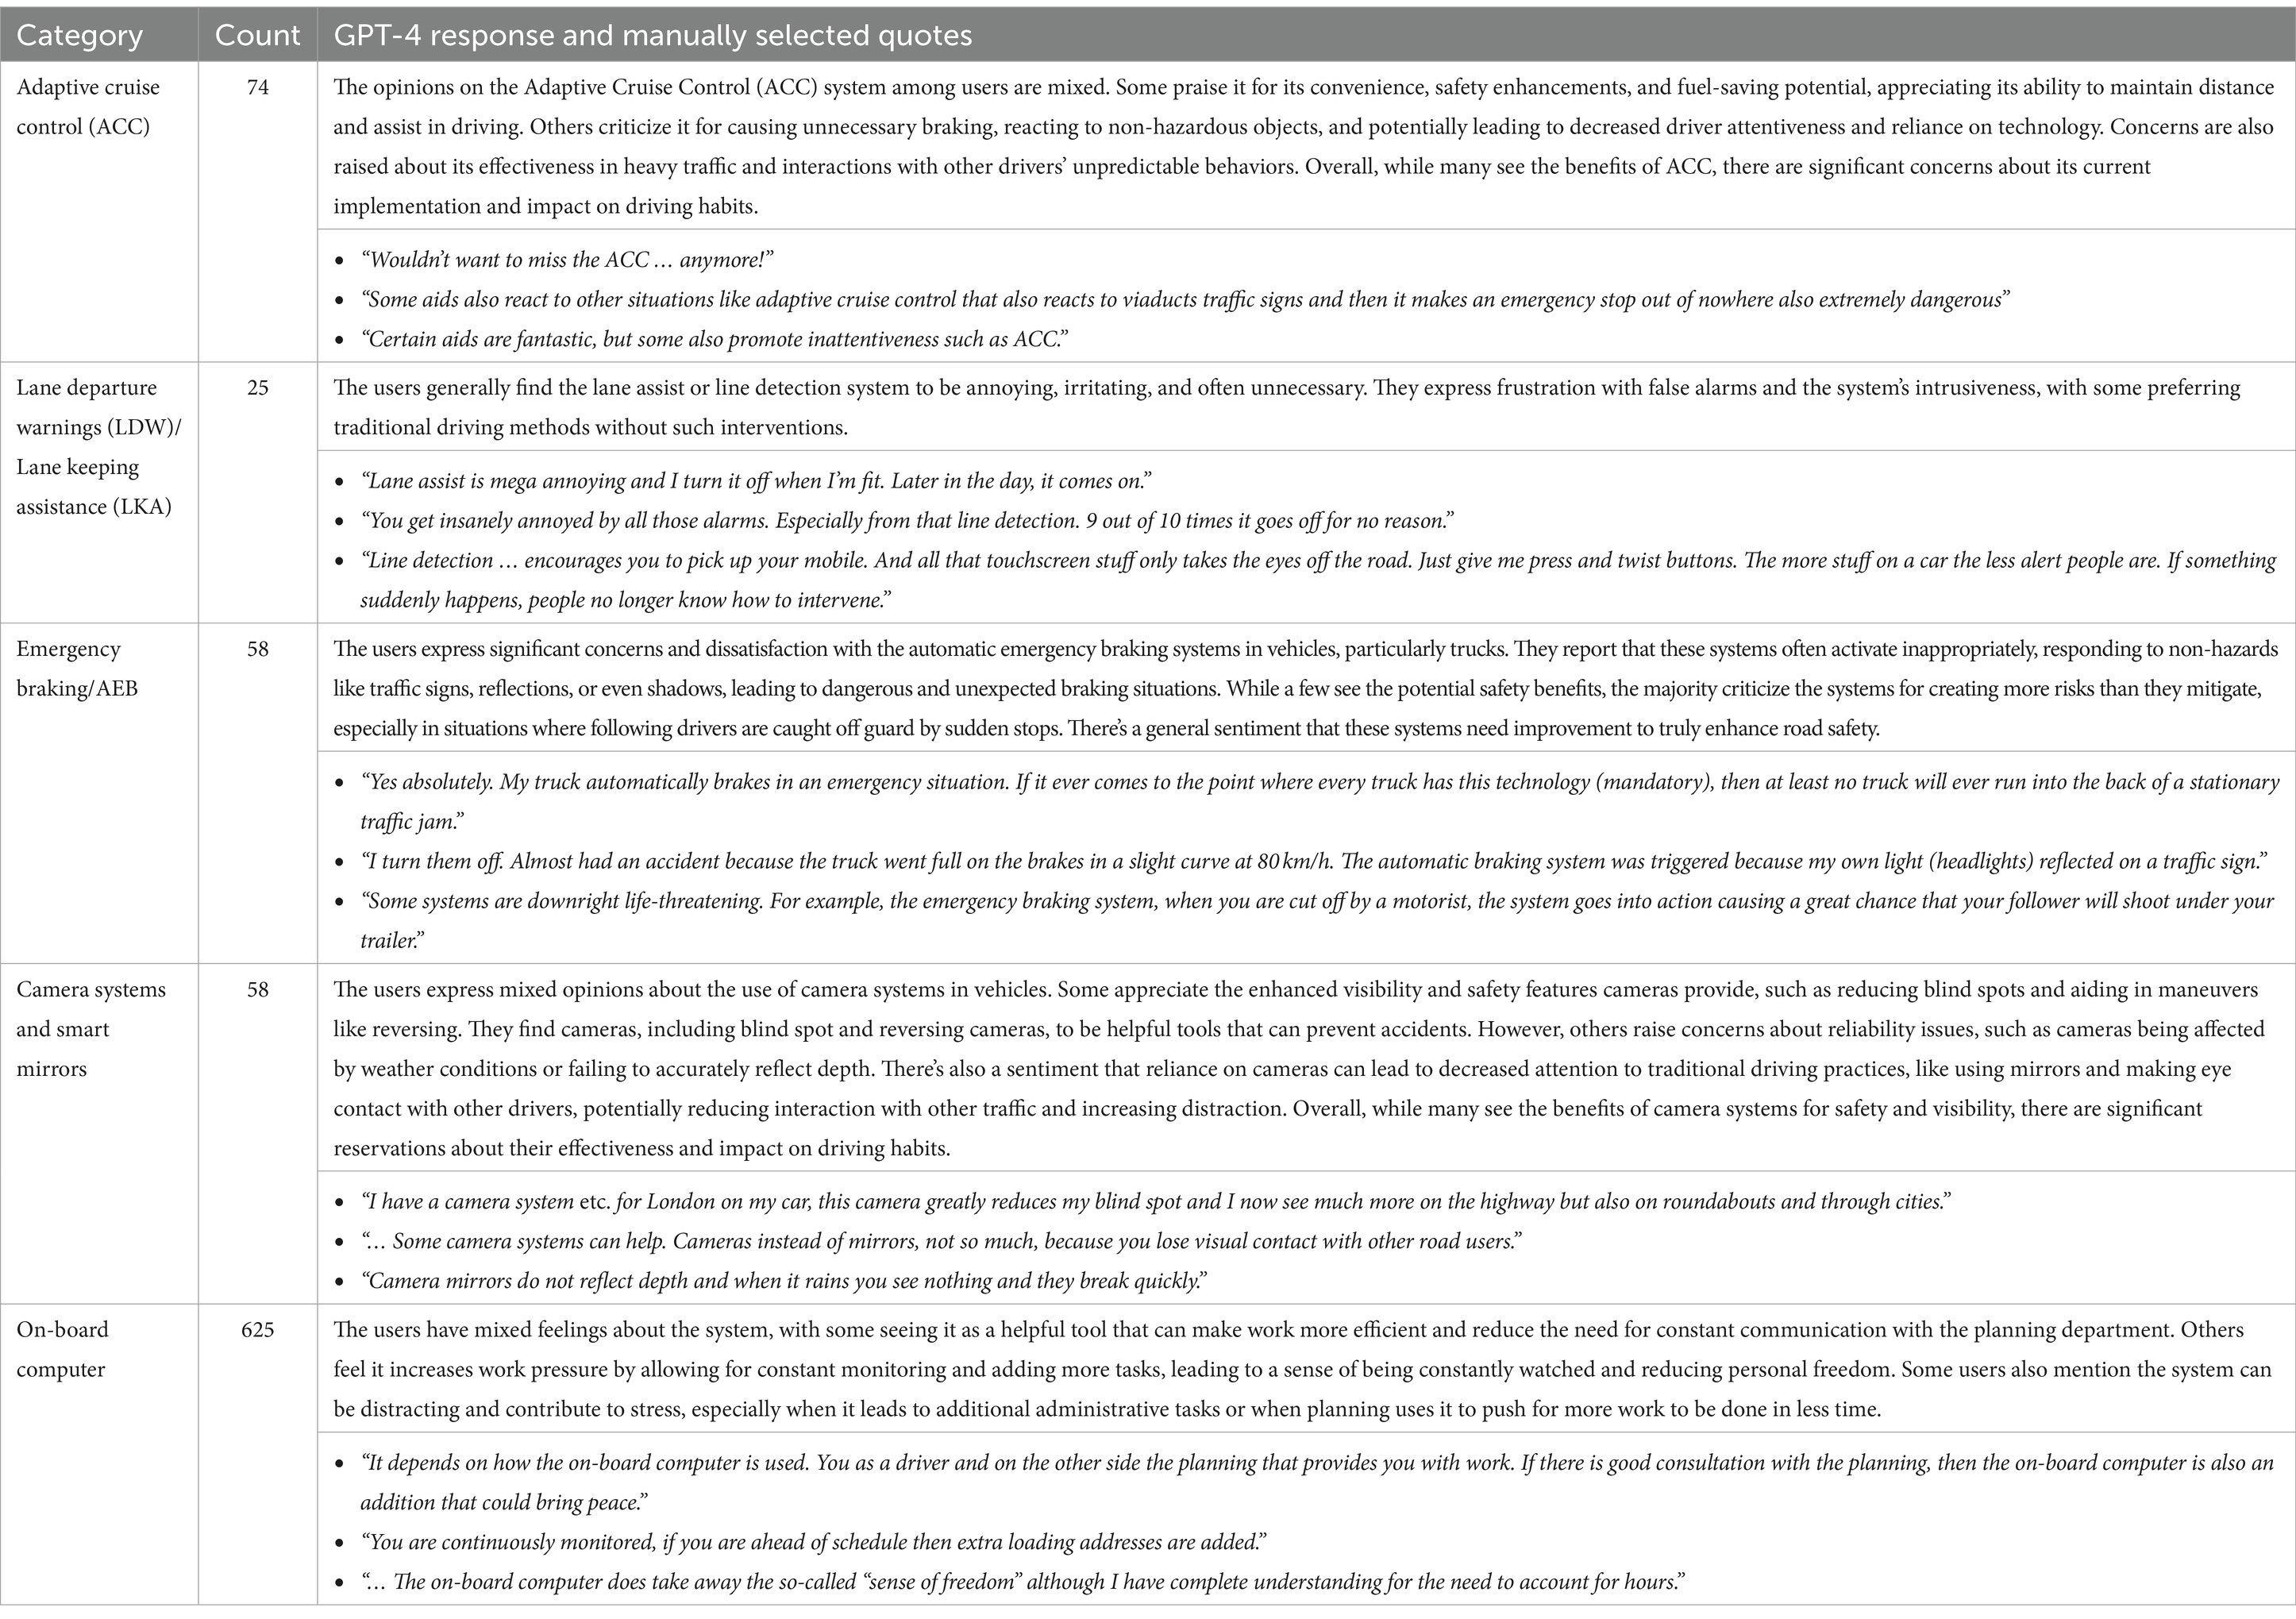
Table 3. Number of comments, ChatGPT summaries, and manually selected comments for systems mentioned in Q30 and Q34.
ACC is valued for its safety, fuel efficiency, and calming effect on driving, though concerns about incorrect reactions and potential distractions exist. LDW and LKA systems can be irritating due to frequent alerts, leading some drivers to disable them. AEB systems can prevent accidents but raise safety concerns due to false activations, causing potential hazards for following traffic and heavy loads. Opinions on camera systems and smart mirrors are mixed; they increase visibility and reduce blind spots but can malfunction and disconnect drivers from the environment. Finally, on-board computers improve logistical efficiency and communication but may increase work pressure, create additional tasks, and infringe on driver autonomy due to real-time tracking.
The above findings are corroborated by numerical sentiment scores computed using ChatGPT. More specifically, the mean (SD) sentiment scores across the bootstrapped batches were 58.0 (5.07) for ACC, 26.7 (3.83) for LDW/LKA, 32.6 (4.92) for emergency braking, and 67.5 (5.14) for camera systems and smart mirrors, on a scale from 1 (Extremely negative) to 100 (Extremely positive). The reported means are shown in Figure 3.
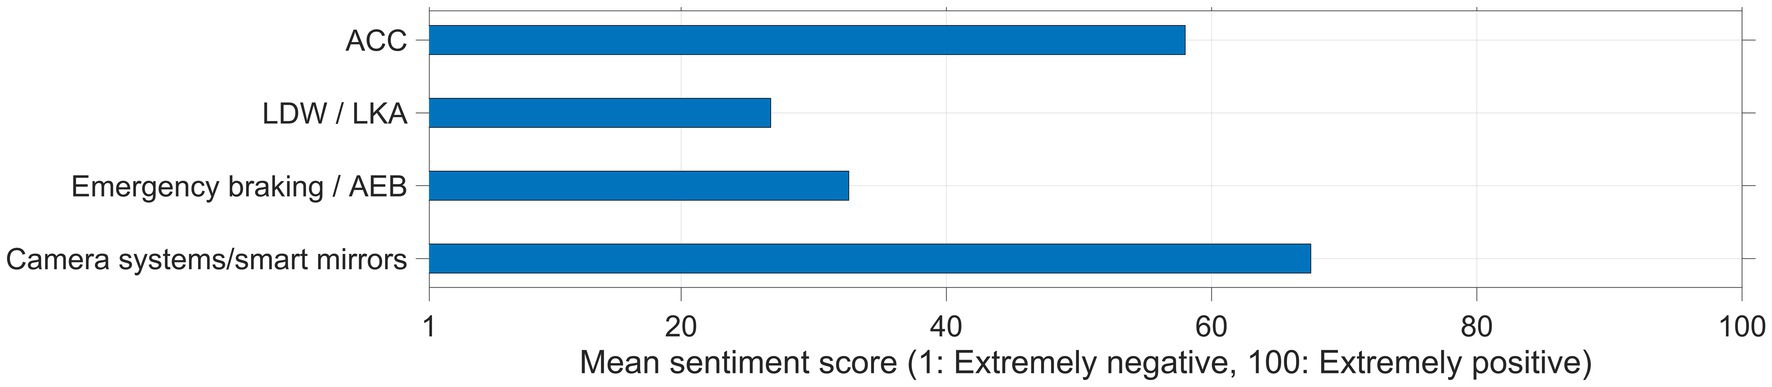
Figure 3. Sentiment scores for four categories of vehicle aids, as assessed by ChatGPT based on textbox comments. ACC, adaptive cruise control; LDW, lane departure warnings; LKA, lane keeping assistance; AEB, autonomous emergency braking.
4 Discussion
Truck drivers play a vital role in national distribution and international trade, yet face considerable challenges, with the rapid adoption of new technologies adding to these challenges (15, 61). However, comprehension of truck drivers’ daily experiences has been limited. The current study aimed to fill this knowledge gap through a large-scale questionnaire from 3,708 Dutch professional truck drivers. The responses to multiple-choice questions were statistically analyzed, while a large language model was used to analyze the responses to the open comment boxes.
The results revealed that Dutch professional drivers view the image of their profession as needing improvement, are hesitant to recommend it, and possess a neutral to slightly negative outlook. There was evident concern about decreased space on roads. When considering work pressure, compensation, and work-life balance, scores indicated moderate work pressure, high dissatisfaction with wages, challenges in maintaining a balance between work and personal life, and lack of support from transport organizations.
Factor analysis revealed two primary types of concerns among drivers: Work Pressure and Safety & Security Concerns. Work Pressure, characterized by high loadings on items like the impact of pressure on driving behavior and intimidation from employers, was more commonly reported by national drivers. Safety & Security Concerns, marked by high loadings on items like dealing with transport crime and finding decent parking, were more prevalent among international drivers. These results can be explained as crime primarily pertains to fuel or cargo theft when the vehicle is parked, in addition to instances of unauthorized migrants clandestinely boarding the truck (62–64). Moreover, long-distance drivers more frequently work during night hours, which may contribute to a feeling of unsafety. Work pressure was more of an issue for the national (short-distance) drivers, which may be explained by the larger number of trips they have to complete, the busier daytime traffic conditions, or the more urban traffic environments they are exposed to, in typically less comfortable vehicles (65).
In addition, our research addressed the perception of technological systems, namely ADAS and the on-board computer. ACC was appreciated for its safety features and fuel-saving properties, but concerns exist due to incorrect interventions. LKA systems were often perceived as irritating due to frequent false alerts, leading some drivers to turn them off. Some respondents saw emergency braking technology as useful in preventing accidents, but various safety concerns were raised regarding false activations [see also (29, 66)]. Camera systems and mirror technology received mixed reviews; while many respondents appreciated increased visibility and reduced blind spots [see also (33, 67)], others pointed out that the substitution of conventional mirrors with digital camesras disrupts the reciprocal visual communication between the driver and other road users, and may lead to a disconnection from the surrounding environment. Finally, on-board computers were found to improve logistical efficiency and communication but also increased perceived work pressure due to real-time tracking, potential for additional work, and a sense of surveillance. Similar concerns apply to data-driven driver coaching. Although data recorded by onboard computers has been shown to be predictive of traffic incidents [(e.g., 68)], drivers may not readily accept driver monitoring systems. This reluctance could arise from drivers being unaware of the benefits or their discomfort with sharing their data with external parties (69).
These findings can be broadly interpreted in the context of automation disuse (70, 71): in general, drivers appeared to value systems that tangibly contribute to accident prevention and workload reduction, while demonstrating resistance toward less reliable systems, false alarms, and perceived intrusions of autonomy. The findings of our research can also be interpreted through the lens of Ivan Illich’s concept of ‘Tools for Conviviality’, which advocates for technology that promotes autonomy and fruitful interaction (72, 73). While features such as ACC, AEB, and camera systems can increase driver autonomy and safety when working optimally, concerns about false activations, reliability, and a sense of intrusive surveillance represent a departure from conviviality.
The sentiment ratings revealed that LDW and emergency braking yielded the lowest scores. However, these results should be interpreted with caution, as there is a possibility that drivers might have confused AEB with ACC. In recent years, ADAS have progressed substantially, typically integrating a variety of subsystems (74, 75), and their functionality may not always be clear to drivers (76, 77). Also for the authors of the current study, it was occasionally challenging to accurately classify specific comments. For example, drivers frequently referred to the term ‘distance sensor’. Technically, this is not an ADAS, but measurement equipment that is used in both ACC and AEB. This confusion may partially account for the low sentiment score for AEB, where false-positive braking interventions are typically ascribed to AEB, rather than ACC. Furthermore, for AEB, it is predominantly these false positives that drivers perceive, while the number of instances in which AEB averts accidents is logically low (78), since (near-)accidents are infrequent events. However, from a cost–benefit perspective, the AEB system might still be beneficial despite the low sentiment score, considering the substantial costs of accidents.
The acceptance of technology by drivers is essential, particularly in the context of the increasing mandating of technological systems in trucks. As of November 2015, EU regulations have made it compulsory for all new trucks to be equipped with AEB and LDW systems (79). From July 2022, new trucks are required to have additional systems, such as a blind spot information system, pedestrian/cyclist collision prevention, reversing detection, a driver availability monitoring system, and tire pressure monitoring. The mandate extends further in January 2026, when systems such as direct vision for vulnerable user protection, event data recorders, and advanced driver distraction warning systems will become obligatory (80). As more technologies become mandatory, the need for such systems to be reliable and conducive to the driver is reinforced.
Several limitations must be considered with this study. One is that the questionnaire was conducted at the end of 2021. During the COVID-19 pandemic, truck drivers dealt with less social contact as amenities closed down, while social media sentiment analysis revealed that public appreciation for their work actually grew (81).
Furthermore, it should be considered that ADAS sensors and algorithms continue to improve. While these improvements likely result in fewer false positives, there also exists the issue of human variability: false positive warnings in AEB and LDW may be inevitable considering that a threshold needs to be set for a critical time-to-collision or lateral deviation. According to the principles of signal-detection theory, this will involve a trade-off between timely warnings and false positives, as interpreted by the driver [(e.g., 82, 83)]. This inescapable threshold could potentially explain why, despite many years of development, AEB and LDW systems are still perceived as irritating by drivers [(e.g., 84, 85)]. Arguably, a more fundamental consideration needs to be given to the usefulness of warning systems compared to systems that automatically maintain the lane or exert torque feedback on the steering wheel (86, 87).
In this study, a large number of drivers were surveyed, which implies that the results are statistically precise. However, the results are not necessarily free of bias: it is possible that the mean values as shown in Table 1 are negatively skewed if primarily drivers who wished to complain completed the questionnaire, or if drivers exaggerated certain points in the hope that their responses would prompt a shift in national politics and business practices. In this context, it is useful to compare our results with questionnaires said to be nationally representative, specifically the National Employment Survey conducted by the Netherlands Organization for Applied Scientific Research (TNO), Statistics Netherlands, and the Ministry of Social Affairs and Employment (88). In our questionnaire, there were two questions that were highly similar to questions in this nationally representative survey. Specifically, to the question “Do you ever experience intimidation from your employer?” (Q37), 11.9% of our respondents answered Yes, compared to 10.9% in the national survey who answered Yes (occasionally, often, or very often) to the question “Can you indicate to what extent you have personally experienced intimidation by superiors or colleagues in the past 12 months?” Another comparable question was Q31: “Do you experience high work pressure?,” to which 19.2% of our respondents answered Yes – every day and 34.3% Yes – 1 or 2 times per week (a total of 53.5%). In the nationally representative survey, 37.1% answered Often or Always to the question “Do you have to do a lot of work?.” In summary, our results are in line with results from a representative sample of truck drivers in the Netherlands, suggesting no substantial bias in our questionnaire. However, it is worth noting that our open comment boxes were often left empty, with response rates ranging widely between questions (see Appendix B). It may be that drivers who wanted to suggest improvements in particular took the opportunity to fill in the open comment boxes, still introducing a form of bias.
Besides representativeness for the Dutch population, it is necessar to consider how our results relate to those of other countries. There are large national differences in road network density, road quality, accident risk, and the quality of organizations and operations. Despite this, certain factors concerning the well-being of drivers, such as stress, fatigue, and physical and mental health, recur both within Europe (13, 36, 37) and on other continents (12, 89–93).
The impression that drivers left in our questionnaire was quite negative. They appeared pessimistic about the profession as a whole and found their salary to be mediocre. At the same time, respondents were satisfied with their own employer, and the majority did not experience high work pressure, with 36.7% of respondents reporting no high work pressure and 19.2% indicating high work pressure on a daily basis. This is also evident from the aforementioned national survey, where other professional groups such as elementary school teachers, managers, cooks, lawyers, doctors, directors, social workers, and caregivers reported much higher work pressure than truck drivers (88). Possible explanations are that, even though truck drivers have many grievances about their field, ‘being on the road’ is a job that offers a certain level of satisfaction (94, 95). It is also possible that truck drivers experience pressure, but do not perceive or express it as such due to their hardship and stoicism (3). Additionally, while truck drivers may not have to work hard in physical terms, their work scheduling is highly dictated as compared to some other professions like directors, scientists, and advisors. The literature concurs that flexibility and autonomy over work hours can influence job satisfaction; a meta-analysis by Shifrin and Michel (96) highlights the positive impact of flexible work arrangements on overall job stress levels. Work-related pressures, often tied to truck driving accidents, can stem from various factors such as supervisor pressure, inadequate training, and unsupportive management (34, 36, 37). Further, loading/off-loading site culture (37, 97, 98), as well as other road users’ behavior (7, 21, 99–101), can be a source of stress.
Beyond the issue of representativeness, it is important to also monitor the quality of the responses, that is, whether the questionnaire appears to have been completed sincerely. Our impression is that the quality of the responses was high compared to other questionnaires that seem to be plagued by acquiescence bias [for discussions, (see 102–104)]. An illustration of the high quality of responses is that only 3 of the 3,708 respondents (0.08%) rated the quality of roads in the Netherlands (Q26) as very bad. If there were mindless responses, the distribution of responses would be more uniform.
A noteworthy aspect of our study is that the text analysis was done automatically. Our observation is that the summaries and sentiment scores correspond to how we ourselves would summarize and rate the truck drivers’ comments. This statement is supported by a growing body of literature demonstrating that ChatGPT performs well in linguistic tasks, such as answering exam questions, labeling tweets and reviews, and analysis of sentiment (48, 50, 55, 56, 105, 106). The fact that texts were submitted to ChatGPT in Dutch rather than English is not necessarily a problem, as shown in several studies (107, 108). We agree with Mellon et al. (109) that the availability of large language models makes the use of open-ended questions in future questionnaires more attractive.
Nevertheless, there are some limitations to using ChatGPT. While ChatGPT is proficient in summarization and sentiment analysis [(e.g., 47, 54, 110)], it may lack domain-specific expertise (111). Moreover, its output can be sensitive to the specific wording of the prompt (47). For these reasons, we undertook a manual classification of individual comments into the four ADAS categories (Q30). This approach ensured the sentiment scores were directly relevant to the specific ADAS under evaluation.
5 Conclusion
This study provided new insights into the experiences and perceptions of Dutch professional truck drivers. The findings illustrate the need for improved working conditions and support from transport organizations, as well as greater attention to safety and security concerns, especially among international drivers.
What policy recommendations arise from this research? Truck drivers often indicate that they should receive better financial compensation. However, when we consider the entirety of this work, including Appendix B, it becomes clear that the drivers are not just concerned with monetary incentives but also with recognition and respect for their profession. The current study offers various starting points that can help improve the welfare and status of drivers, including better sanitary and parking facilities. Additionally, it is recommended to act at an international level against fuel theft, break-ins, and other forms of transport crime. In the development of new technology, the minimization of perceived intrusiveness should be a key design criterion, both in a direct sense (unnecessary automated braking interventions and alarms) and in an indirect sense (perceived intrusions in work flexibility and autonomy). Although truck drivers appreciate technologies that improve safety and efficiency, the feeling of autonomy being compromised indicates a need for less meddlesome technology.
Data availability statement
Original datasets are available in a publicly accessible repository: The original contributions presented in the study are publicly available. This data can be found here: https://doi.org/10.4121/577c120a-b5bb-4ba5-93b8-6143759d0249. Further inquiries can be directed to the corresponding author.
Ethics statement
The study was conducted in accordance with the local legislation and institutional requirements. Written informed consent for participation was not required from the participants in accordance with the local legislation and institutional requirements. Approval for analysis of the questionnaire data was provided by the TU Delft Human Research Ethics Committee (approval number 3013).
Author contributions
JW: Visualization, Validation, Supervision, Software, Project administration, Methodology, Investigation, Funding acquisition, Formal analysis, Data curation, Conceptualization, Writing – review & editing, Writing – original draft. TD: Writing – review & editing, Writing – original draft, Validation, Software, Methodology, Investigation, Formal analysis, Data curation, Conceptualization. DD: Writing – review & editing, Resources. AC: Writing – review & editing, Resources, Project administration, Methodology, Investigation, Data curation, Conceptualization.
Funding
The author(s) declare that financial support was received for the research, authorship, and/or publication of this article. The PhD study of TD was funded by the Transitions and Behavior grant 403.19.243 (“Towards Safe Mobility for All: A Data-Driven Approach”), granted to JW by the Netherlands Organization for Scientific Research (NWO).
Conflict of interest
AC is CEO of Transporteffect BV and Chauffeurnieuws. He was not involved in the current analysis and interpretation of the data.
The remaining authors declare that the research was conducted in the absence of any commercial or financial relationships that could be construed as a potential conflict of interest.
Publisher’s note
All claims expressed in this article are solely those of the authors and do not necessarily represent those of their affiliated organizations, or those of the publisher, the editors and the reviewers. Any product that may be evaluated in this article, or claim that may be made by its manufacturer, is not guaranteed or endorsed by the publisher.
Supplementary material
Appendices A and B can be found online at: https://www.frontiersin.org/articles/10.3389/fpubh.2024.1352979/full#supplementary-material
References
1. Sector Institute Transport and Logistics . Arbeidsmarktrapportage beroepsgoederenvervoer over de weg en logistiek: Instroom en inzetbaarheid [Labour market report for professional goods transport by road and logistics: Inflow and employability]. (2021). Available at: https://www.stl.nl/STL/media/STLMedia/Trends%20en%20marktontwikkelingen/Arbeidsmarktrapportage-2021_lowress.pdf (Accessed March 15, 2024).
2. Chen, GX, Sieber, WK, Lincoln, JE, Birdsey, J, Hitchcock, EM, Nakata, A, et al. NIOSH national survey of long-haul truck drivers: injury and safety. Accid Anal Prev. (2015) 85:66–72. doi: 10.1016/j.aap.2015.09.001
3. Johnson, JK, Vingilis, E, and Terry, AL. Qualitative study of long-haul truck drivers' health and healthcare experiences. J Occup Environ Med. (2021) 63:230–7. doi: 10.1097/JOM.0000000000002107
4. Shattell, M, Apostolopoulos, Y, Sönmez, S, and Griffin, M. Occupational stressors and the mental health of truckers. Issues Ment Health Nurs. (2010) 31:561–8. doi: 10.3109/01612840.2010.488783
5. Shin, DS, and Jeong, BY. Relationship between negative work situation, work-family conflict, sleep-related problems, and job dissatisfaction in the truck drivers. Sustain For. (2020) 12:8114. doi: 10.3390/su12198114
6. Statistics Netherlands . The Netherlands in numbers: which jobs often cause a poor work-life balance? (2021). p. 28. Available at: https://www.cbs.nl/-/media/_pdf/2021/48/nederland-in-cijfers_2021_boekje.pdf (Accessed March 15, 2024).
7. Williams, DF Jr, Thomas, SP, and Liao-Troth, S. The truck driver experience: identifying psychological stressors from the voice of the driver. Transp J. (2017) 56:54–76. doi: 10.5325/transportationj.56.1.0054
8. Bachmann, LH, Lichtenstein, B, St. Lawrence, JS, Murray, M, Russell, GB, and Hook, EW III. Health risks of American long distance truckers: results from a multi-site assessment. J Occup Environ Med. (2018) 60:e349:–e355. doi: 10.1097/JOM.0000000000001319
9. Dos Reis, LAP, Costa, CDD, Rodrigues, DS, and De Alcântara, KC. Obesity, hypertension and diabetes among truck drivers in the Middle-West, Brazil. Biosci J. (2017) 33:485–93. doi: 10.14393/BJ-v33n2-34285
10. Sieber, WK, Robinson, CF, Birdsey, J, Chen, GX, Hitchcock, EM, Lincoln, JE, et al. Obesity and other risk factors: the national survey of U.S. long-haul truck driver health and injury. Am J Ind Med. (2014) 57:615–26. doi: 10.1002/ajim.22293
11. Belzer, MH . Work-stress factors associated with truck crashes: An exploratory analysis. Econ Labour Relat Rev. (2018) 29:289–307. doi: 10.1177/1035304618781654
12. Hege, A, Lemke, MK, Apostolopoulos, Y, and Sönmez, S. The impact of work organization, job stress, and sleep on the health behaviors and outcomes of U.S. long-haul truck drivers. Health Educ Behav. (2019) 46:626–36. doi: 10.1177/1090198119826232
13. Useche, SA, Alonso, F, Cendales, B, and Llamazares, J. More than just “stressful”? Testing the mediating role of fatigue on the relationship between job stress and occupational crashes of long-haul truck drivers. Psychol Res Behav Manag. (2021) 14:1211–21. doi: 10.2147/PRBM.S305687
14. Wijngaards, I, Hendriks, M, and Burger, MJ. Steering towards happiness: An experience sampling study on the determinants of happiness of truck drivers. Transp Res A Policy Pract. (2019) 128:131–48. doi: 10.1016/j.tra.2019.07.017
15. Loske, D, and Klumpp, M. Intelligent and efficient? An empirical analysis of human–AI collaboration for truck drivers in retail logistics. Int J Logistics Manag. (2021) 32:1356–83. doi: 10.1108/IJLM-03-2020-0149
16. Klumpp, M . Automation and artificial intelligence in business logistics systems: human reactions and collaboration requirements. Int J Log Res Appl. (2018) 21:224–42. doi: 10.1080/13675567.2017.1384451
17. Dubljević, V, Douglas, S, Milojevich, J, Ajmeri, N, Bauer, WA, List, G, et al. Moral and social ramifications of autonomous vehicles: a qualitative study of the perceptions of professional drivers. Behav Inform Technol. (2023) 42:1271–8. doi: 10.1080/0144929X.2022.2070078
18. Jaller, M, Otero-Palencia, C, and D'Agostino, M. Jobs and automated freight transportation: How automation affects the freight industry and what to do about it (Report No. NCST-UCD-WP-22-42). Davis, CA: National Center for Sustainable Transportation (2022). doi: 10.7922/G2SX6BHW
19. Schuster, AM, Agrawal, S, Britt, N, Sperry, D, Van Fossen, JA, Wang, S, et al. Will automated vehicles solve the truck driver shortages? Perspectives from the trucking industry. Technol Soc. (2023) 74:102313. doi: 10.1016/j.techsoc.2023.102313
20. Van Fossen, JA, Chang, C-H, Ford, JK, Mack, EA, and Cotten, SR. Identifying alternative occupations for truck drivers displaced due to autonomous vehicles by leveraging the O*NET database. Am Behav Sci. (2023) 67:1693–715. doi: 10.1177/00027642221127239
21. Semeijn, J, De Waard, B, Lambrechts, W, and Semeijn, J. Burning rubber or burning out? The influence of role stressors on burnout among truck drivers. Logistics. (2019) 3:6. doi: 10.3390/logistics3010006
22. Gouribhatla, R, and Pulugurtha, SS. Drivers' behavior when driving vehicles with or without advanced driver assistance systems: a driver simulator-based study. Transport Res Interdiscipl Persp. (2022) 13:100545. doi: 10.1016/j.trip.2022.100545
23. Rahman, MM, Lesch, MF, Horrey, WJ, and Strawderman, L. Assessing the utility of TAM, TPB, and UTAUT for advanced driver assistance systems. Accid Anal Prev. (2017) 108:361–73. doi: 10.1016/j.aap.2017.09.011
24. Rossi, R, Gastaldi, M, Biondi, F, Orsini, F, De Cet, G, and Mulatti, C. A driving simulator study exploring the effect of different mental models on ADAS system effectiveness. In: L de Paolis and P Bourdot, editors. Augmented reality, virtual reality, and computer graphics. AVR 2020. Cham: Springer. (2020). 102–13. doi: 10.1007/978-3-030-58465-8_7
25. Bazilinskyy, P, Larsson, P, Johansson, E, and De Winter, JCF. Continuous auditory feedback on the status of adaptive cruise control, lane deviation, and time headway: An acceptable support for truck drivers? Acoust Sci Technol. (2019) 40:382–90. doi: 10.1250/ast.40.382
26. Fors, C, Kircher, K, and Ahlström, C. Interface design of eco-driving support systems – truck drivers' preferences and behavioural compliance. Transport Res C. (2015) 58:706–20. doi: 10.1016/j.trc.2015.03.035
27. Hickman, JS, Guo, F, Camden, MC, Hanowski, RJ, Medina, A, and Mabry, JE. Efficacy of roll stability control and lane departure warning systems using carrier-collected data. J Saf Res. (2015) 52:59–63. doi: 10.1016/j.jsr.2014.12.004
28. Teoh, ER . Effectiveness of front crash prevention systems in reducing large truck real-world crash rates. Traffic Inj Prev. (2021) 22:284–9. doi: 10.1080/15389588.2021.1893700
29. Dreger, FA, De Winter, JCF, and Happee, R. How do drivers merge heavy goods vehicles onto freeways? A semi-structured interview unveiling needs for communication and support. Cogn Tech Work. (2020) 22:825–42. doi: 10.1007/s10111-019-00601-3
30. Fagerlönn, J . Urgent alarms in trucks: effects on annoyance and subsequent driving performance. IET Intell Transp Syst. (2011) 5:252–8. doi: 10.1049/iet-its.2010.0165
31. Morton, R, Richards, D, Dunn, N, and Coulton, P. Questioning the social and ethical implications of autonomous vehicle technologies on professional drivers. Des J. (2019) 22:2061–71. doi: 10.1080/14606925.2019.1594930
32. Svenson, A. L., Grove, K., Atwood, J., and Blanco, M. Using naturalistic data to evaluate heavy vehicle crash avoidance systems performance. Proceedings of the 25th international technical conference on the enhanced safety of vehicles (ESV). National Highway Traffic Safety Administration, Detroit, MI. (2017). Available at: https://www-esv.nhtsa.dot.gov/Proceedings/25/25ESV-000231.pdf
33. Ostermann, B., Koppenborg, M., Staffel, M., Paridon, H., Hofmann, S., Ahrends-Krossner, G., et al. Kamera-monitor-systeme (KMS) zur Vermeidung von Abbiegeunfällen. Kriterien für die Eignung von Kamera-Monitor Systemen in LKW zur Vermeidung von Rechtsabbiegeunfällen [Camera Monitor Systems (CMS) to prevent turning accidents. Criteria for the suitability of Camera Monitor Systems in trucks to prevent right-turn accidents] BG Verkehr. (2016). Available at: https://www.bg-verkehr.de/redaktion/medien-und-downloads/broschueren/branchen/gueterkraftverkehr/bgverkehr_kms_a4_studie_komplett.pdf (Accessed March 15, 2024).
34. Anderson, NJ, Smith, CK, and Byrd, JL. Work-related injury factors and safety climate perception in truck drivers. Am J Ind Med. (2017) 60:711–23. doi: 10.1002/ajim.22737
35. Chen, GX, Sieber, WK, Collins, JW, Hitchcock, EM, Lincoln, JE, Pratt, SG, et al. Truck driver reported unrealistically tight delivery schedules linked to their opinions of maximum speed limits and hours-of-service rules and their compliance with these safety laws and regulations. Saf Sci. (2021) 133:105003. doi: 10.1016/j.ssci.2020.105003
36. Delhomme, P, and Gheorghiu, A. Perceived stress, mental health, organizational factors, and self-reported risky driving behaviors among truck drivers circulating in France. J Saf Res. (2021) 79:341–51. doi: 10.1016/j.jsr.2021.10.001
37. Reiman, A, Forsman, M, Målqvist, I, Parmsund, M, and Lindahl Norberg, A. Risk factors contributing to truck drivers' non-driving occupational accidents. Int J Phys Distribut Logist Manag. (2018) 48:183–99. doi: 10.1108/IJPDLM-06-2017-0216
38. Ji-Hyland, C, and Allen, D. What do professional drivers think about their profession? An examination of factors contributing to the driver shortage. Int J Log Res Appl. (2022) 25:231–46. doi: 10.1080/13675567.2020.1821623
39. Transporteffect . De vuist. Grootste enquête ooit onder de beroepschauffeurs. Resultaten enquête [The Fist. The largest survey ever among professional drivers. Survey results]. (2021). Available at: https://transporteffect.com/wp-content/uploads/2021/12/Enquete-Transporteffect-Chauffeursnieuws-1.pdf (Accessed March 15, 2024).
40. European Commission . Mobility package I. (2022). Available at: https://transport.ec.europa.eu/transport-modes/road/mobility-package-i_en (Accessed March 15, 2024).
41. Fabrigar, LR, Wegener, DT, MacCallum, RC, and Strahan, EJ. Evaluating the use of exploratory factor analysis in psychological research. Psychol Methods. (1999) 4:272–99. doi: 10.1037/1082-989X.4.3.272
42. Zhu, M, and Ghodsi, A. Automatic dimensionality selection from the scree plot via the use of profile likelihood. Comput Stat Data Anal. (2006) 51:918–30. doi: 10.1016/j.csda.2005.09.010
43. Braun, V, and Clarke, V. Using thematic analysis in psychology. Qual Res Psychol. (2006) 3:77–101. doi: 10.1191/1478088706qp063oa
44. Krippendorff, K . Content analysis: An introduction to its methodology. Thousand Oaks, CA: Sage Publications (2004).
45. Kitto, K., Manly, C. A., Ferguson, R., and Poquet, O. Towards more replicable content analysis for learning analytics. Proceedings of Learning Analytics and Knowledge 2023. Arlington, TX. (2023). doi: 10.1145/3576050.3576096
46. Roberts, K, Dowell, A, and Nie, J-B. Attempting rigour and replicability in thematic analysis of qualitative research data; a case study of codebook development. BMC Med Res Methodol. (2019) 19:66. doi: 10.1186/s12874-019-0707-y
47. Bubeck, S, Chandrasekaran, V, Eldan, R, Gehrke, J, Horvitz, E, Kamar, E, et al. Sparks of artificial general intelligence: early experiments with GPT-4. arXiv. (2023). doi: 10.48550/arXiv.2303.12712
48. De Winter, JCF . Can ChatGPT pass high school exams on English language comprehension? Int J Artif Intell Educ. (2023). doi: 10.1007/s40593-023-00372-z
49. Liu, H, Ning, R, Teng, Z, Liu, J, Zhou, Q, and Zhang, Y. Evaluating the logical reasoning ability of ChatGPT and GPT-4. arXiv. (2023). doi: 10.48550/arXiv.2304.03439
50. OpenAI . GPT-4 technical report. (2023). Available at: https://cdn.openai.com/papers/gpt-4.pdf (Accessed March 15, 2024).
51. Laban, P, Kryściński, W, Agarwal, D, Fabbri, AR, Xiong, C, Joty, S, et al. SUMMEDITS: measuring LLM ability at factual reasoning through the lens of summarization. In: H Bouamor, J Pino, and K Bali, editors. Proceedings of the 2023 Conference on Empirical Methods in Natural Language Processing. Singapore: Association for Computational Linguistics (2023). 9662–76. doi: 10.18653/v1/2023.emnlp-main.600
52. Van Veen, D, Van Uden, C, Blankemeier, L, Delbrouck, J-B, Aali, A, Bluethgen, C, et al. Clinical text summarization: adapting large language models can outperform human experts. Nat Med. (2024). doi: 10.1038/s41591-024-02855-5
53. Pu, X, Gao, M, and Wan, X. Summarization is (almost) dead. arXiv. (2023). doi: 10.48550/arXiv.2309.09558
54. Tabone, W, and De Winter, J. Using ChatGPT for human–computer interaction research: a primer. R Soc Open Sci. (2023) 10:231053. doi: 10.1098/rsos.231053
55. Gilardi, F, Alizadeh, M, and Kubli, M. ChatGPT outperforms crowd workers for text-annotation tasks. Proc Natl Acad Sci. (2023) 120:e2305016120. doi: 10.1073/pnas.2305016120
56. Törnberg, P . ChatGPT-4 outperforms experts and crowd workers in annotating political twitter messages with zero-shot learning. arXiv. (2023). doi: 10.48550/arXiv.2304.06588
57. Wang, Z, Xie, Q, Ding, Z, Feng, Y, and Xia, R. Is ChatGPT a good sentiment analyzer? A preliminary study. arXiv. (2023). doi: 10.48550/arXiv.2304.04339
58. Tang, R, Zhang, X, Ma, X, Lin, J, and Ture, F. Found in the middle: permutation self-consistency improves listwise ranking in large language models. arXiv. (2023). doi: 10.48550/arXiv.2310.07712
59. Saris, WE, Revilla, M, Krosnick, JA, and Shaeffer, EM. Comparing questions with agree/disagree response options to questions with construct-specific response options. Survey Res Methods. (2010) 4:61–79. doi: 10.18148/srm/2010.v4i1.2682
60. De Winter, JCF, Dodou, D, and Wieringa, PA. Exploratory factor analysis with small sample sizes. Multivar Behav Res. (2009) 44:147–81. doi: 10.1080/00273170902794206
61. Gittleman, M, and Monaco, K. Truck-driving jobs: are they headed for rapid elimination? ILR Rev. (2020) 73:3–24. doi: 10.1177/0019793919858079
62. De Leeuw,, van Weenen, R, Newton, S, Menist, M, Maas, F, Penasse, D, et al. Study on safe and secure parking places for trucks (Technical Report). Brussels: European Commission (2019). doi: 10.2832/067535
63. García, BG, and Insa, EM. MindFuel–product-service system implementation for truck fueling optimization business case (MSc thesis). Gothenburg: Chalmers University of Technology (2017).
64. Parliament, UK . Migrants in Calais. (2015). Available at: https://publications.parliament.uk/pa/cm201415/cmselect/cmhaff/902/90203.htm (Accessed March 15, 2024).
65. Friswell, R, and Williamson, A. Comparison of the fatigue experiences of short haul light and long distance heavy vehicle drivers. Saf Sci. (2013) 57:203–13. doi: 10.1016/j.ssci.2013.02.014
66. Grove, K, Camden, MC, Krum, A, and Hanowski, RJ. Research and testing to accelerate voluntary adoption of automatic emergency braking (AEB) on commercial vehicles (Report No. FMCSA-RRT-18-013). Washington DC: Federal Motor Carrier Safety Administration, U.S. Department of Transportation (2020). Available at: https://rosap.ntl.bts.gov/view/dot/49335 (Accessed March 15, 2024).
67. An, S, Lee, S, Park, G, Lee, H, Son, M, and Beck, D. User perception and ergonomic display layout design of truck camera monitor system. SSRN. (2023). doi: 10.2139/ssrn.4334589
68. Driessen, T, Dodou, D, De Waard, D, and De Winter, JCF. Predicting damage incidents, fines, and fuel consumption from truck driver data: a study from the Netherlands. Transp Res Rec. (2024). doi: 10.1177/03611981231211897
69. Picco, A, Stuiver, A, De Winter, JCF, and De Waard, D. The use of monitoring and feedback devices in driving: An assessment of acceptability and its key determinants. Transport Res F. (2023) 92:1–14. doi: 10.1016/j.trf.2022.10.021
70. Nordhoff, S., and De Winter, J. C. F. Why do drivers and automation disengage the automation? Results from a study among Tesla users. arXiv. (2023). doi: 10.48550/arXiv.2309.10440
71. Parasuraman, R, and Riley, V. Humans and automation: Use, misuse, disuse, abuse. Hum Factors. (1997) 39:230–53. doi: 10.1518/001872097778543886
72. Hancock, PA . Some pitfalls in the promises of automated and autonomous vehicles. Ergonomics. (2019) 62:479–95. doi: 10.1080/00140139.2018.1498136
74. Rahman, MA, and Mekker, M. Development of educational materials for the public and first responders on the limitations of advanced driving assistance systems (Report No. UT-22.11). Salt Lake City, UT: Utah Department of Transportation (2022). Available at: https://rosap.ntl.bts.gov/view/dot/64860 (Accessed March 15, 2024).
75. Souman, J, Van Weperen, M, Hogema, J, Hoedemaeker, M, Westerhuis, F, Stuiver, A, et al. Human factors guidelines report 3: Use and mental models (Report No. R12165). Amsterdam: TNO Human Factors Research Institute (2021). Available at: https://hdl.handle.net/11370/9b42ef9c-d063-4252-9b00-f483e84f78a3
76. McDonald, A., Carney, C., and McGehee, D. V. Vehicle owners' experiences with and reactions to advanced driver assistance systems. AAA Foundation for Traffic Safety (2018). Available at: http://aaafoundation.org/wp-content/uploads/2018/09/VehicleOwnersExperiencesWithADAS_TechnicalReport.pdf
77. Trimble, TE, Baker, SA, Russell, SM, and Tidwell, S. Consumer driving automation system education: A learning and retention assessment (Report No. 20-UO-089). Blacksburg, VI: Virginia Tech Transportation Institute (2020). Available at: http://hdl.handle.net/10919/99302
78. Grove, K, Atwood, J, Blanco, M, Krum, A, and Hanowski, R. Field study of heavy vehicle crash avoidance system performance. SAE Int J Transport Safety. (2017) 5:1–12. doi: 10.4271/2016-01-8011
79. Regulation 661/2009 . Regulation (EC) No 661/2009 of the European Parliament and of the Council of 13 July 2009 concerning type-approval requirements for the general safety of motor vehicles, their trailers and systems, components and separate technical units intended therefor. (2009). Available at: https://eur-lex.europa.eu/eli/reg/2009/661/oj
80. Regulation 2019/2144 . Regulation (EU) 2019/2144 of the European Parliament and of the Council of 27 November 2019 on type-approval requirements for motor vehicles and their trailers, and systems, components and separate technical units intended for such vehicles, as regards their general safety and the protection of vehicle occupants and vulnerable road users. (2019). Available at: https://eur-lex.europa.eu/eli/reg/2019/2144/oj
81. Sperry, D, Schuster, AM, Cotten, SR, Agrawal, S, Mack, E, Britt, N, et al. Trucking in the era of COVID-19. Am Behav Sci. (2022):000276422110660. doi: 10.1177/00027642211066039
82. Berge, S. H., De Winter, J., Feng, Y., and Hagenzieker, M. Phantom braking in automated vehicles: A theoretical outline and cycling simulator demonstration. 15th International Conference on Applied Human Factors and Ergonomics, Nice, France (2024).
83. Brookhuis, K., and De Waard, D. On the assessment of criteria for driver impairment; in search of the golden yardstick for driving performance. Proceedings of the Second International Driving Symposium on Human Factors in Driver Assessment, Training and Vehicle Design. University of Iowa (2003). doi: 10.17077/drivingassessment.1081
84. Ayoub, J., Wang, Z., Li, M., Guo, H., Sherony, R., Bao, S., et al. Cause-and-effect analysis of ADAS: A comparison study between literature review and complaint data. Proceedings of the 14th International Conference on Automotive User Interfaces and Interactive Vehicular Applications. Seoul, Republic of Korea. (2022). 139–49. doi: 10.1145/3543174.3547117
85. Kidd, DG, Cicchino, JB, Reagan, IJ, and Kerfoot, LB. Driver trust in five driver assistance technologies following real-world use in four production vehicles. Traffic Inj Prev. (2017) 18:S44–50. doi: 10.1080/15389588.2017.1297532
86. De Winter, JCF, Petermeijer, SM, and Abbink, DA. Shared control versus traded control in driving: a debate around automation pitfalls. Ergonomics. (2023) 66:1494–520. doi: 10.1080/00140139.2022.2153175
87. Roozendaal, J, Johansson, E, De Winter, J, Abbink, D, and Petermeijer, S. Haptic lane-keeping assistance for truck driving: a test track study. Hum Factors. (2021) 63:1380–95. doi: 10.1177/0018720820928622
88. Statistics Netherlands . Psycho-sociale arbeidsbelasting werknemers; beroep (data for 2022). (2023). Available at: https://www.cbs.nl/nl-nl/cijfers/detail/84436NED (Accessed March 15, 2024).
89. Jiang, C, Lu, L, and Lu, JJ. Socioeconomic factors affecting the job satisfaction levels of self-employed container truck drivers: a case study from Shanghai port. Marit Policy Manag. (2017) 44:641–56. doi: 10.1080/03088839.2017.1326182
90. Koul, S., and Singh, A. Mapping vulnerabilities of Indian long-haul truck drivers. Proceedings of the 2022 IEEE International Conference on Service Operations and Logistics, and Informatics (SOLI). Delhi, India (2022). doi: 10.1109/SOLI57430.2022.10294623
91. Pritchard, E, Van Vreden, C, Xia, T, Newnam, S, Collie, A, Lubman, DI, et al. Impact of work and coping factors on mental health: Australian truck drivers’ perspective. BMC Public Health. (2023) 23:1090. doi: 10.1186/s12889-023-15877-4
92. Sabir, AA, Shahru, A, Isha, NB, Langove, N, and Javaid, MU. An integrative approach to study drivers perceived stress on aberrant driving behaviour: the mediation role of driver fatigue. SHS Web of Conferences. (2018) 56:02009. doi: 10.1051/shsconf/20185602009
93. Wadley, AL, Iacovides, S, Roche, J, Scheuermaier, K, Venter, WDF, Vos, AG, et al. Working nights and lower leisure-time physical activity associate with chronic pain in Southern African long-distance truck drivers: a cross-sectional study. PLoS One. (2020) 15:e0243366. doi: 10.1371/journal.pone.0243366
94. Kishore Bhoopalam, A, Van den Berg, R, Agatz, N, and Chorus, C. The long road to automated trucking: insights from driver focus groups. SSRN. (2021). doi: 10.2139/ssrn.3779469
95. Ruiner, C, and Klumpp, M. Autonomy and new modes of control in digital work contexts – a mixed-methods study of driving professions in food logistics. Employee Relations. (2022) 44:890–912. doi: 10.1108/ER-04-2021-0139
96. Shifrin, NV, and Michel, JS. Flexible work arrangements and employee health: a meta-analytic review. Work Stress. (2022) 36:60–85. doi: 10.1080/02678373.2021.1936287
97. Friswell, R, and Williamson, A. Management of heavy truck driver queuing and waiting for loading and unloading at road transport customers' depots. Saf Sci. (2019) 120:194–205. doi: 10.1016/j.ssci.2019.06.039
98. Grytnes, R, Shibuya, H, Dyreborg, J, Grøn, S, and Cleal, B. Too individualistic for safety culture? Non-traffic related work safety among heavy goods vehicle drivers. Transport Res F. (2016) 40:145–55. doi: 10.1016/j.trf.2016.04.012
99. Gray, G . A bird's eye view of driving safety culture: truck drivers' perceptions of unsafe driving behaviors near their trucks. Work. (2019) 64:187–94. doi: 10.3233/WOR-192985
100. Häkkänen, H, and Summala, H. Fatal traffic accidents among trailer truck drivers and accident causes as viewed by other truck drivers. Accid Anal Prev. (2001) 33:187–96. doi: 10.1016/S0001-4575(00)00030-0
101. Huang, Y-H, Roetting, M, McDevitt, JR, Melton, D, and Smith, GS. Feedback by technology: attitudes and opinions of truck drivers. Transport Res F. (2005) 8:277–97. doi: 10.1016/j.trf.2005.04.005
102. De Winter, J, and Nordhoff, S. Acceptance of conditionally automated cars: just one factor? Transport Res Interdiscipl Persp. (2022) 15:100645. doi: 10.1016/j.trip.2022.100645
103. Krosnick, JA . Survey research. Annu Rev Psychol. (1999) 50:537–67. doi: 10.1146/annurev.psych.50.1.537
104. Podsakoff, PM, MacKenzie, SB, Lee, J-Y, and Podsakoff, NP. Common method biases in behavioral research: a critical review of the literature and recommended remedies. J Appl Psychol. (2003) 88:879–903. doi: 10.1037/0021-9010.88.5.879
105. Nori, H, King, N, McKinney, SM, Carignan, D, and Horvitz, E. Capabilities of GPT-4 on medical challenge problems. arXiv. (2023). doi: 10.48550/arXiv.2303.13375
106. Zhang, J., Chen, Y., Liu, C., Niu, N., and Wang, Y. Empirical evaluation of ChatGPT on requirements information retrieval under zero-shot setting. Proceedings of the 2023 International conference on intelligent computing and next generation networks (ICNGN). Hangzhou, China. (2023). doi: 10.1109/ICNGN59831.2023.10396810
107. Lai, V, Ngo, N, Pouran Ben Veyseh, A, Man, H, Dernoncourt, F, Bui, T, et al. ChatGPT beyond English: towards a comprehensive evaluation of large language models in multilingual learning. In: H Bouamor, J Pino, and K Bali, editors. Proceedings of the 2023 Conference on Empirical Methods in Natural Language Processing. Singapore: Association for Computational Linguistics (2023). 13171–89. doi: 10.18653/v1/2023.findings-emnlp.878
108. Tan, Y, Min, D, Li, Y, Li, W, Hu, N, Chen, Y, et al. Evaluation of ChatGPT as a question answering system for answering complex questions. arXiv. (2023). doi: 10.48550/arXiv.2303.07992
109. Mellon, J, Bailey, J, Scott, R, Breckwoldt, J, Miori, M, and Schmedeman, P. Do AIs know what the most important issue is? Using language models to code open-text social survey responses at scale. Res Polit. (2024) 11:1468. doi: 10.1177/20531680241231468
110. Zhao, WX, Zhou, K, Li, J, Tang, T, Wang, X, Hou, Y, et al. A survey of large language models. arXiv. (2023). doi: 10.48550/arXiv.2303.18223
111. Li, X., Chan, S., Zhu, X., Pei, Y., Ma, Z., Liu, X., et al. Are ChatGPT and GPT-4 general-purpose solvers for financial text analytics? A study on several typical tasks. In: M Wang and I Zitouni, editors. Proceedings of the 2023 Conference on Empirical Methods in Natural Language Processing: Industry Track. Singapore: Association for Computational Linguistics (2023). 408–22. doi: 10.18653/v1/2023.emnlp-industry.39
Keywords: professional drivers, work pressure perception, safety, truck drivers, vehicle technologies
Citation: de Winter J, Driessen T, Dodou D and Cannoo A (2024) Exploring the challenges faced by Dutch truck drivers in the era of technological advancement. Front. Public Health. 12:1352979. doi: 10.3389/fpubh.2024.1352979
Edited by:
Maria Malliarou, University of Thessaly, GreeceReviewed by:
Marco Tagliabue, Oslo Metropolitan University, NorwayAsrar Ahmed Sabir, University of Education Lahore, Pakistan
Copyright © 2024 de Winter, Driessen, Dodou and Cannoo. This is an open-access article distributed under the terms of the Creative Commons Attribution License (CC BY). The use, distribution or reproduction in other forums is permitted, provided the original author(s) and the copyright owner(s) are credited and that the original publication in this journal is cited, in accordance with accepted academic practice. No use, distribution or reproduction is permitted which does not comply with these terms.
*Correspondence: Joost de Winter, ai5jLmYuZGV3aW50ZXJAdHVkZWxmdC5ubA==
†These authors share first authorship