 Christopher D. Pfledderer1*
 Denver M. Y. Brown2
 Nalini Ranjit1
 Andrew E. Springer1
 Raja I. Malkani3Deborah Salvo4
 Deanna M. Hoelscher1
- 1Department of Health Promotion and Behavioral Sciences, Michael & Susan Dell Center for Healthy Living, University of Texas Health Science Center Houston (UTHealth Houston) School of Public Health in Austin, Austin, TX, United States
- 2Department of Psychology, The University of Texas at San Antonio, San Antonio, TX, United States
- 3Michael & Susan Dell Center for Healthy Living, University of Texas Health Science Center Houston School of Public Health in Austin, Austin, TX, United States
- 4Department of Kinesiology and Health Education, College of Education, The University of Texas at Austin, Austin, TX, United States
Background: Less than one-quarter of US children meet physical activity (PA) guidelines. Understanding the context in which PA occurs and how these contexts may play a role in meeting PA guidelines is an essential step toward developing effective behavioral interventions. The purpose of this study was to examine associations between PA context (sports participation, participation in other organized physical activities, active travel to school, and outdoor play) and the number of days children met PA guidelines in a representative sample of children living in Texas.
Methods: We analyzed cross-sectional data from a statewide sample of fourth-grade children in Texas who completed the 2019–2020 Texas School Physical Activity and Nutrition (Texas SPAN) survey. The Texas SPAN survey was designed to monitor the statewide prevalence of overweight/obesity among school children and assess habitual self-reported obesity-related behaviors, including diet and PA. Weighted Poisson regression models were employed to examine the associations between PA contexts (sports participation, participation in other organized physical activities, active travel to school, and outdoor play) and the number of days children met PA guidelines, adjusting for sex, race/ethnicity, overweight/obesity, urban–rural status, and economic disadvantage.
Results: A total of 16.7% of fourth-grade children met physical activity guidelines every day during the week (mean age = 9.4 ± 0.6 years; female = 48.7, 51.8% Hispanic, mean days meeting PA guideline = 3.6 ± 2.3 days). One in ten (11.2%) children did not meet daily PA guidelines on any day of the week, and 72.1% met them between 1 and 6 days. Participating in sports (b = 0.22, 95%CI:0.14, 0.30), any other organized physical activities (b=0.13, 95%CI:0.017, 0.19), and playing outdoors 1–3 days (b = 0.25, 95%CI:0.04, 0.46) and 4–7 days in the past week (b = 0.77, 95%CI:0.57, 0.97) was significantly and positively associated with the number of days children met PA guidelines.
Conclusion: Participating in sports, participating in other organized physical activities, and playing outdoors may beneficially influence the number of days children meet PA guidelines. PA programs should consider these contextual factors and investigate how to promote organized activities and outdoor play effectively and appropriately among children.
Introduction
Physical activity (PA) is associated with many health outcomes in children including fitness and cardiovascular health (1), cognitive functioning, depression, and other mental health outcomes (2), and metabolic outcomes including overweight and obesity (3, 4). Current national guidelines from the American Heart Association and the Centers for Disease Control recommend children aged 6–17 years accrue at least 60 min of moderate-to-vigorous physical activity (MVPA) daily (5–8), yet based on current observational research, most children do not meet this daily recommendation (9). Furthermore, while there have been many high-quality PA interventions designed for and delivered to children, many with multiple components including buy-in from schools, families, and communities, few have been able to make a substantial impact on children’s PA (10–14). There is a need for more informative observational research to guide the development of these interventions in an effort to increase the proportion of children meeting PA guidelines in the US.
Children are exposed to a variety of opportunities (i.e., contexts) to accrue PA throughout their day, including physical education, recess, after-school programs, sports and other out-of-school structured activities, active travel, and unstructured free play at home and outdoors. These contexts differ in the degree to which they are structured, how they are made available to children, and their environmental and social correlates (10, 11, 13, 15–18). For example, sports participation is often delivered as a structured PA opportunity, overseen by adults at set times during the day/week, and often involves larger groups of children participating at one time (15, 16). There is also often a cost associated with sports participation, potentially limiting the opportunity for children from families who cannot afford it (19). Conversely, unstructured outdoor play (free play) is more likely done at recess or around the home environment, is rarely supervised, and often involves fewer children participating together at one time (20). While technically free from any associated monetary cost, playing outdoors may have other barriers including neighborhood safety and/or limited access to parks, recreation facilities, or play equipment at the home (20–23).
Understanding the differential influence of these contexts on children’s PA guideline adherence is key when designing maximally effective behavioral interventions targeting PA, as this could provide a way to identify potential intervention components that will have the best chance at “moving the needle.” There are many examples of PA-based interventions using different types of contexts as their mode of delivery including sports, after-school programs, and recess. Technically, differential success across these programs (10–13) should allow us to make some inferences regarding how different contexts may influence PA from these intervention studies. However, it is difficult to compare different contexts across studies due to unquantifiable heterogeneity. Additionally, we are not aware of any interventions that have been designed to compare how PA contexts may differentially impact PA outcomes in children (i.e., compare the effect of a sports intervention to a recess intervention). Thus, cross-sectional, observational data remain the only viable source of inference regarding these questions. Even though such data do not permit causal inference, it does provide the opportunity to compare PA behaviors across contexts with the same sample of participants in a naturalistic setting. It is also important to identify how differences in key demographics, like sex and socioeconomic status, play a role in PA context, as these may influence the dose of individual contexts children receive. For example, sports and other out-of-school structured activities are cost prohibitive, and certain PA contexts, like outdoor play and active travel, may be viewed by parents as more or less dangerous depending on the sex of the child, resulting in both socioeconomic and sex-based differences in PA context (23–27).
The Texas School Physical Activity and Nutrition (Texas SPAN) survey provides a unique opportunity to explore how different PA contexts associate with children meeting daily PA guidelines and to identify socioeconomic and sex-based differences in daily PA guideline adherence and differences in PA engagement across several contexts at a representative statewide level. While there have been previous studies exploring contextual factors associated with PA in children (17), and even some comparing PA engagement across contexts (28), most use small samples and have limited generalizability. Texas ranks 10th for rates of childhood obesity (29) and is home to nearly 7.5 million children, accounting for 10% of the entire US population of children (30), underscoring the need for more informative, large-scale, obesity-related behavioral research in this region. Therefore, the purpose of this study was to examine associations between PA contexts (sports participation and other out-of-school structured physical activities, active travel to school, and outdoor play), and the number of days fourth-grade children met PA guidelines in a representative sample of children living in Texas using data from the 2019–2020 Texas SPAN survey.
Methods
Study design
The Texas SPAN survey is a cross-sectional survey designed to monitor the statewide prevalence of children with overweight/obesity via objective measures of height and weight and assess habitual self-reported health-related behavioral outcomes, including diet and PA. It uses a stratified, multi-stage sampling plan to produce representative data for second-, fourth-, eighth-, and 11th-grade students in the state of Texas. The current study uses data collected from fourth graders during the 2019–2020 cycle of data collection. The Committee for the Protection of Human Subjects at the University of Texas Health Science Center at Houston (UTHealth Houston) (HSC-SPH-18-0432), the Texas Department of State Health Services Institutional Review Board, and local school district review committees reviewed and approved all study-related activities for Texas SPAN survey. Specific methodology is briefly described below, but detailed descriptions of the study have been reported elsewhere (31).
Data collection and sampling
The Texas SPAN survey is a self-administered survey questionnaire administered to second-, fourth-, eighth-, and 11th-grade students in Texas. Survey items include questions about demographic characteristics, nutrition, PA, screen time, and dental habits. The survey has been previously tested for reliability and reproducibility (32). In addition to questionnaire items, Texas SPAN collects objective measures of height and weight used to calculate body mass index (BMI). Specific details on data collection methods have been reported elsewhere (31). Briefly, the Texas SPAN project is conducted, and data are collected by researchers at the Michael and Susan Dell Center for Healthy Living at the University of Texas Health Science Center Houston, School of Public Health in Austin. Data collection consists of survey administration and measurement of student’s height and weight to calculate BMI. All data collection procedures are completed in participating schools. A detailed process overview of all recruitment and data collection procedures has been published elsewhere (33). The stratified, multi-stage sampling of the Texas SPAN survey and statewide representativeness of the data is achieved by collecting representative data in each of Texas’ eight public health regions (PHRs) and by using data obtained from Texas Education Agency (TEA) on public school enrollment to create the sampling frame (weighting structure) for the study. The PHRs in Texas include: 1 (Lubbock area), 2/3 (Dallas area), 4/5 (Tyler area), 5/6 (Houston area), 7 (Austin area), 8 (San Antonio area), 9/10 (El Paso area), and 11 (Brownsville area). A comprehensive map of the Texas PHRs sampled has been previously published (33).
Participants
The 2019–2020 Texas SPAN survey included a total of 8,710 participants in second, fourth, eighth, and 11th grades, representing a weighted sample of 1,407,016 students. The total number of fourth-grade participants, which is the sample used in the current study, was 2,897, representing a weighted sample of 355,314 fourth-grade children across Texas. The inclusion criteria for this study were the presence of completed measures of all variables of interest, which are described below in the Measures section. It is worth noting that all data were collected prior to the onset of the coronavirus disease 2019 (COVID-19) pandemic, which is why the total sample included is less than previous years, but also means estimates/results need not be interpreted through the lens of the pandemic.
Measures
The following section details the specific measures of the Texas SPAN survey used for this study, which included PA, contexts of PA, weight status, and various demographic variables. This section also includes descriptions of how data were processed to create variables prior to analyses.
Physical activity
The number of days children met PA guidelines served as the main outcome of this study and was assessed by asking participants “Last week, on which days were you physically active for a total of at least 60 min per day?.” This was followed up by an explanatory sentence which stated, “Add up all the time you spent in any kind of physical activity that increased your heart rate and made you breathe hard some of the time.” Examples of physical activities were also included to aid participants’ understanding of the questions, including illustrations of activities such as basketball, soccer, running, fast dancing, swimming, tennis, and bicycling. Participants were then provided a list of each day of the week and were instructed to select all days in which they were physically active for at least 60 min that day. The number of days participants indicated they were physically active for at least 60 min per day was counted across all seven days of the week (range: 0–7) and served as the outcome variable for this study.
Contexts of PA
The Texas SPAN survey provides several questions related to PA context including sports participation, participation in other structured physical activities, mode of travel to school, and outdoor play. These variables were treated as the primary predictor variables for this study and are detailed below.
Sports participation
Participation in sports was assessed with one question which asked, “During the past 12 months, on how many sports teams did you play?,” with explicit instructions to not count physical education class. Response options included “0 teams,” “1 team,” “2 teams,” and “3 or more teams.”
Other organized physical activities
Participation in other organized physical activities was assessed with one question which asked, “Do you currently take part in any other organized physical activities, lessons, or classes?,” with response options of “Yes” and “No.” Examples of structured physical activities were also listed along with this question and included activities such as martial arts, dance, and gymnastics.
Mode of travel to school
Participants mode of travel to school was assessed by asking participants, “On most days, how do you arrive at school,” followed by several options including “walk,” “bike,” “school bus,” “city bus,” and “car.” Prior to analyses, responses were recoded to a binary ‘active travel’ variable in which walking and biking were considered active travel (1) and all other options were considered non-active travel (0).
Outdoor play
The number of days participants engaged in outdoor play was assessed by asking, “Last week, on which days did you play outdoors for 30 min or more?.” Participants were then provided with a list of each day of the week and were instructed to select all days on which they played outdoors. The number of days participants indicated they played outdoors was totaled across all seven days of the week and then recoded as a categorical variable with three levels: 1 = 0 days, 2 = 1–3 days, 3 = 4–7 days.
Weight status
Objective measures of height and weight were used to calculate body mass index (BMI) for each participant using SAS code provided by the Centers for Disease Control and Prevention (CDC) (34) and were further classified as obesity, overweight, and healthy weight, using the CDC growth charts and current recommendations (35). Prior to analyses, a binary variable was created by collapsing obesity and overweight into one category (overweight and obesity [OWOB]) and leaving healthy weight as a separate category. Methods for collecting height and weight data during the Texas SPAN survey administration have been reported elsewhere in detail (31). Briefly, height was recorded in centimeters with a stadiometer, and weight was recorded in kilograms using a calibrated top-loading scale. Height and weight measurements were taken after participants completed the written portion of the SPAN survey and were recorded directly on the questionnaire form.
Demographic variables
Sex
Participant sex was determined with a single question which asked. “Are you a boy or girl?,” followed by the response options of “Boy” and “Girl.”
Race/ethnicity
The race/ethnicity of participants was determined with a single question which asked, “How do you describe yourself?.” Response options included “Black or African American,” “Latino, Hispanic, or Mexican American,” “White, Caucasian, or Anglo,” “Asian,” “American Indian or Alaska Native,” and “Native Hawaiian or Other Pacific Islander.” Prior to analyses, these responses were reduced to a three-category variable, which included “African American,” “Hispanic,” and “White/Other.”
Urban–rural status
A three-level categorical variable for urban–rural status was determined by leveraging data from the TEA and applying it to school districts located within each of Texas’s eight administrative PHRs. The two largest school districts in each PHR were designated as “Major Urban” districts. School districts from counties with populations above 50,000 were designated as “Urban” districts, and all other school districts not categorized as Major Urban or Urban were designated as “Rural.”
Economic disadvantage
Data provided by the TEA were used to calculate the percentage of children whose family qualified for federal assistance programs by school. Economic disadvantage is categorized by the TEA to include qualifying for free or reduced meals under the National School Lunch and Child Nutrition Program (36, 37) and/or families with an annual income at or below the United States poverty threshold (38). Prior to analyses, a second binary variable was created by performing a median split on the percentage of children whose family qualified for federal assistance programs by school. This variable was coded as “Higher Economic Disadvantage” and “Lower Economic Disadvantage” and was used to categorize participants prior to conducting subgroup Poisson regression analyses. This variable served as the proxy for socioeconomic status.
Statistical analysis
The complex sampling plan of the Texas SPAN survey data, which is reported in detail elsewhere (39), was accounted for using STATA’s ‘svyset’ prefix command, and missing data were not imputed. Weighted analyses used the Taylor series linearization variance estimation (40). Both the weighted and unweighted prevalence of all descriptive variables were calculated for the total sample and boys and girls separately. Descriptive statistics were compared between boys and girls using Chi-square tests for categorical variables and t-tests for continuous variables. McNemar’s test was used to compare the proportion of days PA guidelines were met between weekdays and weekend days. Weighted Poisson regression models were employed to examine the associations between PA contexts (participation in organized sports, participation in any other organized PA, active travel to school, and outdoor play) and the number of days children met PA guidelines in the past week, adjusting for sex, race/ethnicity, OWOB, urban–rural status, and economic disadvantage. Weighted Poisson regression models were chosen to account for the weighted nature of the data and the fact that the primary outcome (number of days meeting PA guidelines) is a form of count data (41). Weighted Poisson regression models were employed for (1) the total sample, (2) for boys and girls separately, (3) for higher and lower economic disadvantage separately, and (4) boys × higher economic disadvantage, boys × lower economic disadvantage, girls × higher economic disadvantage, and girls × lower economic disadvantage separately. Separate models for boys, girls, and higher/lower socioeconomic disadvantage were chosen because sex and socioeconomic status have been shown to associate with PA in children (17, 24–26, 42). All analyses had significance established at an alpha level of p < 0.05 and were carried out using STATA v18.0 (StataCorp LP, College Station, Texas, United States).
Results
Demographic characteristics and weight status
Total sample
All characteristics for the total sample are shown in Table 1 as unweighted counts/means and weighted percentages. Briefly, the sample of fourth-grade children (n = 2,897, weighted N = 355,314) was 9.4 ± 0.6 years of age, 50.6% male, and 51.8% Hispanic. Most children lived in either major urban (68.4%) or urban (22.4%) areas, and the average percentage of economic disadvantage by school was 70.5 ± 18.8%.
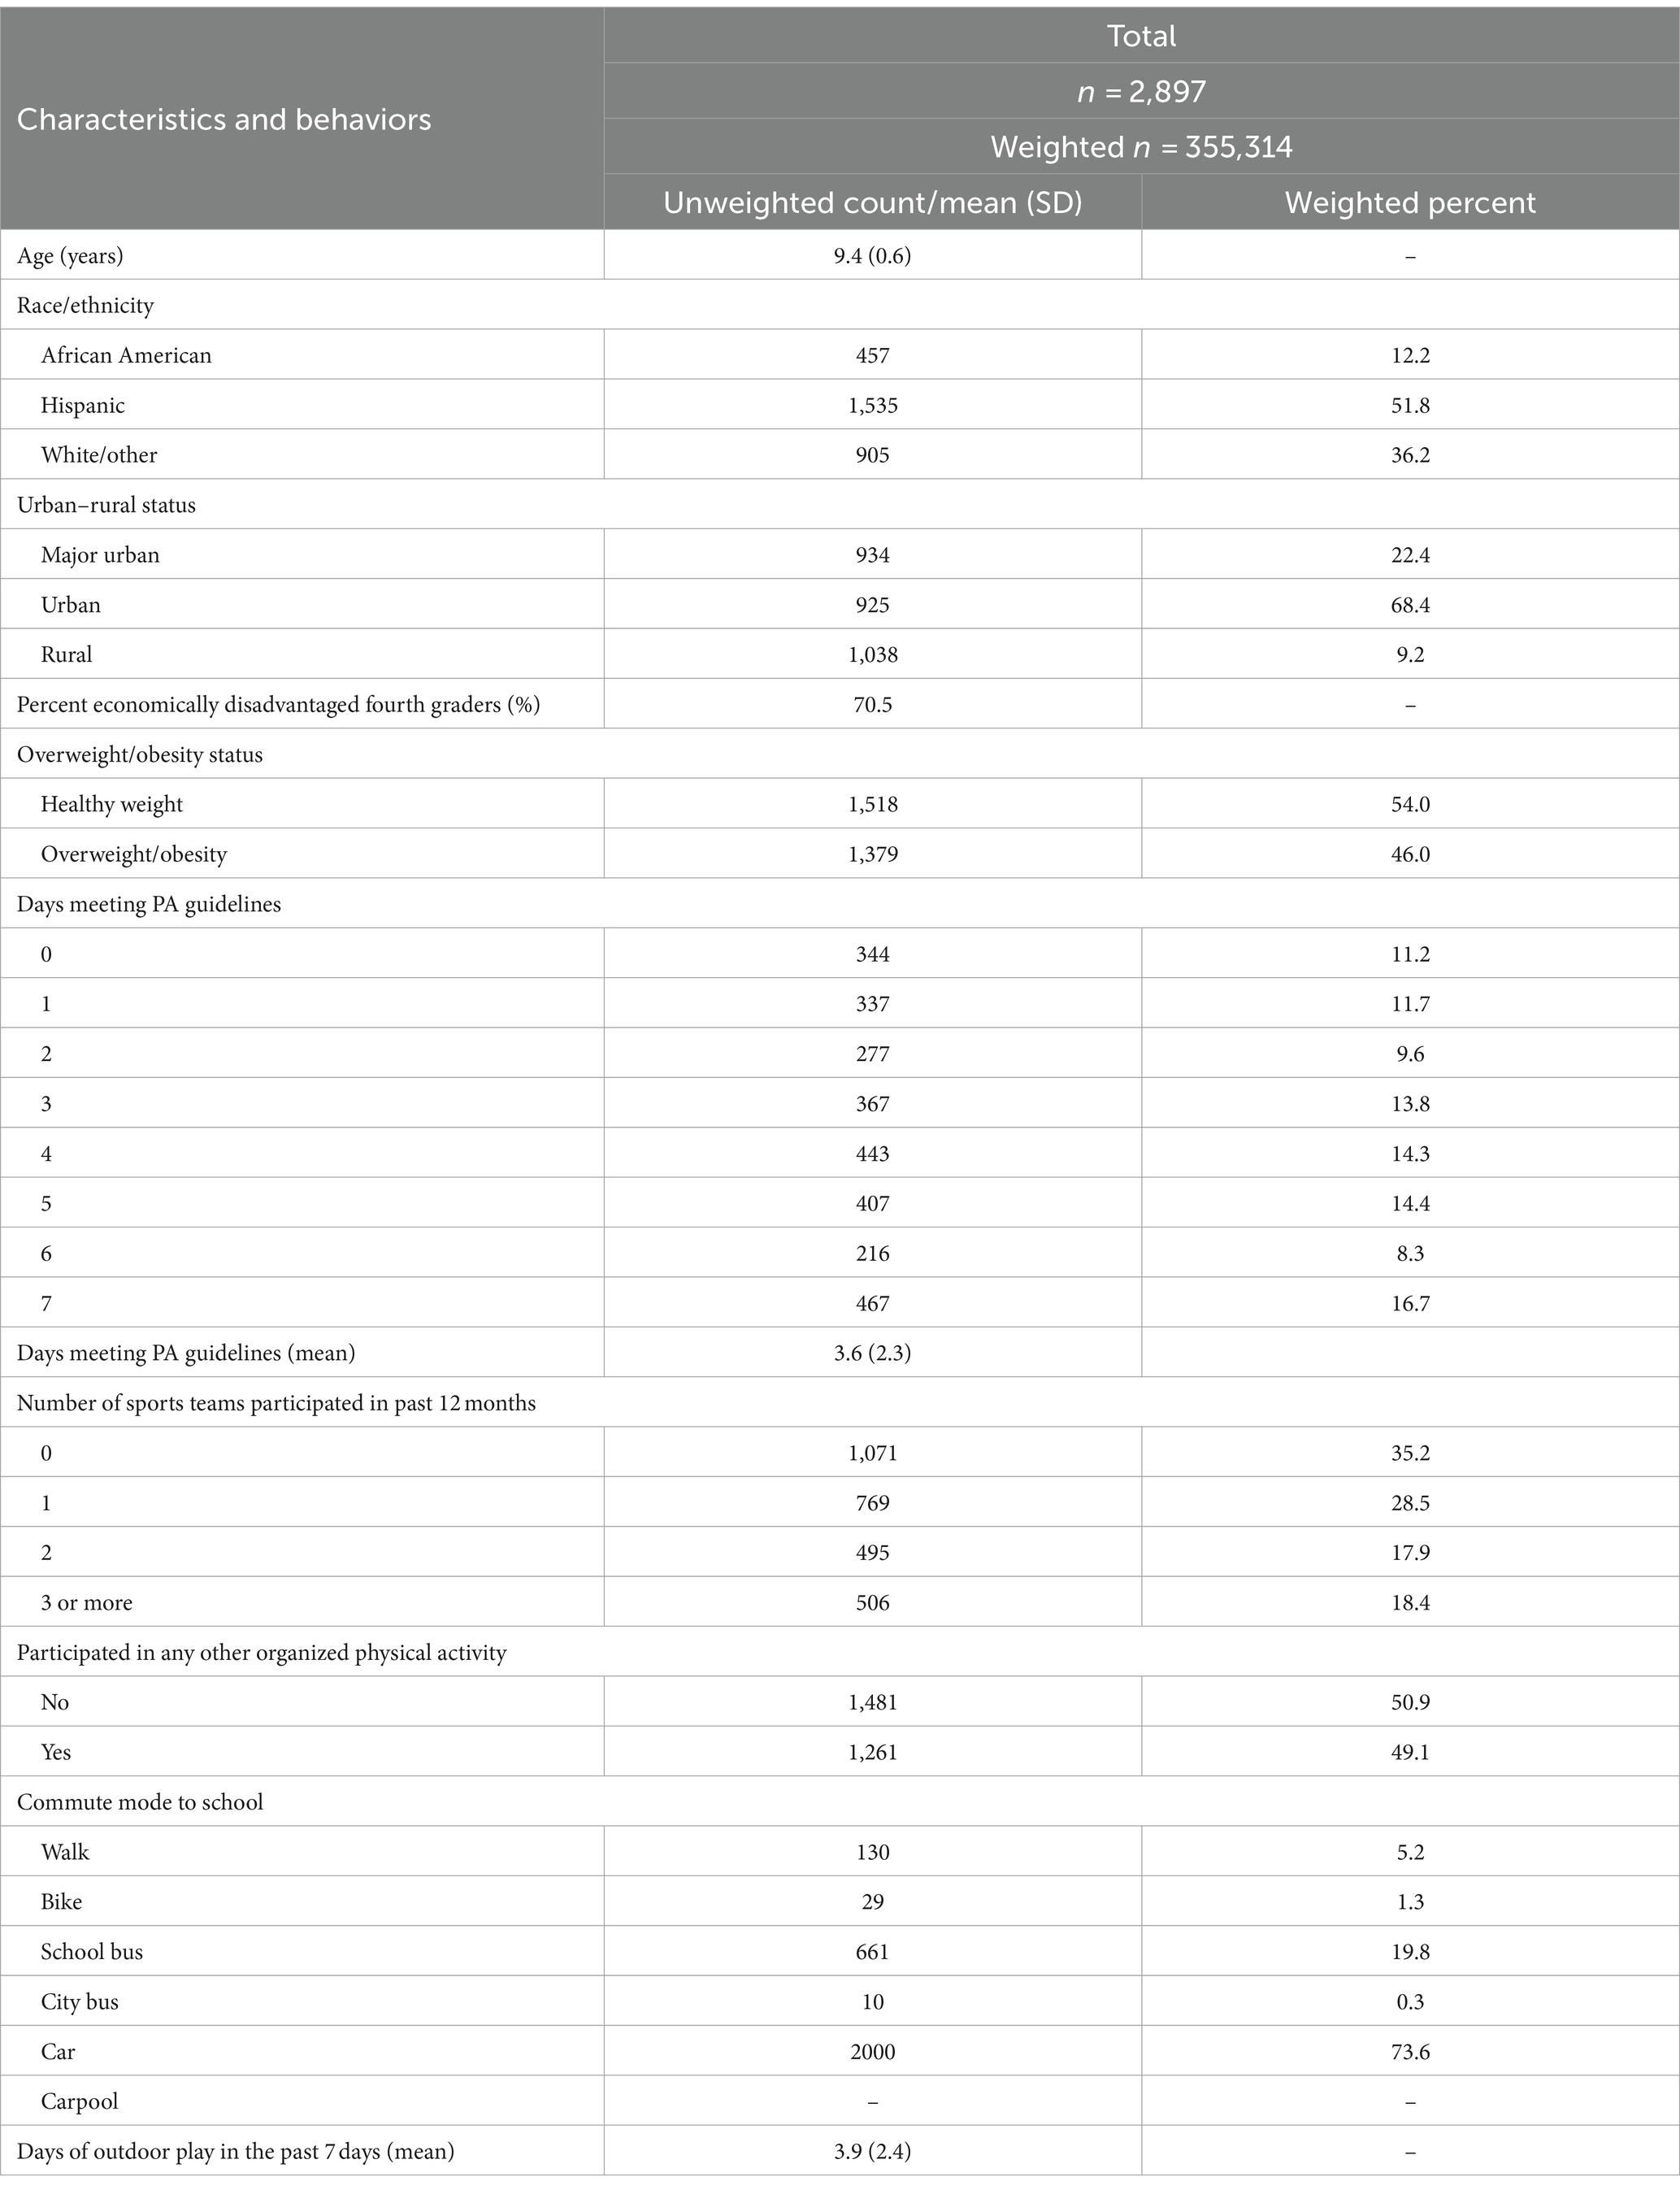
Table 1. Demographic characteristics and health-related behavioral variables presented as unweighted count/mean and weighted prevalence for the total sample (2019–2020 Texas SPAN).
Boys and girls
Table 2 presents characteristics for boys and girls separately. While all participants were fourth graders, boys (9.5 ± 0.6 years) were slightly older than girls (9.4 ± 0.5 years). The average percentage of children attending schools with economic disadvantage differed between boys (71.3 ± 18.5%) and girls (69.7 ± 19.2%). Almost half (46.0%) of children were classified as having OWOB, which differed significantly between boys and girls such that 50.5% of boys and 41.2% of girls were classified as having OWOB.
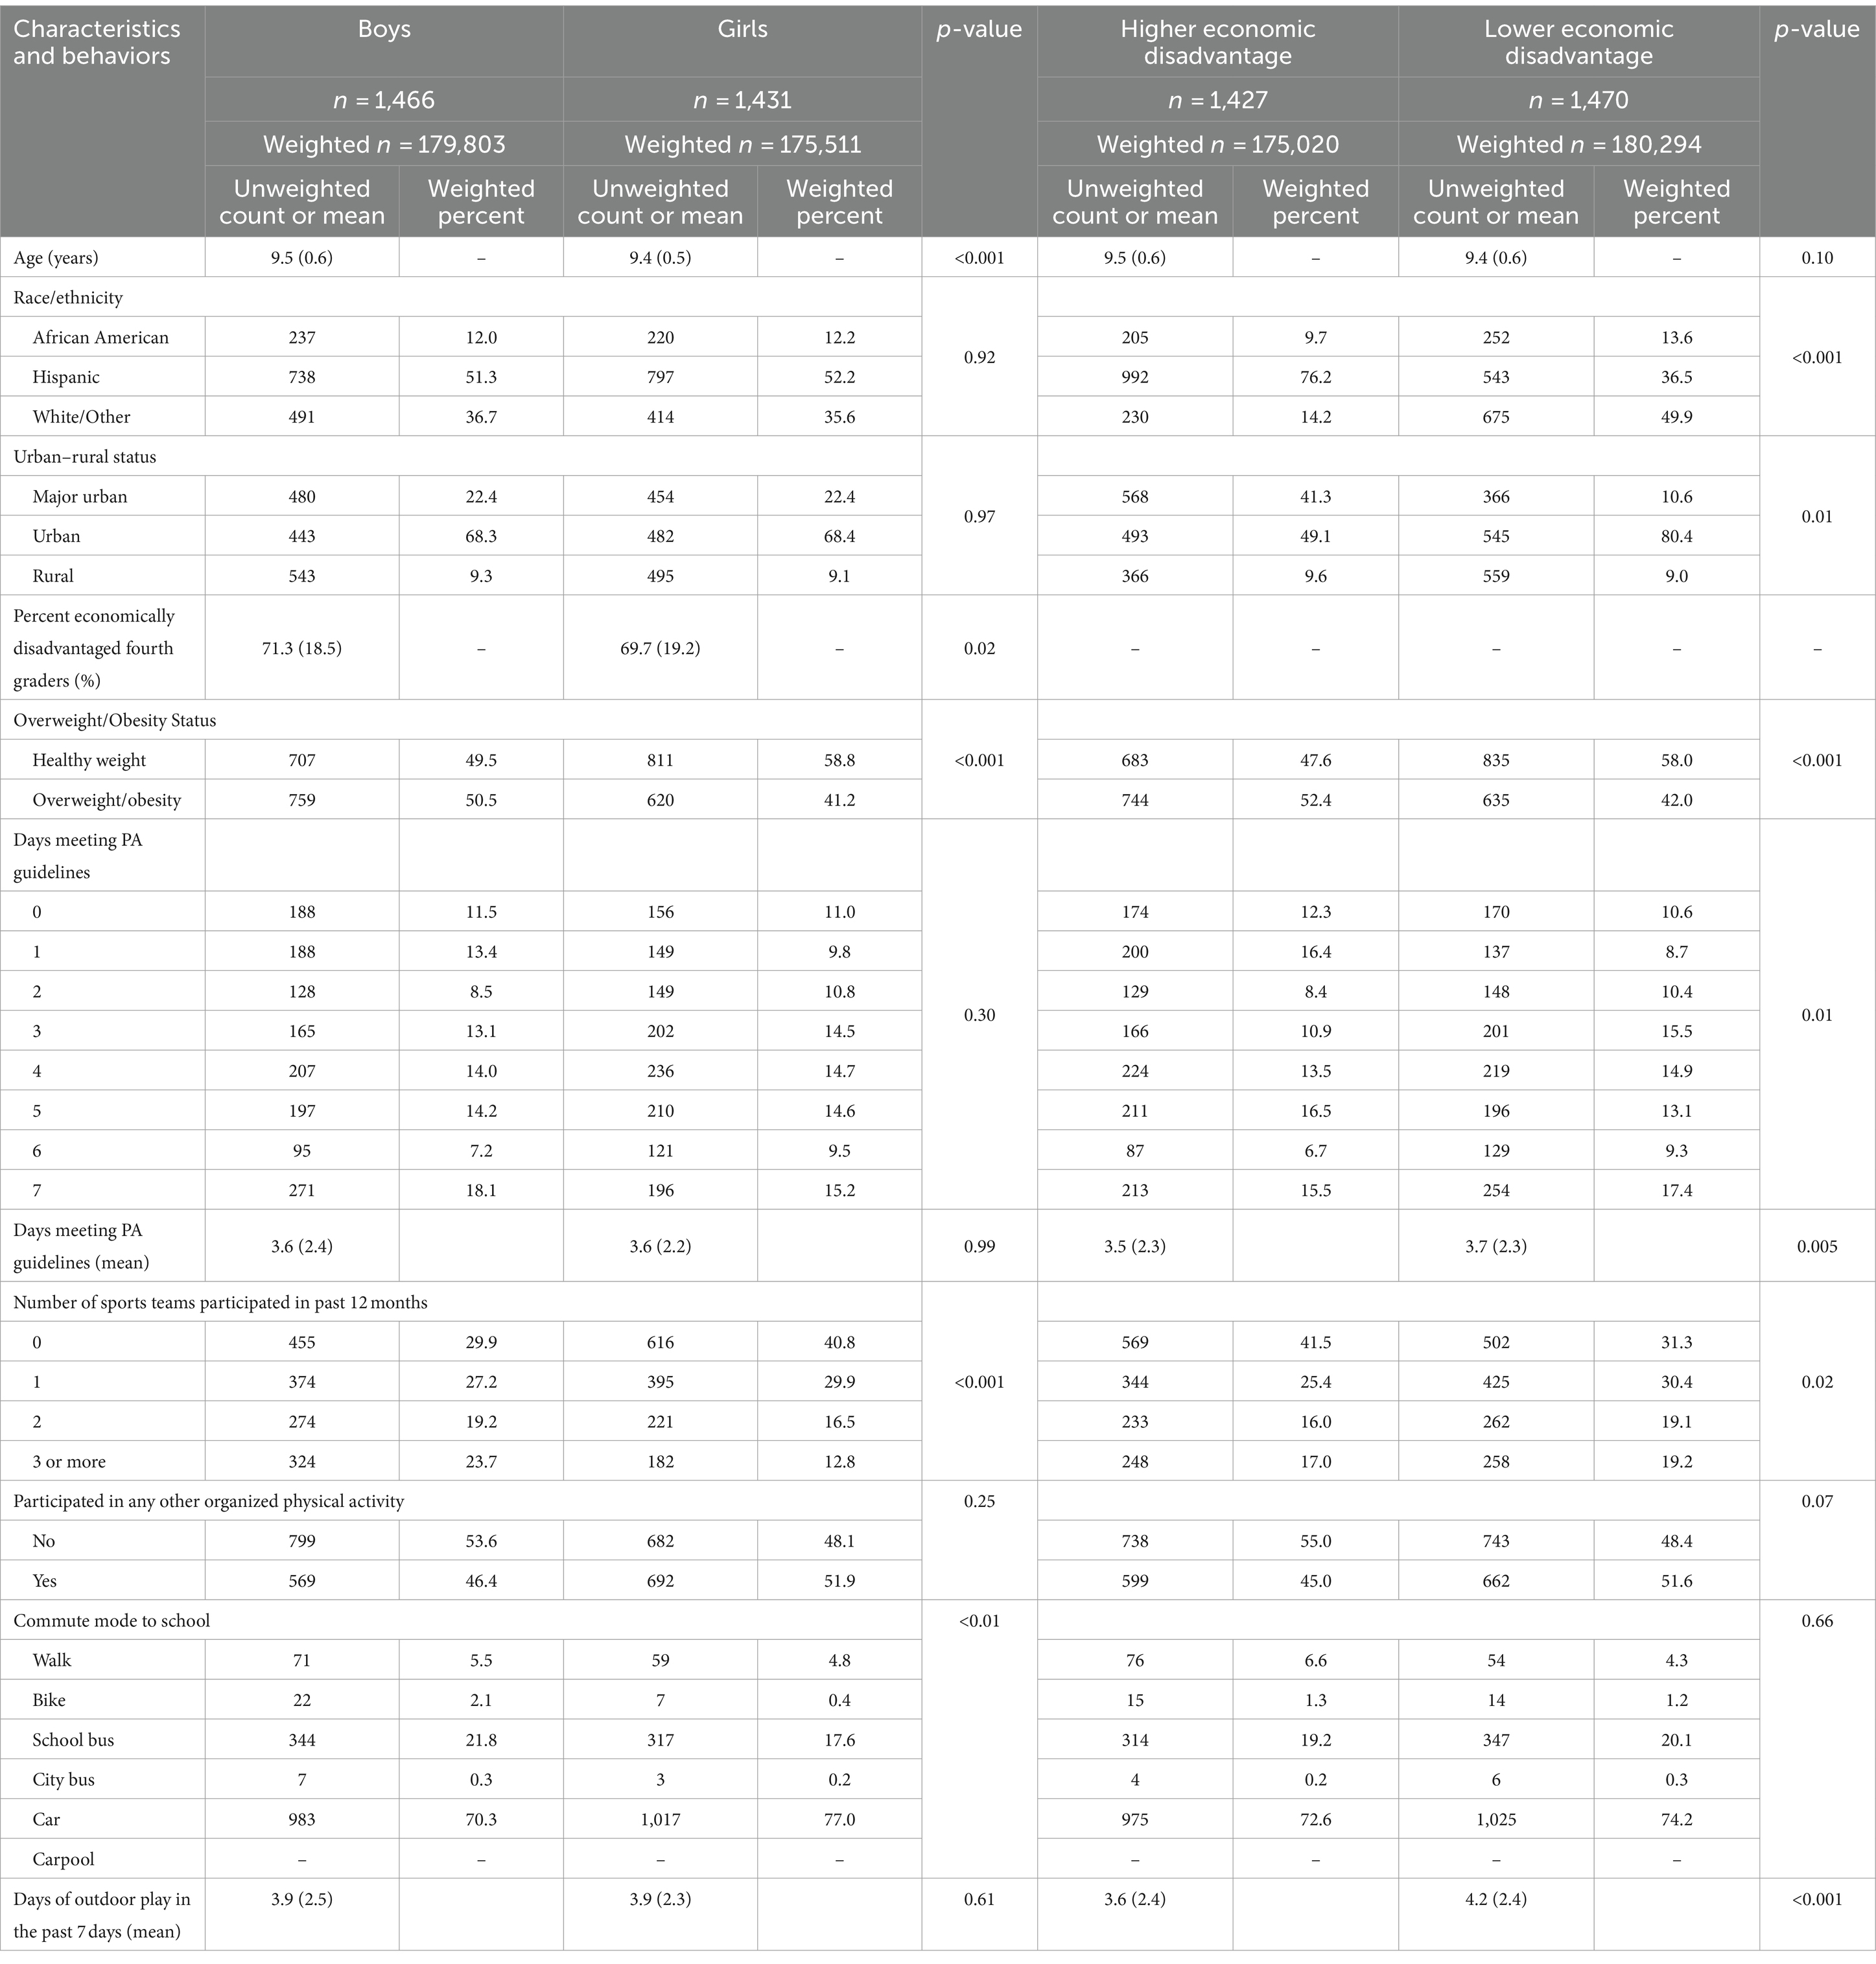
Table 2. Comparison of demographic characteristics and health-related behavioral variables presented as unweighted and weighted prevalence or mean and standard deviation between boys and girls (2019–2020 Texas SPAN).
Higher and lower economic disadvantage
Differences in characteristics between children attending schools with higher and lower economic disadvantage are shown in Table 2. Both the racial/ethnic distribution and the urban/rural distribution differed significantly between children attending schools with higher and lower economic disadvantage. Notably, 49.9% of children attending schools with lower economic disadvantage identified as White/Other, while 14.2% attending schools with higher economic disadvantage identified as White/Other. Also, 41.3% of children attending schools with higher economic disadvantage were from Major Urban areas while 10.6% attending schools with lower economic disadvantage were from Major Urban areas. Regarding health outcomes, 52.4% of children attending schools with higher economic disadvantage had OWOB while 42.0% attending schools with lower economic disadvantage had OWOB.
PA guidelines and PA context
Total sample
Daily PA guidelines were met every day of the week by 16.7% of fourth-grade children. A total of 11.2% did not meet PA guidelines on any day, while 72.1% met them between 1 and 6 days. For the total sample, the average number of days children met PA guidelines was 3.6 ± 2.3 days of the week. Figure 1 visually communicates the proportion of children meeting PA guidelines by day of the week. PA guidelines were met on 60.5% of weekdays and 55.9% of weekend days, which was a statistically significant difference. A total of 70.1% of children participated in at least one sports team in the past 12 months and 46.4% participated in other organized physical activities. Most children (70.7%) reported that a car was their typical commute mode to school, with 4.6 and 1.0% indicating they walked or rode a bike, respectively. On average, children played outdoors 3.9 ± 2.4 days of the week.

Figure 1. Comparison of the proportion of children meeting physical activity guidelines by weekday and weekend day. *Significant difference between the proportion of children meeting physical activity guidelines on weekdays and weekend days (McNemar’s X2 = 194.6, p < 0.001).
Boys and girls
Boys and girls differed significantly in the number of sports teams in which they participated in in the past 12 months. Compared with boys, a significantly higher percentage of girls reported participating in zero sports teams and a lower percentage of girls reported participating in three or more sports teams. The mode of travel to school also significantly differed between boys and girls. More girls reported taking a car to school compared with boys; more boys reported taking a school bus to school compared with girls; and more boys reported walking and biking to school compared with girls.
Higher and lower economic disadvantage
Children from schools with higher economic disadvantage met PA guidelines on fewer days compared with children from schools with lower economic disadvantage. Several PA context variables also differed significantly between children attending schools with higher and lower economic disadvantage. Compared with children from schools with lower economic disadvantage, children from schools with higher economic disadvantage participated in fewer sports teams and more children from schools with higher economic disadvantage reported participating in zero sports teams in the past 12 months. Children from schools with higher economic disadvantage also played outside on fewer days during the week compared with children from schools with lower economic disadvantage.
Associations between meeting daily PA guidelines and PA context
Total sample
The summary of Poisson regression analysis predicting the number of days children met daily PA guidelines for the total sample is displayed in Figure 2. Detailed estimates are shown in Supplementary Table S1. Compared to none, participating in any number of sports teams was positively associated with the number of days children met PA guidelines. Notably, a dose–response relationship was found in which participating in each additional sports team produced a stronger association with the number of days PA guidelines were met. Participation in other organized PA was also positively associated with the number of days children met PA guidelines. Playing outdoors 1–3 days and 4–7 days in the past week was positively associated with the number of days children met PA guidelines, and a dose–response relationship was found with this PA context as well. Active travel to school was not a significant predictor of meeting the PA guidelines.
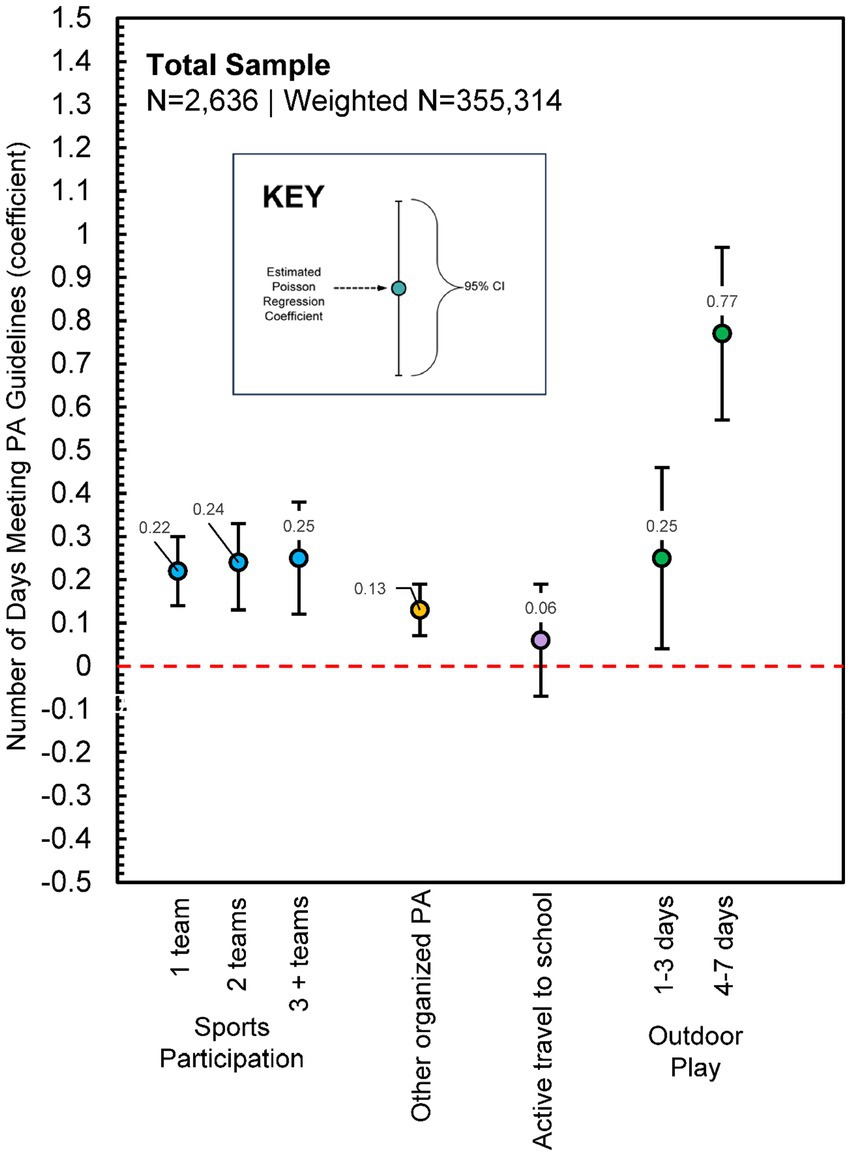
Figure 2. Poisson regression estimates for physical activity contexts predicting the number of days children met physical activity guidelines (Total Sample, N = 2,636, Weighted N = 355,314). Model adjusted for sex, race/ethnicity, urban/rural status, economic disadvantage, and overweight/obesity status; Supplementary Table S1 presents full model estimates.
Boys and girls
Analyses revealed some differences in both the strength and type of associations between meeting daily PA guidelines and PA context (Figure 3). Participation in sports teams was positively associated with the number of days both boys and girls met PA guidelines, but the strength of this association was higher for girls than boys. Participating in other organized PA also positively associated with the number of days boys and girls met PA guidelines. For boys, there was an apparent threshold effect, with only playing outdoors 4 or more days/week positively associated with PA guideline adherence, while for girls, playing outdoors any number of days was associated with PA guideline adherence, with a dose–response relationship noted.
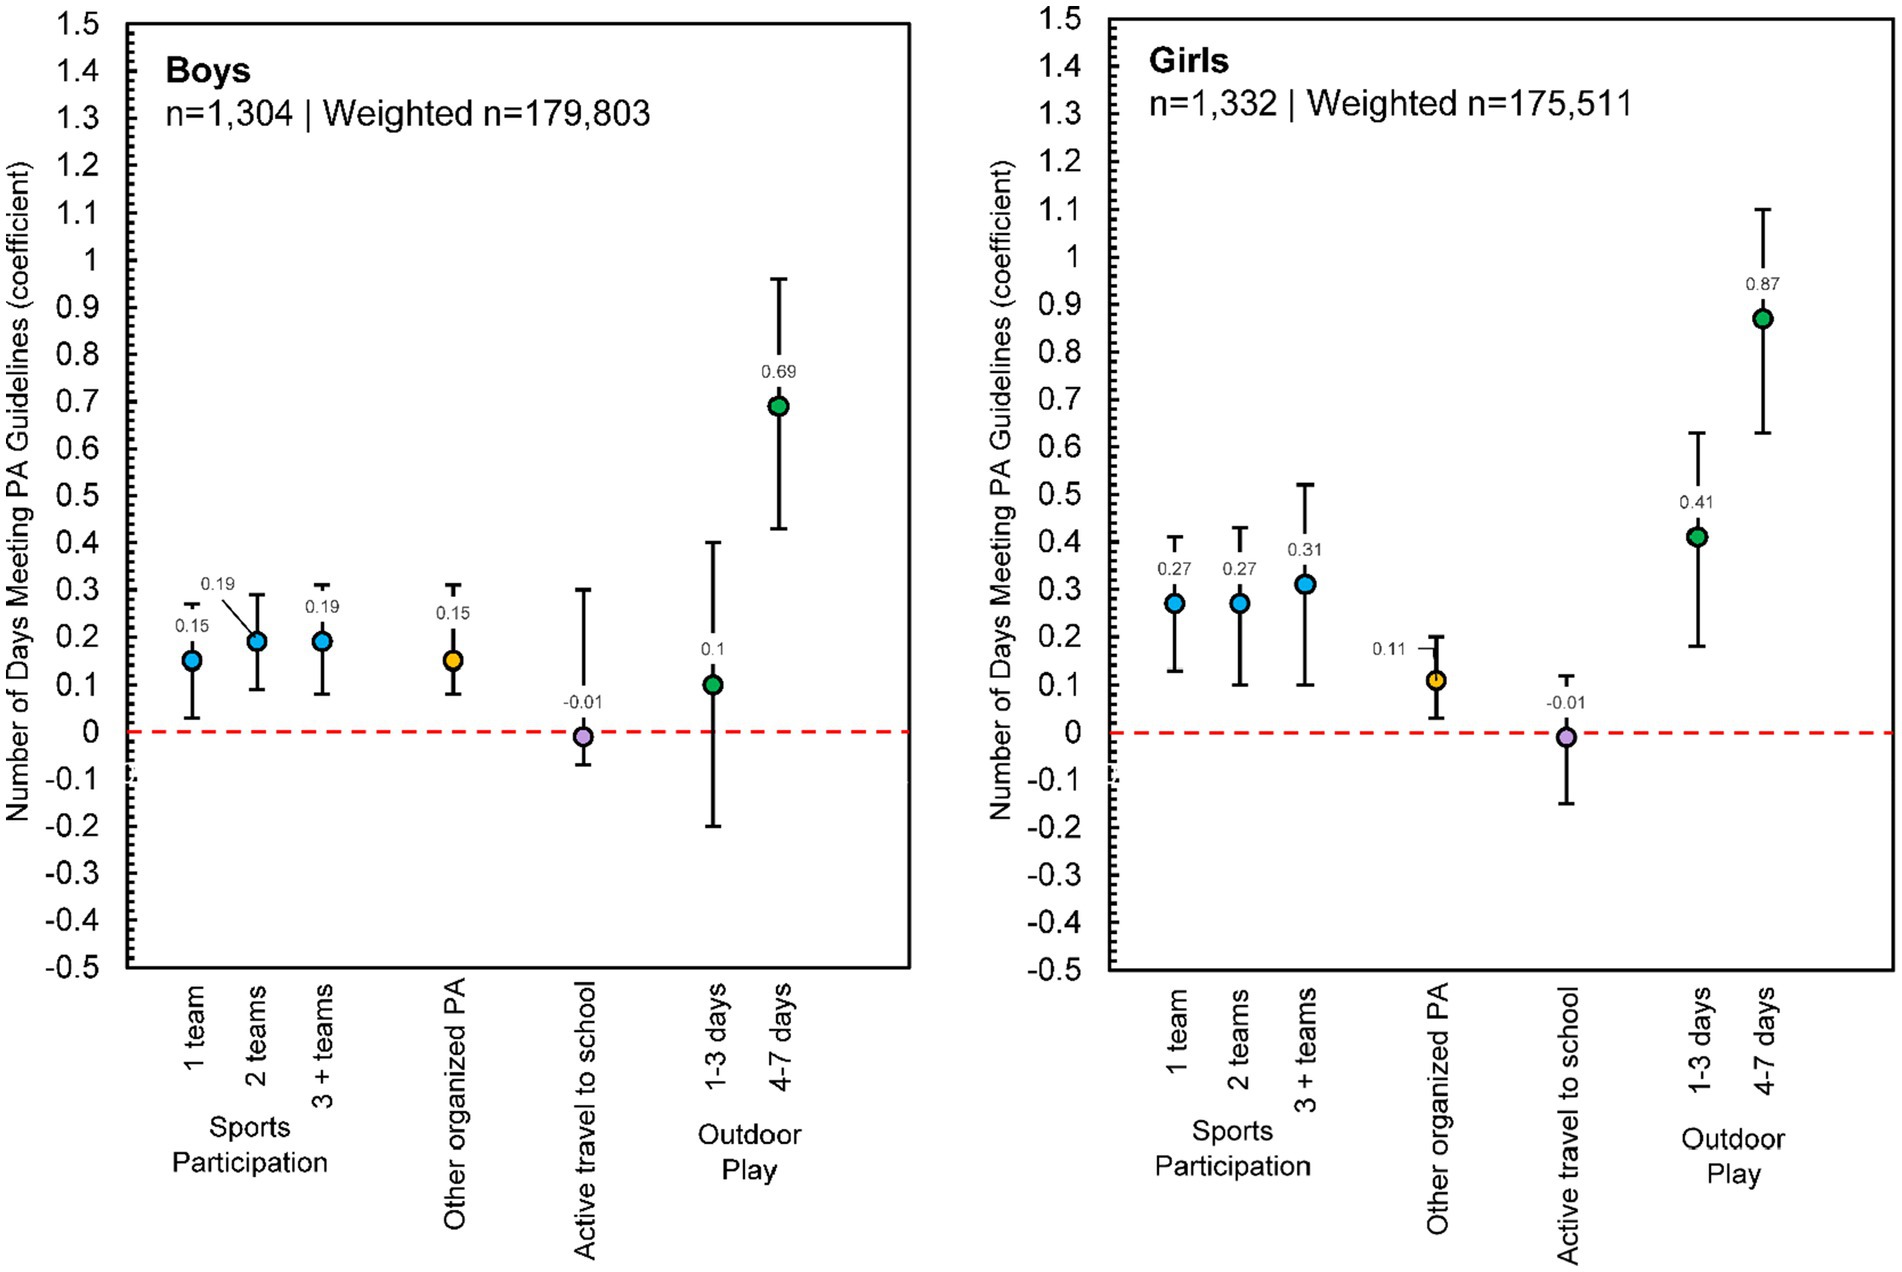
Figure 3. Poisson regression estimates for physical activity contexts predicting the number of days children met physical activity guidelines, reported separately for boys (n = 1,304, Weighted n = 179,803) and girls (n = 1,332, Weighted n = 175,511). Note: Each model adjusted for race/ethnicity, urban/rural status, economic disadvantage, and overweight/obesity status; Supplementary Table S1 presents full model estimates.
Higher and lower economic disadvantage
Consistent with the total sample and boys/girls, participating in sports teams positively associated with the number of days PA guidelines were met in children from schools with both higher and lower economic disadvantage, although there was not a clear dose–response relationship (Figure 4). Participation in any other organized PA also positively associated with daily PA guideline adherence for both groups. For children from schools with lower economic disadvantage, playing outdoors any number of days positively associated with daily PA guideline adherence and a clear dose–response relationship was found. For children from schools with higher economic disadvantage, only playing outdoors 4–7 days of the week was associated with PA guideline adherence.
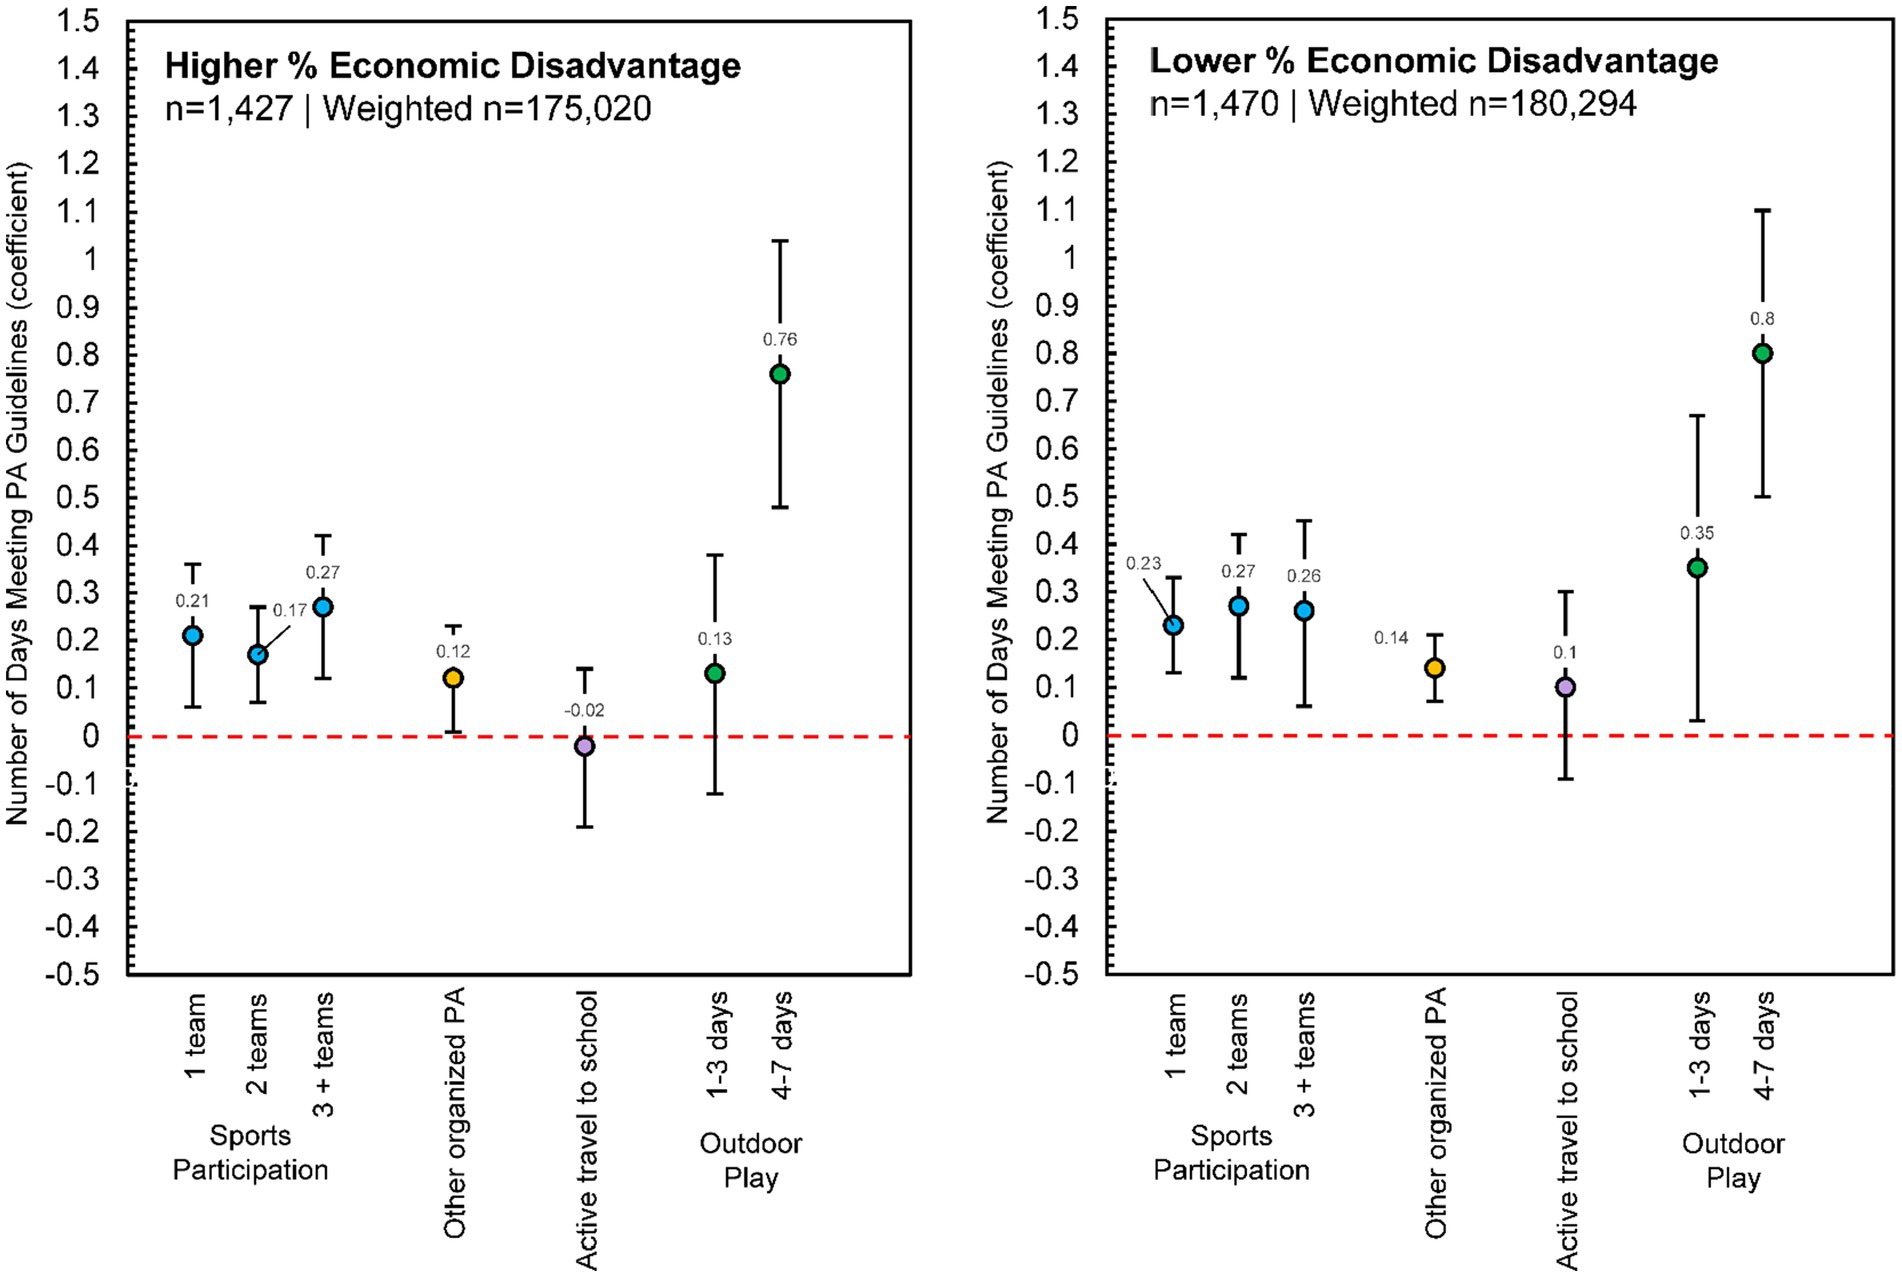
Figure 4. Poisson regression estimates for physical activity contexts predicting the number of days children met physical activity guidelines, reported separately for higher percent economic disadvantage (n = 1,427, Weighted n = 175,020) and lower percent economic disadvantage (n = 1,470, Weighted n = 180,294). Each model adjusted for sex, race/ethnicity, urban/rural status, and overweight/obesity status; Supplementary Table S1 presents full model estimates.
Boys/girls and higher/lower economic disadvantage
Some subgroup variability in estimates was evident among the analyses stratified by sex (boys/girls) and higher/lower economic disadvantage (Figure 5). Participating in sports teams positively associated with the number of days PA guidelines were met for each group, but the significant association only held constant for each additional sports team for girls from schools with higher economic disadvantage. The dose–response relationship was most notable for this group as well. Conversely, girls from schools with higher economic disadvantage were the only group in which participation in any other organized PA was not a significant predictor of daily PA guideline adherence. Finally, while the dose–response relationship for days of outdoor play was consistent across girls from schools with both high and low economic disadvantage, only 4–7 days of outdoor play was a significant predictor of daily PA guideline adherence for boys from schools with both high and low economic disadvantage.
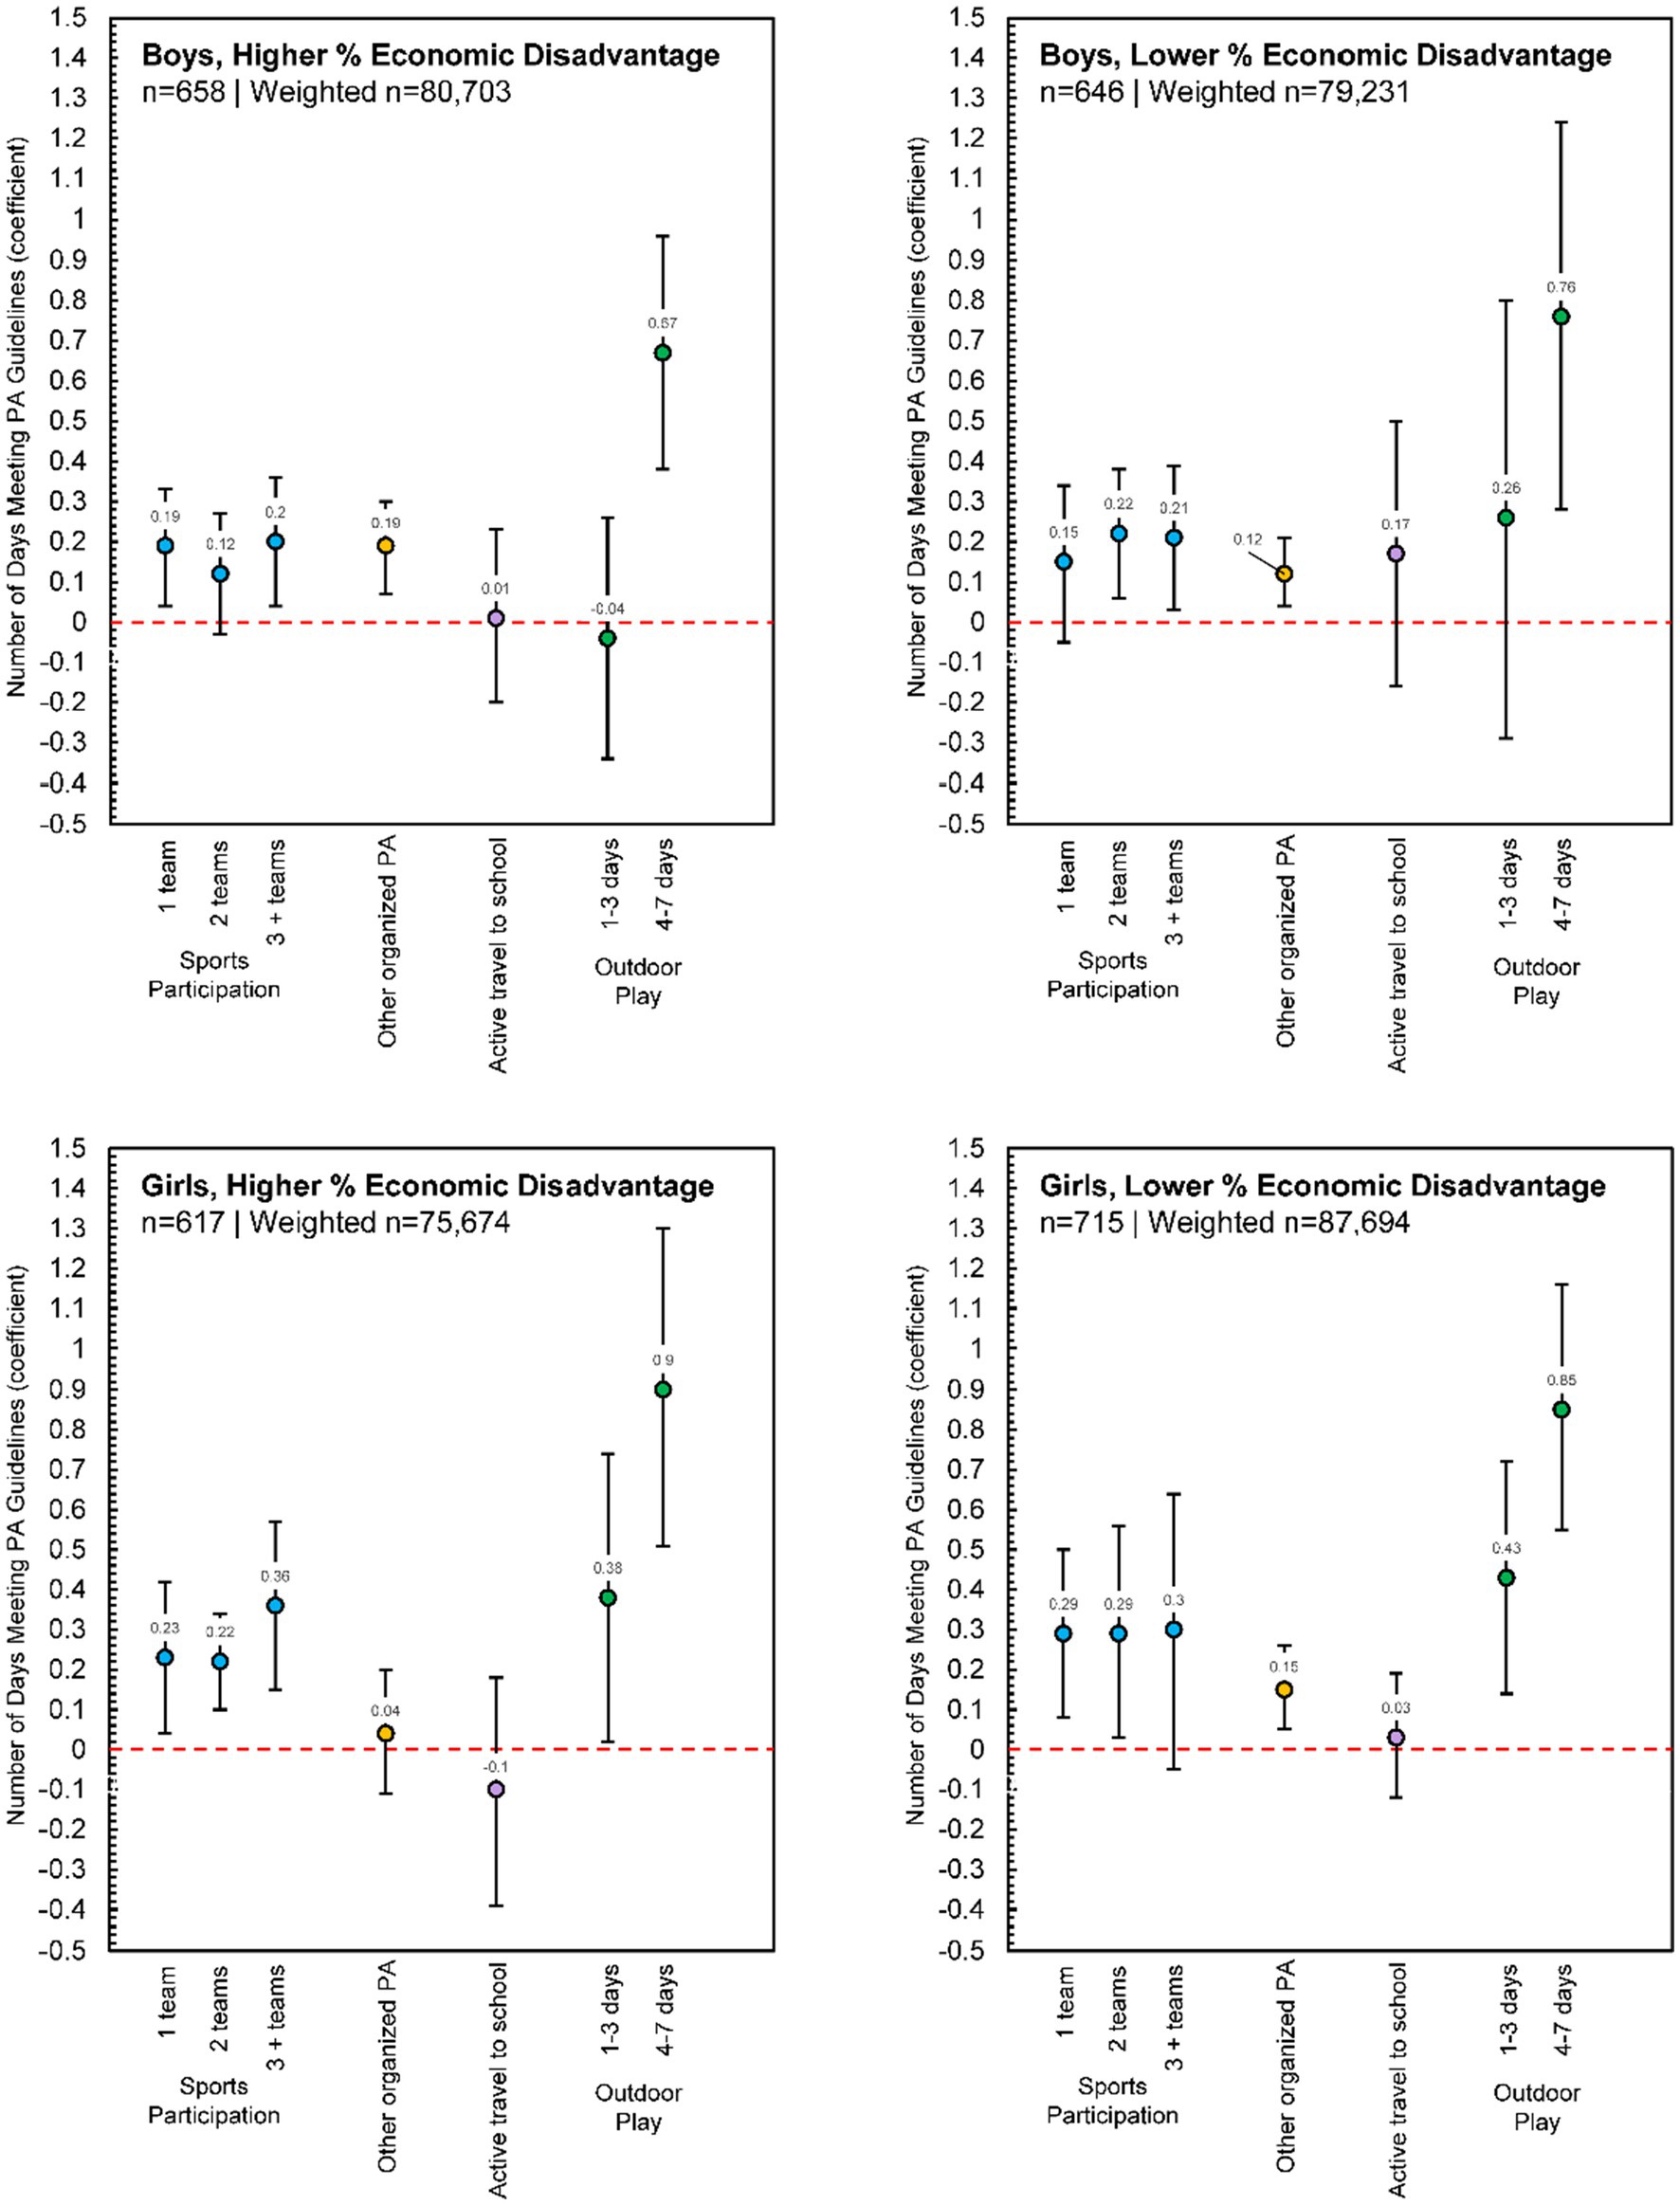
Figure 5. Poisson regression estimates for physical activity contexts predicting the number of days children met physical activity guidelines, reported separately for boys, higher percent economic disadvantage (n = 658, Weighted n = 80,703), boys, lower percent economic disadvantage (n = 646, Weighted n = 79,231), girls, higher percent economic disadvantage (n = 617, Weighted n = 75,674), and girls, lower percent economic disadvantage (n = 715, Weighted n = 87,694). Each model adjusted for race/ethnicity, urban/rural status, and overweight/obesity status; Supplementary Table S2 presents full model estimates.
Discussion
This study was a cross-sectional examination of daily PA guideline adherence in relation to several PA contexts using data from the 2019–2020 Texas SPAN survey. We sought to examine associations between PA contexts (sports participation and other out-of-school structured physical activities, active travel to school, and outdoor play), and the number of days fourth-grade children met PA guidelines in a representative sample of children living in Texas. We were also interested in comparing PA guideline adherence and PA context between boys/girls and between participants from schools with higher/lower levels of economic disadvantage. Overall, we found a significant dose–response relationship between sports participation and the number of days fourth-grade children met PA guidelines. We also found a similar dose–response relationship between the number of days children played outside and the number of days children met PA guidelines. Participating in other organized PA was also positively associated with the number of days children met PA guidelines but active travel to school was not. Several differences between boys/girls and children from schools with higher/lower levels of economic disadvantage were noted, but playing outdoors was a consistent predictor of PA guideline adherence across all model comparisons in this age group. Results shed light on how different PA contexts may associate with PA guideline adherence and identify potential salient intervention components for those designing and conducting PA-based health behavior interventions for children. Comparisons between boys/girls and children from lower/higher economic disadvantage also emphasize the need for more equitable PA promotion strategies focused on girls and on children attending schools with higher economic disadvantage.
The average number of days per week fourth-grade children living in Texas met PA guidelines (3.6 ± 2.3 days) is difficult to compare with much of the previously published literature, as most studies simply report the proportion of children meeting PA guidelines. A previous study using accelerometer-derived data reported the proportion of days fourth-grade children met PA guidelines was 47.5% (43), which is similar to our study ([3.6/7]*100% = 51.4%). Comparing the proportion of children meeting PA guidelines proves difficult, as many studies derive this proportion by averaging PA across all measured days, which does not consider the “daily” aspect of the guideline language (5–8). For our study, we accounted for each individual day of the week and found about 15% of children met daily PA guidelines, meaning 15% of children met the PA guideline every single day of the week. Other studies from the US have reported 23% (44), 71% (45), and even 91.5% (46) of youth meet PA guidelines, but again these estimates are difficult to compare due to differences in data handling strategies (47). For studies outside of the US that have operationalized the “daily” aspect of PA guideline adherence, estimates are comparable (42).
We also found children from schools with higher economic disadvantage met PA guidelines on fewer days than children from schools with lower economic disadvantage and this finding aligns with previously published literature involving samples from both inside and outside of the US that has explored various proxies for socioeconomic status and PA (24, 25, 48–50). There is no single reason for this disparity, but some include both financial and environmental accessibility to facilities and organized sports/activities that promote PA, neighborhood safety which may limit the ability to play outside or walk/bike to school, and the moderating effect of weight status, which has shown to favor children with higher socioeconomic status (26). In Texas, the percentage of children who experience socioeconomic disadvantage is higher than many other states, with 38% of families falling 400% below the federal poverty level, 19.6% of children experiencing poverty, and the median household income being $3,000 less than national average (51). This is also evidenced by the relatively high median of children from schools with higher economic disadvantage in our sample.
The results of our study also indicate children from schools with higher economic disadvantage participate in fewer sports teams. In terms of PA context, sports participation may be the most cost prohibitive. In fact, the average cost of participating in a single sport has been estimated to be $883 for children in the United States, with some families spending upward of $4,000 annually (19), making it an opportunity not afforded by every child. When making comparisons between boys and girls, we found girls participated in fewer sports teams as well. This is concerning as sports can have a profound impact on not only PA (16), and more specifically, MVPA (15), but children may also experience other benefits from sports participation including improved mental health (52), decreased risk of cardiovascular disease (53) and overweight/obesity (54), and higher academic achievement (55).
Regarding some of the other PA contexts we explored, our results indicate children from schools with higher economic disadvantage played outside on fewer days than children from schools with lower economic disadvantage. While playing outdoors is arguably less expensive than participating in sports, there still may be costs associated with playing outdoors, albeit in a more indirect manner (21–23, 56). Still, children living in neighborhoods with higher socioeconomic disadvantage have been shown to have better accessibility to opportunities for outdoor play, although this is variable by country and region (18, 57). However, neighborhoods with higher socioeconomic disadvantage tend to be less safe (18), limiting the chances that children will utilize these opportunities. Children from families with lower socioeconomic status also tend to face more restrictions on outdoor play than those from households with higher economic status, with evidence suggesting safety is a significant concern (58). Outdoor play can also occur around home environments but it has been found that families with lower socioeconomic status provide more opportunities for sedentary behavior and fewer opportunities to be physically active (58), which may also be driving these disparities.
While we did not find differences in commute mode to school when comparing children from schools with higher and lower economic disadvantage as others have (59, 60), we did find differences in commute mode to school between boys and girls, such that more boys indicated walking, biking, and taking a school bus. Perceived safety and the level of independent mobility given to boys and girls may contribute to this finding (61–66), although we did not assess these variables in this study. Programs, policies, and/or interventions that aim to promote active commuting to school should consider these sex-based differences and offer tailored strategies to alleviate parental concerns. In general, we found that a very small percentage of fourth-grade children in Texas reported walking and biking to school (6.5% overall), and this small percentage of active commuting is reflected in other state-level and national estimates (60, 67–69). This is a concerning statistic, especially since as children get older this percentage tends to decline past sixth grade (70). Regardless of sex or socioeconomic status, more effort should be put into promoting active travel among children by addressing concerns around safety, improving built environment infrastructure supporting walking and biking, and increasing promotion efforts.
In terms of the strength of associations between the number of days children met PA guidelines and different PA contexts, several important findings were noted. First, for the total sample, for girls, and for girls from schools with higher economic disadvantage, there was a clear dose–response relationship between the number of sports teams in which they participated and the number of days PA guidelines were met. This dose–response relationship was observed for other groups as well, but not in as consistent of a manner. Sports have long been an important intervention component for youth PA promotion, and there are several examples of these types of interventions in the literature (71). Findings from our study create an impetus for more sports-based interventions specifically designed for girls and for girls from schools with higher economic disadvantage as we found (1) girls and children from schools with higher economic disadvantage participated in fewer sports than boys and children from schools with lower economic disadvantage and (2) the association between sports participation and the number of days PA guidelines were met was stronger for girls and girls from schools with higher economic disadvantage than boys and children from lower economic disadvantage. There are few examples of sports-based interventions specifically for girls (72–74), but there have been several observational studies on various aspects of girls’ sports participation (27, 75–80). More work should be put into these efforts and in attempting to scale programs up to increase reach to girls and children from schools with higher economic disadvantage.
Another important finding was the strength of the association between the number of days PA guidelines were met and outdoor play. Not only was there a clear dose–response relationship for many of the groups, but the strength of the association for 4–7 days of outdoor play was markedly higher than all other PA contexts. In many models, the strength of the association was 2–3 times higher than participating in three or more sports teams throughout the year. Recent work, sometimes categorized as and/or having overlap with “risky play” (81, 82), “unstructured play” (83), “nature play” (84), and/or “free play” (85), highlights the uniqueness of this PA context and offers an exciting avenue for youth PA promotion (20). Lee et al. (83) conducted a review of the correlates of outdoor play among children and found that individual, parental, home, and social environments influence the time spent playing outdoors. Based on this review, factors such as independent mobility, overweight status, parents’ attitudes, concerns, and behavior, peer influence, housing type, and, supporting our findings, proxies for socioeconomic status, all play a role in influencing the amount of time children spend playing outdoors. Intervention efforts have yielded promising results for the efficacy of outdoor play increasing PA among children as well (86). It is worth noting many outdoor play studies and interventions have been conducted with younger children (preschool and Kindergarten), while not as much attention has been given to older children and adolescents. As this area of research grows, researchers should consider expanding investigations to older children and should also explore how outdoor play may track into adolescence and even adulthood, as parenting practices have been shown to influence outdoor play in children as well (23).
Finally, we found other organized PA positively associated with the number of days PA guidelines were met across most groups, except for boys from schools with lower economic disadvantage and girls from schools with higher economic disadvantage. While the survey question we used did not ask about specifics, the fact that any other organized PA positively associated with PA guideline adherence provides further support for the structured days hypothesis (SDH) (87), which posits obesity-related behaviors in children may be beneficially regulated by formal structure, in this case, organized PA outside of the school context. As with sports, participation in other organized PA can come with a financial burden, although we did not find significant differences in other organized PA participation between children from schools with higher and lower economic disadvantage. Using a more immediate proxy for children’s socioeconomic status may have revealed significant differences, as previous literature has shown (88, 89), but we cannot be certain that is the case in our sample. Still, other organized PA may be a viable PA promotion alternative to sports, especially for children who are not interested in traditional sports, if economic barriers are addressed. Indeed, almost half of the fourth-grade children from our sample indicated participating in other organized PA throughout the year, and this estimate was not much different for children from schools with higher economic disadvantage. We also found that PA guidelines were met more frequently on weekdays compared with weekend days, which lends further support to the SDH, as weekend days tend to be less structured (87). Much like the summer months, PA intervention efforts should focus on providing opportunities for children on weekend days, which lack the formal structure school days provide during the week.
Strengths and limitations
The Texas SPAN survey provides a unique opportunity to leverage data that are representative of the entire state of Texas, which happens to be the second most populous state in the US (90) and is home to 7.5 million children, accounting for 10% of all children in the US (30). Participants in the Texas SPAN survey reflect the racial/ethnic and economic diversity of the state as well. Because of the questions asked in the SPAN survey, we were also able to conduct one of the first studies exploring how several different PA contexts associate with PA guideline adherence in a representative sample of fourth-grade children. As previously highlighted, this approach allows us to compare PA behaviors across contexts within the same sample of participants in a naturalistic setting, as past PA interventions have typically not compared how PA contexts may differentially impact PA outcomes across several domains (sports, outdoor play, structured activities, etc.) Results may be valuable to those wishing to conduct further research utilizing device-based measures of PA and for researchers hoping to design effective PA-based interventions for children of a similar age. However, results should also be interpreted with study limitations in mind. A clear limitation is the self-reported and cross-sectional nature of our study design, which limits us to only interpreting associations between PA context and PA guideline adherence and barring us from making any causal interpretations with the data. Another limitation is our inability to account for several school-based PA contexts, including recess and physical education. Survey questions regarding structured PA did make it clear not to include physical education classes in participant responses, but having information on recess and physical education would enrich the analyses. Finally, temporal differences in how certain questions were worded in the survey should be acknowledged. For example, children were asked to indicate how many sports teams they were on “in the past 12 months,” how they traveled to school “on most days,” and how many days they played outside “in the past week.” These differences in temporality may have influenced the way in which questions were interpreted, answers were provided, and subsequent interpretations of the associations between these contexts and the number of days PA guidelines were met. For example, the self-reported “dose” of physical activity for questions that had participants report the frequency of participating in a structured activity “in the past week” could have potentially been higher than questions that had participants report the frequency of participating in a structured activity “in the past 12 months” and/or “on most days,” which could result in stronger or weaker associations between certain types of structured activities and meeting PA guidelines.
Conclusion
Participating in organized sports and other structured physical activities, in addition to playing outdoors, may beneficially influence the number of days fourth-grade children meet PA guidelines, although there are sex- and economic-based disparities present. Programs that aim to enhance PA in children should consider these contextual factors in light of these disparities and further investigate how to promote sports, organized activities, and outdoor play effectively and appropriately among children, especially for girls and for children from schools with higher economic disadvantage. With results being generalizable to only fourth-grade children in Texas, USA, future work should be continued in other countries and cultures to investigate how certain contexts might differentially influence PA guideline adherence. Because participation in certain PA contexts may decline as children get older [e.g., walking/biking to school (70) and types of outdoor play (91)], more research and health promotion work should be conducted with adolescent participants to see if the relationships found in our study are maintained as age increases. Future studies should also employ more rigorous observational investigations with device-based measures of PA and should collect day-level contextual information about PA opportunities and their utilization. Future studies should also explore how PA contexts influence PA across the lifespan and how the context of PA might change as children get older. Our study highlights there is not a “one size fits all” approach to PA promotion for children. Sex- and economic-based differences in participation in different PA contexts and differences in the strength of associations between PA context and PA guideline adherence underscore what may be viable for some children may not be for other children, and interventions and programs hoping to promote PA in children should respond appropriately.
Data availability statement
The full datasets presented in this article are not readily available because public access was not specified in the consent forms. Reasonable requests to access the datasets should be directed to RGVhbm5hLk0uSG9lbHNjaGVyQHV0aC50bWMuZWR1. Limited datasets can be accessed at https://span-interactive.sph.uth.edu/.
Ethics statement
The studies involving humans were approved by the Committee for the Protection of Human Subjects at the University of Texas Health Science Center at Houston (UTHealth Houston) (HSC-SPH-18-0432), the Texas Department of State Health Services Institutional Review Board, and local school district review committees. The studies were conducted in accordance with the local legislation and institutional requirements. Written informed consent for participation in this study was provided by the participants’ legal guardians/next of kin.
Author contributions
CP: Conceptualization, Formal analysis, Investigation, Methodology, Software, Visualization, Writing – original draft, Writing – review & editing. DB: Conceptualization, Investigation, Methodology, Writing – original draft, Writing – review & editing. NR: Conceptualization, Data curation, Formal analysis, Methodology, Writing – original draft, Writing – review & editing. AS: Conceptualization, Writing – original draft, Writing – review & editing. RM: Data curation, Formal analysis, Methodology, Project administration, Resources, Writing – original draft, Writing – review & editing. DS: Conceptualization, Methodology, Writing – original draft, Writing – review & editing. DH: Conceptualization, Data curation, Funding acquisition, Investigation, Methodology, Supervision, Writing – original draft, Writing – review & editing.
Funding
The author(s) declare financial support was received for the research, authorship, and/or publication of this article. This study was funded by the Texas Department of State Health Services with funds from the Title V Maternal and Child Health Block Grant to Texas, Centers for Disease Control and Prevention Health and Human Services Block Grant, and the Michael & Susan Dell Foundation through the Michael & Susan Dell Center for Healthy Living.
Acknowledgments
The authors would like to acknowledge the districts, schools, and families who participated in the study.
Conflict of interest
The authors declare that the research was conducted in the absence of any commercial or financial relationships that could be construed as a potential conflict of interest.
Publisher’s note
All claims expressed in this article are solely those of the authors and do not necessarily represent those of their affiliated organizations, or those of the publisher, the editors and the reviewers. Any product that may be evaluated in this article, or claim that may be made by its manufacturer, is not guaranteed or endorsed by the publisher.
Supplementary material
The Supplementary material for this article can be found online at: https://www.frontiersin.org/articles/10.3389/fpubh.2024.1352644/full#supplementary-material
Abbreviations
BMI, Body Mass Index; MVPA, Moderate-to-Vigorous Physical Activity; OWOB, Overweight and Obesity; PA, Physical Activity; PHR, Public Health Region; SDH, Structured Days Hypothesis; Texas SPAN, Texas School Physical Activity and Nutrition; TEA, Texas Education Agency; US, United States
References
1. Myers, J, Kokkinos, P, and Nyelin, E. Physical activity, cardiorespiratory fitness, and the metabolic syndrome. Nutrients. (2019) 11:1652. doi: 10.3390/nu11071652
2. Biddle, SJH, Ciaccioni, S, Thomas, G, and Vergeer, I. Physical activity and mental health in children and adolescents: an updated review of reviews and an analysis of causality. Psychol Sport Exerc. (2019) 42:146–55. doi: 10.1016/j.psychsport.2018.08.011
3. Chopra, I, and Chopra, A. Obesity prevention interventions in rural children: a systematic review and meta-evaluation. Integr Obes Diabetes. (2015) 1. doi: 10.15761/IOD.1000127
4. Hills, AP, Andersen, LB, and Byrne, NM. Physical activity and obesity in children. Br J Sports Med. (2011) 45:866–70. doi: 10.1136/bjsports-2011-090199
5. American Heart Association . Recommendations for physical activity in kids infographic. Available at: https://www.heart.org/en/healthy-living/fitness/fitness-basics/aha-recs-for-physical-activity-in-kids-infographic (Accessed October 3, 2023).
6. CDC . How much physical activity do children need? Centers for Disease Control and Prevention (2023). Available at: https://www.cdc.gov/physicalactivity/basics/children/index.htm (Accessed October 3, 2023).
7. WHO . Physical activity. Available at: https://www.who.int/news-room/fact-sheets/detail/physical-activity (Accessed October 3, 2023).
8. CDC . Youth physical activity guidelines | physical activity | healthy schools | CDC (2022). Available at: https://www.cdc.gov/healthyschools/physicalactivity/guidelines.htm (Accessed October 3, 2023).
9. Tapia-Serrano, MA, Sevil-Serrano, J, Sánchez-Miguel, PA, López-Gil, JF, Tremblay, MS, and García-Hermoso, A. Prevalence of meeting 24-hour movement guidelines from pre-school to adolescence: a systematic review and meta-analysis including 387,437 participants and 23 countries. J Sport Health Sci. (2022) 11:427–37. doi: 10.1016/j.jshs.2022.01.005
10. Love, R, Adams, J, and Sluijs, EMF. Are school-based physical activity interventions effective and equitable? A meta-analysis of cluster randomized controlled trials with accelerometer-assessed activity. Obes Rev. (2019) 20:859–70. doi: 10.1111/obr.12823
11. Pfledderer, CD, Burns, RD, Byun, W, Carson, RL, Welk, GJ, and Brusseau, TA. School-based physical activity interventions in rural and urban/suburban communities: a systematic review and meta-analysis. Obes Rev. (2021) 22:e13265. doi: 10.1111/obr.13265
12. Pfledderer, CD, Kwon, S, Strehli, I, Byun, W, and Burns, RD. The effects of playground interventions on accelerometer-assessed physical activity in pediatric populations: a meta-analysis. Int J Environ Res Public Health. (2022) 19:3445. doi: 10.3390/ijerph19063445
13. Metcalf, B, Henley, W, and Wilkin, T. Effectiveness of intervention on physical activity of children: systematic review and meta-analysis of controlled trials with objectively measured outcomes (EarlyBird 54). BMJ. (2012) 345:e5888. doi: 10.1136/bmj.e5888
14. Watson, A, Timperio, A, Brown, H, Best, K, and Hesketh, KD. Effect of classroom-based physical activity interventions on academic and physical activity outcomes: a systematic review and meta-analysis. Int J Behav Nutr Phys Act. (2017) 14:114. doi: 10.1186/s12966-017-0569-9
15. Ridley, K, Zabeen, S, and Lunnay, BK. Children’s physical activity levels during organised sports practices. J Sci Med Sport. (2018) 21:930–4. doi: 10.1016/j.jsams.2018.01.019
16. Lee, JE, Pope, Z, and Gao, Z. The role of youth sports in promoting Children’s physical activity and preventing pediatric obesity: a systematic review. Behav Med. (2018) 44:62–76. doi: 10.1080/08964289.2016.1193462
17. van Sluijs, EMF, Ekelund, U, Crochemore-Silva, I, Guthold, R, Ha, A, Lubans, D, et al. Physical activity behaviours in adolescence: current evidence and opportunities for intervention. Lancet. (2021) 398:429–42. doi: 10.1016/S0140-6736(21)01259-9
18. Franzini, L, Taylor, W, Elliott, MN, Cuccaro, P, Tortolero, SR, Janice Gilliland, M, et al. Neighborhood characteristics favorable to outdoor physical activity: disparities by socioeconomic and racial/ethnic composition. Health Place. (2010) 16:267–74. doi: 10.1016/j.healthplace.2009.10.009
19. Costs to Play Trends . Project Play. Available at: https://projectplay.org/state-of-play-2022/costs-to-play-trends (Accessed October 3, 2023).
20. Tremblay, M, Gray, C, Babcock, S, Barnes, J, Bradstreet, C, Carr, D, et al. Position statement on active outdoor play. Int J Environ Res Public Health. (2015) 12:6475–505. doi: 10.3390/ijerph120606475
21. Pellegrini, AD, Horvat, M, and Huberty, P. The relative cost of children’s physical play. Anim Behav. (1998) 55:1053–61. doi: 10.1006/anbe.1997.0658
22. Armstrong, G, Maitland, C, Lester, L, Trost, S, Trapp, G, Boruff, B, et al. Associations between the home yard and preschoolers’ outdoor play and physical activity. Public Health Res Pract. (2019) 29:1–9. doi: 10.17061/phrp2911907
23. Boxberger, K, and Reimers, A. Parental correlates of outdoor play in boys and girls aged 0 to 12—a systematic review. Int J Environ Res Public Health. (2019) 16:190. doi: 10.3390/ijerph16020190
24. Pearson, N, Griffiths, P, Van Sluijs, E, Atkin, AJ, Khunti, K, and Sherar, LB. Associations between socioeconomic position and young people’s physical activity and sedentary behaviour in the UK: a scoping review. BMJ Open. (2022) 12:e051736. doi: 10.1136/bmjopen-2021-051736
25. Heradstveit, O, Haugland, S, Hysing, M, Stormark, KM, Sivertsen, B, and Bøe, T. Physical inactivity, non-participation in sports and socioeconomic status: a large population-based study among Norwegian adolescents. BMC Public Health. (2020) 20:1010. doi: 10.1186/s12889-020-09141-2
26. Stalsberg, R, and Pedersen, AV. Effects of socioeconomic status on the physical activity in adolescents: a systematic review of the evidence: effects of socioeconomic status on the physical activity in adolescents. Scand J Med Sci Sports. (2010) 20:368–83. doi: 10.1111/j.1600-0838.2009.01047.x
27. Bevan, N, Drummond, C, Abery, L, Elliott, S, Pennesi, JL, Prichard, I, et al. More opportunities, same challenges: adolescent girls in sports that are traditionally constructed as masculine. Sport Educ Soc. (2021) 26:592–605. doi: 10.1080/13573322.2020.1768525
28. Papini, NM, Yang, CH, Do, B, Mason, TB, and Lopez, NV. External contexts and movement behaviors in ecological momentary assessment studies: a systematic review and future directions. Int Rev Sport Exerc Psychol. (2020) 16:337–67. doi: 10.1080/1750984X.2020.1858439
29. State Data . State of childhood obesity. Available at: https://stateofchildhoodobesity.org/state-data/ (Accessed October 3, 2023).
30. Rayo-Garza, C. KIDS COUNT data book: Texas children need us now more than ever – every Texan (2022). Available at: https://everytexan.org/2023/03/17/2022-kids-count-data-book-texas-children-need-us-now-more-than-ever/ (Accessed October 3, 2023)
31. Hoelscher, DM, Day, RS, Lee, ES, Frankowski, RF, Kelder, SH, Ward, JL, et al. Measuring the prevalence of overweight in Texas schoolchildren. Am J Public Health. (2004) 94:1002–8. doi: 10.2105/AJPH.94.6.1002
32. Hoelscher, DM, Day, RS, Kelder, SH, and Ward, JL. Reproducibility and validity of the secondary level school-based nutrition monitoring student questionnaire. J Am Diet Assoc. (2003) 103:186–94. doi: 10.1053/jada.2003.50031
33. Elder, K, Smith, C, Niday, C, Massie, A, Reat, A, Cook, M, et al. Implementing statewide health surveillance in schools: processes and lessons learned from the Texas SPAN project. Health Behav Policy Rev. (2021) 8:412–421. doi: 10.14485/HBPR.8.5.2
34. The SAS Program for CDC Growth Charts that Includes the Extended BMI Calculations (2023). Available at: https://www.cdc.gov/nccdphp/dnpao/growthcharts/resources/sas.htm (Accessed October 3, 2023).
35. CDC . BMI for Children and Teens. Centers for Disease Control and Prevention (2023). Available at: https://www.cdc.gov/obesity/basics/childhood-defining.html (Accessed October 3, 2023).
36. Texas Education Agency . Economic Disadvantage Code. Available at: http://ritter.tea.state.tx.us/peims/standards/1314/c054.html
37. National School Lunch Program | Food and Nutrition Service . Available at: https://www.fns.usda.gov/nslp (Accessed October 3, 2023).
38. Office of the Assistant Secretary for Planning and Evaluation . HHS Poverty Guidelines for 2023. Available at: https://aspe.hhs.gov/topics/poverty-economic-mobility/poverty-guidelines
39. Perez, A, Hoelscher, DM, Frankowski, RF, Day, RS, and Lee, ES. Statistical design, sampling weights and weight adjustments of the school physical activity and nutrition (SPAN) population-based surveillance 2009-2010 study. Oint Stat Meet Proc Sect Stat Epidemiol (2010):3397–404.
40. Wolter, KM . Taylor series methods In: Introduction to variance estimation. ed. US Department of Education, Office of Educational Research and Improvement. New York: Springer (2007). 226–71.
41. Schober, P, and Vetter, TR. Count data in medical research: Poisson regression and negative binomial regression. Anesth Analg. (2021) 132:1378–9. doi: 10.1213/ANE.0000000000005398
42. Jekauc, D, Reimers, AK, Wagner, MO, and Woll, A. Prevalence and socio-demographic correlates of the compliance with the physical activity guidelines in children and adolescents in Germany. BMC Public Health. (2012) 12:714. doi: 10.1186/1471-2458-12-714
43. Pfledderer, CD, Beets, MW, Burkart, S, Adams, EL, Weaver, RG, Zhu, X, et al. Impact of virtual vs. in-person school on children meeting the 24-h movement guidelines during the COVID-19 pandemic. Int J Environ Res Public Health. (2022) 19:1–9. doi: 10.3390/ijerph191811211
44. Friel, CP, Duran, AT, Shechter, A, and Diaz, KM. U.S. children meeting physical activity, screen time, and sleep guidelines. Am J Prev Med. (2020) 59:513–21. doi: 10.1016/j.amepre.2020.05.007
45. Haughton, CF, Wang, ML, and Lemon, SC. Racial/ethnic disparities in meeting 5-2-1-0 recommendations among children and adolescents in the United States. J Pediatr. (2016) 175:188–194.e1. doi: 10.1016/j.jpeds.2016.03.055
46. Kracht, CL, Webster, EK, and Staiano, AE. Sociodemographic differences in young children meeting 24-hour movement guidelines. J Phys Act Health. (2019) 16:908–15. doi: 10.1123/jpah.2019-0018
47. Pfledderer, CD, Burkart, S, Dugger, R, Parker, H, von Klinggraeff, L, Okely, AD, et al. The impact of different data handling strategies on the proportion of children classified as meeting 24-h movement guidelines and associations with overweight and obesity. JASSB. (2024) 3:1. doi: 10.1186/s44167-023-00041-5
48. Falese, L, Federico, B, Kunst, AE, Perelman, J, Richter, M, Rimpelä, A, et al. The association between socioeconomic position and vigorous physical activity among adolescents: a cross-sectional study in six European cities. BMC Public Health. (2021) 21:866. doi: 10.1186/s12889-021-10791-z
49. Elgar, FJ, Pförtner, TK, Moor, I, De Clercq, B, Stevens, GWJM, and Currie, C. Socioeconomic inequalities in adolescent health 2002–2010: a time-series analysis of 34 countries participating in the health behaviour in school-aged children study. Lancet. (2015) 385:2088–95. doi: 10.1016/S0140-6736(14)61460-4
50. Katzmarzyk, PT, Denstel, KD, Beals, K, Bolling, C, Wright, C, Crouter, SE, et al. Results from the United States of America’s 2016 report card on physical activity for children and youth. J Phys Act Health. (2016) 13:S307–13. doi: 10.1123/jpah.2016-0321
51. KFF . Distribution of Total Population by Federal Poverty Level. Available at: https://www.kff.org/other/state-indicator/distribution-by-fpl/ (Accessed October 3, 2023).
52. Vella, SA, Swann, C, Allen, MS, Schweickle, MJ, and Magee, CA. Bidirectional associations between sport involvement and mental health in adolescence. Med Sci Sports Exerc. (2017) 49:687–94. doi: 10.1249/MSS.0000000000001142
53. Hebert, JJ, Klakk, H, Møller, NC, Grøntved, A, Andersen, LB, and Wedderkopp, N. The prospective Association of Organized Sports Participation with Cardiovascular Disease Risk in children (the CHAMPS study-DK). Mayo Clin Proc. (2017) 92:57–65. doi: 10.1016/j.mayocp.2016.08.013
54. Dunton, G, McConnell, R, Jerrett, M, Wolch, J, Lam, C, Gilliland, F, et al. Organized physical activity in young school children and subsequent 4-year change in body mass index. Arch Pediatr Adolesc Med. (2012) 166:713–8. doi: 10.1001/archpediatrics.2012.20
55. Burns, RD, Brusseau, TA, Pfledderer, CD, and Fu, Y. Sports participation correlates with academic achievement: results from a large adolescent sample within the 2017 U.S. National Youth Risk Behavior Survey. Percept Mot Skills. (2020) 127:448–67. doi: 10.1177/0031512519900055
56. Smith, PK ed. Children’s play: Research developments and practical applications. London: Routledge (2018).
57. Crawford, D, Timperio, A, Giles-Corti, B, Ball, K, Hume, C, Roberts, R, et al. Do features of public open spaces vary according to neighbourhood socio-economic status? Health Place. (2008) 14:889–93. doi: 10.1016/j.healthplace.2007.11.002
58. Tandon, PS, Zhou, C, Sallis, JF, Cain, KL, Frank, LD, and Saelens, BE. Home environment relationships with children’s physical activity, sedentary time, and screen time by socioeconomic status. Int J Behav Nutr Phys Act. (2012) 9:88. doi: 10.1186/1479-5868-9-88
59. Buehler, R, Pucher, J, and Bauman, A. Physical activity from walking and cycling for daily travel in the United States, 2001–2017: demographic, socioeconomic, and geographic variation. J Transp Health. (2020) 16:100811. doi: 10.1016/j.jth.2019.100811
60. Lidbe, A, Li, X, Adanu, EK, Nambisan, S, and Jones, S. Exploratory analysis of recent trends in school travel mode choices in the U.S. Transp Res Interdiscip Perspect. (2020) 6:100146. doi: 10.1016/j.trip.2020.100146
61. Kerr, J, Rosenberg, D, Sallis, JF, Saelens, BE, Frank, LD, and Conway, TL. Active commuting to school: associations with environment and parental concerns. Med Sci Sports Exerc. (2006) 38:787–93. doi: 10.1249/01.mss.0000210208.63565.73
62. Bringolf-Isler, B, Grize, L, Mäder, U, Ruch, N, Sennhauser, FH, and Braun-Fahrländer, C. Personal and environmental factors associated with active commuting to school in Switzerland. Prev Med. (2008) 46:67–73. doi: 10.1016/j.ypmed.2007.06.015
63. Pfledderer, CD, Burns, RD, Byun, W, Carson, RL, Welk, GJ, and Brusseau, TA. Parent and child perceptions of barriers to active school commuting. J Sch Health. (2021) 91:1014–23. doi: 10.1111/josh.13090
64. Davison, KK, Werder, JL, and Lawson, CT. Children’s active commuting to school: current knowledge and future directions. Prev Chronic Dis. (2008) 5:A100.
65. Aranda-Balboa, MJ, Chillón, P, Saucedo-Araujo, RG, Molina-García, J, and Huertas-Delgado, FJ. Children and parental barriers to active commuting to school: a comparison study. Int J Environ Res Public Health. (2021) 18:2504. doi: 10.3390/ijerph18052504
66. Huertas-Delgado, FJ, Herrador-Colmenero, M, Villa-González, E, Aranda-Balboa, MJ, Cáceres, MV, Mandic, S, et al. Parental perceptions of barriers to active commuting to school in Spanish children and adolescents. Eur J Pub Health. (2017) 27:ckw249–421. doi: 10.1093/eurpub/ckw249
67. Bungum, TJ, Lounsbery, M, Moonie, S, and Gast, J. Prevalence and correlates of walking and biking to school among adolescents. J Community Health. (2009) 34:129–34. doi: 10.1007/s10900-008-9135-3
68. McDonald, NC, Brown, AL, Marchetti, LM, and Pedroso, MS. U.S. school travel, 2009. Am J Prev Med. (2011) 41:146–51. doi: 10.1016/j.amepre.2011.04.006
69. Kontou, E, McDonald, NC, Brookshire, K, Pullen-Seufert, NC, and La Jeunesse, S. U.S. active school travel in 2017: prevalence and correlates. Prev Med Rep. (2019) 17:101024. doi: 10.1016/j.pmedr.2019.101024
70. Kaseva, K, Lounassalo, I, Yang, X, Kukko, T, Hakonen, H, Kulmala, J, et al. Associations of active commuting to school in childhood and physical activity in adulthood. Sci Rep. (2023) 13:7642. doi: 10.1038/s41598-023-33518-z
71. Whitley, MA, Massey, WV, Camiré, M, Boutet, M, and Borbee, A. Sport-based youth development interventions in the United States: a systematic review. BMC Public Health. (2019) 19:89. doi: 10.1186/s12889-019-6387-z
72. Okely, AD, Lubans, DR, Morgan, PJ, Cotton, W, Peralta, L, Miller, J, et al. Promoting physical activity among adolescent girls: the girls in sport group randomized trial. Int J Behav Nutr Phys Act. (2017) 14:81. doi: 10.1186/s12966-017-0535-6
73. Matheson, EL, Schneider, J, Tinoco, A, Gentili, C, Silva-Breen, H, LaVoi, NM, et al. The co-creation, initial piloting, and protocol for a cluster randomised controlled trial of a coach-led positive body image intervention for girls in sport. BMC Public Health. (2023) 23:1467. doi: 10.1186/s12889-023-16360-w
74. Pedersen, M, and King, AC. How can sport-based interventions improve health among women and girls? A scoping review. Int J Environ Res Public Health. (2023) 20:4818. doi: 10.3390/ijerph20064818
75. Eime, R, Harvey, J, Charity, M, and Westerbeek, H. Longitudinal trends in sport participation and retention of women and girls. Front Sports Act Living. (2020) 2:39. doi: 10.3389/fspor.2020.00039
76. Tanaka, MJ, LiBrizzi, CL, Rivenburgh, DW, and Jones, LC. Changes in U.S. girls’ participation in high school sports: implications for injury awareness. Phys Sportsmed. (2021) 49:450–4. doi: 10.1080/00913847.2020.1852861
77. Pila, E, Sabiston, CM, Mack, DE, Wilson, PM, Brunet, J, Kowalski, KC, et al. Fitness- and appearance-related self-conscious emotions and sport experiences: a prospective longitudinal investigation among adolescent girls. Psychol Sport Exerc. (2020) 47:101641. doi: 10.1016/j.psychsport.2019.101641
78. Willson, E, and Kerr, G. Gender-based violence in girls’ sports. Adolescents. (2023) 3:278–89. doi: 10.3390/adolescents3020020
79. Pedersen, S, and Seidman, E. Team sports achievement and self-esteem development among urban adolescent girls. Psychol Women Q. (2004) 28:412–22. doi: 10.1111/j.1471-6402.2004.00158.x
80. Cooky, C . “Girls just Aren’t interested”: the social construction of interest in girls’ sport. Sociol Perspect. (2009) 52:259–83. doi: 10.1525/sop.2009.52.2.259
81. Sandseter, EBH . Characteristics of risky play. J Adventure Educ Outdoor Learn. (2009) 9:3–21. doi: 10.1080/14729670802702762
82. Hansen Sandseter, EB . Categorising risky play—how can we identify risk-taking in children’s play? Eur Early Child Educ Res J. (2007) 15:237–52. doi: 10.1080/13502930701321733
83. Lee, RLT, Lane, S, Brown, G, Leung, C, Kwok, SWH, and Chan, SWC. Systematic review of the impact of unstructured play interventions to improve young children’s physical, social, and emotional wellbeing. Nurs Health Sci. (2020) 22:184–96. doi: 10.1111/nhs.12732
84. Dankiw, KA, Tsiros, MD, Baldock, KL, and Kumar, S. The impacts of unstructured nature play on health in early childhood development: a systematic review. PLoS One. (2020) 15:e0229006. doi: 10.1371/journal.pone.0229006
85. Veitch, J, Bagley, S, Ball, K, and Salmon, J. Where do children usually play? A qualitative study of parents’ perceptions of influences on children’s active free-play. Health Place. (2006) 12:383–93. doi: 10.1016/j.healthplace.2005.02.009
86. Wray, A, Martin, G, Ostermeier, E, Medeiros, A, Little, M, Reilly, K, et al. Physical activity and social connectedness interventions in outdoor spaces among children and youth: a rapid review. Health Promot Chronic Dis Prev Can. (2020) 40:104–15. doi: 10.24095/hpcdp.40.4.02
87. Brazendale, K, Beets, MW, Weaver, RG, Pate, RR, Turner-McGrievy, GM, Kaczynski, AT, et al. Understanding differences between summer vs. school obesogenic behaviors of children: the structured days hypothesis. Int J Behav Nutr Phys Act. (2017) 14:100. doi: 10.1186/s12966-017-0555-2
88. Santos, MP, Esculcas, C, and Mota, J. The relationship between socioeconomic status and adolescents’ organized and nonorganized physical activities. Pediatr Exerc Sci. (2004) 16:210–8. doi: 10.1123/pes.16.3.210
89. Torre, GL, Masala, D, de Vito, E, Langiano, E, Capelli, G, Ricciardi, W, et al. Extra-curricular physical activity and socioeconomic status in Italian adolescents. BMC Public Health. (2006) 6:22. doi: 10.1186/1471-2458-6-22
90. United States Census Bureau . Texas Population Estimates. Available at: https://www.census.gov/quickfacts/fact/table/TX/PST045222 (Accessed October 3, 2023)
Keywords: physical activity, context, children, sports, outdoor play, organized activities, active travel
Citation: Pfledderer CD, Brown DMY, Ranjit N, Springer AE, Malkani RI, Salvo D and Hoelscher DM (2024) Examining associations between physical activity context and children meeting daily physical activity guidelines: the role of outdoor play, sports, and other organized activities. Front. Public Health. 12:1352644. doi: 10.3389/fpubh.2024.1352644
Edited by:
Jennifer Sacheck, George Washington University, United StatesReviewed by:
Lin Luo, Guizhou Normal University, ChinaJin Yan, Soochow University, China
Mirko Brandes, Leibniz Institute for Prevention Research and Epidemiology – BIPS, Germany
Copyright © 2024 Pfledderer, Brown, Ranjit, Springer, Malkani, Salvo and Hoelscher. This is an open-access article distributed under the terms of the Creative Commons Attribution License (CC BY). The use, distribution or reproduction in other forums is permitted, provided the original author(s) and the copyright owner(s) are credited and that the original publication in this journal is cited, in accordance with accepted academic practice. No use, distribution or reproduction is permitted which does not comply with these terms.
*Correspondence: Christopher D. Pfledderer, Y2hyaXN0b3BoZXIuZC5wZmxlZGRlcmVyQHV0aC50bWMuZWR1