 Zehan Pan
 Weizhen Dong
 Zuyu Huang
- 1School of Social Development and Public Policy, Fudan University, Shanghai, China
- 2Department of Sociology and Legal Studies, University of Waterloo, Waterloo, ON, Canada
- 3School of Public Administration, Hunan University, Changsha, China
Clarifying the association between city population size and older adults’ health is vital in understanding the health disparity across different cities in China. Using a nationally representative dataset, this study employed Multilevel Mixed-effects Probit regression models and Sorting Analysis to elucidate this association, taking into account the sorting decisions made by older adults. The main results of the study include: (1) The association between city population size and the self-rated health of older adults shifts from a positive linear to an inverted U-shaped relationship once individual socioeconomic status is controlled for; the socioeconomic development of cities, intertwined with the growth of their populations, plays a pivotal role in yielding health benefits. (2) There is a sorting effect in older adults’ residential decisions; compared to cities with over 5 million residents, unobserved factors result in smaller cities hosting more less-healthy older adults, which may cause overestimation of health benefits in cities with greater population size. (3) The evolving socioeconomic and human-made environment resulting from urban population growth introduces health risks for migratory older adults but yields benefits for those with local resident status who are male, aged over 70, and have lower living standards and socioeconomic status. And (4) The sorting effects are more pronounced among older adults with greater resources supporting their mobility or those without permanent local resident status. Thus, policymakers should adapt planning and development strategies to consider the intricate relationship between city population size and the health of older adults.
1 Introduction
China’s pace of urban development has been notably accelerated in the past three decades. Concurrently, the country has transitioned into an emerging aging society, with 18.9% of its population aged 60 and over by the end of 2021 (1). These intertwined trends have led to an increasing number of older Chinese individuals residing in cities. From 2010 to 2020, the proportion of older Chinese adults living in urban areas rose from approximately 44% to almost 54% (2). Against this background, the quality of life for urban older adults, particularly regarding their health, is gaining heightened attention from both the general public and policymakers in China (3). On one hand, China’s urban landscape is characterized by a hierarchical city system, marked notably by variations in population size. On the other hand, the regional health disparity among older adults tends to expand over the past decade (4). However, no study has yet endeavored to elucidate the association between city population size and older adults’ general health. Addressing this complex yet meaningful question not only aids in comprehending the intercity disparity in older adults’ general health but is also vital for developing targeted strategies to ensure that various cities are age-friendly.
Utilizing data from the micro-data sample of the Chinese 1% national population sample survey in 2015, this study aims to explore the following research questions: Is there an association between city population size and older adults’ health? Does this association differ across various groups of older adults? Do the sorting decisions of older adults regarding residential places alter this association? Multilevel Mixed-effects Probit regression models are constructed to investigate the association between city population size and the self-rated health of urban older adults. Building upon the regression results, we compare the regression residuals between cities of different population sizes to examine older adults’ sorting decisions. Subsequently, a heterogeneity analysis across groups of elders with different characteristics is conducted.
2 Literature review
2.1 Urban population growth in China’s cities
Since the gradual relaxation of population movement restrictions in the 1980s, surplus agricultural laborers in rural China began migrating to cities in pursuit of non-farm wage employment opportunities, marking the initiation of China’s rapid urbanization process. While many rural–urban migrants initially settled in cities near their hometowns, a considerable number undertook long-distance migration to the country’s major urban centers. Consequently, Chinese cities have undergone substantial population growth over the past three decades, leading to an increase in the number of cities across all population size brackets (5). Notably, the growth in the number of cities with residents exceeding 1 million has outpaced that of smaller cities. The central and western regions have witnessed a more pronounced increase in the number of cities with populations below 5 million, while the eastern region has experienced a more substantial rise in cities with over 5 million residents. As of 2020, the average population of Chinese cities stood at approximately 0.84 million. Among all cities in China, 522 have populations ranging from 0.1 to 1 million, 84 have populations between 1 and 5 million, and 21 exceed 5 million residents (2). Consequently, China’s urban landscape is characterized by a hierarchical city system, notably marked by variations in population size.
2.2 Health disparity among older adults across cities
While numerous studies delve into the rural–urban gap and regional patterns at a broader spatial scale, there is a distinct shortage of investigations examining nuanced intercity variations in general health among older adults. To deduce the potential effects of urban population growth on the general health of older adults, we conducted a review of the determinants of health associated with population growth.
At the individual and household level, it has become evident that disparities in individual socioeconomic status play a predominant role in the health disparity experienced by older adults (6). A decomposition analysis of the concentration index, following the framework outlined by Wagstaff (7), revealed that household income significantly contributes to health inequality among Chinese older adults, accounting for 41.15% (8). This income-related contribution surpasses that of gender or age, underscoring a pervasive health disparity between affluent and economically disadvantaged older populations in China.
On a regional scale, the socioeconomic development level of cities emerges as a pivotal determinant shaping disparity in the general health of older adults across cities with varying population sizes. First, urban population expansion can positively impact residents’ health through economies of scale. Population growth in a city often translates to increased employment opportunities and more secure incomes (9, 10). Second, residents in larger cities are more likely to enjoy enhanced public services due to superior local fiscal conditions. Over the past decades in China, a rapid concentration of the population, particularly the working-age demographic, towards more developed cities such as provincial capitals and metropolitan areas can be observed (11). This population redistribution has resulted in intercity disparities in socioeconomic development and corresponding incongruities in local fiscal conditions. In China, sub-national governments bear the primary responsibilities for public goods and services within the decentralized fiscal system (12). Approximately 47.6% of the total budgetary revenue was collected by the local governments, while they bore 80% of the total budgetary expenditure (13). Hence, the provision of healthcare facilities, services, and health insurance and pension schemes greatly varies among cities, which further influences older adults’ health disparity (14, 15). Cities with larger populations find it easier to provide superior infrastructure and public services in health, sanitation, and education at lower fixed costs (10, 16, 17). Individuals in larger cities are also more likely to benefit from a comprehensive security system (18, 19). According to the Annual Report on Urban Health Life 2021 in China, Beijing and Shanghai hold the top two positions in both overall resident health and health equality among residents (20).
However, urban population growth also has negative impacts on residents’ health. Overcrowded cities are more vulnerable to “urban diseases” such as traffic congestion, environmental degradation, scarcity of natural resources, the decline in living space, and the increase in crime (21–23). The overexpansion of cities is also likely to deteriorate neighborhood conditions that jeopardize urban residents’ health. For instance, people living in relatively poor conditions (in a densely populated area, away from the natural environment) may face difficulties in social relations with others (24, 25). The quality of health-related services received by urban residents would be compromised if the supply growth of community medical resources could not keep up with the relentless growth of the population (10). Similar examples can also be found for other pathways where community poverty, deprivation, and disadvantage occur (26–28). In addition, urban population growth is believed to be associated with reducing urban residents’ physical activity, thus putting them at greater risk of chronic disease. These unfavorable outcomes led by urban expansion, commonly known as the urban health penalty, would mitigate the positive effects of urban expansion on the residents’ health.
2.3 Sorting decisions
From an individual standpoint, when individuals evaluate the advantages and disadvantages of residing in densely populated cities, they often make choices based on their health status, adding a layer of complexity to the correlation between a city’s population size and the health of its residents (29, 30). According to the Emigration Selection Theory, individuals contemplating a move may decide on their destination based on their health condition (31–33). Those with poorer health are less inclined to become migrants, primarily due to the physically and/or psychologically demanding nature of jobs typically associated with migration destinations, which tend to select against individuals with adverse health conditions (32). The Salmon Bias Hypothesis also supports this notion, positing that individuals in poor health are more likely to return to or relocate closer to their hometowns than their healthier counterparts. This is attributed to the perception that unhealthy migrants may face increased challenges in the labor market when residing far away from their hometowns (31, 34). Moreover, older adults with diminished health status may encounter greater difficulty adapting to life in larger cities (35–37). Consequently, the potential health benefits associated with urban population growth might be overstated if the impact of these individual sorting decisions is not duly taken into account.
2.4 China’s urbanization policy
Given the varying advantages and challenges arising from the surge in urban population, there exists a lack of consensus among policymakers and scholars regarding the most effective urbanization strategy. The China’s 14th Five-Year Plan (2021–2025) advocates for the removal of household registration restrictions in medium and small cities to absorb rural–urban migrants (38). Building on this initiative, in 2022, China’s State Council introduced a policy aimed at advancing urbanization, specifically targeting county towns (39, 40). However, within academic circles, there appears to be a lack of empirical support for this policy. Drawing upon the theory of economies and diseconomies of scale, various studies have unveiled an inverted U-shaped relationship between city population size and key indicators such as labor productivity (41), natural resource utilization efficiency (42), environmental impacts (43), and attractiveness to migrants (44) in Chinese cities. Notably, the turning points identified in these studies far surpass the population upper threshold defining medium and small cities in China. Despite the wealth of research, the growing urban population’s impact on the health of older residents in an increasingly aging China remains inadequately explored.
3 Materials and methods
3.1 Data and measures
3.1.1 Data
In 2015, China conducted the 1% population sample survey, commonly referred to as the “mini-census” (45). The National Bureau of Statistics has provided access to a micro-level database derived from a random 10% sample of respondents from this survey. Notably, this micro-level database comprises comprehensive information on the health, sociodemographic, and geographical characteristics of the surveyed individuals. It shares both content and organizational structure similarities with a census, providing extensive coverage and a high level of representativeness.1
Additionally, relevant data reflecting the characteristics of cities were sourced from various reputable publications, including the China Statistical Yearbook, China City Statistical Yearbook, China Urban Construction Statistical Yearbook, China Public Health Statistical Yearbook, China National Environmental Real-time Monitoring Centre, China National Meteorological Science Data Center, and China National Catalogue Service for Geographic Information. These diverse data sources contribute to a comprehensive understanding of the contextual factors and environmental elements associated with the urban areas under study.
3.1.2 Health indicator
Self-rated health (SRH) serves as a subjective indicator that reflects an individual’s assessment of their physical and mental well-being. Recognizing its significance, the World Health Organization considers self-rated health a crucial metric for population health, and it has been widely employed in various health studies (46, 47). In the 1% population sample survey, respondents were tasked with evaluating their current health status using the question: “How do you rate your current health status: healthy, fairly healthy, unhealthy-can live independently, unhealthy-cannot live independently?”
However, a potential bias may exist, as different respondent groups may interpret and use ordinal response categories differently (48). Specifically, concerning the self-rated health question in this survey, the criteria for reporting “healthy” versus “fairly healthy” show more variability than those for reporting “healthy” versus “unhealthy.” Consequently, we opted to group the first two choices as “healthy” with an assigned value of 1 and categorized the remaining options as “unhealthy” with an assigned value of 0. This approach aims to mitigate potential ambiguity in the interpretation of responses and ensures a clearer distinction for analytical purposes.
3.1.3 Defining “city”
The term “city” in China is commonly associated with a prefectural-level region rather than a specific urban center. A prefectural-level region typically comprises three distinct administrative divisions: city districts, county-level cities, and counties (see Figure 1). Despite sharing the same administrative level, these divisions have undergone varying degrees of urbanization. City districts exhibit the highest level of urbanization, followed by county-level cities, which encompass both urban and surrounding rural areas. Counties, however, typically feature small towns but generally lack prominent urban centers.
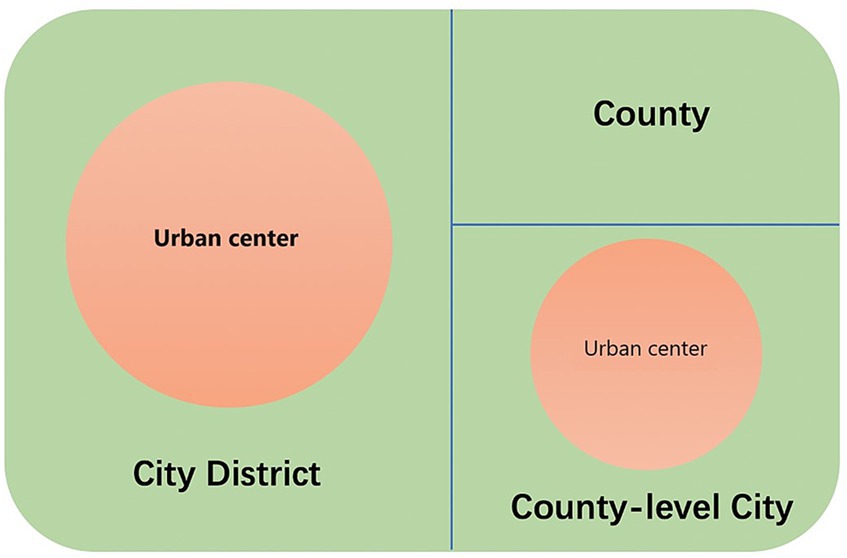
Figure 1. Prefectural-level divisions of Chinese cities.
Utilizing urban and rural classification codes at the village level, we identified the adjacent urban areas within each city district or county-level city, designating them as “urban centers” or, equivalently, “cities.” Counties were excluded from its scope. We matched individual data to these designated cities using village-level administrative codes and computed the city population size by aggregating residents who had resided in a city for over six months. The resulting dataset encompasses 79,821 older adults residing in 599 cities, inclusive of inclusive of 307 urban centers in city districts and 292 urban centers in county-level cities, spread across 30 provinces.
Table 1 shows the self-rated health status among older adults in cities of different population sizes. Most respondents from cities with more than 10 million residents reported being “Healthy” and “Fairly healthy” (91.81%). The respondents residing in the cities with smaller population sizes reported slightly less-healthy, and the proportion of the healthy group generally declined as the city size decreased. In the cities with less than 0.1 million residents, 88.95% of respondents reported being healthy or fairly healthy. These observations preliminarily indicate that the city’s population growth may promote the self-rated health of its older adults. However, whether there is a linear association between them needs to be tested.
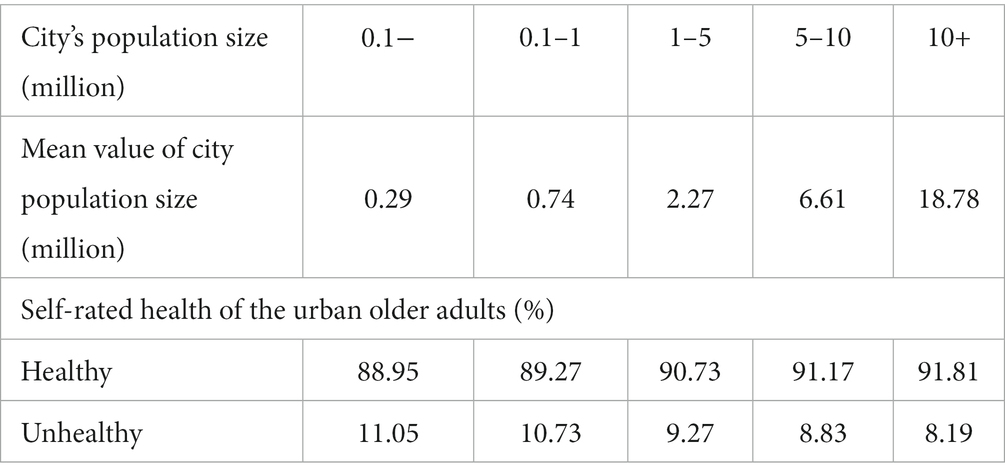
Table 1. Self-rated health of the older adults in cities of different population sizes.
3.1.4 Covariates
We built upon existing research (16, 49, 50) and employed rigorous controls for a diverse set of individual covariates spanning three key aspects: demographic, living status, and socioeconomic status. Within the demographic realm, variables such as gender, ethnicity, age, and marital status (having a spouse or not) were considered. Living status indicators encompassed whether individuals lived alone, the presence of basic amenities such as toilets and kitchens, and per capita living space. The socioeconomic status dimension involved factors like educational attainment, resident registration status, employment status, land ownership (having contracted farmlands or not), sources of income, possession of private cars, participation in pension insurance programs, and enrollment in medical insurance schemes. This comprehensive approach aimed to account for a wide range of individual characteristics that could potentially influence the outcomes under investigation.
At the city level, we initially controlled for variables pertaining to a city’s geographical conditions, encompassing annual precipitation, sunshine duration, annual average temperature, medial humidity, average land relief, average altitude, and the least distance to seaports. These exogenous variables are anticipated to simultaneously influence a city’s population size and residents’ health, without being reciprocally affected.
Further, we controlled for the variables related to the city’s socioeconomic and human-made environment (16, 49–51). These variables are expected to interact with population size and the health of older adults, serving as potential pathways through which a city’s population growth impacts the health of its older residents. Recognizing the potential collinearity among covariates depicting the cities’ socioeconomic and human-made environment, we employed factor analysis to consolidate four principal factors: Socioeconomic Development Index, Environmental Pollution Index, Afforestation Index, and Pollution Abatement Index (Supplementary Material). This combination effectively characterized a city’s contextual characteristics and accounted for approximately 74% of the total variability in the original variables.
3.2 Empirical analysis method
3.2.1 Multilevel mixed-effects Probit regression models
We adopted Multilevel Mixed-effects Probit regression models to account for the lack of sample independence within the cities and control the constant differences across the cities. It helps to identify the group structure at both individual and city levels. We included city population size and its quadratic term to explore whether there is a nonlinear association between city population size and the self-rated health of older adults. The following is our proposed Probit model (Equation 1):
Where depicts the self-rated health of the older adults living in the city j, and are the population size of city j where older adult lives and its quadratic term, respectively. and denoted a series of individual and city-level covariates. is the residual term.
3.2.2 Sorting analysis
While we controlled for various individual and city-level variables, there were still unobserved ones likely to confound with the associations between city population size and the self-rated health of older adults. A useful approach to discerning the impact of these unobserved factors is to compare the residual distribution of self-rated health among cities with varying population sizes (52). The distinctions in the residual distribution offer an illustration of the sorting decisions made by older adults based on the unobserved individual and cities’ characteristics.
Following the sorting method proposed by Combes et al. (52), we identified the shift, dilation, and truncation of the distribution in the self-rated health residuals of older adults living in cities of different sizes. We made to be the quantile of the distribution at rank , and is the Cumulative Distribution Function of the self-rated health residuals of older adults with k (1 = smaller cities, 2 = larger cities). The transformation of the self-rated health residuals yields the following relationship between the two distributions (Equation 2):
is a shift parameter, D is a dilation parameter, and is the rank that left truncation to occur.
Parameter A could be positive or negative, contingent on whether there was a right or left shift in the distribution of the self-rated health residuals of older adults in larger cities relative to that of smaller ones. A positive shift (A > 0) refers to the positive effects of city population size on older adults’ health. Figure 2A considers the case of a simple positive shift only (A > 0).
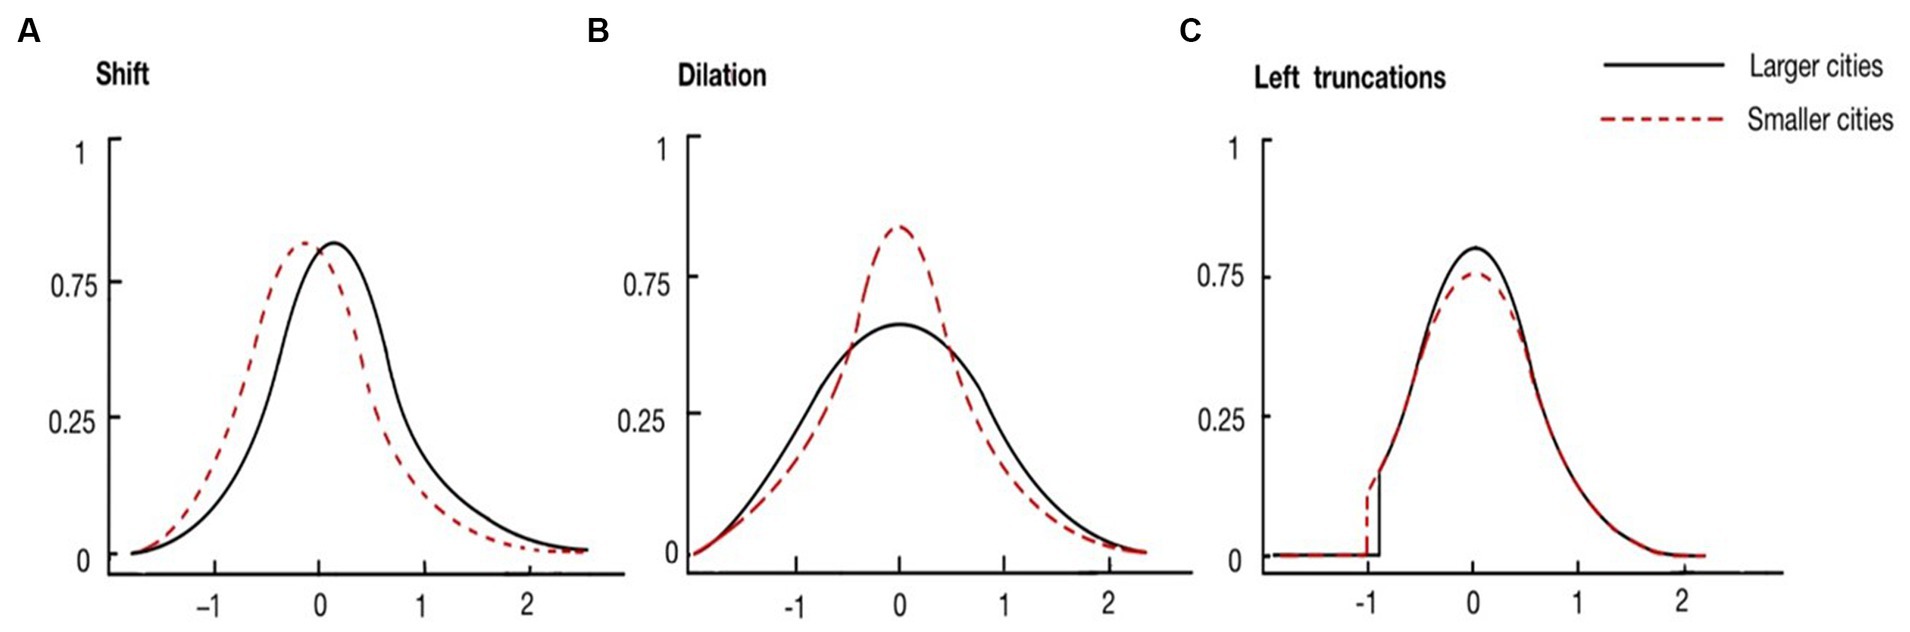
Figure 2. Three possible transformations of the distribution of self-rated health residuals. (From left to right: (A) shift, (B) dilation, (C) left trunctions).
Parameter D could be above or below one, indicating whether there was a dilation or compression in the distribution of the residuals of older adults in larger cities relative to that of smaller cities. This parameter detects the difference in the heterogeneity of elders’ self-rated health between cities of different population sizes. Figure 2B considers the case of a simple dilation only (D > 1).
Parameter S compared left truncations between the two distributions. The case of “positive” truncation (S > 0) corresponds to a situation where the distribution in larger cities would be more truncated than in smaller cities. In other words, larger cities have fewer older adults with poorer health status. This parameter examines whether there is a sorting effect for less-healthy older adults. Figure 2C considers the case of a simple left truncation only (S > 0).
4 Empirical results
4.1 From a linear to an inverted U-shaped relationship: controlling for the individual characteristics
We adopted a stepwise approach to incorporate covariates into the Multilevel Mixed-effects Probit regression models. The initial results, presented in the first two columns in Table 2, depict findings without adjusting for individual and city-level characteristics. In Model 1_1, a notable coefficient of 0.053 for city population size, signifying significance at the 1% level, indicates a positive correlation with the self-rated health of older adults. Introducing the quadratic term in Model 1_2, an insignificantly negative coefficient for the quadratic term emerges at the 10% level, suggesting a linear relationship between city population size and the self-rated health of older adults. Upon incorporating individual characteristics related to demographic and living status into the models, the coefficients for city population size remain significant at the 1% level (Model 2_1, Model 2_3). Additionally, the coefficients for the quadratic terms of city population size continue to be insignificant at the 10% level (Model 2_2, Model 2_4).
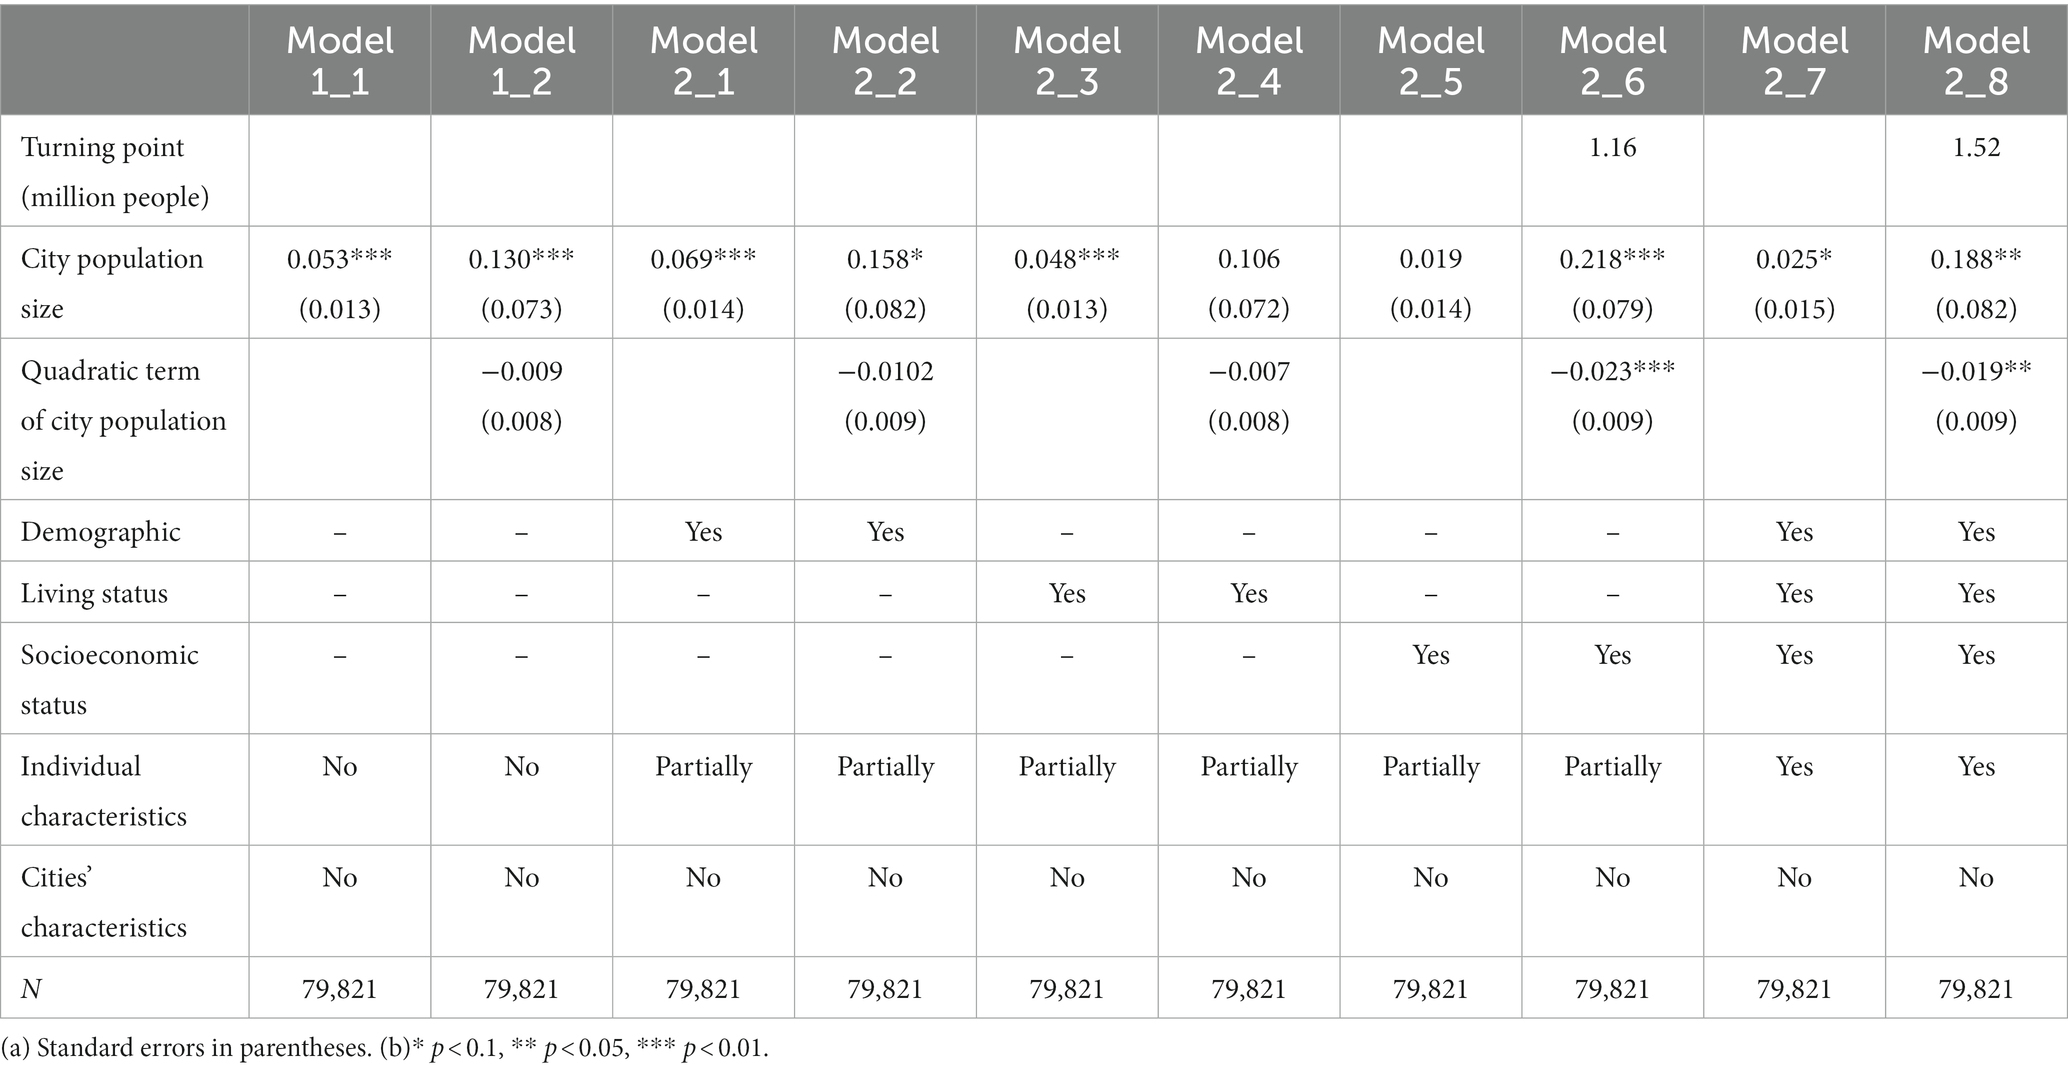
Table 2. Results of multilevel mixed-effects probit regression models controlling for individual characteristics.
However, the linear association between city population size and the self-rated health of urban older adults disappears when introducing individual characteristics related to socioeconomic status (Model 2_6). The coefficient of the quadratic term, which is significant at the 1% level, indicates an inverted U-shaped association with a turning point of 1.16 million. Furthermore, when incorporating all individual covariates, the coefficient of the quadratic term, significant at the 5% level, demonstrates an inverted U-shaped association with a turning point of 1.52 million (Model 2_8).
4.2 Shifted turning point: controlling for cities’ characteristics
Our exploration of city-level covariates reveals shifts in the optimal population size when accounting for geographical, socioeconomic, and human-made environmental factors (Table 3). Incorporating city-level variables associated with geographical conditions (Model 3), the turning point notably decreases to 1.03 million. In Model 4_1 and 4_3, where Socioeconomic Development Index and Afforestation Index were considered, both exhibited positive associations with the self-rated health of urban older adults. Notably, in comparison with Model 3, the turning point drops to 0.56 million in Model 4_1. Conversely, the Pollution Index emerges as an adverse factor impacting the self-rated health of urban older adults. The turning point increases to 1.12 million in Model 4_2. The Pollution Abatement Index shows no significant association with the health indicator in Model 4_4. This outcome is unsurprising, given that China’s pollution control practices have only gained momentum following the introduction of a stringent environmental policy by the central government in 2015 (53). Finally, the introduction of all factors related to the socioeconomic and human-made environment amplifies the inverted U-shaped association between city population size and the self-rated health of older adults, pinpointing a turning point at 0.47 million residents (Model 4_6). Simultaneously, the linear relationship became imperceptible (Model 4_5).
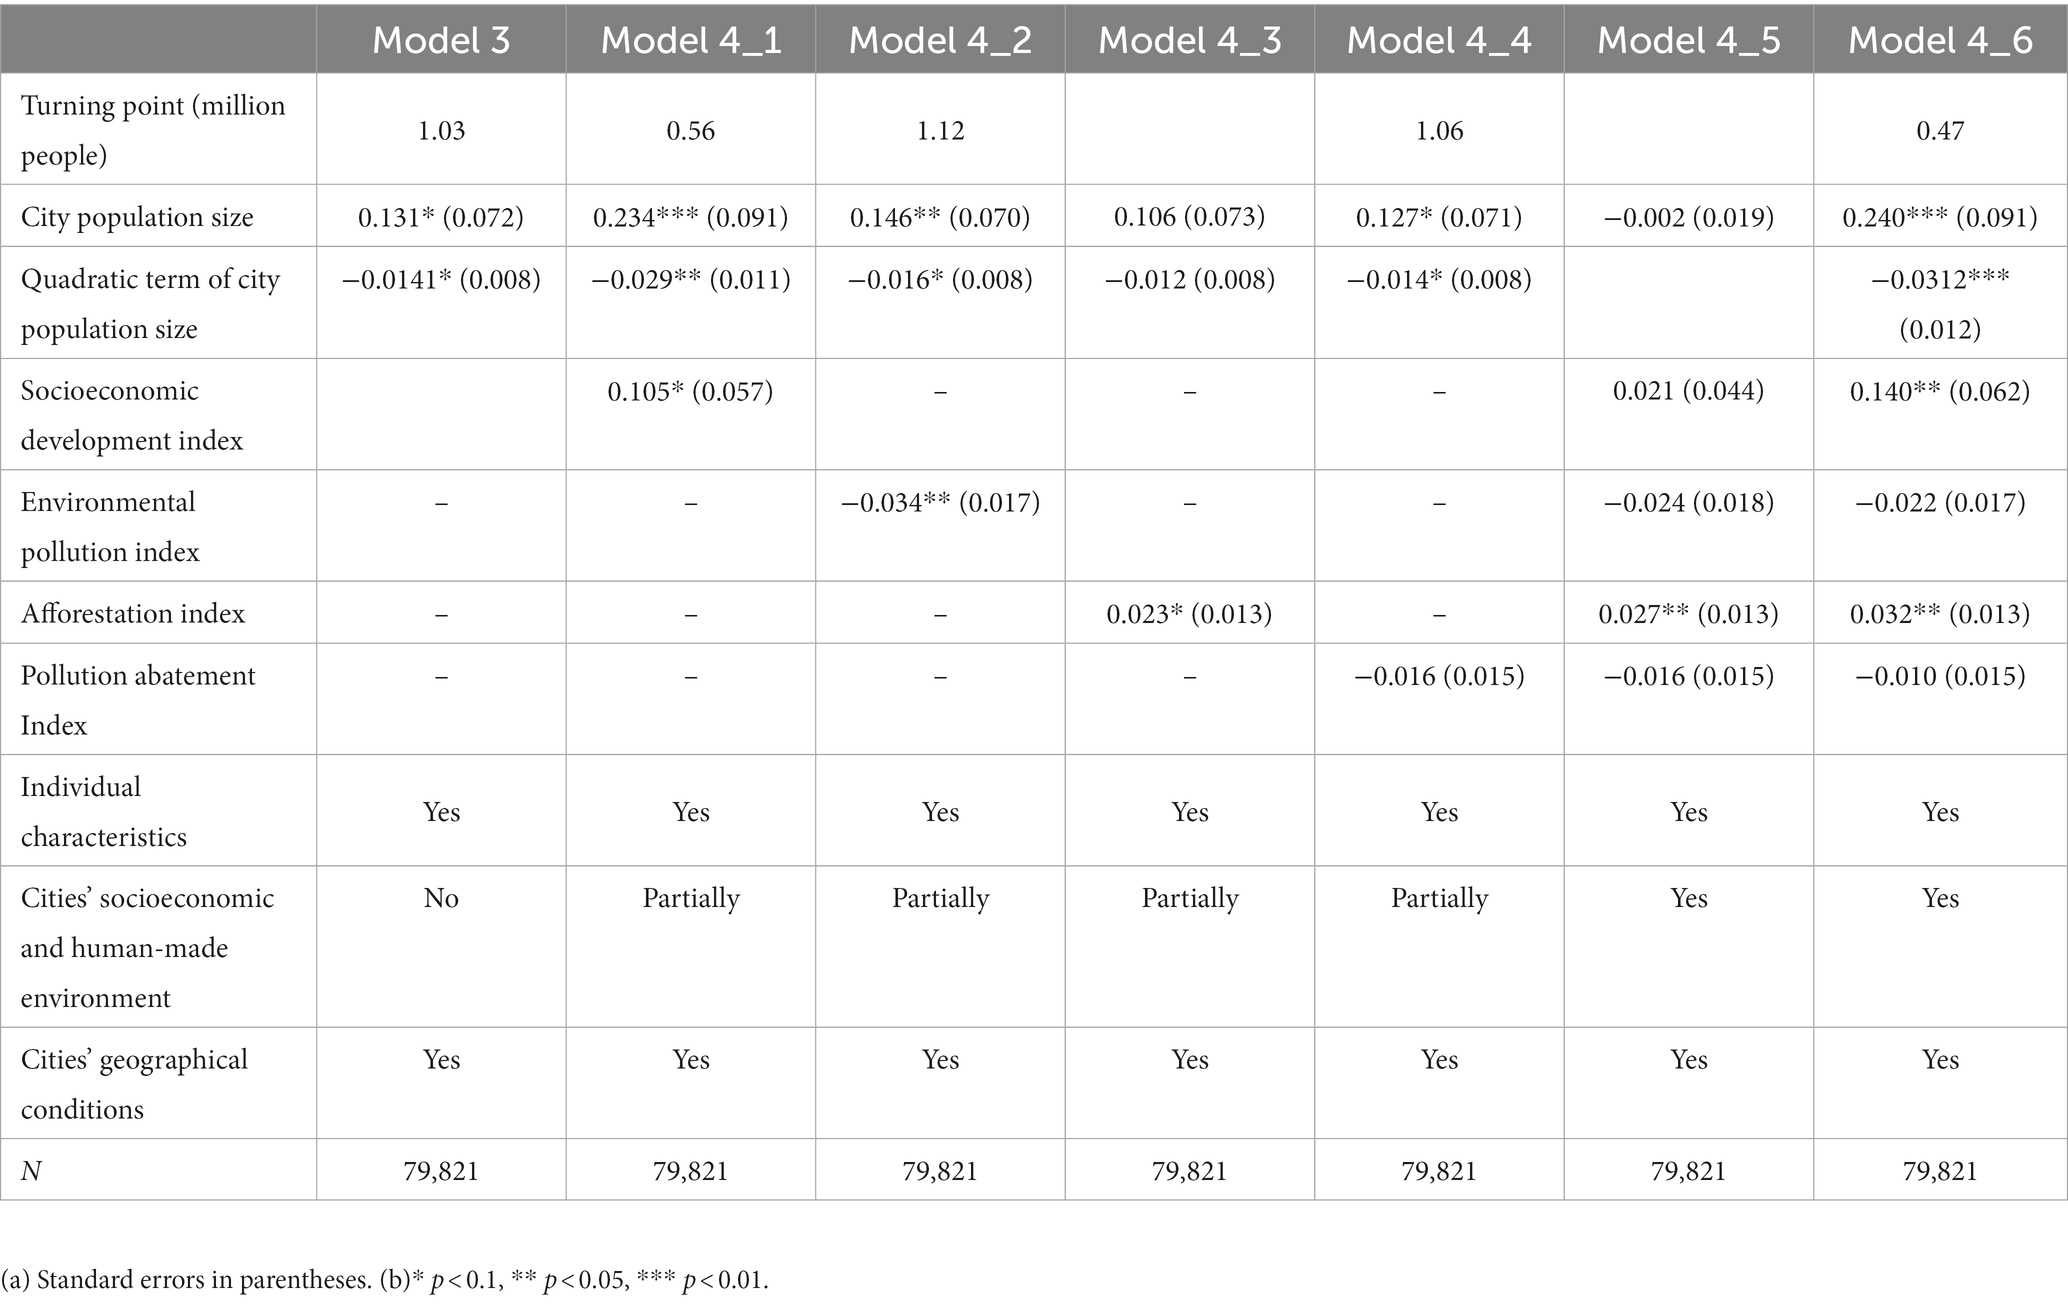
Table 3. Results of multilevel mixed-effects probit regression models controlling for city-level characteristics.
4.3 Sorting effects: small cities host less-healthy older adults
Given the potential influence of unobserved factors on the association between city population size and older adults’ self-rated health, we conducted a comparison of the residuals’ distribution derived from Model 4_6 among cities of varying population sizes using four cut-off points (Table 4). First, negative estimates of Shift A indicate that unobserved factors contribute to a relatively poorer average health status among older adults in larger cities compared to those in smaller cities. Second, positive estimates of Dilation D suggest that self-rated health residuals of older adults in larger cities tend to be more concentrated in the middle range, indicating that unobserved factors contribute to a lower dispersion of health residuals among older adults in larger cities.
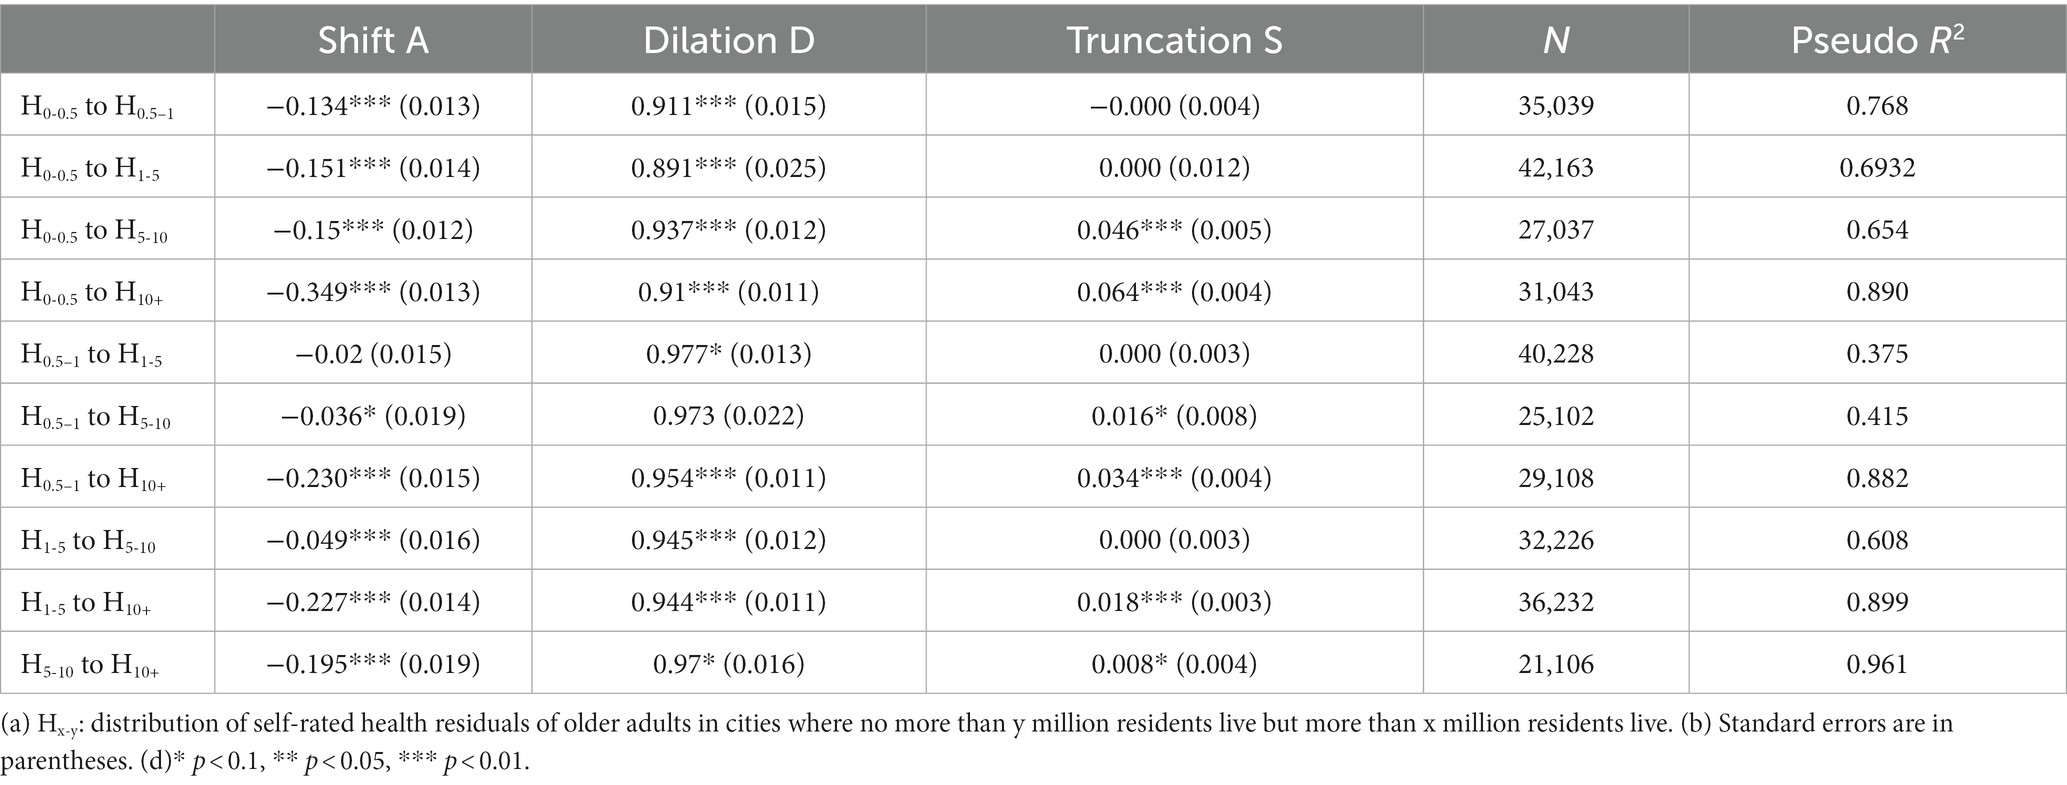
Table 4. Comparing health residuals of older adults between cities of different population sizes.
Third, truncation S estimates are significantly positive in models comparing health residuals between cities with less than 5 million residents and those with more than 5 million residents, but not significant in models comparing health residuals among cities with less than 5 million residents. These findings suggest that unobserved factors tend to concentrate less-healthy older adults in cities with less than 5 million residents. Notably, a larger truncation estimate is observed between cities with a more significant disparity in population size, with the most noticeable statistical difference in truncation parameters found between cities with less than 0.5 million people and those with over 10 million people, as illustrated in Figure 3.
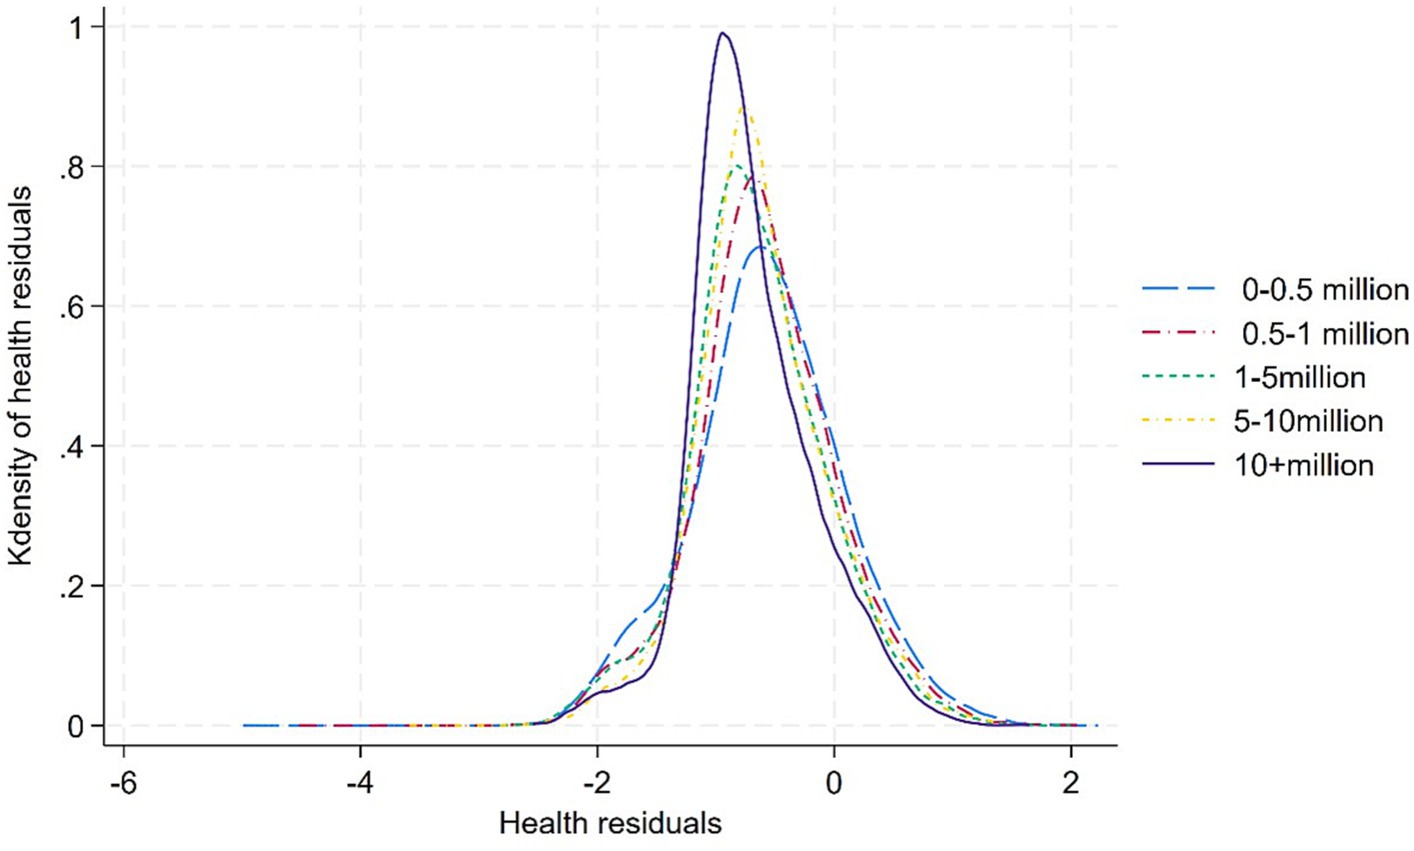
Figure 3. Health residuals of older adults in smaller vs. larger cities.
4.4 Heterogeneity across different groups of older adults
We examined how the associations between city population size and the self-rated health of older adults varied by individual characteristics, as outlined in Table 5. The relationship between city population size and the self-rated health of older adults exhibits an inverted U-shaped curve for those who were female, aged below 70, not living alone, or had received education at junior high school and above. This pattern persists both before and after accounting for cities’ socioeconomic and human-made environment. For their counterparts, the statistically significant inverted U-shaped associations emerges solely after controlling for the cities’ socioeconomic and human-made environment. Similarly, for older adults with local resident status, the statistically significant inverted U-shaped association between city population size and their self-rated health status emerges after controlling for cities’ socioeconomic and human-made environment. In contrast, for older adults without local resident status, this inverted U-shaped association becomes statistically insignificant after accounting for cities’ socioeconomic and human-made environment.
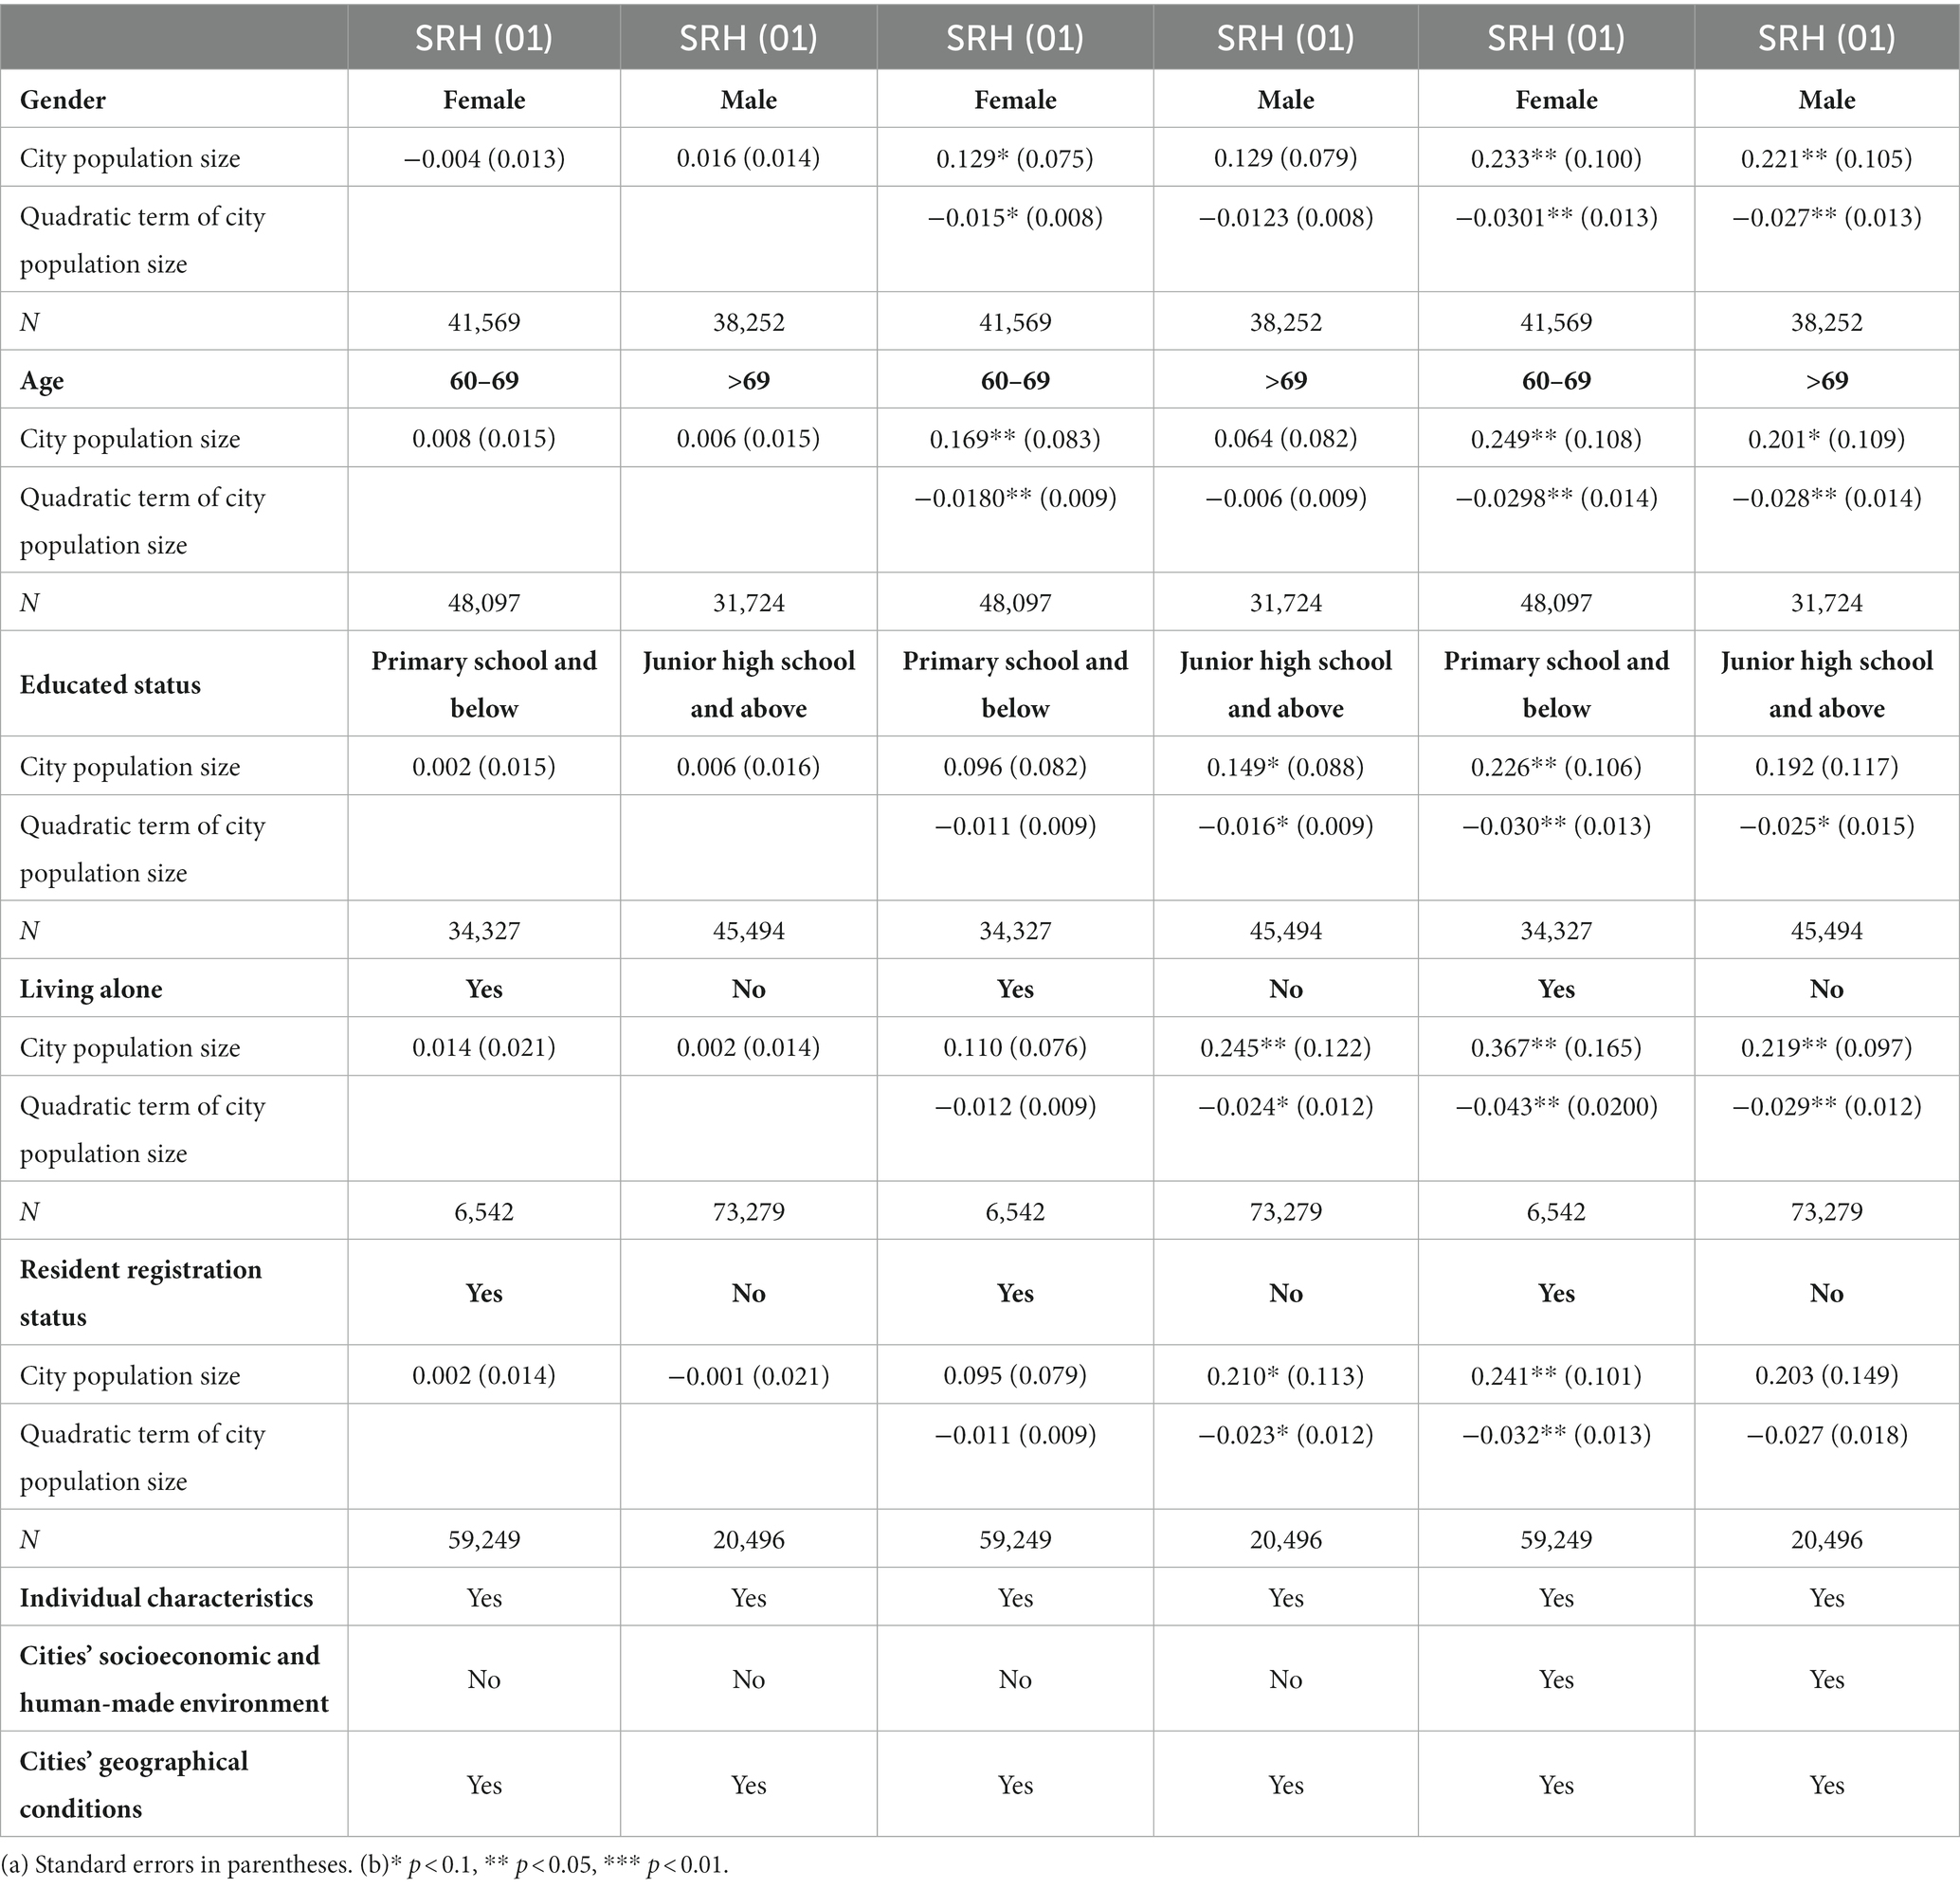
Table 5. Results of multilevel mixed-effects probit regression models stratified by individual characteristics.
Building upon the outcomes of sorting analyses, we stratified the samples of older adults residing in cities with populations of less than 5 million and those with more than 5 million residents to assess disparities in the distribution of their self-rated health residuals based on individual characteristics (Table 6). Our findings reveal that, irrespective of gender or educational attainment (whether having received a junior high school education or higher), the distribution of self-rated health residuals among older adults in larger cities consistently exhibited positive left-truncation compared to those in smaller cities (Rows 1 and 2, Rows 5 and 6).
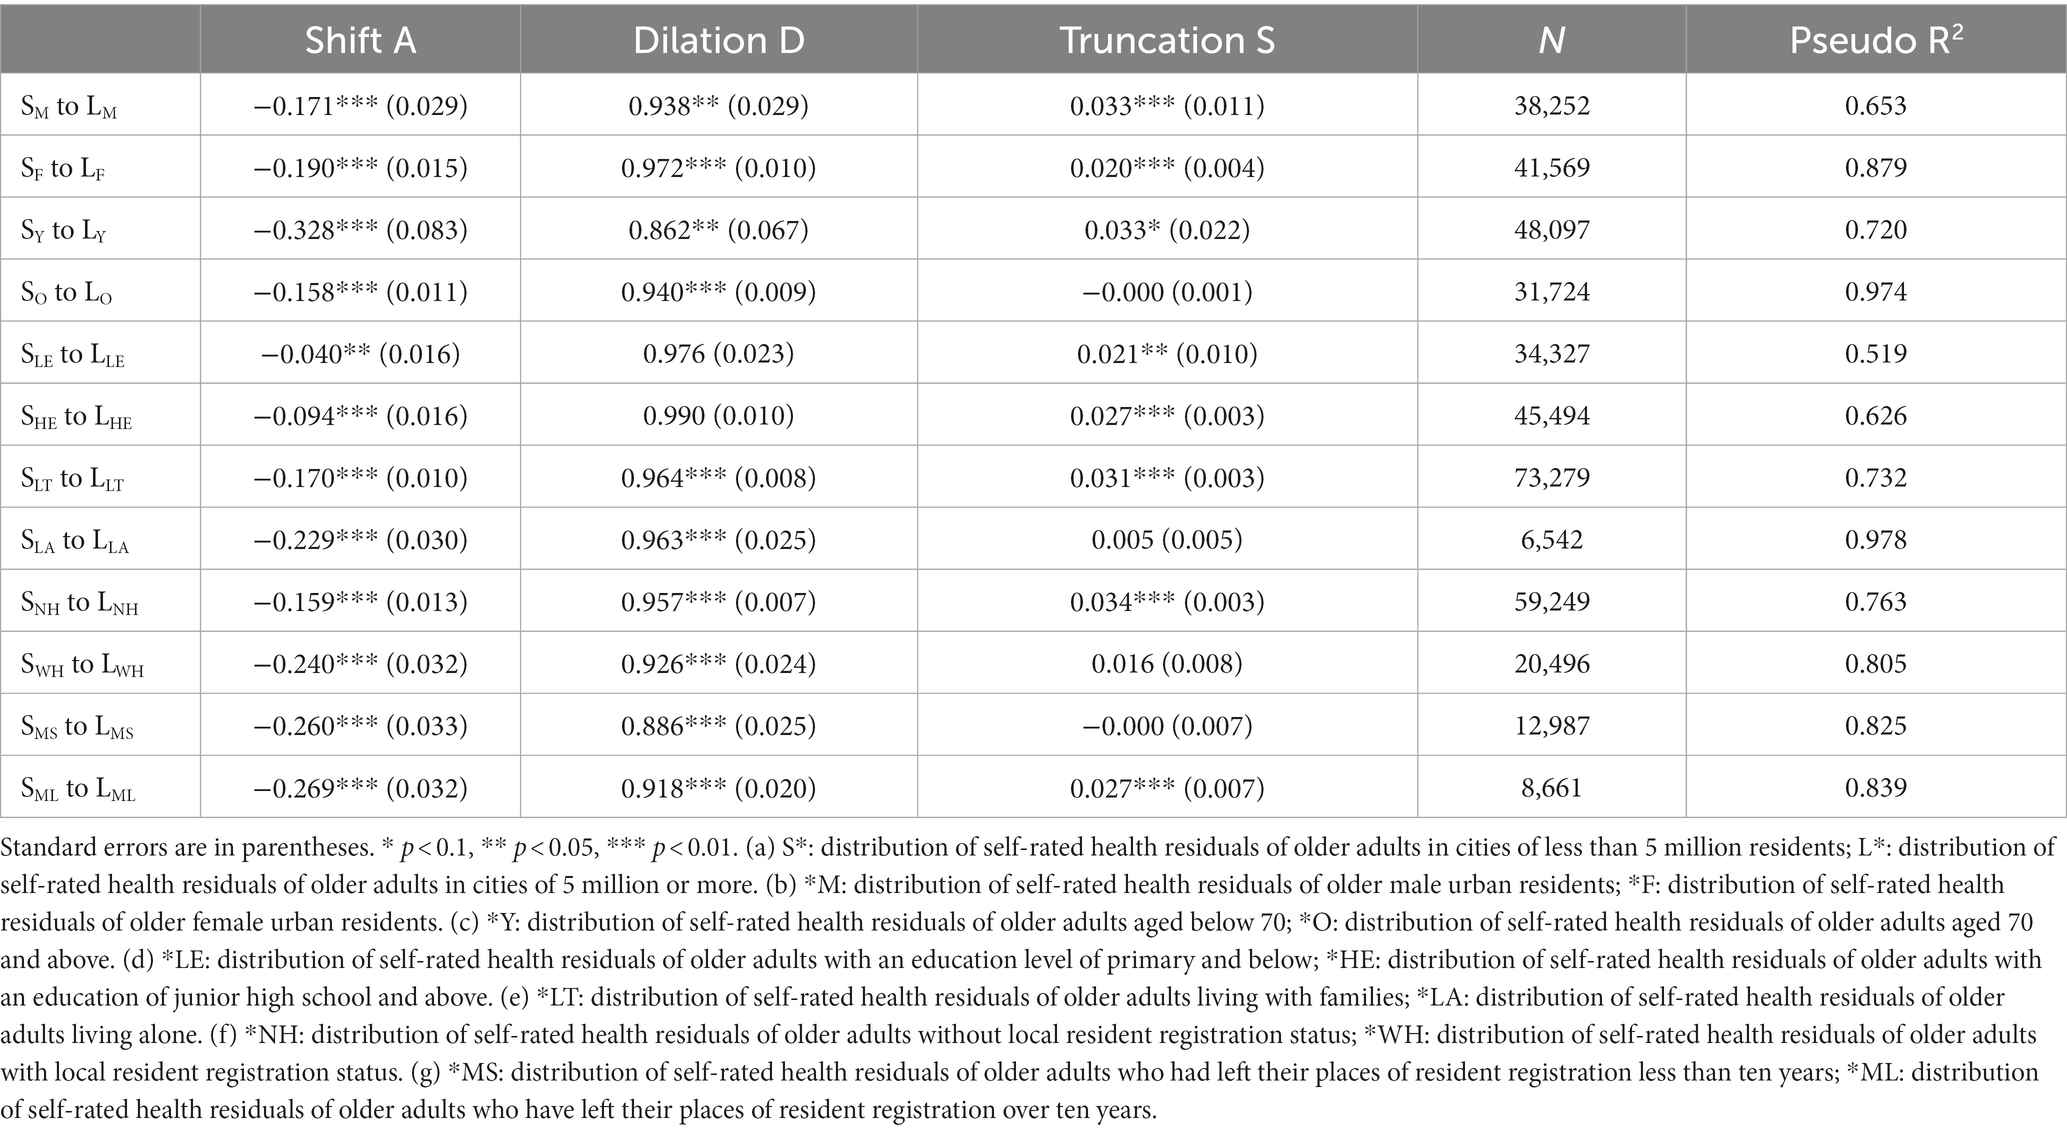
Table 6. Differences in the distribution of health residuals between smaller and larger cities across individual characteristics.
The distributions of self-rated health residuals for older adults aged 70 and above, living alone, and those who left their places of resident registration for less than ten years did not exhibit left-truncation in larger cities relative to smaller ones (Rows 4, 8, 10, and 11). However, the distributions of self-rated health residuals for their counterparts exhibit significant left-truncation in larger cities relative to smaller ones (Rows 3, 7, 9, and 12). This inclination may be attributed to the greater mobility of younger older adults and the supportive environment provided by families, facilitating their mobility compared to older age groups and individuals living alone. Furthermore, older adults who left their place of resident registration but had not acquired local resident status in the destination for an extended period of time might choose to live in smaller cities when their health status deteriorates.
5 Discussion
The findings of this study underscore the significance of population size in influencing the self-rated health of older adults in urban areas. Notably, the relationship between a city’s population size and older adults’ self-rated health is revealed to be nonlinear, particularly when accounting for individual differences in socioeconomic status and variations in socioeconomic development levels across cities. This outcome aligns with broader studies encompassing diverse population groups and spanning cross-boundary analyses related to urbanization and public health (54). Moreover, our research highlights the impact of sorting decisions made by urban older adults based on their health status and unobservable factors. Older adults tend to gravitate towards environments that are socially and physically conducive to their well-being. In instances where unhealthy older adults encounter challenges accessing social security systems in large cities, choosing to reside in their hometowns or smaller cities becomes a rational decision, as these locales offer better social support.
5.1 Enhanced individual socioeconomic status, integrated within the broader socioeconomic development of cities, plays a crucial role in the health benefits attributed to the growth of city population size
Our findings reveal that older adults residing in cities with larger populations tend to exhibit better general health. However, this association transforms into an inverted-U shape, with a turning point around 1–1.5 million residents, when considering individual socioeconomic status. This suggests that the health benefits observed in cities with populations exceeding 1.5 million are primarily attributed to improvements in individual socioeconomic status. At the city level, when accounting for the Socioeconomic Development Index, we observe a more pronounced influence on altering turning points compared to controlling for other indicators such as the Environmental Pollution Index, Afforestation Index, and Pollution Abatement Index. These imply that the health benefits linked to population size growth are significantly influenced by both individual socioeconomic status and the overall socioeconomic development level of cities.
Concerning the association between city population size and the general health of older adults, the concave nature of the inverted U-shaped curve becomes more pronounced, or the turning point decreases, when accounting for the positive effects of urban population growth on health. Conversely, when considering the negative impacts, the turning point tends to increase, and the association leans towards a more linear or convex U-shaped curve. It is essential to acknowledge that the analysis of optimal population size holds more theoretical than practical value, providing insights into the underlying mechanisms that shape the association between city population size and older adults’ health. Moreover, several adverse factors, such as neighborhood conditions, social contacts, and living stress, could potentially confound the relationship between city population size and older adults’ self-rated health. Upon controlling for these factors, it is reasonable to anticipate a transition from the inverted U-shaped relationship to a more linear one. However, given the inherent challenges in observing or quantifying various community factors, further exploration is necessary to substantiate this trend.
5.2 Urban population growth has varied effects on health across different groups
Based on the analysis on the association between city population size and general health of various older groups, our findings suggest that certain characteristics significantly influence how older adults perceive the impact of the city’s population growth on their health. Older adults who are male, older, and have lower living standards and socioeconomic status—groups typically associated with poorer general health—tend to be more responsive to the compensatory effects of the improved socioeconomic and human-made environment in mitigating the risks associated with urban population growth. Conversely, their counterparts appear to be more sensitive to the unobserved influences associated with urban population growth. Moreover, the evolving socioeconomic and human-made environment resulting from urban population growth introduces health risks for migratory older adults but yields benefits for those with local resident status. These results align with previous studies that have focused on individual variations in health benefits derived from urbanization (55–57).
5.3 Health benefits in the cities with more than 5 million residents are overestimated as smaller cities host less-healthy older migrants
Urban expansion is generally anticipated to have a positive impact on the health of urban residents (58, 59). However, our sorting analyses, which account for the health-driven selection of residence, reveal that older adults with poorer health tend to choose living locations in cities with populations less than 5 million. This implies that the health benefits commonly attributed to population growth in cities with over 5 million residents might be overestimated. The sorting effects are more pronounced among older adults with greater resources supporting their mobility or those without a longstanding local resident status. In essence, older migrant adults with poorer health lean towards smaller cities, influenced in part by limited access to healthcare in large cities without obtaining local resident status. While large cities typically boast more healthcare resources, they also incur higher healthcare costs. This poses a challenging reality for older and/or unwell residents without local healthcare coverage. China’s segregated healthcare system particularly impacts those who lack wealth and reside outside their registered area. While healthier individuals may have more flexibility in their movements, this is not the case for those who require periodic healthcare assistance. In this study, a substantial 25.77% of respondents lacked local resident registration status, underscoring the noteworthy proportion of older adults who have relocated from their hometowns. Given that entitlement to public health services in China remains closely tied to resident registration, it is reasonable to expect that some respondents may need to return to their hometowns when healthcare becomes essential for them.
6 Conclusion
The population size of a city significantly influences the self-rated health of its older adults, with those residing in larger cities generally exhibiting better overall health. The study underscores the pivotal roles played by variations in individual socioeconomic status and the socioeconomic development level of cities in determining the health benefits linked to city population size. Moreover, empirical evidence highlights the impact of individual sorting decisions on the relationship between city population size and the self-rated health of older adults, revealing that cities with populations less than 5 million tend to attract less-healthy older migrants, leading to an overestimation of health benefits in cities with over 5 million residents. The study unveils distinct associations between city population size and the general health of diverse older groups, some of whom also make unique sorting decisions. Older adults who typically experience worse health due to their demographic, living, and socioeconomic status are more responsive to the compensatory effects of the improved socioeconomic and human-made environment, mitigating the risks associated with urban population growth. Moreover, the evolving socioeconomic and human-made environment resulting from urban population growth introduces health risks for migratory older adults but yields benefits for those with local resident status. The sorting effects are more pronounced among older adults with greater resources supporting their mobility or those without a longstanding local resident status.
To promote healthy aging, Chinese urban policymakers are encouraged to adapt planning and development strategies to consider the intricate relationship between city population size and the health of older adults. While promoting population agglomeration in small cities can yield health benefits for older adults, large cities, particularly those with populations exceeding 5 million, need to be vigilant about health risks associated with population growth among older adults. Imposing restrictions on settlement through the household registration system may improve the average health of older adults in large cities, but it may result in the departure of less-healthy older migrants rather than genuinely enhancing the health status of local older adults. Collaborating with surrounding small and medium-sized cities in older adults healthcare emerges as a viable option for large cities to mitigate built-environmental health risks and leverage their advantage in medical resources simultaneously. In summary, regardless of population size, Chinese cities should consistently prioritize the health of urban older adults when formulating and implementing urban policies.
Data availability statement
The original contributions presented in the study are included in the article/Supplementary material, further inquiries can be directed to the corresponding author.
Author contributions
ZP: Writing – original draft, Writing – review & editing. WD: Writing – review & editing. ZH: Writing – original draft, Writing – review & editing.
Funding
The author(s) declare financial support was received for the research, authorship, and/or publication of this article. This work was supported by National Natural Science Foundation of China (42001161) and Fundamental Research Funds for the Central Universities (531118010404).
Conflict of interest
The authors declare that the research was conducted in the absence of any commercial or financial relationships that could be construed as a potential conflict of interest.
Publisher’s note
All claims expressed in this article are solely those of the authors and do not necessarily represent those of their affiliated organizations, or those of the publisher, the editors and the reviewers. Any product that may be evaluated in this article, or claim that may be made by its manufacturer, is not guaranteed or endorsed by the publisher.
Supplementary material
The Supplementary material for this article can be found online at: https://www.frontiersin.org/articles/10.3389/fpubh.2024.1333961/full#supplementary-material
Footnotes
References
1. Yu, H., Cheng, S., Yue, Y., Wu, Y., and Han, W. (2022). Cover story: China’s race to provide for its aging population. Available at: https://www.caixinglobal.com/2022-05-16/cover-story-chinas-race-to-provide-for-its-aging-population-101885398.html
2. National Bureau of Statistics of China. (2021). China statistical yearbook 2021. National Bureau of Statistics of China. Available at: http://www.stats.gov.cn/tjsj/ndsj/2021/indexeh.htm
3. Giles-Corti, B, Vernez-Moudon, A, Reis, R, Turrell, G, Dannenberg, AL, Badland, H, et al. City planning and population health: a global challenge. Lancet. (2016) 388:2912–24. doi: 10.1016/S0140-6736(16)30066-6
4. Pan, Z, Wu, L, Zhuo, C, and Yang, F. Spatial pattern evolution of the health level of China’s older adults and its influencing factors from 2010 to 2020. Acta Geograph Sin. (2022) 77:3072–89. doi: 10.11821/dlxb202212009
5. Hao, P, and He, S. What is holding farmers back? Endowments and mobility choice of rural citizens in China. J Rural Stud. (2022) 89:66–72. doi: 10.1016/j.jrurstud.2021.11.014
6. Evandrou, M, Falkingham, J, Feng, Z, and Vlachantoni, A. Individual and province inequalities in health among older people in China: evidence and policy implications. Health Place. (2014) 30:134–44. doi: 10.1016/j.healthplace.2014.08.009
7. Wagstaff, A. Correcting the concentration index: a comment. J Health Econ. (2009) 28:516–20. doi: 10.1016/j.jhealeco.2008.12.003
8. Sun, J, Lyu, S, and Zhao, R. Socioeconomic inequality in health outcomes among the elderly: evidence from a cross-sectional study in China. Risk Manag Healthc Policy. (2020) 13:397–407. doi: 10.2147/RMHP.S248019
9. Chen, B, Liu, D, and Lu, M. City size, migration and urban inequality in China. China Econ Rev. (2018) 51:42–58. doi: 10.1016/j.chieco.2018.05.001
10. Gong, P, Liang, S, Carlton, EJ, Jiang, Q, Wu, J, Wang, L, et al. Urbanisation and health in China. Lancet (London, England). (2012) 379:843–52. PubMed. doi: 10.1016/S0140-6736(11)61878-3
11. Deng, S. Exploring the relationship between new-type urbanization and sustainable urban land use: evidence from prefecture-level cities in China. Sustain Comput Inform Syst. (2021) 30:100446. doi: 10.1016/j.suscom.2020.100446
12. Song, Y. Rising Chinese regional income inequality: the role of fiscal decentralization. China Econ Rev. (2013) 27:294–309. doi: 10.1016/j.chieco.2013.02.001
13. Huang, B, and Chen, K. Are intergovernmental transfers in China equalizing? China Econ Rev. (2012) 23:534–51. doi: 10.1016/j.chieco.2012.01.001
14. Bo, S, and Cheng, C. Political hierarchy and urban primacy: evidence from China. J Comp Econ. (2021) 49:933–46. doi: 10.1016/j.jce.2021.05.001
15. Dong, E, Xu, J, Sun, X, Xu, T, Zhang, L, and Wang, T. Differences in regional distribution and inequality in health-resource allocation on institutions, beds, and workforce: a longitudinal study in China. Arch Public Health. (2021) 79:78. doi: 10.1186/s13690-021-00597-1
16. Eckert, S, and Kohler, S. Urbanization and health in developing countries: a systematic review. World Health Popul. (2014) 15:7–20. doi: 10.12927/whp.2014.23722
17. Zhu, Y-G, Ioannidis, JPA, Li, H, Jones, KC, and Martin, FL. Understanding and harnessing the health effects of rapid urbanization in China. Environ Sci Technol. (2011) 45:5099–104. doi: 10.1021/es2004254
18. Lopez, R, and Hynes, HP. Sprawl in the 1990s: measurement, distribution, and trends. Urban Aff Rev. (2003) 38:325–55. doi: 10.1177/1078087402238805
19. Sun, J, Deng, S, Xiong, X, and Tang, S. Equity in access to healthcare among the urban elderly in China: does health insurance matter? Int J Health Plann Manag. (2013) 29:e127–44. doi: 10.1002/hpm.2227
20. Huang, G., Qian, Z., and Yu, L. (2021). Annual report on urban health life in China. Available at: https://www.pishu.com.cn/skwx_ps/bookdetail?SiteID=14&ID=13432919
21. Kuddus, MA, Tynan, E, and McBryde, E. Urbanization: a problem for the rich and the poor? Public Health Rev. (2020) 41:1. doi: 10.1186/s40985-019-0116-0
22. Leon, DA. Cities, urbanization and health. Int J Epidemiol. (2008) 37:4–8. doi: 10.1093/ije/dym271
23. Requena, F. Rural–urban living and level of economic development as factors in subjective well-being. Soc Indic Res. (2015) 128:693–708. doi: 10.1007/s11205-015-1051-1
24. Kearns, A, Whitley, E, Tannahill, C, and Ellaway, A. Loneliness, social relations and health and well-being in deprived communities. Psychol Health Med. (2015) 20:332–44. doi: 10.1080/13548506.2014.940354
25. Poortinga, W. Social relations or social capital? Individual and community health effects of bonding social capital. Soc Sci Med. (2006) 63:255–70. doi: 10.1016/j.socscimed.2005.11.039
26. Kawachi, I, and Subramanian, SV. Neighbourhood influences on health. J Epidemiol Community Health. (2007) 61:3–4. doi: 10.1136/jech.2005.045203
27. Pearce, J, Witten, K, Hiscock, R, and Blakely, T. Are socially disadvantaged neighbourhoods deprived of health-related community resources? Int J Epidemiol. (2007) 36:348–55. doi: 10.1093/ije/dyl267
28. Su, S, Pi, J, Xie, H, Cai, Z, and Weng, M. Community deprivation, walkability, and public health: highlighting the social inequalities in land use planning for health promotion. Land Use Policy. (2017) 67:315–26. doi: 10.1016/j.landusepol.2017.06.005
29. Kanbur, R, and Rapoport, H. Migration selectivity and the evolution of spatial inequality. J Econ Geogr. (2005) 5:43–57. doi: 10.1093/jnlecg/lbh053
30. Lu, Y. Test of the ‘healthy migrant hypothesis’: a longitudinal analysis of health selectivity of internal migration in Indonesia. Soc Sci Med. (2008) 67:1331–9. doi: 10.1016/j.socscimed.2008.06.017
31. Riosmena, F, Wong, R, and Palloni, A. Migration selection, protection, and acculturation in health: a binational perspective on older adults. Demography. (2013) 50:1039–64. doi: 10.1007/s13524-012-0178-9
32. Tong, Y, and Piotrowski, M. Migration and health selectivity in the context of internal migration in China, 1997–2009. Popul Res Policy Rev. (2012) 31:497–543. doi: 10.1007/s11113-012-9240-y
33. Vaalavuo, M, and Sihvola, M-W. Are the sick left behind at the peripheries? Health selection in migration to growing urban Centres in Finland. Eur J Popul. (2021) 37:341–66. doi: 10.1007/s10680-020-09568-8
34. Lu, Y, and Qin, L. Healthy migrant and salmon bias hypotheses: a study of health and internal migration in China. Soc Sci Med. (2014) 102:41–8. doi: 10.1016/j.socscimed.2013.11.040
35. Albouy, D. Are big cities bad places to live? Estimating Quality of Life across Metropolitan Areas. Cambridge, MA, USA: National Bureau of Economic Research (2008).
36. Bettencourt, LMA, Lobo, J, Helbing, D, Kühnert, C, and West, GB. Growth, innovation, scaling, and the pace of life in cities. Proc Natl Acad Sci USA. (2007) 104:7301–6. PubMed. doi: 10.1073/pnas.0610172104
37. Crume, RV. Urban health issues: Exploring the impacts of Big-City living. New York, NY, USA: Bloomsbury Publishing Inc. ABC-CLIO (2019).
38. Wei, H, Li, L, and Nian, M. China’s urbanization strategy and policy during the 14th five-year plan period. Chin J Urban Environ Stud. (2021) 9:2150002. doi: 10.1142/S2345748121500020
39. Hong, R-J, Tseng, Y-C, and Lin, T-H. Guarding a new Great Wall: the politics of household registration reforms and public provision in China. China Q. (2022) 251:776–97. doi: 10.1017/S0305741022000224
40. Zhang, H, Chen, M, and Liang, C. Urbanization of county in China: spatial patterns and influencing factors. J Geogr Sci. (2022) 32:1241–60. doi: 10.1007/s11442-022-1995-4
41. Xu, Z. Productivity and agglomeration economies in Chinese cities. Comp Econ Stud. (2009) 51:284–301. doi: 10.1057/ces.2008.43
42. Hu, W, and Fan, Y. City size and energy conservation: do large cities in China consume more energy? Energy Econ. (2020) 92:104943. doi: 10.1016/j.eneco.2020.104943
43. Wu, J, Wu, Y, and Wang, B. Environmental efficiency and the optimal size of Chinese cities. Chin World Econ. (2017) 25:60–86. doi: 10.1111/cwe.12200
44. Song, Y, and Zhang, C. City size and housing purchase intention: evidence from rural–urban migrants in China. Urban Stud. (2020) 57:1866–86. doi: 10.1177/0042098019856822
45. National Bureau of Statistics. The 2015 national 1% population sample survey data. Beijing: China Statistics Press (2016).
46. Giltay, EJ, Vollaard, AM, and Kromhout, D. Self-rated health and physician-rated health as independent predictors of mortality in elderly men. Age Ageing. (2011) 41:165–71. doi: 10.1093/ageing/afr161
47. Jylhä, M, Volpato, S, and Guralnik, JM. Self-rated health showed a graded association with frequently used biomarkers in a large population sample. J Clin Epidemiol. (2006) 59:465–71. doi: 10.1016/j.jclinepi.2005.12.004
48. King, G, and Wand, J. Comparing incomparable survey responses: evaluating and selecting anchoring vignettes. Polit Anal. (2007) 15:46–66. doi: 10.1093/pan/mpl011
49. McDade, TW, and Adair, LS. Defining the “urban” in urbanization and health: a factor analysis approach. Soc Sci Med. (2001) 53:55–70. doi: 10.1016/s0277-9536(00)00313-0
50. Miao, J, and Wu, X. Urbanization, socioeconomic status and health disparity in China. Health Place. (2016) 42:87–95. doi: 10.1016/j.healthplace.2016.09.008
51. Ashenfelter, O, and Greenstone, M. Estimating the value of a statistical life: the importance of omitted variables and publication Bias. Am Econ Rev. (2004) 94:454–60. doi: 10.1257/0002828041301984
52. Combes, P-P, Duranton, G, Gobillon, L, and Roux, S. Sorting and local wage and skill distributions in France. Reg Sci Urban Econ. (2012) 42:913–30. doi: 10.1016/j.regsciurbeco.2012.11.003
53. Karplus, VJ, Zhang, J, and Zhao, J. Navigating and evaluating the labyrinth of environmental regulation in China. Rev Environ Econ Policy. (2021) 15:300–22. doi: 10.1086/715582
54. Rocha, LEC, Thorson, AE, and Lambiotte, R. The non-linear health consequences of living in larger cities. J Urban Health. (2015) 92:785–99. PubMed. doi: 10.1007/s11524-015-9976-x
55. Chen, J, and Wang, W. Economic incentives and settlement intentions of rural migrants: evidence from China. J Urban Aff. (2018) 41:372–89. doi: 10.1080/07352166.2018.1439339
56. Song, Y, Zhu, N, and Luo, F. City size and permanent settlement intention: evidence from rural-urban migrants in China. Int J Environ Res Public Health. (2022) 19:676. PubMed. doi: 10.3390/ijerph19020676
57. Yang, W, and Kanavos, P. The less healthy urban population: income-related health inequality in China. BMC Public Health. (2012) 12:804–4. doi: 10.1186/1471-2458-12-804
58. City, B. L., Assessment, E., & Tool, R. Urbanization and health. Bull World Health Organ. (2010) 88:245–6. doi: 10.2471/BLT.10.010410
Keywords: city population size, self-rated health, older adults, sorting decisions, health disparity
Citation: Pan Z, Dong W and Huang Z (2024) Does the population size of a city matter to its older adults’ self-rated health? Results of China data analysis. Front. Public Health. 12:1333961. doi: 10.3389/fpubh.2024.1333961
Edited by:
Chun Yin, Wuhan University, ChinaReviewed by:
Xiaochen Zhang, Duke Kunshan University, ChinaSainan Lin, Wuhan University, China
Kai Cao, East China Normal University, China
Copyright © 2024 Pan, Dong and Huang. This is an open-access article distributed under the terms of the Creative Commons Attribution License (CC BY). The use, distribution or reproduction in other forums is permitted, provided the original author(s) and the copyright owner(s) are credited and that the original publication in this journal is cited, in accordance with accepted academic practice. No use, distribution or reproduction is permitted which does not comply with these terms.
*Correspondence: Zuyu Huang, aHVhbmd6dXl1QGhvdG1haWwuY29t