 J. Cunningham-Erves
 W. George2
 E. Stewart
 S. W. Jin
 J. Davis
94% of researchers rate our articles as excellent or good
Learn more about the work of our research integrity team to safeguard the quality of each article we publish.
Find out more
ORIGINAL RESEARCH article
Front. Public Health, 04 March 2024
Sec. Infectious Diseases: Epidemiology and Prevention
Volume 12 - 2024 | https://doi.org/10.3389/fpubh.2024.1321173
Background: The COVID-19 pandemic has convoluted hesitancy toward vaccines, including the seasonal influenza (flu) vaccine. Because of COVID-19, the flu season has become more complicated; therefore, it is important to understand all the factors influencing the uptake of these vaccines to inform intervention targets. This article assesses factors related to the uptake of influenza and COVID-19 vaccines among adults in Tennessee.
Methods: A cross-sectional, secondary data analysis of 1,400 adults was conducted in Tennessee. The adult sample came from two data sources: Data source 1 completed a baseline survey from January to March 2022, and data source 2 was completed from May to August 2022. Data on vaccine attitudes, facilitators and barriers, and communication needs were collected via random digit dial by Scientific Telephone Samples (STS). Two multivariable logistic regression models were used to estimate adjusted odds ratios (aORs) and 95% confidence intervals (CIs) to predict sociodemographic and overall vaccine-related factors associated with receipt or non-receipt (referent) of COVID-19 and influenza vaccines.
Results: Approximately 78% of the adult sample had received the COVID-19 vaccination. A significant positive association for COVID-19 vaccine uptake was seen among those who were older (aged 50–65) (aOR = 1.9; 95% CI: 1.2–3.2), Black (aOR = 2.0; 95% CI:1.3–2.8), and had a college education and higher (aOR = 2.3; 95% CI: 1.5–3.6). However, there was a significant negative association for persons reporting they were extremely religious (aOR = 0.5; 95% CI:0.3–0.9). Over 56% of the adult sample had received the influenza vaccination this season. Those who had a higher annual household income ($80,000+) (aOR = 1.9; 95% CI: 1.3–2.6) and had health insurance (aOR = 2.6; 95% CI: 1.4–4.8) had a significant positive association with influenza vaccine receipt. However, those who were employed part-time or were unemployed had a significant negative association for influenza vaccine receipt (aOR = 0.7; 95% CI: 0.5–0.9). Both COVID-19 and influenza vaccine receipt had strongly significant positive trends with increasing belief in effectiveness and trust (p < 0.0001) and strongly significant negative trends with higher levels of overall vaccine hesitancy (p < 0.0001).
Conclusion: Strategies to increase COVID-19 and influenza vaccination should be age-specific, focus on increasing geographical and financial access, and offer tailored messages to address concerns about these vaccines.
Addressing vaccine hesitancy is a public health priority. It is a top threat to public health globally and in the United States (US). Hesitancy for vaccines remains a prominent reason for the delay or refusal of routinely recommended vaccinations, even though they are available (1–6). As a result, many individuals are left susceptible to harmful, infectious diseases that vaccination programs have eliminated or significantly reduced (7). Vaccine hesitancy occurs among adults for routinely recommended vaccines, as well as parents and caregivers making decisions for children regarding routinely recommended vaccines (8–10). In addition, studies suggest that vaccine hesitancy for one vaccine has fueled hesitancy for other vaccines, especially those that are not mandated (9). In the US, influenza vaccination uptake among adults usually hovers at approximately 50% (11). The same reticence exists among parents. Recent national data show that vaccination coverage for influenza remains suboptimal in children, with rates of 45.6% in December 2022 (12). In both cases, vaccine hesitancy has been cited as a major barrier.
The COVID-19 pandemic has fueled increased levels of hesitancy for vaccines, including seasonal influenza (flu) vaccines (13). COVID-19 vaccination uptake among adults has stalled at 69.5% fully vaccinated and 81.4% with one dose. Population-based studies further demonstrate that approximately 30% of the US population is hesitant to receive COVID-19 vaccines (14–17). Particularly, the Mid-South and Southeastern US have high rates of hesitancy for influenza and COVID-19 vaccines based on national surveys (18–22). Vaccine hesitancy is context and time-specific, varying among individuals (23). The National Adult Immunization Plan calls for the demand for adult immunizations to be increased in the community, which requires a vigilant, multi-pronged approach (24). At the root of these efforts, one must understand the factors influencing vaccine hesitancy for these strategies to increase vaccine acceptability while lowering hesitancy.
Determinants of vaccine hesitancy have been widely studied, with communication (e.g., social media and the Internet) being a major influencer of these factors. Common reasons for vaccine hesitancy include vaccine and vaccination-specific concerns (e.g., safety and side effects), contextual issues (e.g., politics, past research abuses, and access), and individual/group influences (e.g., lack of knowledge and misinformation) (23, 25). For example, Gallant et al. found that vaccination adherence in adults is higher when workplace vaccination campaigns are available, especially when coupled with information strategies addressing reasons for vaccine hesitancy (26). Yet, to the best of our knowledge, a handful of studies have determined if factors influencing vaccine hesitancy differ by vaccine type (8, 9). This warrants concern as people who are classified as vaccine-hesitant may have different or similar motivations and informational needs across vaccines (23) which could be overlooked in intervention development, limiting effectiveness. Furthermore, vaccine concerns change over time and should be monitored for changes in vaccination attitudes and behaviors for different vaccines (27).
The purpose of this study is to assess factors related to the uptake of influenza and COVID-19 vaccines among adults in Tennessee. This study’s novelty lies in being the first to explore influenza and COVID-19 vaccine concerns in Tennessee. Findings will be used to develop an intervention to be assessed in a future pilot efficacy study. Moreover, this study could inform intervention targets for future research to address adult vaccine hesitancy by vaccine type.
This cross-sectional study used secondary data from 1,400 adults who reside in Tennessee. Two data sources or survey samples were combined to create the study sample. Adults in data source 1 completed a baseline survey that was collected from January to March 2022, while survey completion for data source 2 was from May to August 2022. Both of these surveys were part of a pilot exploratory study to understand why vaccine-hesitant adults (data source 1) or vaccine-hesitant adults who are parents (data source 2) delay or refuse non-mandated vaccines (i.e., COVID-19, influenza, and human papillomavirus vaccines). Because no previous data were available during the time of the study, the sample size was based on our prior experience with the intent to use the data to calculate the sample size for a larger study. The 15-min surveys collected data on vaccine attitudes, facilitators and barriers, and communication needs among individuals. The likelihood of overlap between the survey study samples was small. Nonetheless, we created a unique identifier by concatenating 12 demographic variables to ensure the independence of the two survey samples.
Data source 1 was a survey with adults with the following inclusion criteria: (1) agreed to participate in the study, (2) between ages 18 and 65 years, (3) live in Tennessee, and (4) lived in the Nashville metropolitan statistical area (MSA), Memphis MSA, or Chattanooga MSA. This data source had 600 persons comprised of 100 African Americans per MSA (n = 300) and 100 individuals of all other ethnicities per MSA (n = 300). These adults are part of a larger study designed to compare attitudes and vaccination rates pre-post a social marketing campaign to increase COVID-19 vaccination in the Nashville MSA, with the Memphis and Chattanooga MSAs serving as the control.
Data source 2 was a survey of adults who were parents (i.e., parent survey) with the following inclusion criteria: (1) agreed to participate in the study, (2) lived in Tennessee, (3) lived in Nashville MSA (until 300 completed responses) or elsewhere in the state, and (4) a parent/primary caregiver of a child between the ages of 5–17 years. There was no age requirement for this data; however, nearly all participants were between ages 18 and 65 years (9 parents over age 65 were merged with the 50–64 age category). This data source was completed with 800 persons regardless of race, 300 adults from the Nashville MSA, and 500 adults from the rest of Tennessee. This study was approved by the Institutional Review Board of Meharry Medical College (Protocol #: 21-03-1076).
While Tennessee comprises 6.8 million people, the MSAs in our study include 21% of the population. The Nashville MSA has 14 counties (i.e., Davidson, Cannon, Williamson, Wilson, Rutherford, Cheatham, Hickman, Macon, Maury, Robertson, Smith, Sumner, Trousdale, and Dickson). The Memphis MSA comprises three counties (i.e., Shelby, Tipton, and Fayette). The MSA of Chattanooga has three counties (i.e., Hamilton, Marion, and Sequatchie). Only Tennessee counties were included for the Memphis and Chattanooga MSAs. These MSAs were chosen as they have the highest percentage of African Americans in the state. Only respondents in the Nashville MSA were exposed to a social marketing campaign designed to build COVID-19 vaccine confidence among African Americans.
Data collection was done via random digit dialing, 80% wireless and 20% landline. During the telephone survey, participants were screened for eligibility. If eligible, participants provided verbal consent before completing the telephone survey. Participants received a $20 incentive for their time. See the flow diagram of recruitment processes for data source 1 in Figure 1. The figure for data source 2 (the Nashville MSA and statewide survey of adults with children) is in Supplementary File A.
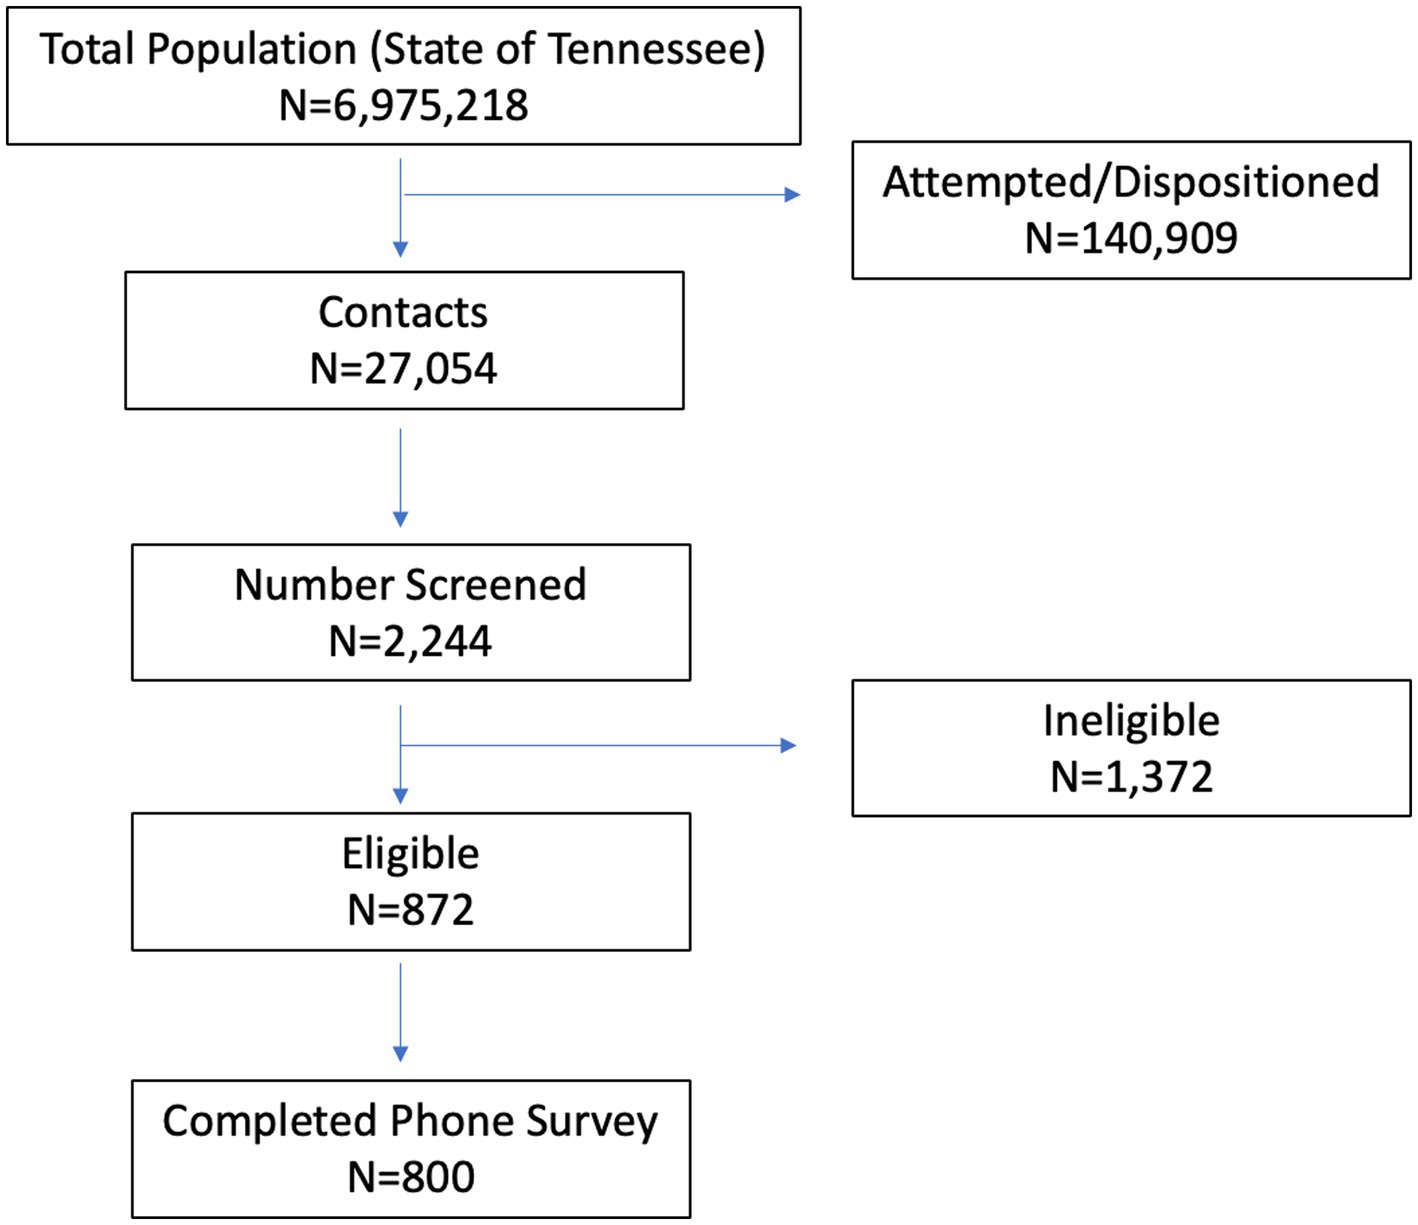
Figure 1. The eligibility screening process for Random Digit Dialing (data source 1).
Each of the surveys consisted of items and instruments developed by the research team based on prior research (27, 28) and experience and also based on published available items and surveys. In some instances, items were adapted for the study to focus on selected vaccinations and the population being studied. Questions were related to overall vaccine hesitancy and hesitancy specific to COVID-19, influenza, and HPV vaccines. In this study, we present measures for overall vaccine hesitancy, as well as COVID-19 and influenza vaccine hesitancy. There were 9 items related to HPV vaccine hesitancy, and two items will be described in another study. All items included response options “unsure/do not know” or “refused,” and not read by the telephone survey administrator. These two response options were coded but treated as missing in the analysis. The secondary data analysis for this study will not differentiate between the two data sources hereafter but focus on the variables of interest that were available in both datasets.
This section provides variables used to identify predictors of influenza and COVID-19 vaccination, including overall vaccine effectiveness, overall vaccine trust, overall vaccine hesitancy (6, 23, 29, 30), preferred sources of vaccine information, preferred place to get vaccines, know someone who died or extremely ill from COVID-19 vaccine, concerned about getting COVID-19, trust in public health agencies that recommended COVID-19 vaccines, influenza vaccine effectiveness, influenza vaccine need, influenza vaccine importance, influenza vaccine safety, race, age, gender, education, income, employment status, health insurance, relationship status, living arrangement, religion, and receipt of influenza vaccine. The categorization of these variables is shown in Supplementary File B.
There were two primary outcomes in this study: COVID-19 vaccine receipt and flu vaccine receipt. Each measure is described below. Receipt of COVID-19 Vaccine: Respondents were asked, “Have you received a COVID-19 vaccine? [At least one dose of a COVID-19 vaccine. Examples include brand names Pfizer/BioNTech or Comirnaty, Moderna, or Johnson & Johnson.]” (29). Telephone survey administrators could provide additional information about this question, if prompted: “At least one dose of a COVID-19 vaccine. Examples include brand names Pfizer/BioNTech or Comirnaty, Moderna, or Johnson & Johnson.” These were the options for COVID-19 vaccines at the time of the study. Response options were “yes” and “no.”
Descriptive and inferential statistics were performed to analyze study sample data using SAS 9.4 (SAS Institute Inc., Cary, NC). Chi-square tests were used to univariately compare general participant characteristics and vaccine-related factors for two outcome variables (COVID-19 vaccine receipt and influenza vaccine receipt) (Tables 1, 2). Two multivariable logistic regression models were used to estimate adjusted odds ratios (aORs) and 95% confidence intervals (CIs) to predict sociodemographic and overall vaccine-related factors associated with receipt or non-receipt (referent) of the COVID-19 and influenza vaccines. Our rationale for utilizing logistic regression was to obtain odds ratios for the dichotomous outcome variables that could be explained by potential predictors. Assumptions of logistic regression met in the study include the independence of errors, absence of multicollinearity, and lack of strongly influential outliers. Multivariable models of the association between potential predictors and COVID-19 and influenza vaccine status were adjusted for age, gender, race/ethnicity, annual household income, and source as a proxy for survey date completion (Tables 3, 4). value of ps for trend were calculated for ordered categorical variables by examining the odds ratios moving from the lowest referent group to the next highest category and so on for a minimum of three categories. A significance level of alpha = 0.05 was selected. An example of our multivariable model to determine the association between categories of education and COVID vaccination while adjusting for age, gender, race/ethnicity, annual household income, and source in Table 3 is as follows:
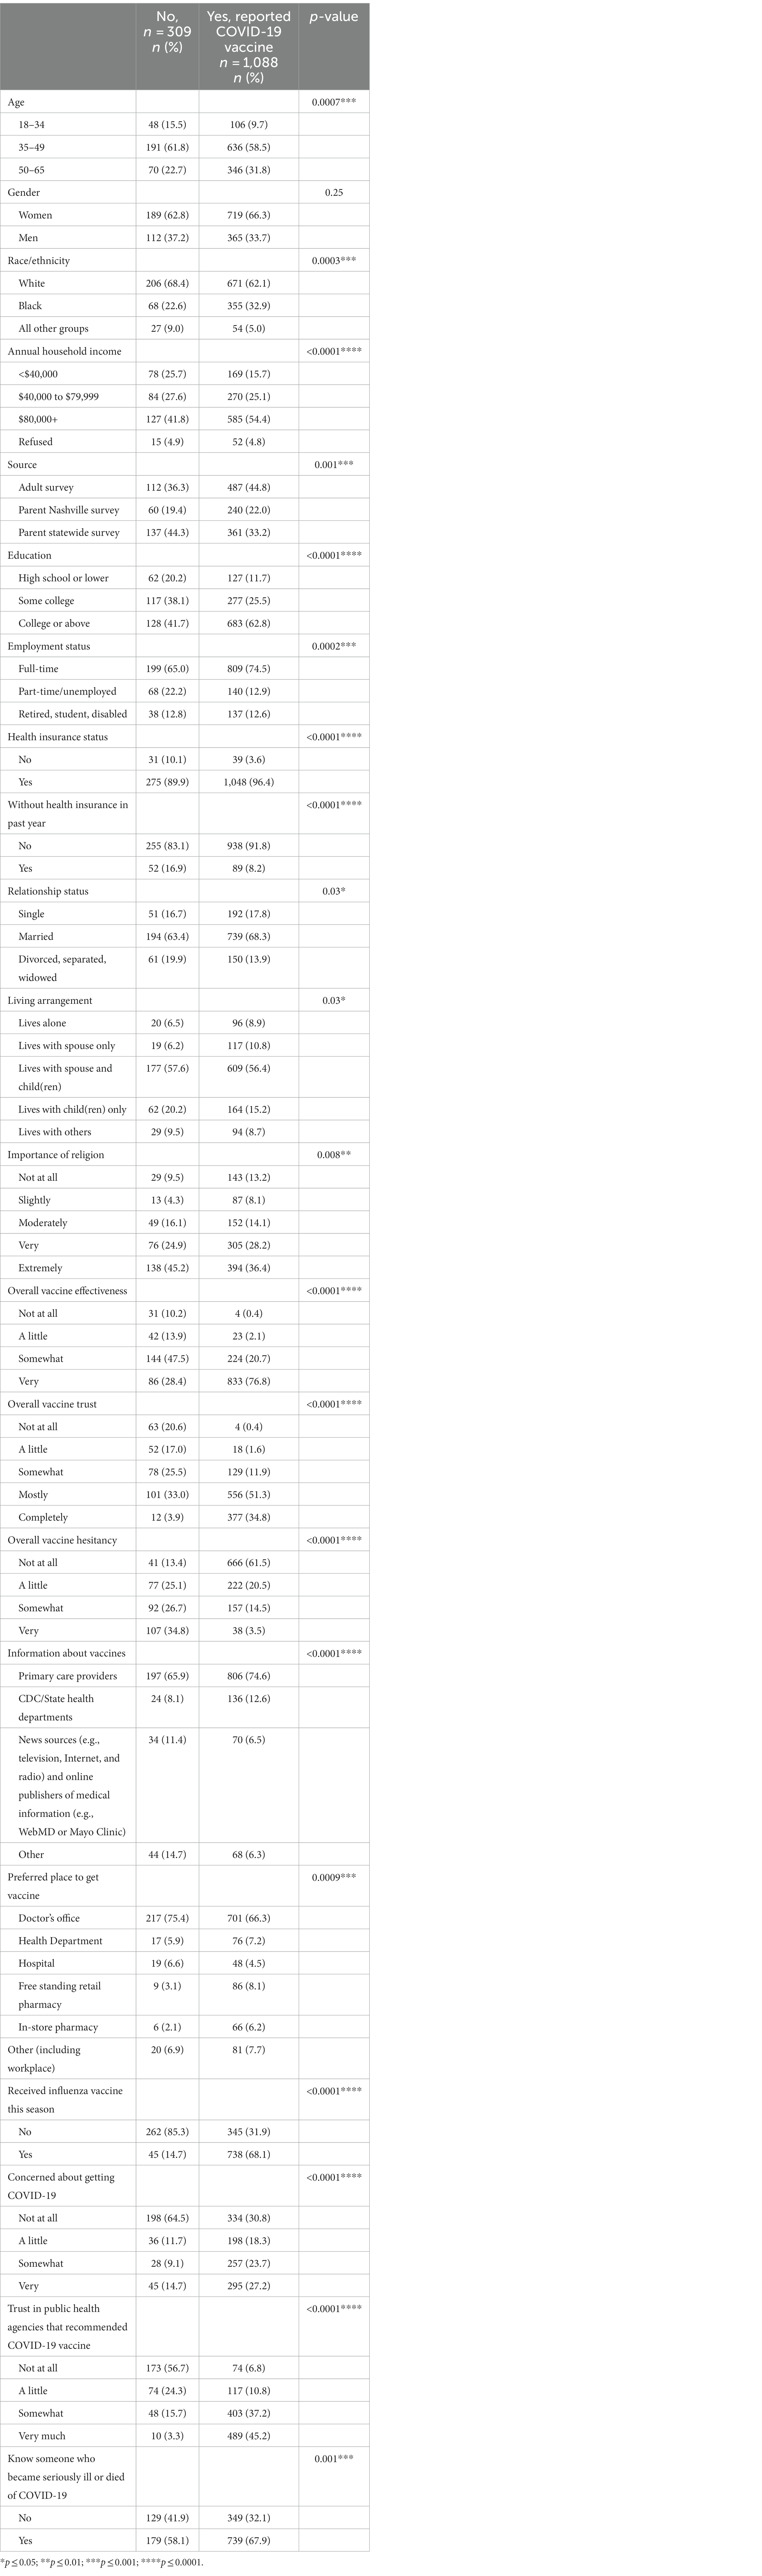
Table 1. Characteristics of study participants and COVID-19 vaccine receipt.

Table 2. Association between sociodemographic and vaccine-related factors and COVID-19 vaccine receipt.

Table 3. Characteristics of study participants and influenza vaccine receipt.
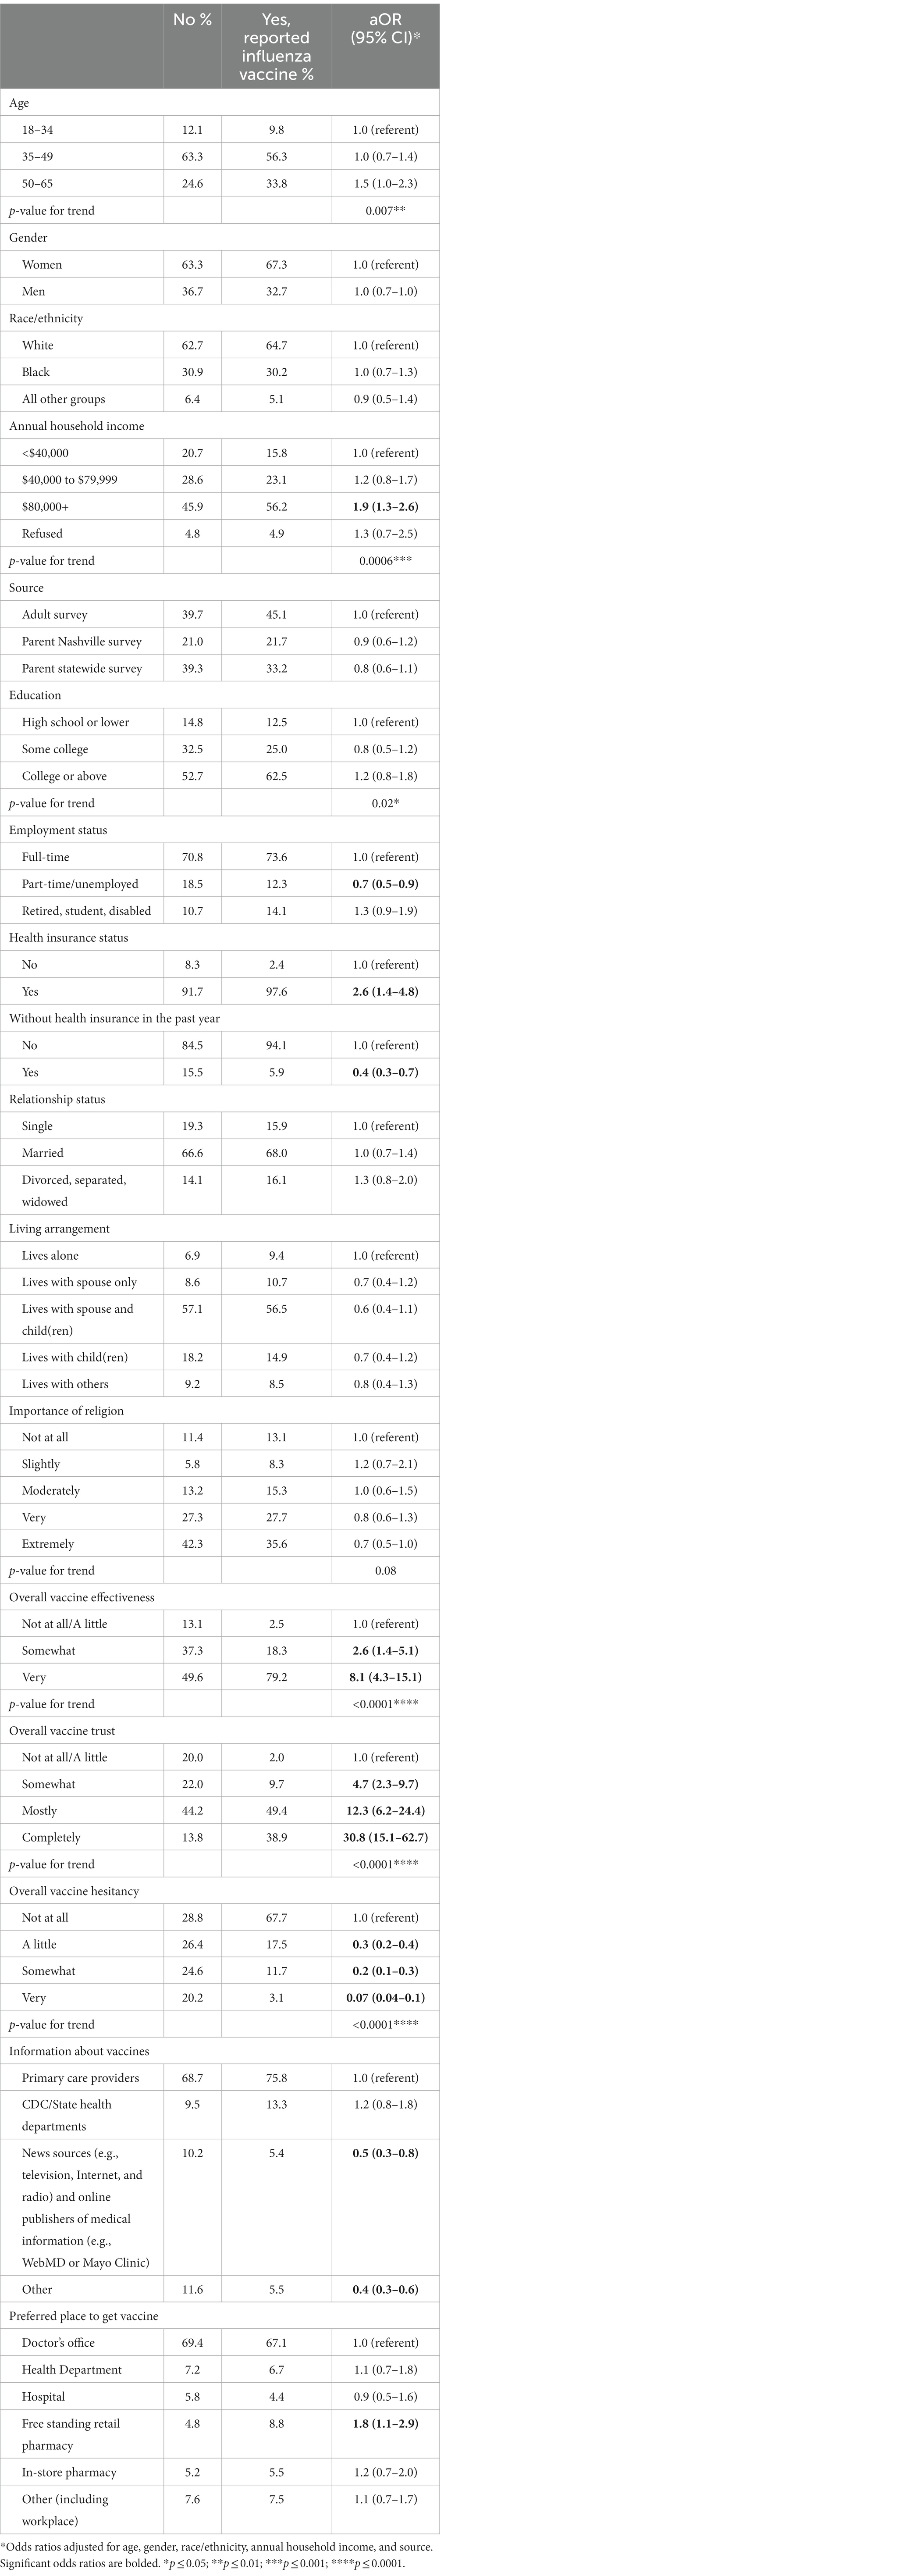
Table 4. Association between sociodemographic and vaccine-related factors and influenza vaccine receipt.
The associations for the above model are presented as odds ratios for the exposure of education, comparing the referent group of high school or lower to the comparison groups of some college and college or above.
p-values for trend were calculated for ordered categorical variables by examining the odds ratios moving from the lowest referent group to the next highest category and so on for a minimum of three categories. To assess the trend of increasing COVID-19 vaccination with increasing categories of education while adjusting for age, gender, race/ethnicity, annual household income, and source, all variables were treated continuously rather than categorically. An example of our multivariable model testing for the trend is:
The test for trend is based on the p-value from the Wald test for the trend for the exposure of education modeled continuously rather than as an ordered categorical variable. A significance level of alpha = 0.05 was selected.
Approximately 78% of the adult sample had received at least one dose of the COVID-19 vaccine. Additional characteristics of COVID-19 vaccine receipt are detailed in Table 1. The proportion of participants who had received the COVID-19 vaccine significantly differed by all characteristics except gender. For example, COVID-19 vaccine receipt was significantly associated with older age (p = 0.0007), black race/ethnicity (p = 0.0003), and higher annual household income (p < 0.0001).
After adjusting for age, gender, race/ethnicity, and annual household income and source, relationship status and living arrangement no longer differed significantly by COVID-19 receipt (Table 2). However, there were differences in sociodemographics and vaccine-related factors. For example, compared to adults aged 18–34 years, adults aged 50–65 years were more likely to receive the COVID-19 vaccine (aOR = 1.9; 95% CI: 1.2–2.3) and there was a significant positive trend for the likelihood of COVID-19 vaccination receipt across age groups (p = 0.03). Blacks were twice (95% CI: 1.3–2.8) as likely to receive the COVID-19 vaccine as whites. As annual household income increased, there was a significant positive trend (<0.0001) of vaccination with participants who made $40,000 to $79,999 and $80,000+, being almost two (aOR = 1.6; 95% CI: 1.1–2.4) and three (aOR = 2.7; 95% CI: 1.8–4.0) times more likely to receive the vaccine compared to those who made <$40,000. Similarly, trends of COVID-19 vaccination increased as education increased (p < 0.0001), with rates being significantly higher among those who had a college degree or above (aOR = 2.3; 95% CI: 1.5–3.6) compared to those who had a high school degree or lower. Those who were extremely religious were significantly less likely to be vaccinated (aOR = 0.5; 95% CI: 0.3–0.9) compared to individuals who were not at all religious, and there was a significant trend of decreasing likelihood of COVID-19 receipt with increasing religiosity (p = 0.008). As it relates to the source of the survey, adults from the statewide parent survey were less likely to be vaccinated (aOR = 0.6; 95% CI: 0.4–0.9) compared to those on the adult survey.
All vaccine-related factors differed significantly by COVID-19 vaccination receipt after adjustment. For example, relative to persons who indicated they believed the overall vaccine effectiveness and their overall vaccine trust were not at all/a little, there were strongly significant positive trends for the likelihood of COVID-19 receipt with increasing belief in effectiveness (p < 0.0001) and trust (p < 0.0001). The opposite was true for overall vaccine hesitancy (p < 0.0001) (see Table 2).
Over 56% of the adult sample had received the influenza vaccination this season. Additional characteristics of influenza vaccine receipt are detailed in Table 3. The proportion of participants who had received the influenza vaccine differed significantly by most characteristics, excluding gender, race/ethnicity, source, relationship status, living arrangement, importance of religion, and preferred place to get the vaccine. For example, influenza vaccine receipt was significantly associated with older age (p = 0.0008), higher annual household income (p = 0.002), and having a college degree or above (p = 0.001).
After adjusting for age, gender, race/ethnicity, annual household income and source, age, and education no longer differed significantly by influenza vaccine receipt (Table 4). Significantly fewer adults who had received the influenza vaccine were employed part-time or unemployed (aOR = 0.7; 95% CI: 0.5–0.9) compared to those employed full-time. Compared to an income less than $40,000, influenza vaccination was significantly higher among adults whose income was $80,000 or more (aOR = 1.9; 95% CI: 1.3–2.6) and demonstrated a strongly significant positive trend for the likelihood of COVID-19 receipt with increasing income (p = 0.0006). Persons who reported having health insurance were 2.6 (95% CI: 1.4–4.8) times more likely to be vaccinated for influenza, while those reporting not having insurance in the past year were 0.4 (95% CI: 0.3–0.7) times less likely to be vaccinated against influenza. All vaccine-related factors differed significantly by influenza receipt after adjustment. Relative to persons who indicated they believed the overall vaccine effectiveness and their overall vaccine trust was not at all/a little, there were strongly significant positive trends for the likelihood of influenza receipt with increasing belief in effectiveness (p < 0.0001) and trust (p < 0.0001). The opposite was true for overall vaccine hesitancy (p < 0.0001). As it relates to information sources for vaccines, those whose information source was news sources and online publishers of medical information (aOR = 0.5; 95% CI: 0.3–0.8) along with other information sources (aOR = 0.4; 95% CI: 0.3–0.6) were significantly less likely to be vaccinated compared to individuals selecting primary care providers. Finally, individuals whose preferred place to get vaccinated was at a free-standing retail pharmacy were significantly more likely to get the vaccine (aOR = 1.8; 95% CI: 1.1–2.9) compared to those who selected the doctor’s office.
The aim of this study was to explore factors related to influenza and COVID-19 vaccine uptake among adults and parents in Tennessee. This random digit dial study is the first to explore predictors of vaccination by type and, if they differ, in the state. Similar to past studies (31), we found that influenza vaccination rates were significantly lower than COVID-19 rates, with nearly 56 and 88% of respondents reporting they received the influenza and COVID-19 vaccines, respectively. While COVID-19 vaccination rates were high among these participants, influenza vaccine rates reflected the long-standing rates at approximately 50%. This does not reflect the potential increase in influenza vaccination and suboptimal COVID-19 vaccination rates during the COVID-19 pandemic as identified in past studies (32, 33), which suggests pockets of disparities in uptake. A few US studies have found geographic location, doctor recommendation, the push to get the vaccine during the COVID-19 pandemic, Internet access, and geographic location to be associated with higher rates of COVID-19 vaccination compared to influenza vaccination rates (31, 34). Overall, this finding warrants more exploration.
Attitudes and beliefs continue to impact COVID-19 vaccine uptake. In our study, overall trust in vaccines, hesitancy related to vaccines in general, and concern about getting COVID-19 were associated with receipt. Of interest, there were multiple reasons for hesitancy, trust in vaccination, and concern about COVID-19 associated with vaccine receipt. Our findings suggest that individuals may not need complete trust or high levels of perceived effectiveness in the vaccine to get vaccinated. However, any degree of hesitancy can negatively impact one’s intent to get vaccinated. Therefore, efforts (i.e., education, community engagement, and patient-provider communication) should continue to build trust in vaccines in general, increase the perceived effectiveness of the vaccine, and address factors influencing hesitancy for increasing uptake.
Similar to a past study in Tennes(see 35), sociodemographics were associated with COVID-19 vaccine receipt. Unsurprisingly, being older and Black were more likely to be vaccinated. It has long been studied that older people understand the potential impact of COVID-19 on their health, their immunity to misinformation, and their increased access to Medicare and their early eligibility. In addition, the historical context of research abuse and mistreatment in healthcare negatively impacts the engagement of Black Americans in research preventive behaviors and research. Consistent with past studies (36), we also found that COVID-19 vaccine receipt was significantly higher among those with higher education levels. This may reflect having greater access to information on COVID-19 and the vaccine, along with the ability to identify information sources and trusted messengers (37). It was somewhat surprising that participants who had higher incomes, health insurance, health insurance in the past year specifically, and part-time employment were more likely to be vaccinated; however, this could be due to lack of geographical access to the vaccine since it was free during this time period or the aforementioned confidence issues in the vaccine. However, there was no significant relationship between COVID-19 receipt and gender. This finding suggests a shift in gender-specific barriers to COVID-19 vaccination, which may lead to improved attitudes related to uptake.
To date, there is limited information on psychological factors influencing influenza vaccination receipt among Tennesseans. In our study, we found that individuals who were very hesitant about vaccines in general were less likely to be vaccinated. These findings confirm that negative attitudes toward vaccination, such as influenza vaccination, are significant barriers to uptake (38, 39). However, continuing to increase overall perceived effectiveness and trust in vaccines can positively influence the uptake of all vaccines and influenza vaccines specifically similar to COVID-19 vaccination among our participants. Bhugra et al. identified strategies to improve influenza vaccination coverage that exist at the patient, provider, practice, and policy levels. These strategies include education at the patient, provider, and practice levels and mandates at the policy level. Multi-level strategies will be necessary to optimize receipt (40).
Influenza vaccination receipt was associated with sociodemographic characteristics, namely age, income, and education. In the adjusted model, influenza vaccination was more likely to be among individuals who were older, had a high income, and had high levels of education. Collectively, the positive association of having a high income and high levels of education suggests that having access to care or trust in healthcare providers is necessary for uptake (41, 42). A surprising finding was that the association between gender, race, and influenza vaccination uptake was not significant. Past studies have demonstrated female participants being less likely to get influenza vaccination, which could potentially be due to experiencing more adverse events (43). In addition, influenza vaccination has been found to be lower consistently among Black Americans in past studies (44). Collectively, these findings warrant further study. Finally, individuals who are employed part-time or unemployed, being significantly less likely to get the influenza vaccine, could very well suggest that employers working full-time are receiving education and being offered the influenza vaccines through clinics at work at higher rates.
The strengths of this study include using a random digit dial project to gather a representative sample of the largest MSAs in Tennessee. However, there were some limitations, including limiting the survey to three MSAs, accounting for 20 of the state’s 95 counties, and the findings may not be representative of the general population. This study is limited by self-reported data, which can be influenced by social desirability and/or recall bias. Additionally, this study is limited by cross-sectional data that cannot be used to infer causality and may not be generalizable to other populations. Finally, we collected attitudes about COVID-19 vaccination from those unvaccinated only, a small number, due to the limitations of random digit dial. This limited our ability to conduct analyses on this data. Therefore, future studies should assess whether attitudes differ toward COVID-19 and influenza vaccination among adults in Tennessee to further inform intervention strategies.
This is one of the first studies to explore factors influencing uptake by vaccine type at the state level. Understanding factors influencing uptake by vaccines is integral to developing strategies that can be applied across vaccines and to each vaccine specifically. The results suggest that strategies to increase COVID-19 and influenza vaccinations should be age-specific, centered around increasing geographical and financial access, and offer tailored messages to address concerns for vaccines overall. However, the newness of the COVID-19 vaccine, along with the historical mistreatment of Black Americans in research and healthcare, might require multi-level approaches to initiate equity in these systems. These actions can positively impact perceptions of experiences within these entities and ultimately health outcomes.
The datasets presented in this article are not readily available due to confidentiality agreements; therefore, supporting data cannot be made openly available. Requests to access the data should be directed to JC-E, amVubmlmZXIuZXJ2ZXNAdnVtYy5vcmc=.
The studies involving humans were approved by Meharry Medical College Institutional Review Board. The studies were conducted in accordance with the local legislation and institutional requirements. Written informed consent for participation was not required from the participants or the participants’ legal guardians/next of kin because we had verbal informed consent since data was collected via a Random Digit Dial.
JC-E: Conceptualization, Funding acquisition, Investigation, Project administration, Resources, supervision, Validation, Writing-original draft, Writing-review and editing, Methodology. WG: Visualization, Writing – original draft, Writing – review & editing. MS: Conceptualization, Formal analysis, Investigation, Methodology, Supervision, Writing – original draft, Writing – review & editing, Data curation, Funding acquisition, Resources, Software, Validation. ES: Visualization, Writing – review & editing. SJ: Funding acquisition, Writing – review & editing, Conceptualization, Investigation, Resources. JD: Conceptualization, Funding acquisition, Investigation, Resources, Supervision, Writing – review & editing. HB: Conceptualization, Funding acquisition, Investigation, Project administration, Resources, Supervision, Validation, Writing – original draft, Writing – review & editing, Methodology.
The author(s) declare financial support was received for the research, authorship, and/or publication of this article. This study was supported by the National Institute on Minority Health and Health Disparities (Award Number: 3U54MD007586-34S7), the National Cancer Institute of the National Institutes of Health (Award Numbers: P30CA021765 and 1K01CA237748-01A1), and the American Lebanese and Syrian Associated Charities (ALSAC) of St. Jude Children’s Research Hospital. This study was also supported by the University and Memphis Program to Enhance Collaborative and Interdisciplinary Research (PECIR). The content is solely the responsibility of the authors and does not necessarily represent the views of the National Institutes of Health, and should not be considered an endorsement by the Federal Government.
The authors would like to thank the people of Tennessee who responded to the survey for their invaluable contributions to the study described in this manuscript.
JC-E is an educational consultant and advisory board member for MERCK. The company had no role in the study including the processes.
The remaining authors declare that the research was conducted in the absence of any commercial or financial relationships that could be construed as a potential conflict of interest.
All claims expressed in this article are solely those of the authors and do not necessarily represent those of their affiliated organizations, or those of the publisher, the editors and the reviewers. Any product that may be evaluated in this article, or claim that may be made by its manufacturer, is not guaranteed or endorsed by the publisher.
The Supplementary material for this article can be found online at: https://www.frontiersin.org/articles/10.3389/fpubh.2024.1321173/full#supplementary-material
1. World Health Organization. Ten health issues WHO will tackle this year. Available at: https://www.who.int/news-room/spotlight/ten-threats-to-global-health-in-2019 (Accessed April 29, 2021)
2. Nguyen, KH. COVID-19 vaccination intent, perceptions, and reasons for not vaccinating among groups prioritized for early vaccination — United States, September and December 2020. MMWR Morb Mortal Wkly Rep. (2021) 70:217–22. doi: 10.15585/mmwr.mm7006e3
3. Santibanez, TA, Nguyen, KH, Greby, SM, Fisher, A, Scanlon, P, Bhatt, A, et al. Parental vaccine hesitancy and childhood influenza vaccination. Pediatrics. (2020) 146:e2020007609. doi: 10.1542/peds.2020-007609
4. Sonawane, K, Zhu, Y, Lin, YY, Damgacioglu, H, Lin, Y, Montealegre, JR, et al. HPV vaccine recommendations and parental intent. Pediatrics. (2021) 147:e2020026286. doi: 10.1542/peds.2020-026286
5. Kempe, A, Saville, AW, Albertin, C, Zimet, G, Breck, A, Helmkamp, L, et al. Parental hesitancy about routine childhood and influenza vaccinations: a National Survey. Pediatrics. (2020) 146:e20193852. doi: 10.1542/peds.2019-3852
6. Quinn, SC, Jamison, AM, An, J, Hancock, GR, and Freimuth, VS. Measuring vaccine hesitancy, confidence, trust and flu vaccine uptake: results of a national survey of white and African American adults. Vaccine. (2019) 37:1168–73. doi: 10.1016/j.vaccine.2019.01.033
7. Dubé, E. Addressing vaccine hesitancy: the crucial role of healthcare providers. Clin Microbiol Infect. (2017) 23:279–80. doi: 10.1016/j.cmi.2016.11.007
8. Kumar, S, Shah, Z, and Garfield, S. Causes of vaccine hesitancy in adults for the influenza and COVID-19 vaccines: a systematic literature review. Vaccine. (2022) 10:1518. doi: 10.3390/vaccines10091518
9. Zhang, V, Zhu, P, and Wagner, AL. Spillover of vaccine hesitancy into adult COVID-19 and influenza: the role of race, religion, and political affiliation in the United States. Int J Environ Res Public Health. (2023) 20:3376. doi: 10.3390/ijerph20043376
10. McGregor, S, and Goldman, RD. Determinants of parental vaccine hesitancy. Can Fam Physician. (2021) 67:339–41. doi: 10.46747/cfp.6705339
11. Centers for Disease Control and Prevention (CDC). Flu vaccination coverage, United States, 2021–22 influenza season | FluVaxView | seasonal influenza (flu) |CDC. (2022). Available at: https://www.cdc.gov/flu/fluvaxview/coverage-2022estimates.htm (Accessed August 26, 2023)
12. CDC. Influenza vaccination coverage, children 6 months through 17 years, United States | FluVaxView | seasonal influenza (flu) | CDC. (2023). Available at: https://www.cdc.gov/flu/fluvaxview/dashboard/vaccination-coverage-race.html (Accessed August 26, 2023)
13. Willis, DE, Andersen, JA, Montgomery, BEE, Selig, JP, Shah, SK, Zaller, N, et al. COVID-19 vaccine hesitancy and experiences of discrimination among Black adults. J Racial Ethn Health Disparities. (2023) 10:1025–34. doi: 10.1007/s40615-022-01290-x
14. Bhagianadh, D, and Arora, K. COVID-19 vaccine hesitancy among community-dwelling older adults: the role of information sources. J Appl Gerontol. (2022) 41:4–11. doi: 10.1177/07334648211037507
15. Reiter, PL, Pennell, ML, and Katz, ML. Acceptability of a COVID-19 vaccine among adults in the United States: how many people would get vaccinated? Vaccine. (2020) 38:6500–7. doi: 10.1016/j.vaccine.2020.08.043
16. Brenan, M. Satisfaction with U.S. vaccine rollout surges to 68%. (2021) Available at: https://news.gallup.com/poll/342431/satisfaction-vaccine-rollout-surges.aspx?utm_source=alert&utm_medium=email&utm_content=morelink&utm_campaign=syndication (Accessed April 10, 2022)
17. Huettman, E. Covid vaccine hesitancy drops among all Americans, new survey shows. (2021) Available at: https://khn.org/news/article/covid-vaccine-hesitancy-drops-among-americans-new-kff-survey-shows/ (Accessed April 10, 2022)
18. Elam-Evans, LD. National, regional, state, and selected local area vaccination coverage among adolescents aged 13–17 years — United States, 2019. MMWR Morb Mortal Wkly Rep. (2020) 69:1109–16. doi: 10.15585/mmwr.mm6933a1
19. National Foundation for Infectious Diseases. Issue brief: the impact of COVID-19 on US vaccination rates. (2020) Available at: https://www.nfid.org/keep-up-the-rates/issue-brief-the-impact-of-covid-19-on-us-vaccination-rates/ (Accessed April 25, 2021)
20. News-Medical.net. First-ever systematic review to understand geographic factors that affect HPV vaccination rates. (2021) Available at: https://www.news-medical.net/news/20210122/First-ever-systematic-review-to-understand-geographic-factors-that-affect-HPV-vaccination-rates.aspx (Accessed April 25, 2021)
21. States ranked by percentage of COVID-19 vaccines administered: April 25. Available at: https://www.beckershospitalreview.com/public-health/states-ranked-by-percentage-of-covid-19-vaccines-administered.html (Accessed April 25, 2021)
22. Rouw, A. State variation in seasonal flu vaccination: implications for a COVID-19 vaccine. KFF (2020). Available at: https://www.kff.org/coronavirus-covid-19/issue-brief/state-variation-in-seasonal-flu-vaccination-implications-for-a-covid-19-vaccine/ (Accessed April 25, 2021)
23. MacDonald, NE. Vaccine hesitancy: definition, scope and determinants. Vaccine. (2015) 33:4161–4. doi: 10.1016/j.vaccine.2015.04.036
24. National Vaccine Program Office, US Department of Health and Human Services. National Adult Immunization Plan. Available at: https://www.hhs.gov/sites/default/files/nvpo/national-adult-immunization-plan/naip.pdf (Accessed June 31, 2023)
25. World Health Organization (WHO), WHO | SAGE working group dealing with vaccine hesitancy (March 2012 to November 2014). Available at: https://www.who.int/groups/strategic-advisory-group-of-experts-on-immunization/working-groups/vaccine-hesitancy-(march-2012-to-november-2014) (Accessed April 29, 2021)
26. Gallant, AJ, Nicholls, LAB, Rasmussen, S, Cogan, N, Young, D, and Williams, L. Changes in attitudes to vaccination as a result of the COVID-19 pandemic: a longitudinal study of older adults in the UK. PLoS One. (2021) 16:e0261844. doi: 10.1371/journal.pone.0261844
27. Jin, SW, Lee, Y, Lee, S, Jin, H, and Brandt, HM. Factors associated with college students' human papillomavirus (HPV) vaccination and preferred strategies for catch-up vaccine promotion: a mixed-methods study. Vaccine. (2023) 11:1124. doi: 10.3390/vaccines11061124
28. Jin, SW, Lee, Y, and Brandt, HM. Human papillomavirus (HPV) vaccination knowledge, beliefs, and hesitancy associated with stages of parental readiness for adolescent HPV vaccination: implications for HPV vaccination promotion. Trop Med Infect Dis. (2023) 8:251. doi: 10.3390/tropicalmed8050251
29. Domek, GJ, O'Leary, ST, Bull, S, Bronsert, M, Contreras-Roldan, IL, Bolaños Ventura, GA, et al. Measuring vaccine hesitancy: field testing the WHO SAGE working group on vaccine hesitancy survey tool in Guatemala. Vaccine. (2018) 36:5273–81. doi: 10.1016/j.vaccine.2018.07.046
30. CDC. Vaccine confidence survey question bank for COVID-19: rapid community assessment tool. Available at: https://www.cdc.gov/vaccines/covid-19/vaccinate-with-confidence/rca-guide/downloads/CDC_RCA_Guide_2021_Tools_AppendixD_Surveys-508.pdf (Accessed June 21)
31. Mirpuri, P, and Rovin, RA. COVID-19 and historic influenza vaccinations in the United States: a comparative analysis. Vaccines (Basel). (2021) 9:1284. doi: 10.3390/vaccines9111284
32. Roman, PC. Influenza vaccinations during the COVID-19 pandemic — 11 U.S. jurisdictions, September–December 2020. MMWR Morb Mortal Wkly Rep. (2021) 70:1575–8. doi: 10.15585/mmwr.mm7045a3
33. Kuehn, BM. Influenza vaccination increased during the COVID-19 pandemic. JAMA. (2021) 326:2465. doi: 10.1001/jama.2021.22390
34. Garza, N, Leibensperger, M, and Bonnevie, E. The association between receiving the flu and COVID-19 vaccines and related factors, data from the StopFlu campaign in eight states and the District of Columbia, 2022. J Community Health. (2023) 48:731–9. doi: 10.1007/s10900-023-01213-9
35. Gatwood, J, McKnight, M, Fiscus, M, Hohmeier, KC, and Chisholm-Burns, M. Factors influencing likelihood of COVID-19 vaccination: a survey of Tennessee adults. Am J Health Syst Pharm. (2021) 78:879–89. doi: 10.1093/ajhp/zxab099
36. Syan, SK, Gohari, MR, Levitt, EE, Belisario, K, Gillard, J, DeJesus, J, et al. COVID-19 vaccine perceptions and differences by sex, age, and education in 1,367 community adults in Ontario. Front Public Health. (2021) 9:719665. doi: 10.3389/fpubh.2021.719665
37. Davies, NM, Hill, WD, Anderson, EL, Sanderson, E, Deary, IJ, and Davey, SG. Multivariable two-sample Mendelian randomization estimates of the effects of intelligence and education on health. elife. (2019) 8:e43990. doi: 10.7554/eLife.43990
38. Kan, T, and Zhang, J. Factors influencing seasonal influenza vaccination behaviour among elderly people: a systematic review. Public Health. (2018) 156:67–78. doi: 10.1016/j.puhe.2017.12.007
39. Schmid, P, Rauber, D, Betsch, C, Lidolt, G, and Denker, M-L. Barriers of influenza vaccination intention and behavior—a systematic review of influenza vaccine hesitancy, 2005–2016. PLoS One. (2017) 12:e0170550. doi: 10.1371/journal.pone.0170550
40. Bhugra, P, Grandhi, GR, Mszar, R, Satish, P, Singh, R, Blaha, M, et al. Determinants of influenza vaccine uptake in patients with cardiovascular disease and strategies for improvement. J Am Heart Assoc. (2021) 10:e019671. doi: 10.1161/JAHA.120.019671
41. Jang, SH, and Kang, J. Factors associated with influenza vaccination uptake among U.S. adults: focus on nativity and race/ethnicity. Int J Environ Res Public Health. (2021) 18:5349. doi: 10.3390/ijerph18105349
42. Mercado, NR, Knapp, K, Bouldin, ED, and Drugge, ED. Flu vaccine uptake in caregivers and noncaregivers: implications for policy and practice. Prev Chronic Dis. (2023) 20:220125:E01. doi: 10.5888/pcd20.220125
43. Klein, SL, and Pekosz, A. Sex-based biology and the rational design of influenza vaccination strategies. J Infect Dis. (2014) 209:S114–9. doi: 10.1093/infdis/jiu066
44. Black, CL, O'Halloran, A, Hung, MC, Srivastav, A, Lu, PJ, Garg, S, et al. Influenza-associated hospitalization surveillance network. Vital signs: influenza hospitalizations and vaccination coverage by race and ethnicity-United States, 2009-10 through 2021-22 influenza seasons. MMWR Morb Mortal Wkly Rep. (2022) 71:1366–73. doi: 10.15585/mmwr.mm7143e1
Keywords: vaccine uptake, COVID-19, influenza, flu, SARS-CoV-2, coronavirus
Citation: Cunningham-Erves J, George W, Sanderson M, Stewart E, Jin SW, Davis J and Brandt HM (2024) Predictors of seasonal influenza and COVID-19 vaccination coverage among adults in Tennessee during the COVID-19 pandemic. Front. Public Health. 12:1321173. doi: 10.3389/fpubh.2024.1321173
Edited by:
Daniel Diaz, National Autonomous University of Mexico, MexicoReviewed by:
Maria Francesca Rossi, Catholic University of the Sacred Heart, Rome, ItalyCopyright © 2024 Cunningham-Erves, George, Sanderson, Stewart, Jin, Davis and Brandt. This is an open-access article distributed under the terms of the Creative Commons Attribution License (CC BY). The use, distribution or reproduction in other forums is permitted, provided the original author(s) and the copyright owner(s) are credited and that the original publication in this journal is cited, in accordance with accepted academic practice. No use, distribution or reproduction is permitted which does not comply with these terms.
*Correspondence: J. Cunningham-Erves, amVubmlmZXIuZXJ2ZXNAdnVtYy5vcmc=
†PRESENT ADDRESS: J. Cunningham-Erves, Department of Health Policy, Vanderbilt University Medical Center, Nashville, TN, United States
Disclaimer: All claims expressed in this article are solely those of the authors and do not necessarily represent those of their affiliated organizations, or those of the publisher, the editors and the reviewers. Any product that may be evaluated in this article or claim that may be made by its manufacturer is not guaranteed or endorsed by the publisher.
Research integrity at Frontiers
Learn more about the work of our research integrity team to safeguard the quality of each article we publish.