 Aida Isabel Tavares
94% of researchers rate our articles as excellent or good
Learn more about the work of our research integrity team to safeguard the quality of each article we publish.
Find out more
ORIGINAL RESEARCH article
Front. Public Health, 16 February 2024
Sec. Health Economics
Volume 12 - 2024 | https://doi.org/10.3389/fpubh.2024.1301825
This article is part of the Research TopicMacroeconomic Impact of Disease Dynamics: A Temporal-Spatial AnalysisView all 6 articles
Introduction: Despite the improvements in European health systems, a large number of premature deaths are attributable to treatable mortality. Men make up the majority of these deaths, with a significant gap existing between women and men’s treatable mortality rate in the EU.
Aim: This study aims to identify the healthcare-related factors, including health expenditures, human and physical resources, and hospital services use associated with treatable mortality in women and men across European countries during the period 2011–2019.
Methods: We use Eurostat data for 28 EU countries in the period 2011–2019. We estimate a panel data linear regression with country fixed effects and quantile linear regression for men and women.
Results: The results found (i) differences in drivers for male and female treatable mortality, but common drivers hold the same direction for both sexes; (ii) favorable drivers are GDP per capita, health expenditures, number of physicians per capita, and (only for men) the average length of a hospital stay, (iii) unfavorable drivers are nurses and beds per capita, although nurses are not significant for explaining female mortality.
Conclusion: Policy recommendations may arise that involve an improvement in hospital bed management and the design of more specific policies aimed at healthcare professionals.
In 2019, before the COVID-19 pandemic, a total of 1,015,225 people died prematurely before the age of 75 in the European Union (EU). Of these deaths about 36.5% (371,570) could have been avoided through medical interventions. These death rates are higher among men, accounting for about 56% of the cases compared with 44% for women. This gap between women and men in treatable mortality is likely to influence the gap in life expectancy. The main causes of these treatable deaths include cancer, ischaemic heart diseases, and cerebrovascular diseases (1, 2). And so variations in treatable mortality, arising for instances from the treatment of cancer, may affect the gap in life expectancy between women and men [in 2019, life expectancy for women and men in EU was 84.0 and 78.5 years old (3)].
Treatable mortality refers to deaths, before the age of 75, that could have been prevented through timely and effective healthcare interventions, after the onset of diseases, with the goal of reducing case fatality (differently from preventable mortality which focus on deaths happening due to the lack of prevention, before the onset of diseases) (4, 5). Treatable mortality may be considered an indicator of the effectiveness of healthcare systems, and it is also an indicator of economic development. On the one hand, low-quality health systems are associated with high mortality (2, 5, 6). On the other hand, premature mortality implies a depletion of human capital and so a reduction in Gross Domestic Product (GDP) growth (6–9).
This indicator has taken on greater significance and become a greater priority for policy makers with the establishment of Sustainable Development Goal (SDG) target 3.4, which clearly aims to reduce premature mortality from non-communicable diseases to promote mental health and well-being (10). Therefore, improving the overall health and well-being of a country’s population must involve reducing the treatable mortality rate by ensuring timely access to care and effective healthcare interventions.
To achieve these objectives, a well-functioning health system is essential, and it relies on four basic building blocks (10–13): governance, resources generation, financing, and service delivery. While governance may be challenging to express through aggregate indicators, the remaining blocks may be reflected in some indicators. Resources generation may be described by health professionals per capita, financing may be captured by health expenditures, and service delivery may be expressed in indicators related to the quality of care provided in hospitals. The purpose of our work is not to monitor the performance of health systems, which is presented elsewhere (13).
The goal of this investigation is to examine health system-related factors, including finance, human and physical resources, associated with treatable mortality for both women and men across European countries for the period 2011–2019. Treatable mortality results from the absence or delayed health care interventions, and the effectiveness of these interventions, in turn, depends on the several factors that represent the building blocks of health systems. Therefore, the purpose of this work is to analyze the association of these factors with treatable mortality rates. To accomplish this, a conditional mean and a quantile panel data linear regression with country fixed effects for samples of men and women across EU countries is estimated.
This work addresses a gap in the existing literature on this topic and contributes to our understanding of the underlying trends that account for variations in treatable mortality across European countries (Figure 1). The findings of this study offer valuable insights for policy makers, shedding light on both the differences and commonalities between women and men in Europe. This aggregate analysis allows for international comparisons relatively to best results or practices, policies and interventions among countries, and it enables the identification of disparities and differences across countries. Among the common factors associated with treatable mortality across European countries, we have identified GDP per capita and health expenditures, which are important determinants for health outcomes (15–24).
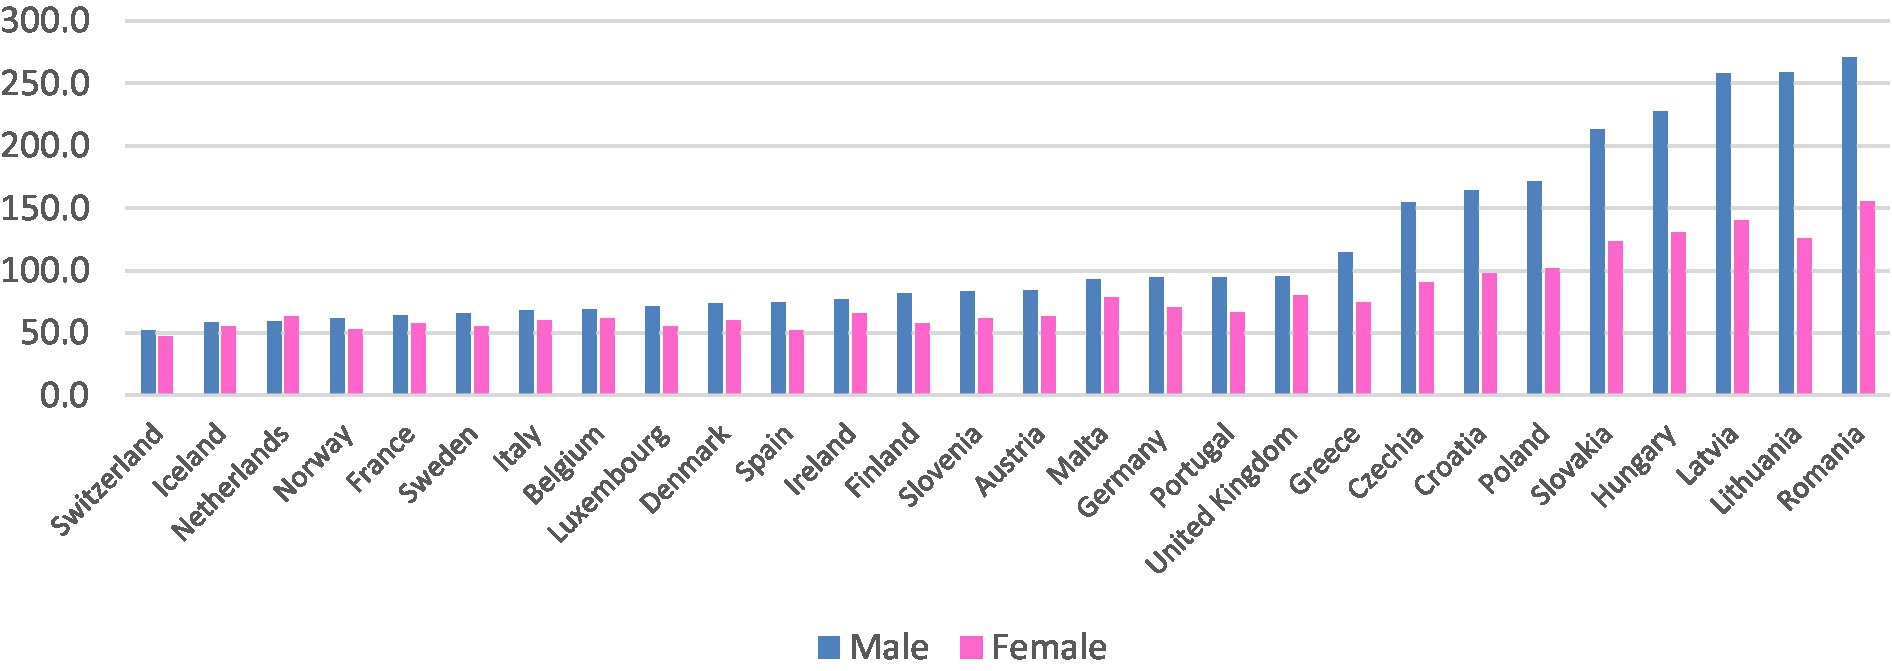
Figure 1. Treatable mortality rate in 2019. Annual standardized rate per 100,000 inhabitants. Eurostat (2023, online code hlth_cd_apr) (13); United Kingdom data for 2018.
Previous literature examining the explanatory factors of treatable mortality is very limited. A recent scope review performed for the period 2013–2019 did not include a single article on the determinants of health in high income countries (25). A recent and unique study (24) explored the relationship between treatable mortality, specifically related to circulatory system, and endocrine and metabolic diseases, health expenditures and GDP per capita. The results revealed a negative correlation between these two variables and level of treatable mortality across 37 OECD countries. A review of aggregate data studies on avoidable mortality and health services was presented in 1990 (26). Despite this review encompasses factors related to a broader concept of avoidable mortality, it identifies two general groups of factors: one related to socioeconomic characteristics and the other concerning the supply and use of health care services.
Several studies have researched the determinants of health outcomes from an aggregate perspective and have used panel data. Examples of such studies are presented in Table A1, in Supplementary Material (18–25). All of these studies explore a set of various explanatory factors, including socioeconomic factors, health care supply, and lifestyles factors to explain some outcome health variable across countries. All these studies use the GDP per capita as a control variable, as it has consistently been associated with health (7–9, 18–25).
Data used in this analysis is collected from the Eurostat database (14) and so it is conditioned of its availability. It accounts for 28 European countries (a list of the included countries can be found in Table A2 of the Supplementary Material and the correspondent mortality rate for 2019) for the period 2011–2019. The period begins in 2011 because it is the first year for which data is available and ends in 2019 before the turbulence of the COVID-19 years. The set of countries include both EU members, and Iceland, Norway and Switzerland which have an identical level of development to those EU members and nearly no missing data.
The dependent variable used for this analysis is the annual standardized rate of treatable mortality of residents by sex, per 100,000 inhabitants, obtained from Eurostat table coded ‘HLTH_CD_APR’. This health outcome indicator accounts for all causes of death that can be mainly avoided through timely and effective health care intervention, before the age of 75, including secondary prevention and treatment (after the onset of diseases) (3, 4).
The explanatory variables are shown and described in Table 1 and they were selected conditional on data availability and on previous literature (11, 12, 18–26). These variables reflect the domains of financing (health expenditures), resources generation (health professionals and beds), and service delivery (inpatient related indicators) motivated by the building blocks of a health system proposed by WHO (11, 12). We use the control variable GDP per capita in PPP which has the label “GDPpc” (16–26). The source of all the independent variables is Eurostat database and the online code is displayed in Table 1.
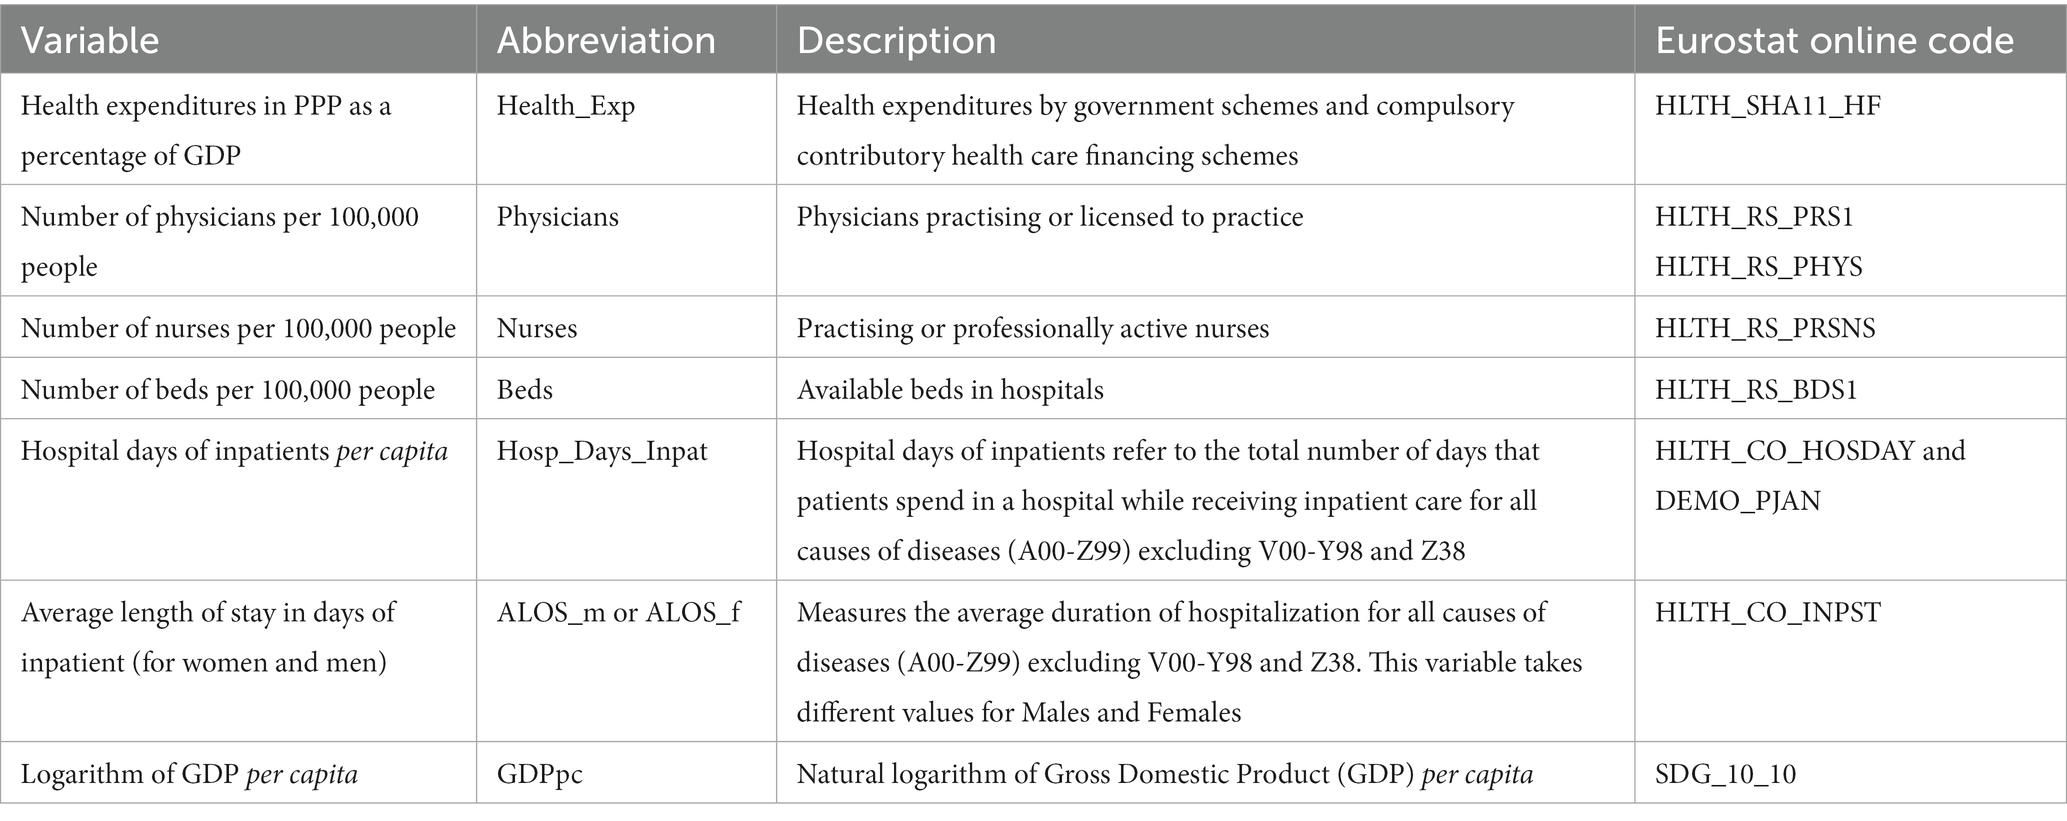
Table 1. Description of independent variables.
We start by performing a descriptive analysis of the variables. We also show the pairwise correlation between all the variables. Then, we undertake some preliminary tests: (i) a Silk-Wilkson test (27) for normal distribution of variables; (ii) a VIF estimation to check for multicollinearity; (iii) Cook’s distance to check for outliers and influential data (28); (iv) a Hausman test (29) to decide between fixed or random effects.
Finally, we obtain quantile plots for treatable mortality, and we estimate a quantile regression with fixed effects using the method of Machado and Santos Silva (30). Additionally, we used a panel data regression with fixed effects for each sample to obtain the conditional mean. A post-estimation Wald test (31) is then performed to check for global significance of the estimated models. The analysis is performed in STATA 16.
We start by describing the results found in the initial tests which are needed for the following regression estimation. The pairwise correlation is presented in Supplementary Appendix Table A3, in the Supplementary Material. The Silk-Wilkson test shows that data for each variable does not follow a normal distribution (Supplementary Appendix Table A4) justifying the use of a quantile regression approach; the estimation of the VIF values confirm the absence of multicollinearity because the values are under 10 (Supplementary Appendix Table A5); the computed Cook’s distance indicates the absence of influential data; finally, despite the inconclusive results for the Males sample, for the Females sample the Hausman test showed that fixed effects model is better than a random effects one (Supplementary Appendix Table A6). As one would expect, there are fixed effects emerging from the country’s characteristics and we assume that an identical result would emerge in the Males sample, should the sample be larger. The description of the panel data statistics is presented in Supplementary Appendix Table A7. These preliminary tests and analyses lend support to the upcoming estimation.
In the Supplementary material (Graphs A1, A2), we present the quantile plots for Male and Female Treatable Mortality. It is clear from the Male graph that there is a break before the 75th quantile. Such a pattern is much less clear for the Female sample. To allow for comparison between Males and Females, we chose the 20th, 50th and 70th quantiles to estimate the quantile regression. Supplementary Appendix Table A8 displays the countries and corresponding quantiles for treatable mortality rate in 2019. Quantiles represent the varying distribution of the treatable mortality rate across countries, with lower quantiles indicating lower mortality rates and higher quantiles corresponding to higher mortality rates.
We now proceed with the presentation of the results obtained from both the panel data linear regression estimation for the mean with country fixed effects, and the quantile regression description (Table 2).
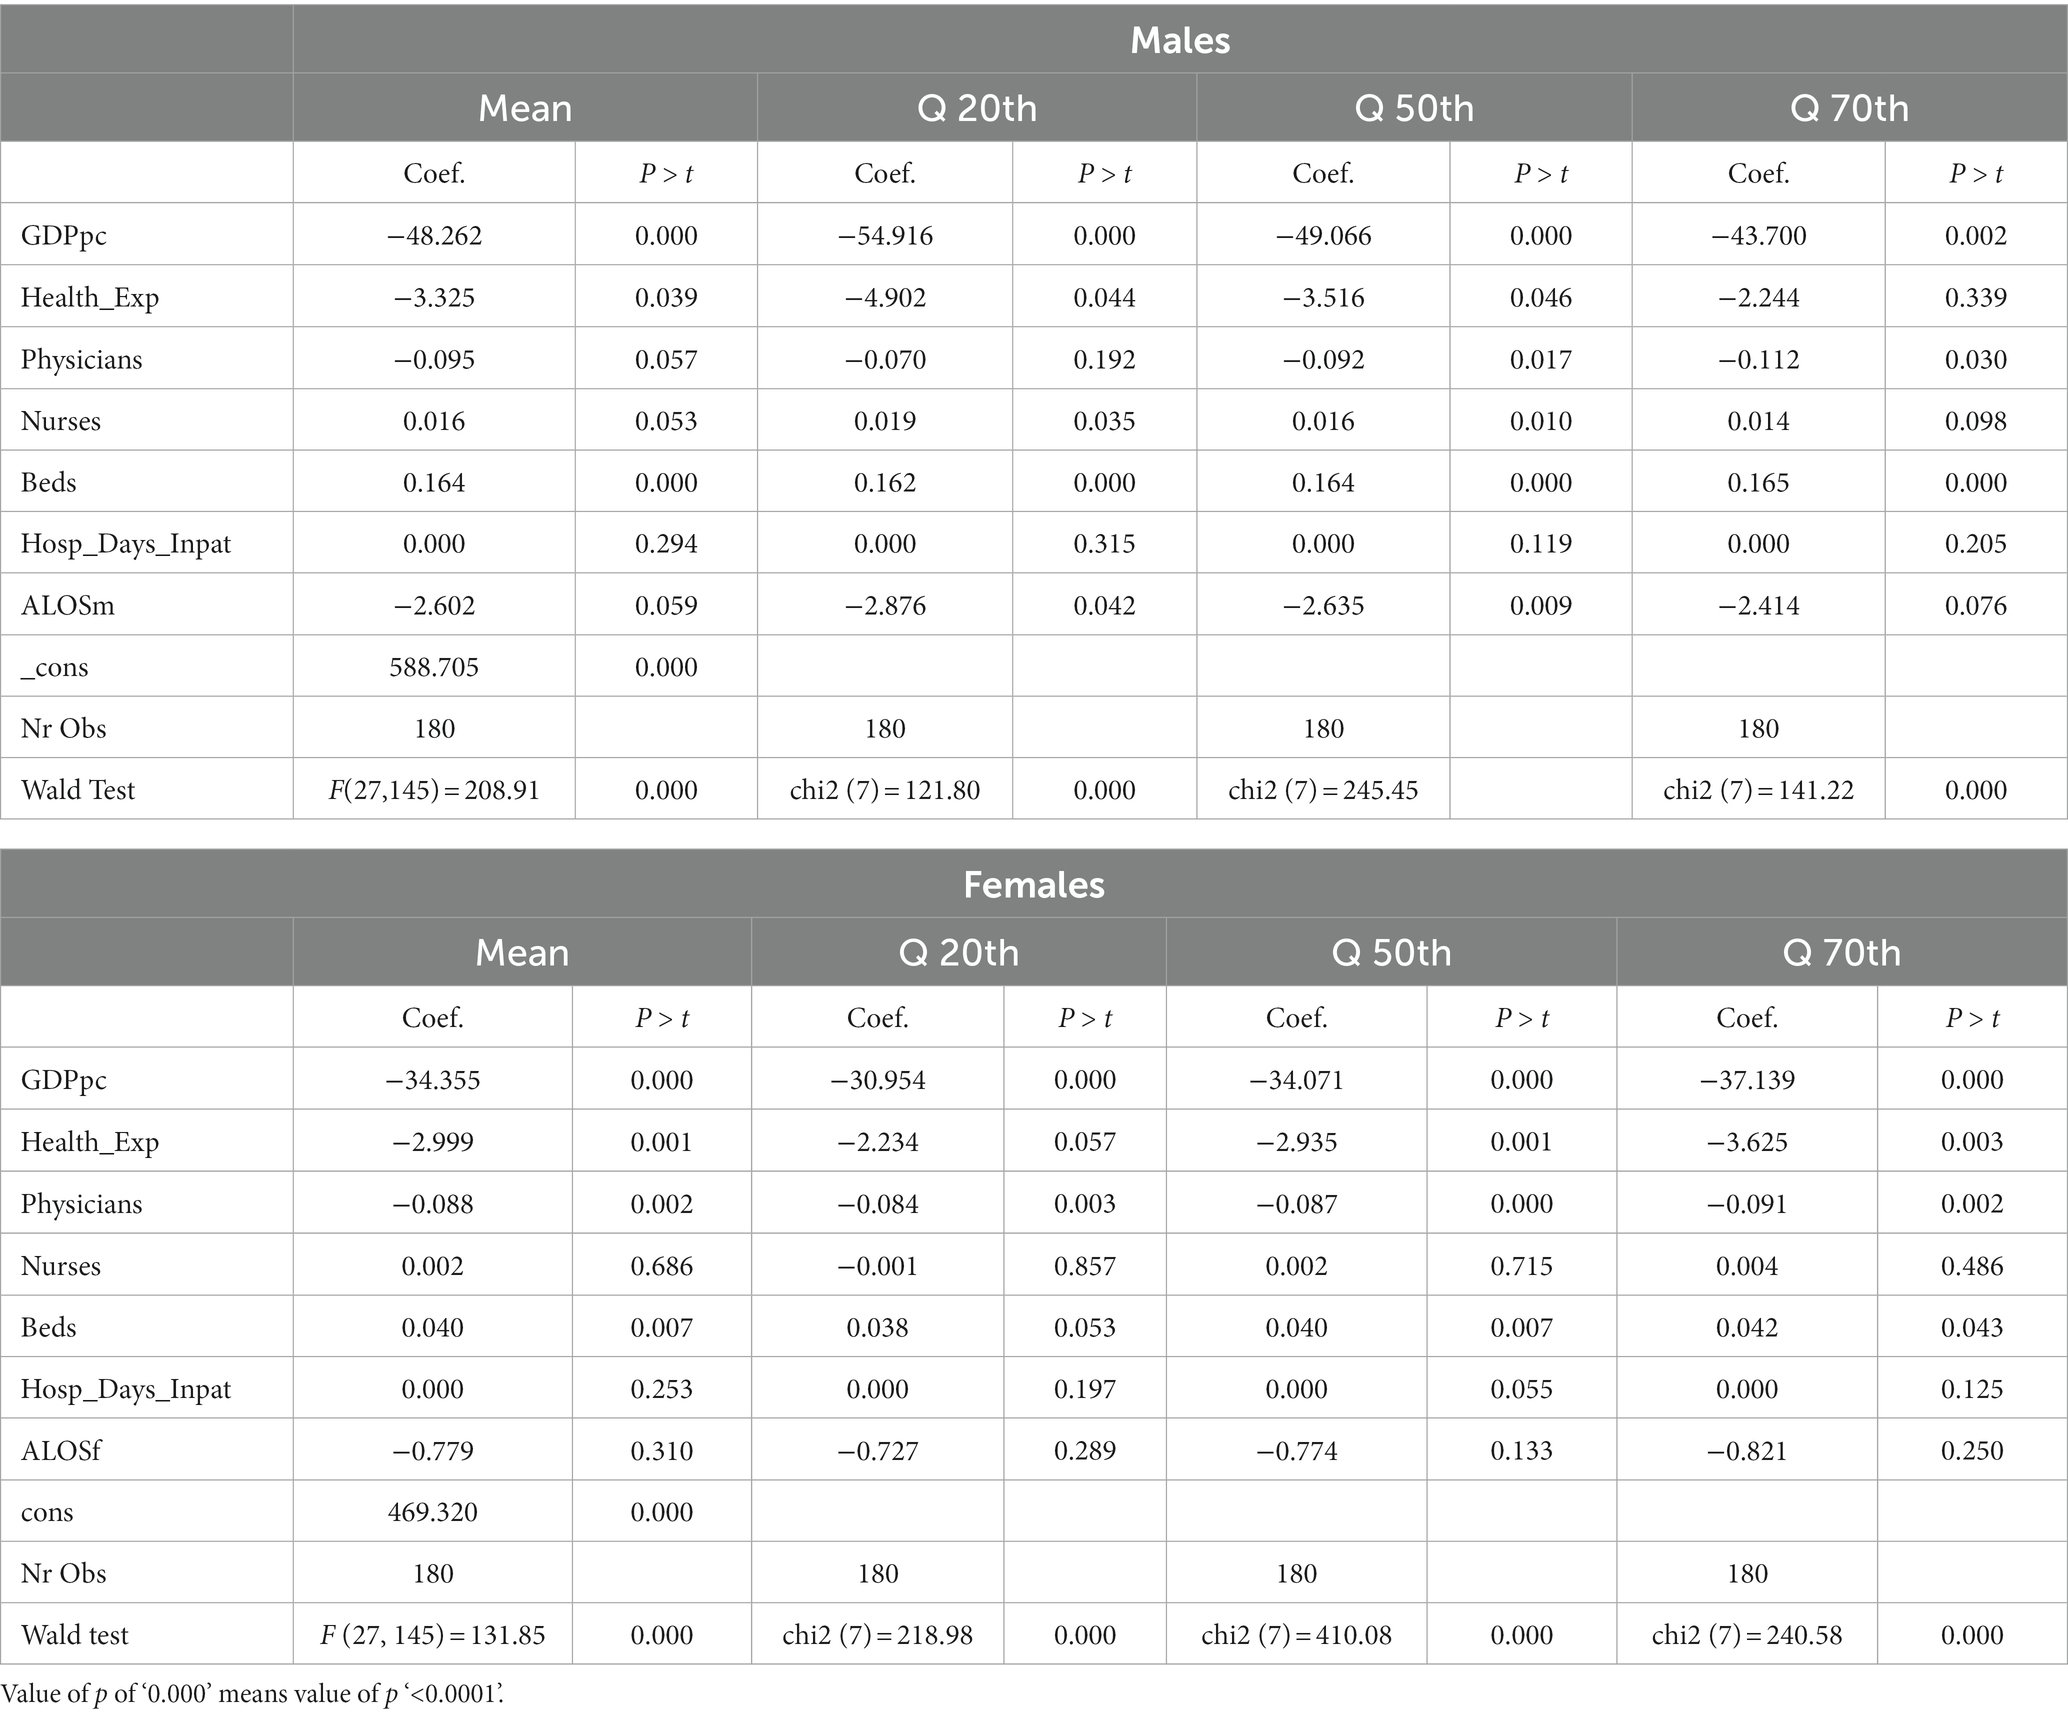
Table 2. Regression results.
As expected, countries with larger GDP per capita tend to register lower treatable mortality rates, both for women and men. Equally, countries allocating large funding to health, register lower mortality rates.
The findings for the different quantiles of male mortality show that for the 20th quantile, the number of physicians and hospital days are not statistically significant. While the average length of stay in hospital decreases mortality, the number of beds and nurses, surprisingly, represent a positive correlation. This positive correlation is maintained across the other quantiles, except for the 70th quantile, where the variable number of nurses loses statistical significance. The median quantile (50th quantile) shows the highest number of statistically significant variables, the exception is the average length of stay in hospital which has no explanatory power. The highest quantile (70th quantile) has the smallest number of significant variables, specifically, the GDP per capita, number of physicians, and number of beds per capita.
Concerning the findings for women across the different quantiles, it may be said that in general there is not big difference across the explanatory power of the different variables. Economic variables (GDP per capita and health expenditures) and health care variables (number of physicians and beds per capita) are significant in the three estimated quantiles. The remaining variables, specifically number of nurses per capita, hospital days of inpatients, and average length of stay in hospital are not statistically significant.
Finally, comparing the results between men and women we may conclude that on average there are more significant drivers of treatable mortality for men than for women, despite the direction found for the estimated coefficients being the same for both genders. The main difference between male and female results is that for females, nurses and average length of stay is not significant. Comparing the quantiles estimations, for men the median quantile shows an identical performance with the mean and the extreme quantiles showing some differences in the significant variables. Female quantiles estimations are more consistent over the whole distribution.
The key findings of this research may be listed and described as follows: (i) there are differences in factors explaining male and female treatable mortality. However, there are also common ones that show the same direction for both sexes. (ii) The favorable drivers, which lower mortality, are GDP per capita, health expenditures as share of the GDP, number of physicians per capita, and the average length of stay in hospital for men. (iii) The unfavorable drivers, meaning those that contribute to growing numbers of treatable mortality, include nurses and beds per capita, however nurses are not significant for explaining mortality among women. (iv) Lastly there is a greater diversity of factors of the male distribution of treatable mortality compared with that of the female sample. However, there is some consistency in the significant related factors of treatable mortality across this distribution.
We begin by analysing the mitigating factors of treatable mortality.
Firstly, GDP per capita is a well-recognized driver of diminishing mortality (7–9, 32, 33) and also of treatable mortality (21, 24, 33). The mechanisms sustaining such relationships are well-described in empirical studies and may be regarded as capital accumulation (4, 7–9, 34–36): (i) improved living conditions, (ii) better access to health care, (iii) improved health care infrastructure, and (iv) higher wages and better education.
Secondly, the increase in health expenditure as a share of GDP also mitigates treatable mortality (19–24, 32, 36–38). This is related to the abovementioned effects. With an increase in resources directed at healthcare, there is an improvement toward universal health coverage, better preventive care, and chronic disease management.
Thirdly, our results point to a correlation between a higher number of physicians per capita and a lower rate of preventable mortality. However, this result does not show agreement across different studies, with results being mixed. There are studies that do not find any relationship (39–41), while others find a negative effect (42), while still others find that the number of physicians have a beneficial effect on health by reducing amenable mortality (43–48). The reasons for our results may lie in features coupled with increased time spent attending to patients, enabling the early detection of diseases, dedicating, and providing better treatment, and managing better acute and chronic diseases.
Fourthly, the average length of stay in hospital improves the treatable mortality for men, but not for women. There is not a consensus surrounding this result as it is linked to several factors (49, 50). There may be a need for closer surveillance and patient control, and it is beneficial for men to stay longer in hospital from an aggregate point of view.
Next, we explain the factors that contribute to a worse treatable mortality indicator across countries.
Firstly, the number of nurses per capita is associated with the male mortality rate, but not the female one. Although this result is contrary to the findings of some studies (51, 52), our results are more aligned with others (53–55) which point to the number of nurses being below a threshold level and the increase in the patient–nurse ratio. Despite the disparities of nurses across Europe, there is a general tendency for staff shortages (56, 57) which may not be locally observable in some countries or hospitals, but it becomes noticeable on an aggregate level.
Secondly, the number of beds per capita seems to contribute to the increasing rate of treatable mortality. The well-known Roemer’s Law states that a “bed built is bed filled,” in other words, the more hospital beds are available, the higher the use of hospital services, resulting in an overutilization of hospital services (58, 59). Although there is no direct link between Roemer’s Law and hospital mortality, there are some features which may influence hospital mortality, like overcrowded hospital wards and consequent sub-optimal care (60). Our results therefore may confirm that there is sub-optimal care based on the hospital beds indicator and that their availability is not contributing to the reduction of treatable mortality, for men or women.
The major strength of this work is the contribution to the understanding of factors explaining treatable mortality in Europe in women and men and their difference for different levels of mortality rate, which may contribute to reduce the life expectancy gap between women and men. The limitations arising from our analysis derive from the short period considered and the impossibility of establishing causal relationships. It could be argued that contextual and cultural factors might influence treatable mortality, which were not considered due to the difficulty to define those factors into observable and collectable data. Despite the quantile approach used in our analysis, allowing to understand the differences in treatable mortality across countries, it does not directly reflect the effects on life expectancy differences across countries. Finally, the type of health system financing could also be seen as a related factor. However, given that European health systems typically feature universal coverage, either in Beveridge or Bismark-type of health systems, it would be expected to have less relevance in determining treatable mortality, as concluded in another study (24).
This work provides valuable insights into the factors that influence treatable mortality among both females and males across European countries. Understanding these drivers can support policy making aimed at implementing targeted interventions to reduce treatable mortality rates and improve the overall health in EU countries. There are different kinds of policy recommendations that emerge from this work. First, funding and economic development continue to be strongly associated with health outcomes, specifically in terms of treatable mortality. Secondly, hospital bed management needs to be improved. For instance, implementing scientifically based methods to optimize the allocation of beds in hospitals could improve data on treatable mortality. Finally, addressing the shortage of health professionals requires different responses depending on whether it pertains to nurses or physicians. On the one hand, more physicians ensure a decrease in treatable mortality. On the other hand, improving the understanding of the roles and capabilities of nurses within different hospital settings may also help in reducing mortality rates, rather than exacerbating them.
Publicly available datasets were analyzed in this study. This data can be found at: https://ec.europa.eu/eurostat/data/database.
AT: Writing – original draft, Writing – review & editing.
The author declares that no financial support was received for the research, authorship, and/or publication of this article.
The author acknowledge CEISUC/CIBB was funded by the national funds through FCT—Foundation for Science and Technology, I.P., under the Multiannual Financing of R&D Units 2020–2023.
The author declares that the research was conducted in the absence of any commercial or financial relationships that could be construed as a potential conflict of interest.
All claims expressed in this article are solely those of the authors and do not necessarily represent those of their affiliated organizations, or those of the publisher, the editors and the reviewers. Any product that may be evaluated in this article, or claim that may be made by its manufacturer, is not guaranteed or endorsed by the publisher.
The Supplementary material for this article can be found online at: https://www.frontiersin.org/articles/10.3389/fpubh.2024.1301825/full#supplementary-material
1. Eurostat (2023). Two-thirds of deaths under 75 could have been avoided. News articles Available at: https://ec.europa.eu/eurostat/web/products-eurostat-news/-/ddn-20200814-1
2. Eurostat/European Commission/OECD (2022). Avoidable mortality: OECD/Eurostat lists of preventable and treatable causes of death. Directorate F: Social statistics. (January 2022 version). Available at: https://www.oecd.org/health/health-systems/Avoidable-mortality-2019-Joint-OECD-Eurostat-List-preventable-treatable-causes-of-death.pdf
3. Eurostat (2023). Statistics explained. Mortality and life expectancy statistics. Available at: https://ec.europa.eu/eurostat/statistics-explained/index.php?title=Mortality_and_life_expectancy_statistics
4. Eurostat (2023). Preventable and mortality statistics. Statistics explained. Available at: https://ec.europa.eu/eurostat/statistics-explained/index.php?title=Preventable_and_treatable_mortality_statistics&oldid=541938#Overview
5. Alkire, BC, Peters, AW, Shrime, MG, and Meara, JG. The economic consequences of mortality amenable to high-quality health care in low- and middle-income countries. Health Affairs. (2018) 37:988–96. doi: 10.1377/hlthaff.2017.1233
6. Kruk, ME, Gage, AD, Arsenault, C, Jordan, K, Leslie, HH, Roder-DeWan, S, et al. High-quality health systems in the sustainable development goals era: time for a revolution. Lancet Glob Health. (2018) 6:e1196–252. doi: 10.1016/S2214-109X(18)30386-3
7. Arora, S . Health, human productivity, and long-term economic growth. J Econ History. (2001) 61:699–749. doi: 10.1017/S0022050701030054
8. Swift, R . The relationship between health and GDP in OECD countries in the very long run. Health Econ. (2011) 20:306–22. doi: 10.1002/hec.1590
9. Subramanian, SV, Belli, O, and Kawachi, I. The macroeconomic determinants of health. Annu Rev Public Health. (2002) 23:287–302. doi: 10.1146/annurev.publhealth.23.100901.140540
10. UN. SDG 3 . (2023). Ensure healthy lives and well-being for all at all ages. Available at: https://sdgs.un.org/goals/goal3
11. WHO . Monitoring the building blocks of health systems: a handbook of indicators and their measurement strategies. Geneve: WHO Press (2010).
12. WHO . Health system performance assessment: a framework for policy analysis In: I Papanicolas, D Rajan, M Karanikolos, A Soucat, and J Figueras, editors. Health Policy Series. European Observatory of Health Systems and Policies and World Health Organization. (2022). Available at: https://eurohealthobservatory.who.int/publications/i/health-system-performance-assessment-a-framework-for-policy-analysis
13. Arah, OA, Klazinga, NS, Delnoij, DMJ, ten Asbroek, A, and Custers, T. Custers, conceptual frameworks for health systems performance: a quest for effectiveness, quality, and improvement. Int J Qual Health Care. (2003) 15:377–98. doi: 10.1093/intqhc/mzg049
14. Eurostat . Database. (2023). Available at: https://ec.europa.eu/eurostat/data/database.
15. Mackenbach, JP, Rubio Valverde, J, Bopp, M, Brønnum-Hansen, H, Costa, G, Deboosere, P, et al. Progress against inequalities in mortality: register-based study of 15 European countries between 1990 and 2015. Eur J Epidemiol. (2019) 34:1131–42. doi: 10.1007/s10654-019-00580-9
16. Cutler, D, Deaton, A, and Lleras-Muney, A. The determinants of mortality. J Econ Perspect. (2006) 20:97–120. doi: 10.1257/jep.20.3.97
17. Scheiring, G, Irdam, D, and King, LP. Cross-country evidence on the social determinants of the post-socialist mortality crisis in Europe: a review and performance-based hierarchy of variables. Soc Health Ill. (2019) 41:673–91. doi: 10.1111/1467-9566.12846
18. Or, Z, Wang, J, and Jamison, D. Determinants of health outcomes in industrialized countries: A pooled, cross-country, time-series analysis. OECD economic studies 2000; No. 30,2000/I. Available at: https://www.oecd.org/economy/growth/2732311.pdf
19. Spijker, J . Socioeconomic determinants of regional mortality differences in Europe (population studies). University of Groningen, Netherlands: Purdue University Press (2005). Available at: https://pure.rug.nl/ws/portalfiles/portal/9814400/titlecon.pdf
20. Arah, OA, Wester, GP, Delnoij, DM, and Klazinga, NS. Health system outcomes and determinants amenable to public health in industrialized countries: a pooled, cross-sectional time series analysis. BMC Public Health. (2005) 5:81–91. doi: 10.1186/1471-2458-5-81
21. Joumard, I, André, C, Nicq, C, and Chatal, O. Health status determinants: lifestyle, environment, health care resources and efficiency. OECD Economic Department working paper (2008); no. 627. Available at: https://www.oecd-ilibrary.org/economics/health-status-determinants_240858500130
22. Roffia, P, Bucciol, A, and Hashlamoun, S. Determinants of life expectancy at birth: a longitudinal study on OECD countries. Int J Health Econ Manag. (2023) 23:189–212. doi: 10.1007/s10754-022-09338-5
23. Anwar, A, Hyder, S, Mohamed Nor, N, and Younis, M. Government health expenditures and health outcome nexus: a study on OECD countries. Front Public Health. (2023) 11:1123759. doi: 10.3389/fpubh.2023.1123759
24. Ivankova, V, Gavurova, B, and Khouri, S. Understanding the relationships between health spending, treatable mortality and economic productivity in OECD countries. Front Public Health. (2022) 10:1036058. doi: 10.3389/fpubh.2022.1036058
25. Varbanova, V, and Beutels, P. Recent quantitative research on determinants of health in high income countries: a scoping review. PLoS One. (2020) 15:e0239031. doi: 10.1371/journal.pone.0239031
26. Mackenbach, JP, Bouvier-Colle, M, and Jougla, E. "avoidable" mortality and health services: a review of aggregate data studies. J Epidemiol Com Health. (1990) 44:106–11. doi: 10.1136/jech.44.2.106
27. Royston, JP . A simple method for evaluating the Shapiro–Francia W′ test of non-normality. J Royal Stat Soc. (1983) 32:297–300. doi: 10.2307/2987935
28. Vincent, D. Cook’s distance measures for panel data models, London. Stata Conference 2022 (No. 03). Stata Users Group. (2022). Available at: https://www.stata.com/meeting/uk22/slides/UK22_Vincent.pdf
29. Hausman, JA . Specification tests in econometrics. Econometrica. (1978) 46:1251–71. doi: 10.2307/1913827
30. Machado, JAF, and Santos Silva, JMC. Quantiles via Moments. J Econ. (2019) 213:145–73. doi: 10.1016/j.jeconom.2019.04.009
32. Mackenbach, JP, and Looman, CWN. Life expectancy and national income in Europe, 1900–2008: an update of Preston's analysis. Int J Epidemiol. (2013) 42:1100–10. doi: 10.1093/ije/dyt122
33. Preston, SH . The changing relation between mortality and level of economic development. Int J Epidemiol. (2007) 36:484–90. doi: 10.1093/ije/dym075
34. Rocco, L, Fumagalli, E, Mirelman, AJ, and Suhrcke, M. Mortality, morbidity and economic growth. PLoS One. (2021) 16:e0251424. doi: 10.1371/journal.pone.0251424
36. López-Casasnovas, G, Rivera, B, and Currais, L. Health and economic growth: Findings and policy implications. Barcelona: Universitad Pompeu Fabra (2005).
37. Sharma, R . Health and economic growth: evidence from dynamic panel data of 143 years. PLoS One. (2018) 13:e0204940. doi: 10.1371/journal.pone.0204940
38. Duba, J, Berry, J, Alan Fang, A, and Baughn, M. The effects of health care expenditures as a percentage of GDP on life expectancies. Res. Appl Econ. (2018) 10:50–65. doi: 10.5296/rae.v10i2.12654
39. Heijink, R, Koolman, X, and Westert, GP. Spending more money, saving more lives? The relationship between avoidable mortality and healthcare spending in 14 countries. Eur J Health Econ. (2013) 14:527–38. doi: 10.1007/s10198-012-0398-3
40. Mays, GP, and Smith, SA. Evidence links increases in public health spending to declines in preventable deaths. Health Aff. (2011) 30:1585–93. doi: 10.1377/hlthaff.2011.0196
41. Chen, BK, Jindal, D, Yang, YT, Hair, N, and Yang, CY. Associations between physician supply levels and amenable mortality rates: an analysis of Taiwan over nearly 4 decades. Health Serv Insights. (2020) 13:117863292095487. doi: 10.1177/1178632920954878
42. Watson, DE, and McGrail, KM. More doctors or better care? Health Policy. (2009) 5:26–31. doi: 10.12927/hcpol.2009.21000
43. Young, FW . An explanation of the persistent doctor-mortality association. J Epidemiol Com Health. (2001) 55:80–4. doi: 10.1136/jech.55.2.80
44. Richardson, J, and Peacock, SJ. Will more doctors increase or decrease death rates? An econometric analysis of Australian mortality statistics. Centre for Health Program Evaluation (CHPE), e Faculty of Business and Economics at Monash University. (2003) 137. Available at: https://citeseerx.ist.psu.edu/document?repid=rep1&type=pdf&doi=9d36b595d758374f4127a5e4d3a494213d5a7361
45. Basu, S, Berkowitz, SA, Phillips, RL, Bitton, A, Landon, BE, and Phillips, RS. Association of Primary Care Physician Supply with Population Mortality in the United States, 2005-2015. JAMA Intern Med. (2019) 179:506–14. doi: 10.1001/jamainternmed.2018.7624
46. Gulliford, MC . Availability of primary care doctors and population health in England: is there an association? J Public Health Med. (2002) 24:252–4. doi: 10.1093/pubmed/24.4.252
47. Robst, JM . A note on the relationship between medical care resources and mortality. Appl Econ Letters. (2001) 8:737–9. doi: 10.1080/13504850110036328
48. Zheng, H, and George, LK. Does medical expansion improve population health? JHealth Socl Behav. (2018) 59:113–32. doi: 10.1177/0022146518754534
49. Awad, A, Bader-El-Den, MB, and McNicholas, J. Patient length of stay and mortality prediction: a survey. Health Serv Manag Res. (2017) 30:105–20. doi: 10.1177/0951484817696212
50. Philbin, EF, Rogers, VA, Sheesley, KA, Lynch, LJ, Andreou, C, and Rocco, TA. The relationship between hospital length of stay and rate of death in heart failure. Heart Lung. (1997) 26:177–86. doi: 10.1016/S0147-9563(97)90054-6
51. Griffiths, P, Ball, J, Bloor, K, Böhning, D, Briggs, J, Dall’Ora, C, et al. Nurse staffing levels, missed vital signs and mortality in hospitals: retrospective longitudinal observational study. Health Serv Deliv Res. (2018) 6:1–120. doi: 10.3310/hsdr06380
52. Kutney-Lee, A, Sloane, DM, and Aiken, LH. An increase in the number of nurses with baccalaureate degrees is linked to lower rates of post surgery mortality. Health Aff. (2013) 32:579–86. doi: 10.1377/hlthaff.2012.0504
53. Aiken, LH, Sloane, DM, Bruyneel, L, Van den Heede, K, Griffiths, P, Busse, R, et al. Nurse staffing and education and hospital mortality in nine European countries: a retrospective observational study. Lancet. (2014) 383:1824–30. doi: 10.1016/S0140-6736(13)62631-8
54. Cho, E, Sloane, DM, Kim, E, Kim, S, Choi, M, Yoo, IY, et al. Effects of nurse staffing, work environments, and education on patient mortality: an observational study. I J Nurs Studies. (2015) 52:535–42. doi: 10.1016/j.ijnurstu.2014.08.006
55. Needleman, J, Buerhaus, P, Pankratz, VS, Leibson, CL, Stevens, SR, and Harris, MR. Nurse staffing and inpatient hospital mortality. New England J Med. (2011) 364:1037–45. doi: 10.1056/NEJMsa1001025
56. Raeve, PD (2023) The registered nurse shortage in Europe is a ticking time bomb. Health Europa. Health Policy News. Available at https://www.healtheuropa.com/the-registered-nurse-shortage-in-europe-is-a-ticking-time-bomb/119272/
57. OECD/European Union . Health at a glance: Europe 2020: State of health in the EU cycle. Paris: OECD Publishing (2020).
58. Delamater, PL, Messina, JP, Grady, SC, WinklerPrins, V, and Shortridge, AM. Do more hospital beds Lead to higher hospitalization rates? A spatial examination of Roemer’s law. PLoS One. (2013) 8:e54900. doi: 10.1371/journal.pone.0054900
59. Jones, RP . Hospital bed occupancy and deaths (all-cause mortality) in 2015. British J Healthcare Manag. (2016) 22:283–5. doi: 10.12968/bjhc.2016.22.5.283
Keywords: treatable mortality, health expenditures, health resources, Europe, quantile regression
Citation: Tavares AI (2024) Treatable mortality and health care related factors across European countries. Front. Public Health. 12:1301825. doi: 10.3389/fpubh.2024.1301825
Edited by:
John Yfantopoulos, National and Kapodistrian University of Athens, GreeceReviewed by:
Arjun Kumar Thapa, Pokhara University, NepalCopyright © 2024 Tavares. This is an open-access article distributed under the terms of the Creative Commons Attribution License (CC BY). The use, distribution or reproduction in other forums is permitted, provided the original author(s) and the copyright owner(s) are credited and that the original publication in this journal is cited, in accordance with accepted academic practice. No use, distribution or reproduction is permitted which does not comply with these terms.
*Correspondence: Aida Isabel Tavares, YWl0YXZhckBnbWFpbC5jb20=
Disclaimer: All claims expressed in this article are solely those of the authors and do not necessarily represent those of their affiliated organizations, or those of the publisher, the editors and the reviewers. Any product that may be evaluated in this article or claim that may be made by its manufacturer is not guaranteed or endorsed by the publisher.
Research integrity at Frontiers
Learn more about the work of our research integrity team to safeguard the quality of each article we publish.