
94% of researchers rate our articles as excellent or good
Learn more about the work of our research integrity team to safeguard the quality of each article we publish.
Find out more
ORIGINAL RESEARCH article
Front. Public Health , 28 February 2024
Sec. Life-Course Epidemiology and Social Inequalities in Health
Volume 12 - 2024 | https://doi.org/10.3389/fpubh.2024.1297060
 Miguel Angelo Duarte Junior1
 Salud Pintos Carrillo1
 David Martínez-Gómez1,2,3
 Mercedes Sotos Prieto1,2,3,4*
 Fernando Rodríguez-Artalejo1,2,3
 Verónica Cabanas Sánchez1,2,3
Aim: To examine the independent relationships of lifestyle and social and economic factors with all-cause and cardiovascular disease (CVD) mortality in a large representative sample of the US adult population. Furthermore, the association between the combination of lifestyle and social and economic factors with mortality was analyzed in detail.
Methods: The sample included 103,314 participants with valid records and eligible for mortality follow-up, and information on lifestyle factors and social and economic disadvantages (NHIS waves 2000, 2005, 2010, and 2015). An unhealthy lifestyle score was constructed using information on physical activity, alcohol consumption, diet, and smoking status. Social and economic disadvantages were assessed using information on education, receipt of dividends, employment, family's home, and access to private health. Information on mortality data was determined by the National Death Index records.
Results: Compared with favorable lifestyle, unfavorable lifestyle was associated with higher all-cause (HR 2.07; 95% CI 1.97–2.19) and CVD (HR 1.84; 95% CI 1.68–2.02) mortality. Higher social and economic disadvantages were also associated with higher all-cause (HR 2.44; 95% CI 2.30–2.59) and CVD mortality (HR 2.44; 95% CI 2.16–2.77), compared to low social and economic disadvantages. In joint associations, participants in the high social and economic disadvantage and unfavorable lifestyle showed a greater risk of all-cause (HR 4.06; 95% CI 3.69–4.47) and CVD mortality (HR 3.98; 95% CI 3.31–4.79).
Conclusion: Lifestyle and social and economic disadvantages are associated with all-cause and CVD mortality. The risk of mortality increases as the number of social and economic disadvantages and unhealthy lifestyles increases.
Modifiable behavioral factors, such as physical activity, alcohol consumption, diet, and smoking, are directly related to health status and all-cause and cardiovascular disease (CVD) mortality (1, 2). Their impact on health could differ when considered individually or in combination (i.e., lifestyle profile) (2–4). However, social and economic factors are also involved in the complex causal system linking lifestyle and health (5). The U.S. Department of Health and Human Services stated that the conditions in the environments where people are born, live, learn, work, and get older are strong determinants of health. These conditions affect a wide range of health, functioning, and quality-of-life outcomes, and have been classified into five major domains: (i) economic stability, (ii) education access and quality, (iii) health care access and quality, (iv) neighborhood and built environment, and (v) social community context (6).
In this same vein, the American Heart Association (AHA) highlights that social determinants of health are fundamental to cardiovascular health. They even proposed a social-ecological model illustrating the interaction between social determinants of health and cardiovascular health (7). This highlight is due to the worrying cardiovascular health data in the US population. For example, around 120 million Americans currently have ≥1 forms of CVD (8). CVD is the leading cause of death in the United States (9) and worldwide (10). CVD deaths have increased from 2011 to 2017 by 9.7% (8). This also results in an economic and public health concern, as CVD mortality generates an economic burden with an estimated average annual cost of 363.4 billion dollars (11).
Social and economic disadvantages have been identified as a barrier for adopting appropriate health behaviors which, in turn, could lead to CVD and CVD mortality (1–4, 12). Thus, understanding how lifestyle and social and economic disadvantages have an impact on mortality can provide evidence that could guide public policies to act on social and economic disadvantages, especially those that are social determinants of health; and to promote healthy lifestyles among people in unfavorable social and economic situations.
Given the current complex economic situation, with increasing health status differences between social classes in the United States (13), the large number of people who still do not meet the recommendations of physical activity, alcohol, diet, and smoking (4, 14, 15), the very low prevalence of “ideal” cardiovascular health in the US population (< 1%) (7), and the need for more research on social and economic factors and cardiovascular health (7), it is important to improve our understanding of how the interaction of these factors is related with mortality outcomes. Therefore, this study aimed to examine the independent relationships of lifestyle and social and economic factors with all-cause and CVD mortality in a large representative sample of the US adult population, who participated in the National Health Interview Survey (NHIS). Furthermore, the association between the combination of lifestyle and social and economic factors with mortality was analyzed in detail.
The NHIS is a representative health survey conducted annually by the National Center for Health Statistics (NCHS) to assess health practices and behaviors in the US population. The target population for the NHIS consists of the civilian non-institutionalized population residing within the 50 states and the District of Columbia at the time of the interview. The study design and data collection have been previously reported (16, 17). Briefly, in the first step, approximately 35,000 cluster households are randomly selected (per year). In each household, an adult aged 18 years or older is selected to answer an interview. Interviews are conducted by Census interviewers who are appropriately trained and directed by health survey supervisors at the U.S. Census. Data are collected through computer-assisted in-person in-home interviews, with telephone follow-up when the interview cannot be conducted in person. Full details on the survey methods and procedures are available on the NHIS website (https://www.cdc.gov/nchs/nhis/).
For the present work, we selected data collected in 2000, 2005, 2010, and 2015 because complete information on the four lifestyles of interest (diet, physical activity, smoking, and alcohol intake) was only collected in those waves. Of the total US NHIS participants (n = 393,032), 118,357 were adults with valid records and eligible for mortality follow-up; after excluding those with missing information on lifestyle and socioeconomic factors (n = 15,043), the analytic sample included 103,314 participants (Supplementary Figure S1).
Physical activity was estimated according to the duration and intensity of leisure-time physical activity reported by participants. Physical activity level was classified as unhealthy if it was below the World Health Organization recommendations (i.e., 150 min of moderate physical activity per week, 75 min of vigorous activity per week, or an equivalent combination of both) (18). Alcohol consumption was evaluated according to the frequency and amount of alcohol consumed. Heavy alcohol use as an unhealthy pattern was considered according to the sex-specific criteria of the National Institute on Alcohol Abuse and Alcoholism; that is, for men, consuming >4 drinks on any day or >14 drinks per week and, for women, consuming >3 drinks on any day or >7 drinks per week (19). Participants reported information on fruit and vegetable intake during the past month; when an unhealthy consumption was defined as non-daily intake of fruits and vegetables (20–22). Smoking status was categorized as never, former, or current smoker. For this lifestyle behavior, unhealthy participants were former smokers (i.e., those who had smoked at least 100 cigarettes in his or her lifetime but who had quit smoking at the time of interview) and current smokers (i.e., those who had smoked 100 cigarettes during the lifetime and currently smokes cigarettes).
For each lifestyle risk factor, we assigned 1 point. Thus, the unhealthy lifestyle score resulted from the sum of the four risk factors and ranged between 0 and 4. Participants were classified according to this score into three lifestyle categories: “favorable” (0–1 points), “intermediate” (2 points), and “unfavorable” (3–4 points).
Five social and economic disadvantages were considered: education, receipt of dividends, employment, family's home, and access to private health. Education was classified into two different levels: (i) high school, general equivalence degree (GED) or lower, and (ii) higher than high school. The receipt of dividends was also classified into two categories: (i) reported receiving dividends from stocks, mutual funds, or net rental income from property, royalties, estates, or trusts, and (ii) reported not receiving dividends. Employment was also divided in two categories, (i) employed; those who reported working (with or without pay), (ii) not employed: those who reported be out of the labor market. Information about the family's home was also classified into two categories: (i) owned, for those who stated that the house was owned or being bought, and (ii) not owned, for those who responded that the house was rented or other arrangement. Furthermore, we also categorized cover by private health insurance into two categories: (i) claimed to have private health insurance, and (ii) did not have cover by private health insurance. Finally, to understand how these factors can impact the risk of mortality when combined, a social and economic disadvantages score was created. Low education, not receiving dividends, not employed, not owning a house, and not having a private health insurance were considered categories of social disadvantage, assigning one point to each one. Thus, social, and economic disadvantages score ranged 0 to 5 and classified as: low (0–1), medium (2, 3), and high (4, 5).
Information on all-cause and CVD mortality data was determined by the NCHS (National Center for Health Statistics) based on linkage with the National Death Index (NDI) records through December 31, 2019. All-cause mortality was the primary outcome variable. Leading underlying cause of death was classified using the 10th revision of the International Statistical Classification of Diseases, Injuries, and Causes of Death (ICD-10), and CVD mortality was defined as death for diseases of heart or cerebrovascular diseases (ICD-10 codes I00–I09, I11, I13, I20–I51, I60–I69).
All covariates were self-reported, and included age, sex, race/ethnicity (non-Hispanic White, non-Hispanic Black, Hispanics, other, and no response), and marital status (single, married, separated, or widowed). Moreover, participants were asked if they had ever been told by a doctor or other health professional if they had had cancer or CVD.
Characteristics of the study sample at baseline are presented as frequency and percentage for categorical variables, and as mean and standard deviation for continuous variables by lifestyle categories. We used Cox proportional hazard regression models to estimate the Hazard Ratios (HR) and 95% Confidence Intervals (CI) for the association of lifestyle categories (i.e., favorable, intermediate, unfavorable), individual lifestyle risk factors (i.e., physical activity, heavy alcohol drinking, diet, and smoking), and social and economic disadvantages (i.e., education, dividends from stocks, employment, family own home, and private health insurance) with all-cause and CVD mortality. The proportional hazards assumption was confirmed using the Schoenfeld residuals method. All analyses were adjusted for sex, age, race/ethnicity, marital status, cancer, and chronic CVD conditions (model 1). Moreover, to analyze for individual risk factors an additional model was created adjusting for all other individual risk factors (model 2). That is, the analyses for individual lifestyle risk factors were mutually adjusted for physical activity, excessive alcohol consumption, diet, and smoking, while analyses for individual social and economic disadvantages were mutually adjusted for education, dividends, employment, family's home, and private health insurance.
We also performed analyses stratified by social and economic disadvantages to assess the association between lifestyle categories and all-cause and CVD mortality, considering those with a favorable lifestyle as the reference category. Finally, we tested the combined association of social and economic disadvantages with all-cause and CVD mortality using the social and economic disadvantages score and lifestyle categories. For this analysis, the reference category was those with favorable lifestyle (i.e., 0–1 lifestyle risk factors) and with low social and economic disadvantages (i.e., 0–1 social and economic disadvantages). Additionally, we fitted interaction terms between lifestyle score and each social and economic factors, and between social and economic categories and each lifestyle factors in the fully adjusted models.
All analyses accounted for the complex survey design employed in NHIS by considering sample weights, and primary sampling units and stratum for variance estimation. The analyses were performed using Stata v.16.0, establishing a level of statistical significance at p < 0.05.
Table 1 shows the baseline characteristics of participants by lifestyle categories. Participants with unfavorable lifestyle were mostly men and had lower levels of education. Moreover, they showed lower levels of physical activity, lower consumption of fruits and vegetables and higher prevalence of heavy alcohol consumption and chronic conditions (i.e., cancer, and CVD).
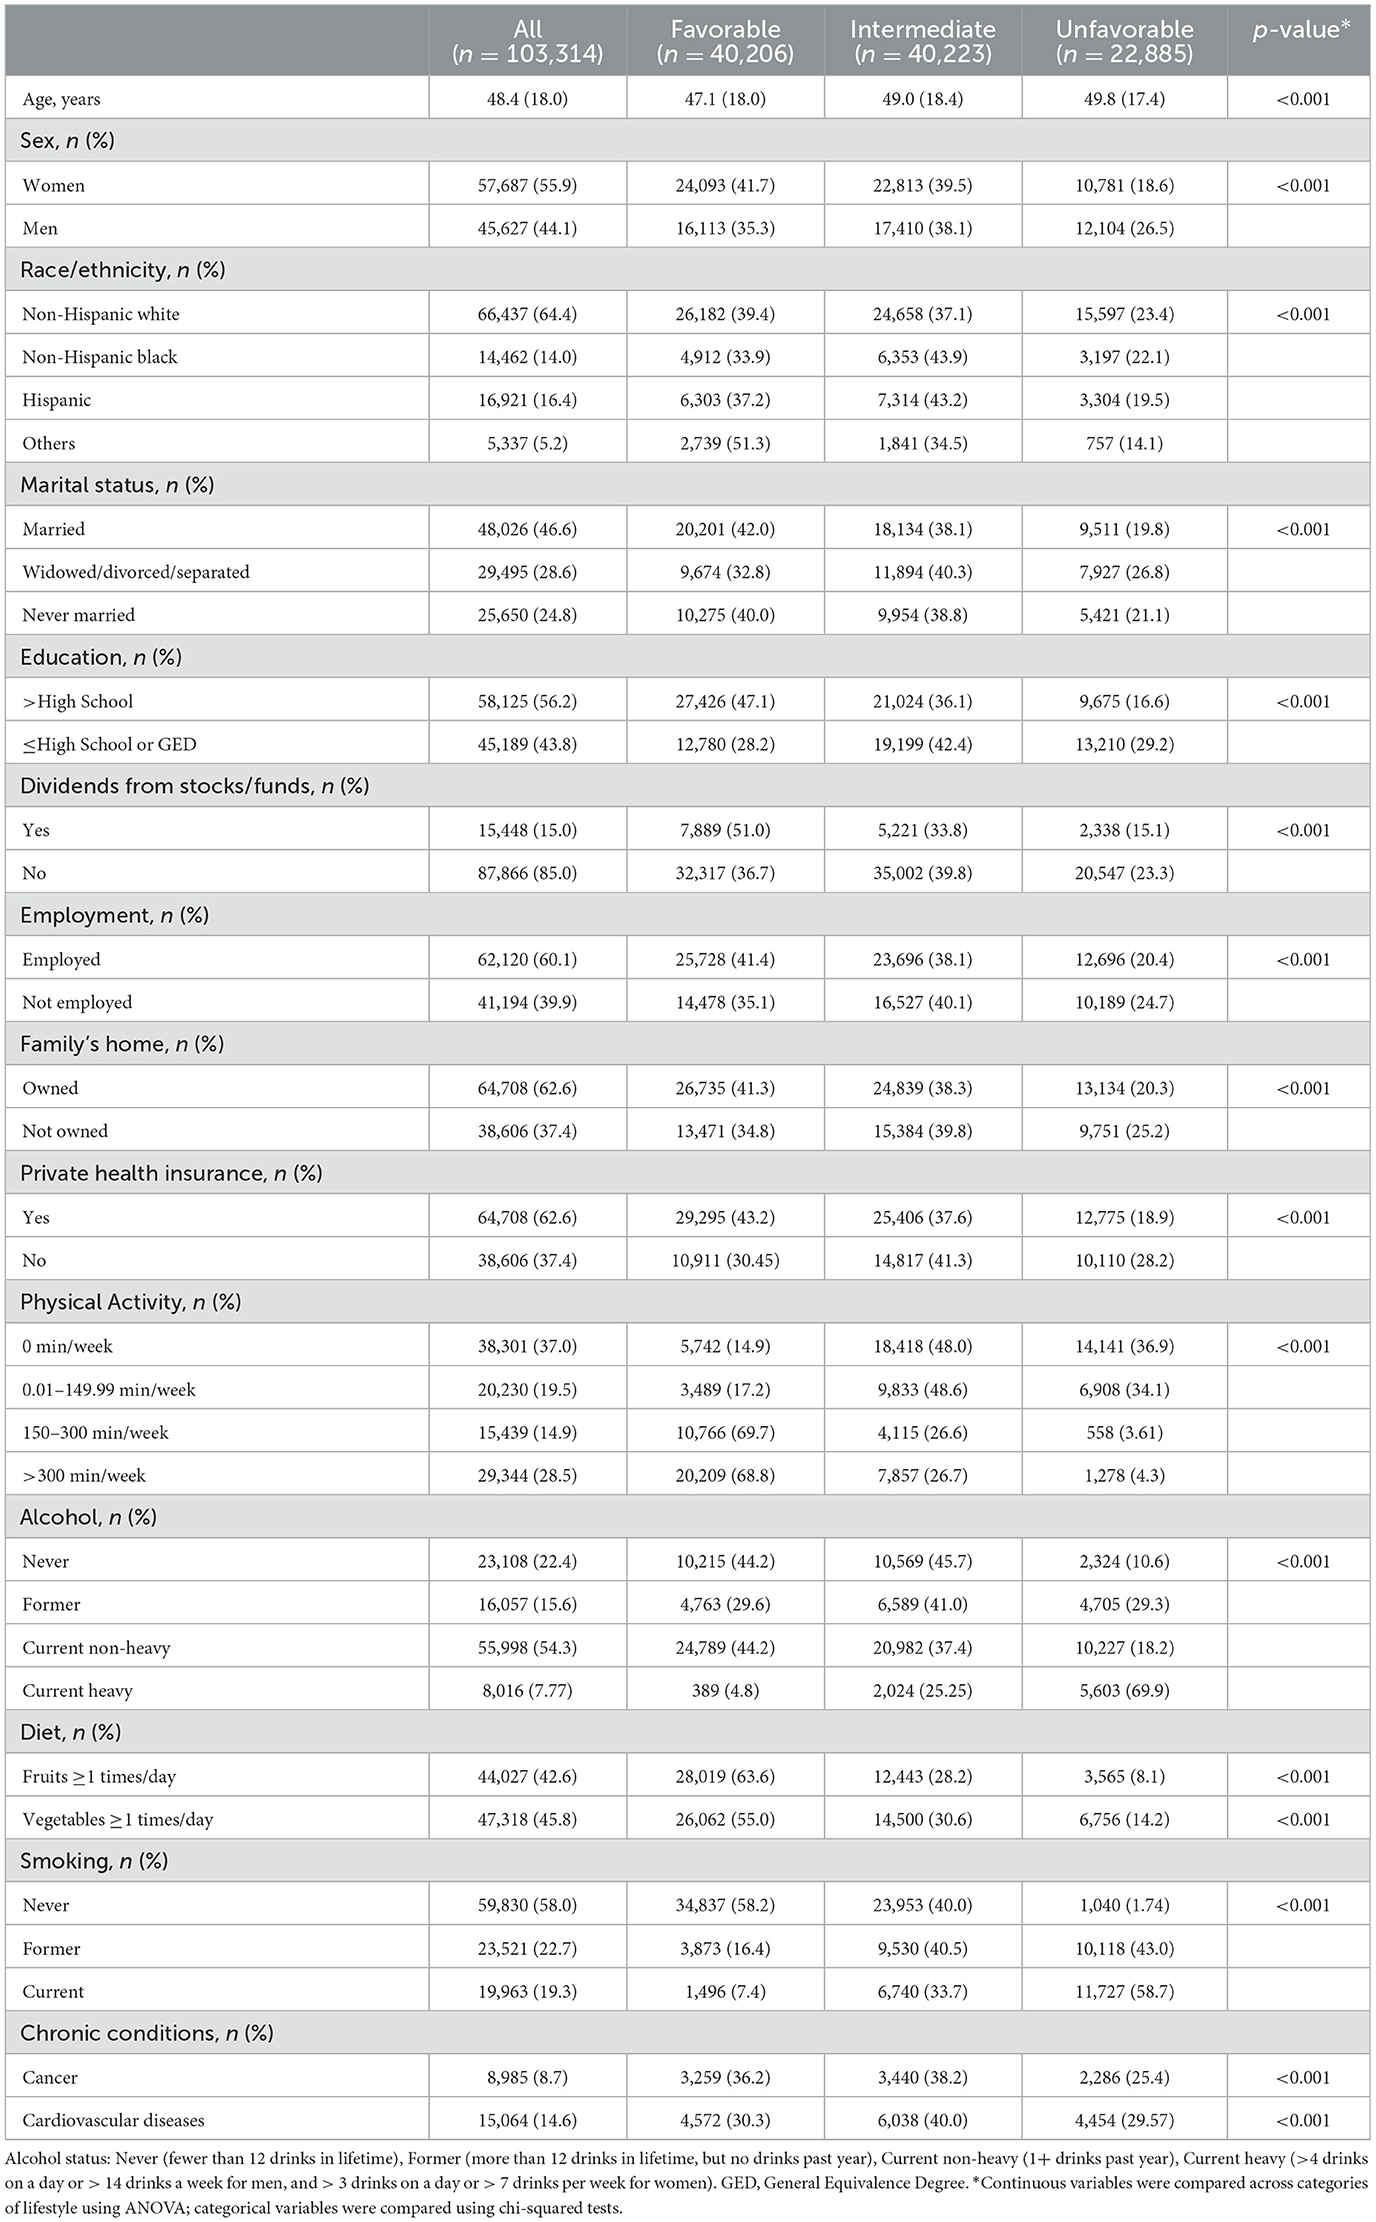
Table 1. Characteristics of study participants by lifestyle categories.
Overall, 9.4% of participants had zero lifestyle risk factors; 29.4%, 38.9%, 19.8%, and 2.3% had one, two, three and four lifestyle risk factors, respectively. Thus, the lifestyle index was classified as favorable, intermediate, and unfavorable for 38.9%, 39.0% and 22.1% of the participants, respectively. The prevalence of participants with low physical activity and former/current smokers decreased over the evaluated years. As well as the prevalence of participants in the unfavorable lifestyle category (Supplementary Table S1).
In social and economic disadvantages score, 5.5% of participants had zero social and economic disadvantages; 22.5%, 27.5%, 21.7%, 15.5%, and 7.1% had one, two, three, four and five social and economic disadvantages, respectively. The social and economic disadvantages categories were classified as low, medium, and high for 28.1%, 49.2%, and 22.7% of the participants, respectively. Participants in the low disadvantage category increased from 39.1% in 2000 to 45.0% in 2015 (Supplementary Table S2).
The prevalence of unhealthy lifestyle factors was higher among participants with social and economic disadvantage, except for alcohol consumption, when the prevalence of heavy alcohol consumption was higher among employed participants (Supplementary Table S3).
Table 2 shows the association of lifestyle categories and factors with all-cause and CVD mortality. During a mean follow-up of 10.4 years (inter-quartile range: 4.6 to 14.6), 15,377 all-cause deaths and 4,843 CVD deaths were ascertained. Comparing to participants in the favorable lifestyle category, those in the intermediate (HR 1.39; 95% CI 1.33–1.45) and unfavorable (HR 2.07; 95% CI 1.97–2.19) category had an increased risk of all-cause mortality. All lifestyle factors were individually associated with increased all-cause mortality, with HR ranging from 1.08 to 1.61 (model 2). In a similar way, participants in an intermediate (HR 1.42; 95% CI 1.30–1.54) and unfavorable (HR 1.84; 95% CI 1.68–2.02) lifestyle category had higher risk of CVD mortality compared to those in the favorable lifestyle risk category. Individually, low physical activity (HR 1.79; 95% CI 1.64–1.95) and smoking (former/current; HR 1.30; 95% CI 1.21–1.39) were associated with increased CVD mortality (model 2).
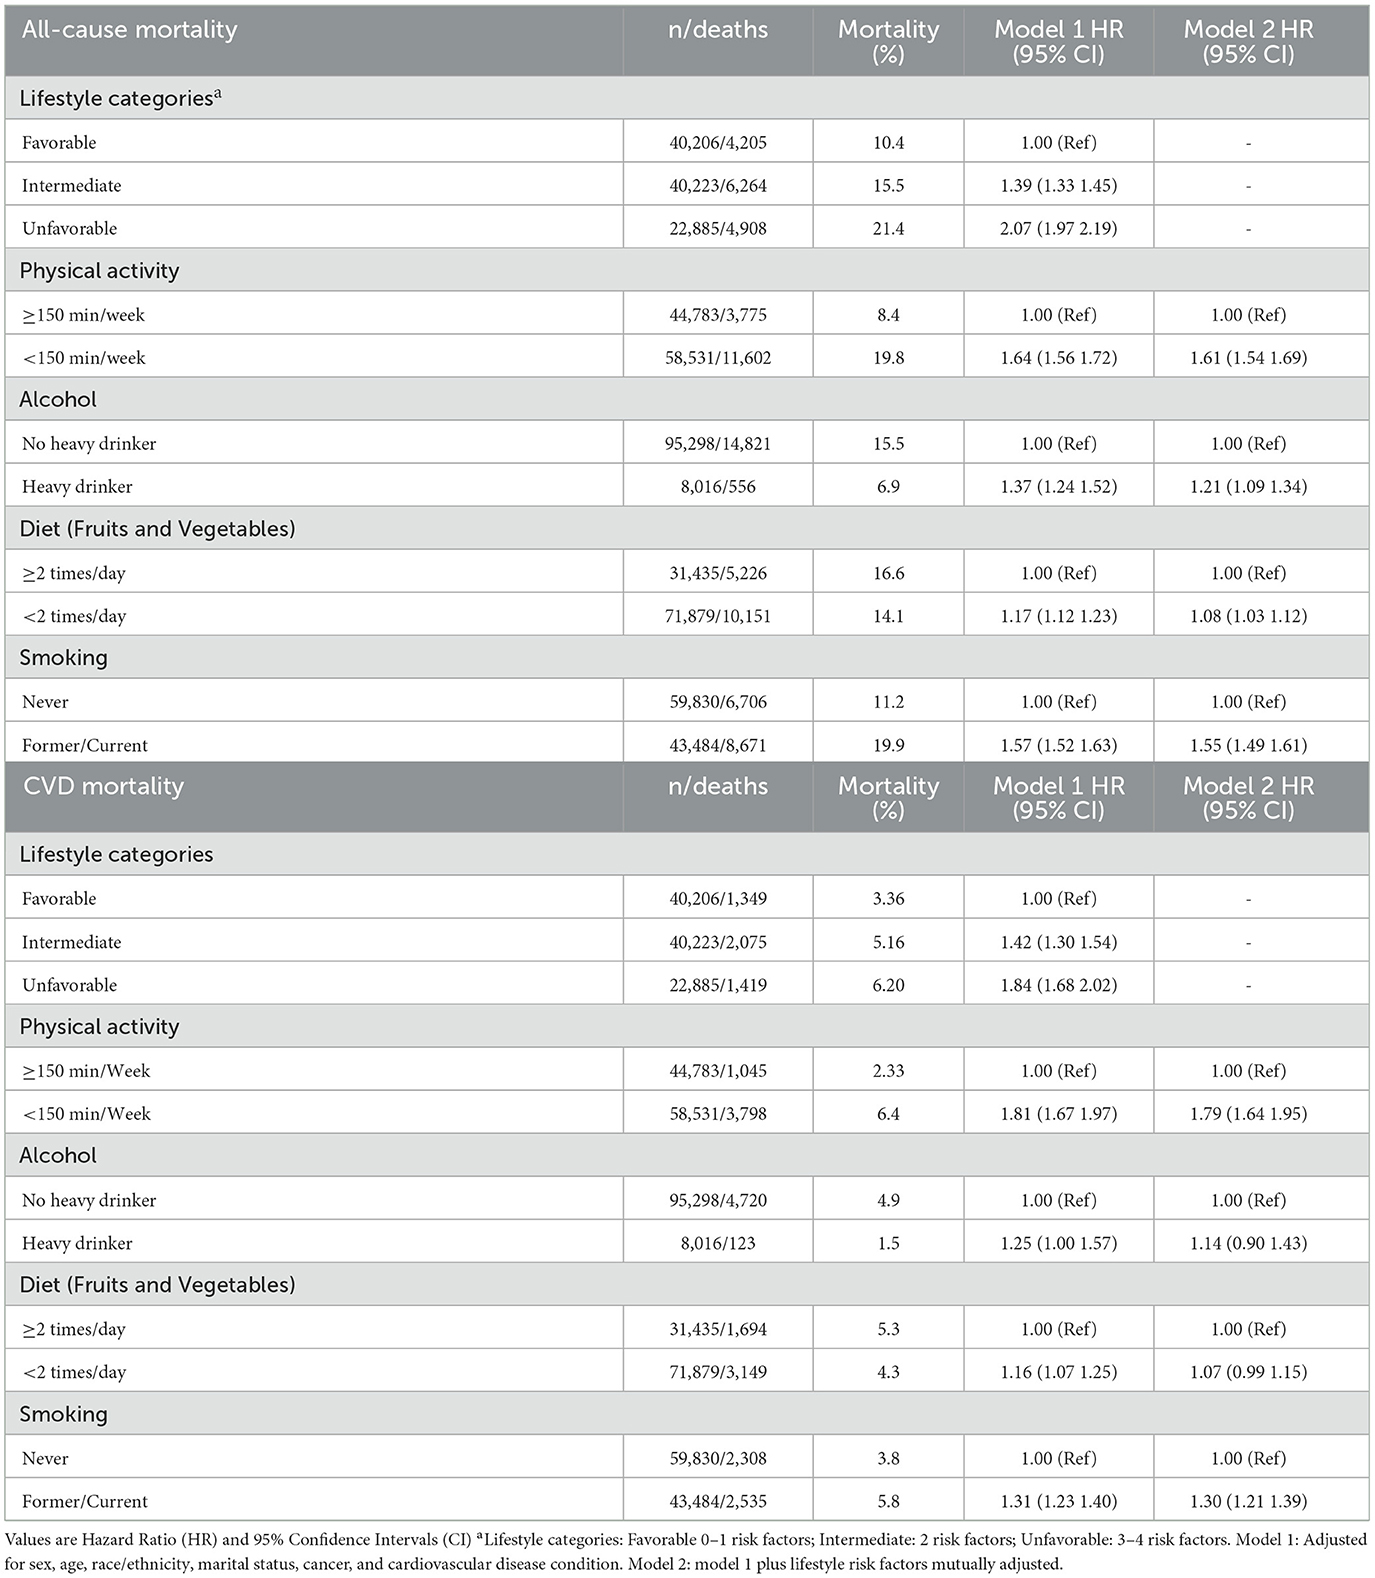
Table 2. Association of lifestyle categories and factors with all-cause and cardiovascular disease (CVD) mortality.
Social and economic disadvantages were associated with increased all-cause and CVD mortality (Table 3). Comparing to participants in the low social and economic disadvantages, those in the medium (HR 1.68; 95% CI 1.60–1.77) and high (HR 2.44; 95% CI 2.30–2.59) category had increased risk of all-cause mortality. Similarly, participants in a medium (HR 1.78; 95% CI 1.59–1.98) and high (HR 2.44; 95% CI 2.16–2.77) groups had a higher risk of CVD mortality compared to those in the low social and economic disadvantages category. Individually, all social and economic disadvantages were associated with increased risks of mortality. For all-cause mortality the HR ranged from 1.17 to 1.71 and for CVD mortality from 1.13 to 1.68 (model 2).

Table 3. Association of social and economic categories and factors with all-cause and cardiovascular disease (CVD) mortality.
Figure 1 presents the associations between lifestyle categories and all-cause and CVD mortality, stratified by social and economic disadvantages. Participants classified in the unfavorable lifestyle category had a higher risk of all-cause and CVD mortality when compared to intermediate and favorable categories in all sub-categories of social and economic disadvantages. However, the increased risk for intermediate and unfavorable lifestyle is very similar in the categories segmented by each social and economic disadvantage. The complete results (model 1 and model 2) of associations between lifestyle categories and all-cause and CVD mortality, stratified by social and economic disadvantages are shown in Supplementary Table S4.
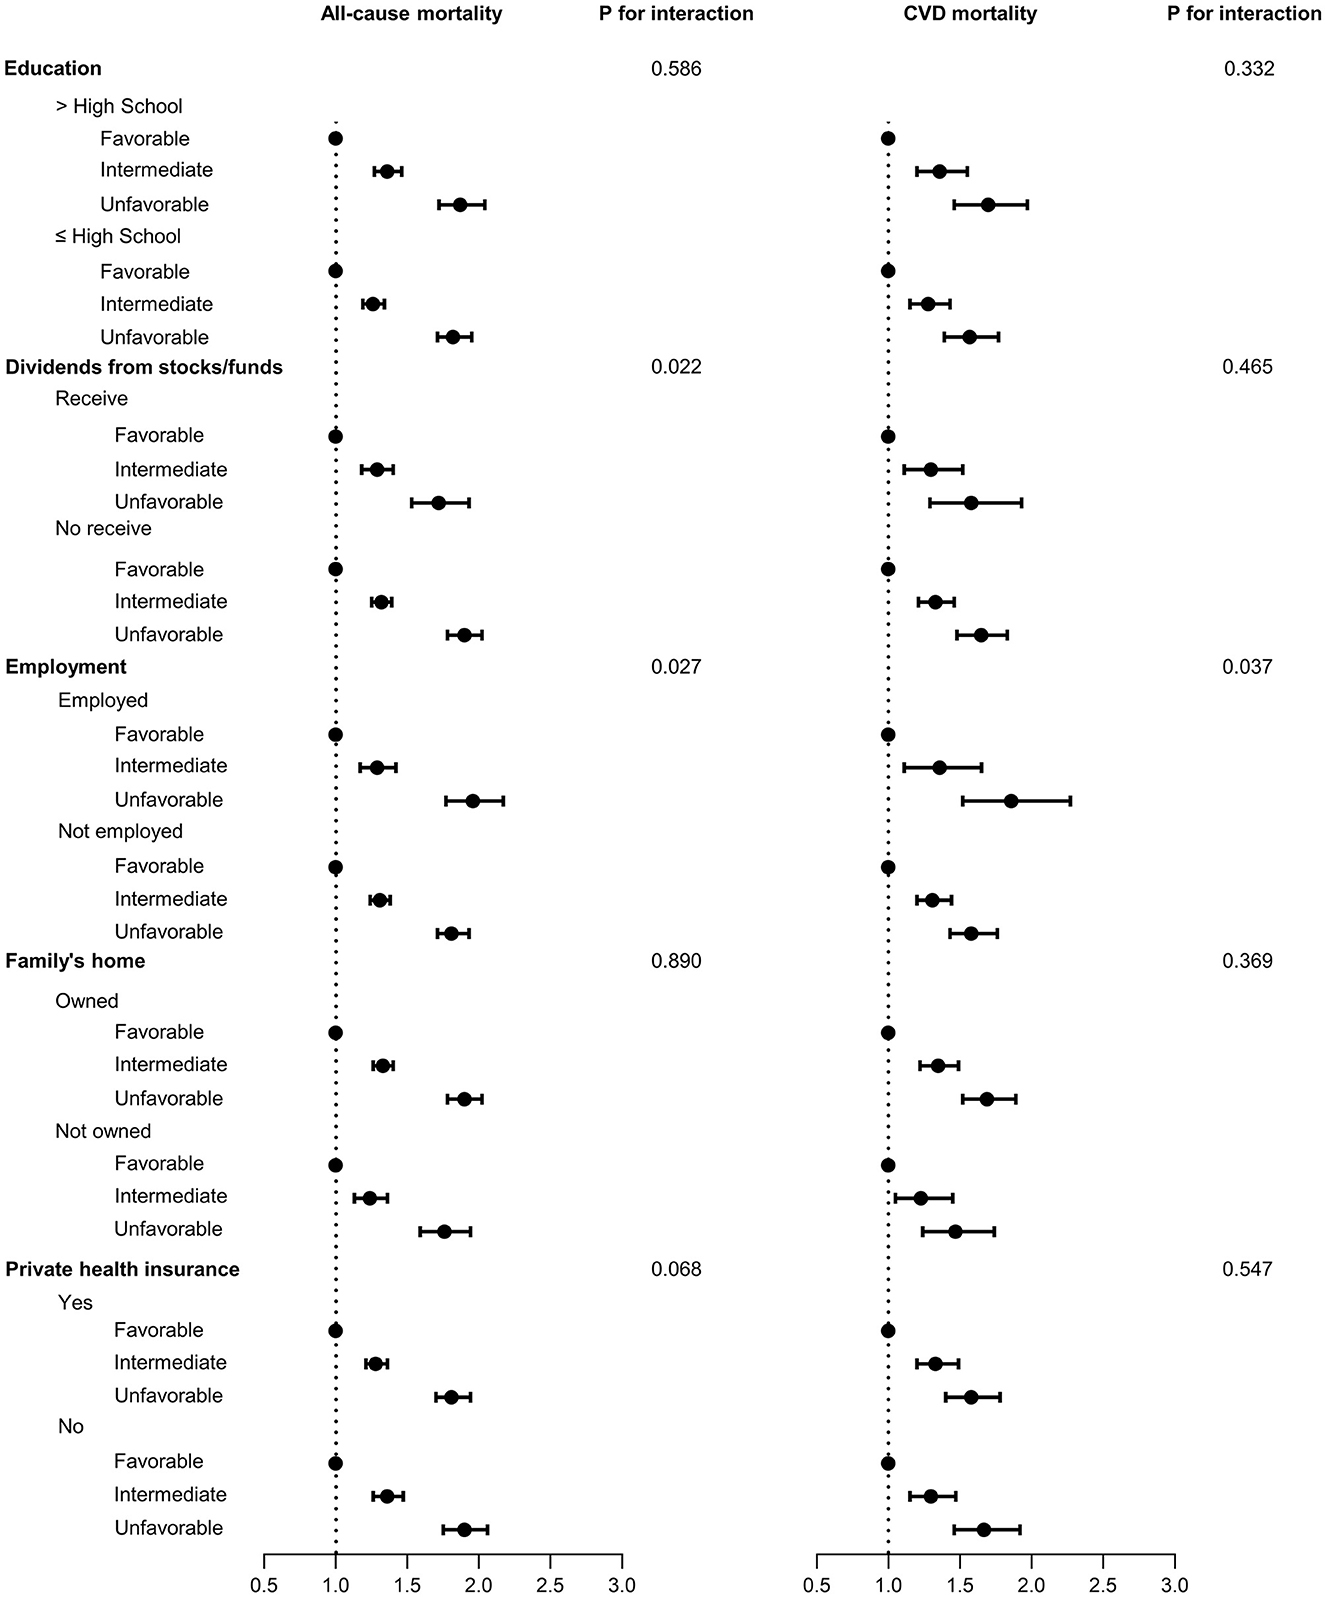
Figure 1. Association of lifestyle categories by social and economic factors with all-cause and cardiovascular disease (CVD) mortality. Lifestyle categories: Favorable 0–1 risk factors; Intermediate: 2 risk factors; Unfavorable: 3–4 risk factors. Model adjusted for sex, age, race/ethnicity, marital status, cancer, cardiovascular disease condition, and social and economic factors mutually adjusted.
Association of social and economic disadvantages categories by lifestyle factors with all-cause and CVD mortality are shown in Figure 2 and Supplementary Table S5. Participants classified in the high social and economic disadvantage category had a higher risk of all-cause and CVD mortality when compared to medium and low categories in all sub-categories of lifestyle factors. In this case, the mortality risk was higher in participants with high social and economic disadvantage category and unhealthy behavior in alcohol, diet, and smoking.
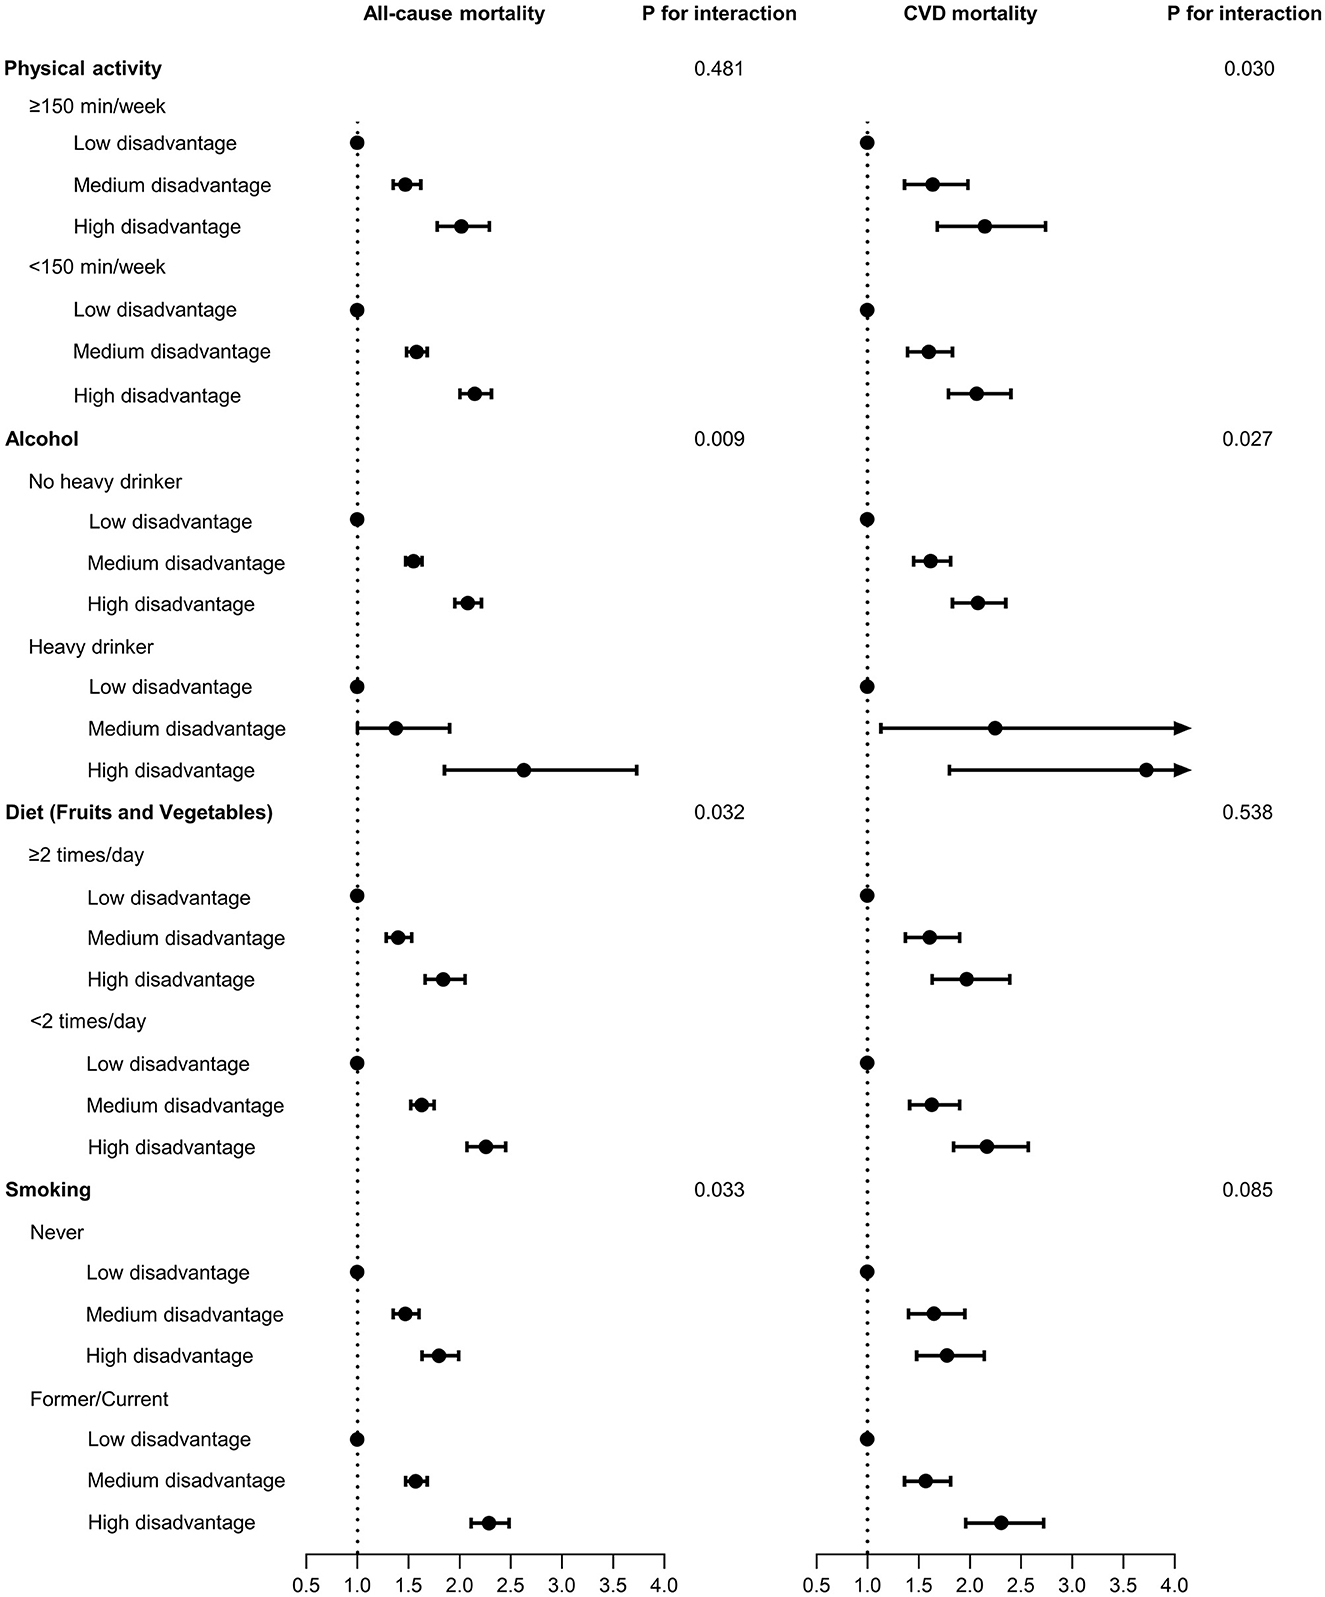
Figure 2. Association of social and economic disadvantages categories by lifestyle factors with all cause and cardiovascular disease (CVD) mortality. Social and economic disadvantage categories: Low: 0–1 disadvantage; Medium: 2–3 disadvantages; High: 4–5 disadvantages. Model adjusted for sex, age, race/ethnicity, marital status, cancer, cardiovascular disease condition, and lifestyle factors mutually adjusted.
The risk of all-cause and CVD mortality increased with greater social and economic disadvantages and unfavorable lifestyle combined (Figure 3). Participants in the high social and economic disadvantage and unfavorable lifestyle shown a greater risk of all-cause (HR 4.06; 95% CI 3.69–4.47) and CVD mortality (HR 3.98; 95% CI 3.31–4.79) (Figure 3; Supplementary Table S6).
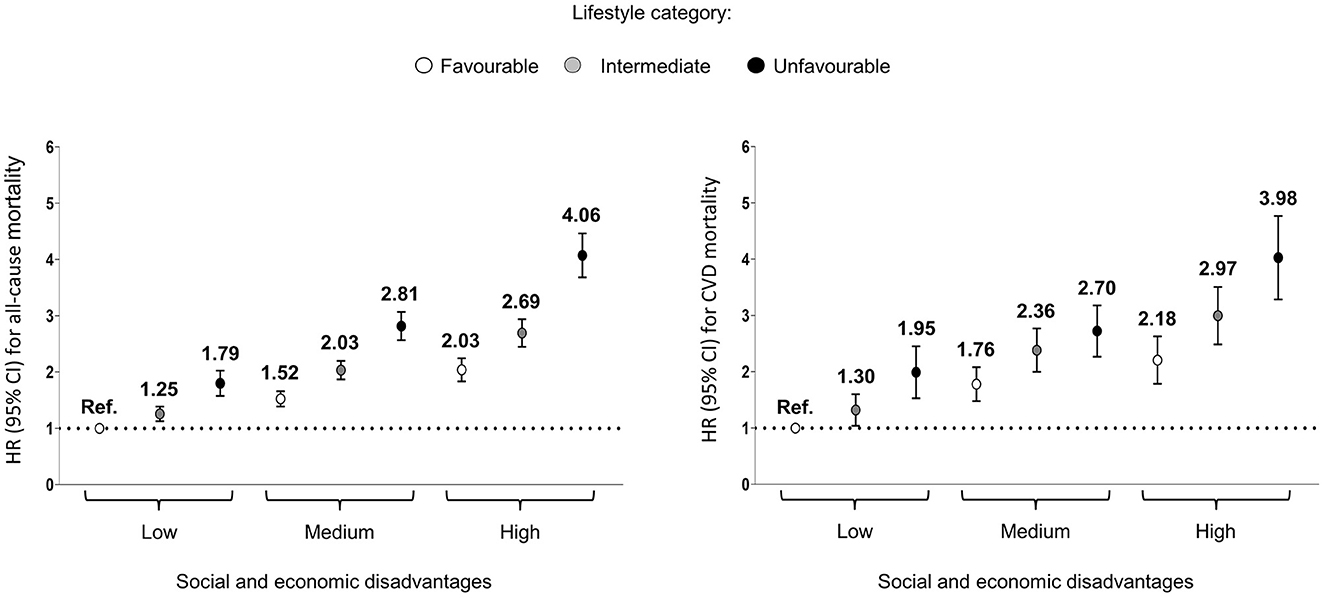
Figure 3. Association of combined lifestyle and social and economic disadvantage categories with risk of all-cause and cardiovascular diseases (CVD) mortality. Values are hazard ratio (HR). Lifestyle categories: Favorable 0–1 risk factors; Intermediate: 2 risk factors; Unfavorable: 3–4 risk factors. Social and economic disadvantage categories: Low: 0–1 disadvantage; Medium: 2–3 disadvantages; High: 4–5 disadvantages. Model adjusted for sex, age, race/ethnicity, marital status, cancer, and cardiovascular disease condition.
All-cause and CVD mortality was directly related to unhealthy lifestyle factors and social and economic disadvantages. Furthermore, the risk of all-cause and CVD mortality increased with greater social and economic disadvantages and unfavorable lifestyle combined. Those in the unfavorable lifestyle category (3–4 lifestyle risk factors) and with high social and economic disadvantages (4–5 social and economic disadvantages) showed an approximately 4-fold higher risk of all-cause and CVD.
Only 9.4% of participants in our study had zero lifestyle risk factors. Previous studies also reported poor adherence to health behaviors; for example, a meta-analysis of 15 prospective studies conducted in the United States, Europe, China, and Japan, between 2004 and 2011, on lifestyle and mortality, found that only a quarter of participants adhered to all lifestyle factors (23). More recently, in a study of 0.9 million individuals from China, only 2.8% met the four health behaviors assessed (2). Therefore, our results confirmed that there is still much room for improvement in healthy behaviors at population level.
In the present study, all lifestyle risk factors were associated with a higher mortality. Specifically, when compared to engaging to the recommended PA level, low PA was associated with almost twice the risk of all-cause and CVD mortality. These results are in line with those of former studies where a strong relationship between low levels of physical activity and mortality risk has been established (24, 25). Similar results were found when considering heavy alcohol consumption as individual risk factor. Although there is constant discussion about possible benefits of moderate alcohol consumption (26), our results reinforce previous evidence that heavy alcohol consumption is indeed harmful (4, 22, 27, 28). In the same sense, our results report that a daily consumption of fruit and vegetables was associated with lower mortality risk, confirming previous results (15, 29, 30). The contribution of vitamins, minerals, antioxidants, and fiber—abundantly present in fruits and vegetables—may explain the reduction in mortality rates. It is also noteworthy that 67%−74% of the participants did not eat at least one time a day fruit and vegetables. Finally, as in previous studies (1, 22), smoking was associated with a higher risk of mortality.
Our findings showed that not complying with any or only one lifestyle factors resulted in a doubled risk of all-cause mortality compared to complying with three or all four lifestyle factors. Several reports also showed an association between adherence to lifestyle scores and mortality (2, 3, 23, 28, 31). Zhang et al. (2) pointed that complying with the four assessed lifestyle factors (non-smoking, none or moderate alcohol use, sufficient leisure time physical activity, and healthy diet) was associated with a 40% reduction of deaths from all causes and a 50% reduction of cardiovascular deaths. Similarly, other evidence suggested that a healthy lifestyle profile may be associated with an increase of around 6–9 years in life expectancy (23, 28, 31). The highest prevalence of unhealthy lifestyle factors was observed among participants with lower educational level, not receiving dividends, not employed, family's home not owned and those who did not have private health insurance. Lower prevalence of healthy lifestyle behaviors in participants with greater social disadvantage has been previously demonstrated (32).
Previous studies reported the association of social and economic factors with health outcomes and mortality (12, 32). Our results showed that participants with lower education level, no receivers of dividends from stocks/funds, not employed, family's home no owned, and no private health insurance had a higher risk of all-cause and CVD mortality, compared to each reference category. Stringhini et al. (12) reported a higher risk of mortality in people with low occupational position, as well as in people with a lower socioeconomic status, compared to people with high occupational position and high socioeconomic status. Bor et al. (13) suggest that the income inequality in the US in 1980–2015 has coincided with widening inequalities in health and longevity. The authors further related that not only do the poor have lower incomes, but also a lower life expectancy. The differences in life expectancy between the wealthiest 1% and poorest 1% were 14.6 years for men and 10.1 years for women. This reinforces and possibly explains our results on the association between social and economic disadvantages and mortality.
Seeking to understand the relationship between social and economic factors and lifestyle, Zhang et al. (3) stated that 12% of the association between socioeconomic status and mortality was explained by lifestyle factors. Petrovic et al. (33) suggested that health behaviors contribute to around 20%−26% of the associations between socioeconomic status and health outcomes. This may be an explanation for finding similar mortality associations in the stratified analyses since lifestyle explains only a limited part of the association between social and economic factors and mortality. Foster et al. (32) investigated associations between lifestyle categories and health outcomes stratified by quintiles of social deprivation in UK population. Similarly to our results, the authors found a higher mortality risk in less healthy lifestyles and for most quintiles of deprivation. However, it is not possible to identify a different risk of mortality for participants in the same lifestyle category, but in different categories of socioeconomic deprivation. This suggests that an unhealthy lifestyle may increase the risk of mortality even in subjects with better socioeconomic conditions. Similar results were found for social and economic disadvantages, advising that these factors can increase the risk of mortality, even for participants with a healthy lifestyle.
About the effect of lifestyle and social and economic factors combined on mortality, our results demonstrated that all-cause and CVD mortality was higher for participants with unfavorable lifestyle and social and economic disadvantages combined, reaching up to four times higher for these participants. Likewise, Foster et al. (32) also demonstrated a higher mortality risk in less healthy lifestyles and higher deprivation combined, mainly in participants with least healthy lifestyle and most deprived category. In this same perspective, Kollia et al. (34), in a study with 10,906 participants from a national and representative study of the English population [English Longitudinal Study of Aging (ELSA)] described those participants with lower household wealth or education, had a less healthy lifestyle. In addition, they found a higher mortality during the follow up among participants with an unhealthy lifestyle (or i.e., smoking and physical inactivity) and combination of low education and low wealth at the same time. Furthermore, it is suggested that populations with greater social vulnerability are more susceptible to the deleterious effects of unhealthy lifestyle.
Thus, our results add to this evidence, reporting how each of the different lifestyle factors and social and economic disadvantages are related to mortality risk, exploring mortality risk associated with lifestyle behaviors according to different social and economic disadvantages and vice versa, as well as the combined effect on mortality risk, using data from a representative cohort of the US population. In addition, our results suggest that intervening on lifestyle factors (i.e., physical activity, heavy alcohol consumption, diet, or smoking) and considering social and economic factors (i.e., education, economic stability, employment, family's home, and health care access) can potentially have positive effects to reduce mortality rates. However, simultaneous changes in health behaviors and social and economic circumstances can have a greater impact on health outcomes and mortality.
A strength of the present study is the use of data from a representative cohort of the US population, as well as the inclusion of different lifestyle indicators, considered both individually and combined as a lifestyle score. Physical activity, alcohol, diet, and smoking were included as modifiable factors, that is, health behaviors. We decided not to include biological variables, such as blood pressure or BMI, because there may be genetic and paradoxical conditions of these factors leading to a mischaracterization of the health profile. In addition, we considered diverse social and economic disadvantages, which represent different domains of social determinants of health, thus strengthening our results.
On the other hand, our study has some limitations. Information was self-reported, so recall or remember bias may have occurred. Moreover, since dietary data is collected each 5 years, we had to restrict our final analytic sample. We used the consumption of fruits and vegetables as an indicator of dietary quality because they were the available data with the highest agreement in the literature, but limiting the evaluation to only these foods could underestimate the quality of the diet. Also, information on other health behaviors such as sleep and time spent in sedentary behavior (i.e., sitting or watching TV) were not available for the selected years. In addition, only private health insurance was considered, and the public health insurance was not considered. Finally, it is important to highlight that when the lifestyle and social and economic variables were classified (0 or 1) and added to build the scores, we assumed that all health behaviors or social and economic disadvantages had an equal weight, which might not be as accurate.
Lifestyle, social, and economic disadvantages are associated with all-cause and CVD mortality. These associations were similar between participants with the same lifestyle category and different social and economic conditions. Therefore, even if there is a greater prevalence of unhealthy lifestyle factors among participants with social and economic disadvantages—and this should be a target population for public health interventions and policies—unhealthy lifestyle increases the risk of mortality even in individuals with better socioeconomic conditions, and social and economic disadvantages increase the risk of mortality in people with a healthy lifestyle. Furthermore, the risk of mortality increases with a greater number of social and economic disadvantages and combined unhealthy lifestyles. Therefore, to reduce mortality rates, socially vulnerable populations must be targeted by interventions that aim to promote lifestyle behaviors and increase socioeconomic equality.
The original contributions presented in the study are included in the article/Supplementary material, further inquiries can be directed to the corresponding author/s.
All NHIS content and procedures were approved by the NCHS Research Ethics Review Board. The studies were conducted in accordance with the local legislation and institutional requirements. All NHIS respondents provided oral consent prior to participation.
MD: Conceptualization, Data curation, Formal analysis, Methodology, Writing—original draft, Writing—review & editing. SP: Data curation, Formal analysis, Writing—review & editing. DM-G: Conceptualization, Data curation, Formal analysis, Supervision, Writing—review & editing. MS: Conceptualization, Data curation, Supervision, Writing—review & editing. FR-A: Conceptualization, Data curation, Methodology, Supervision, Writing—review & editing. VC: Conceptualization, Data curation, Formal analysis, Methodology, Supervision, Writing—review & editing.
The author(s) declare financial support was received for the research, authorship, and/or publication of this article. MD was supported by Predoctoral Training in Health Research contract (FI21/00178) from the Instituto de Salud Carlos III and European Social Fund Investing in your future. DM-G was supported by a Ramon y Cajal contract (RYC-2016–20546). MS was supported by Ramón y Cajal contract (RYC-2018–025069-I) and Instituto de Salud Carlos III, State Secretary of R+D+I of Spain and FEDER/FSE (FIS PI20/00896). VC was supported by the Spanish Ministry of Science, Innovation and Universities (IJC2018–038008-I).
The authors declare that the research was conducted in the absence of any commercial or financial relationships that could be construed as a potential conflict of interest.
All claims expressed in this article are solely those of the authors and do not necessarily represent those of their affiliated organizations, or those of the publisher, the editors and the reviewers. Any product that may be evaluated in this article, or claim that may be made by its manufacturer, is not guaranteed or endorsed by the publisher.
The Supplementary Material for this article can be found online at: https://www.frontiersin.org/articles/10.3389/fpubh.2024.1297060/full#supplementary-material
1. Zhang Y-B, Pan X-F, Chen J, Cao A, Xia L, Zhang Y, et al. Combined lifestyle factors, all-cause mortality and cardiovascular disease: a systematic review and meta-analysis of prospective cohort studies. J Epidemiol Commun Health. (2020) 75:jech-2020–214050. doi: 10.1136/jech-2020-214050
2. Zhang X, Lu J, Wu C, Cui J, Wu Y, Hu A, et al. Healthy lifestyle behaviours and all-cause and cardiovascular mortality among 09 million Chinese adults. Int J Behav Nutr Phys Activ. (2021) 18:162. doi: 10.1186/s12966-021-01234-4
3. Zhang Y-B, Chen C, Pan X-F, Guo J, Li Y, Franco OH, et al. Associations of healthy lifestyle and socioeconomic status with mortality and incident cardiovascular disease: two prospective cohort studies. BMJ. (2021) 373:n604. doi: 10.1136/bmj.n604
4. Rezende LFM, Ferrari G, Lee DH, Aune D, Liao B, Huang W, et al. Lifestyle risk factors and all-cause and cause-specific mortality: assessing the influence of reverse causation in a prospective cohort of 457,021 US adults. Eur J Epidemiol. (2022) 37:11–23. doi: 10.1007/s10654-021-00829-2
5. Graham H, White PCL. Social determinants and lifestyles: integrating environmental and public health perspectives. Public Health. (2016) 141:270–8. doi: 10.1016/j.puhe.2016.09.019
6. U.S. Department of Health and Human Services O of DP and Promotion. Healthy People 2030, U.S. Department of Health and Human Services. (2023).
7. Lloyd-Jones DM, Allen NB, Anderson CAM, Black T, Brewer LC, Foraker RE, et al. Life's essential 8: updating and enhancing the American heart association's construct of cardiovascular health: a presidential advisory from the American heart association. Circulation. (2022) 146:E18–43. doi: 10.1161/CIR.0000000000001078
8. Roger VL, Sidney S, Fairchild AL, Howard VJ, Labarthe DR, Shay CM, et al. Recommendations for cardiovascular health and disease surveillance for 2030 and beyond: a policy statement from the American heart association. Circulation. (2020) 141:756. doi: 10.1161/CIR.0000000000000756
9. Heron M. Deaths: Leading Causes for 2019. Hyattsville, MD: National Vital Statistics Reports. (2021). doi: 10.15620/cdc:104186
10. World Health Organization. Global Health Estimates 2020: Deaths by Cause, Age, Sex, by Country and by Region, 2000–2019. Geneva: WHO (2020).
11. Virani SS, Alonso A, Aparicio HJ, Benjamin EJ, Bittencourt MS, Callaway CW, et al. Heart disease and stroke statistics-−2021 update. Circulation. (2021) 143:e146–e603. doi: 10.1161/CIR.0000000000000950
12. Stringhini S, Carmeli C, Jokela M, Avendaño M, Muennig P, Guida F, et al. Socioeconomic status and the 25 × 25 risk factors as determinants of premature mortality: a multicohort study and meta-analysis of 1·7 million men and women. Lancet. (2017) 389:1229–37.
13. Bor J, Cohen GH, Galea S. Population health in an era of rising income inequality: USA, 1980–2015. Lancet. (2017) 389:1475–90. doi: 10.1016/S0140-6736(17)30571-8
14. Grucza RA, Sher KJ, Kerr WC, Krauss MJ, Lui CK, McDowell YE, et al. Trends in adult alcohol use and binge drinking in the early 21st-century United States: a meta-analysis of 6 national survey series. Alcohol Clin Exp Res. (2018) 42:1939–50. doi: 10.1111/acer.13859
15. Afshin A, Sur PJ, Fay KA, Cornaby L, Ferrara G, Salama JS, et al. Health effects of dietary risks in 195 countries, 1990–2017: a systematic analysis for the Global Burden of Disease Study 2017. Lancet. (2019) 393:1958–72. doi: 10.1016/S0140-6736(19)30041-8
16. Botman S, Moriarity CL. Design and estimation for the National Health Interview Survey, 1995–2004. Vital Health Stat. (2000) 2:1–31.
17. Parsons VL, Moriarity C, Jonas K, Moore TF, Davis KE, Tompkins L. Design and estimation for the national health interview survey, 2006–2015. Vital Health Stat. (2014) 2:1–53.
18. Bull FC, Al-Ansari SS, Biddle S, Borodulin K, Buman MP, Cardon G, et al. World Health Organization 2020 guidelines on physical activity and sedentary behaviour. Br J Sports Med. (2020) 54:1451–62. doi: 10.1136/bjsports-2020-102955
19. National Institute on Alcohol Abuse and Alcoholism (NIHAAA). Drinking levels defined. https://www.niaaa.nih.gov/alcohol-health/overview-alcohol-consumption/moderate-binge-drinking (accessed December 8, 2021).
20. Han Y, Hu Y, Yu C, Guo Y, Pei P, Yang L, et al. Lifestyle, cardiometabolic disease, and multimorbidity in a prospective Chinese study. Eur Heart J. (2021) 42:3374–84. doi: 10.1093/eurheartj/ehab413
21. Costa GAM, Lopes MS, Lopes ACS. Fruit and vegetable consumption across generations of Brazilian primary care users. Nutrition. (2022) 93:111435. doi: 10.1016/j.nut.2021.111435
22. Fisher S, Bennett C, Hennessy D, Finès P, Jessri M, Bader Eddeen A, et al. Comparison of mortality hazard ratios associated with health behaviours in Canada and the United States: a population-based linked health survey study. BMC Public Health. (2022) 22:478. doi: 10.1186/s12889-022-12849-y
23. Loef M, Walach H. The combined effects of healthy lifestyle behaviors on all cause mortality: a systematic review and meta-analysis. Prev Med (Baltim). (2012) 55:163–70. doi: 10.1016/j.ypmed.2012.06.017
24. Arem H, Moore SC, Patel A, Hartge P, Berrington De Gonzalez A, Visvanathan K, et al. Leisure time physical activity and mortality: a detailed pooled analysis of the dose-response relationship. JAMA Intern Med. (2015) 175:959–67. doi: 10.1001/jamainternmed.2015.0533
25. Kraus W, Powell K, Haskell W, Janz K, Campbell W, Jakicic J et al. Physical activity, all-cause and cardiovascular mortality, and cardiovascular disease. Med Sci Sports Exerc. (2019) 51:1270–81. doi: 10.1249/MSS.0000000000001939
26. Schutte R, Smith L, Wannamethee G. Alcohol – The myth of cardiovascular protection. Clin Nutr. (2022) 41:348–55. doi: 10.1016/j.clnu.2021.12.009
27. Ortolá R, García-Esquinas E, López-García E, León-Muñoz LM, Banegas JR, Rodríguez-Artalejo F. Alcohol consumption and all-cause mortality in older adults in Spain: an analysis accounting for the main methodological issues. Addiction. (2019) 114:59–68. doi: 10.1111/add.14402
28. Sakaniwa R, Noguchi M, Imano H, Shirai K, Tamakoshi A, Iso H. Impact of modifiable healthy lifestyle adoption on lifetime gain from middle to older age. Age Ageing. (2022) 51:afac080. doi: 10.1093/ageing/afac080
29. Zurbau A, Au-Yeung F, Blanco Mejia S, Khan TA, Vuksan V, Jovanovski E, et al. Relation of different fruit and vegetable sources with incident cardiovascular outcomes: a systematic review and meta-analysis of prospective cohort studies. J Am Heart Assoc. (2020) 9:e017728. doi: 10.1161/JAHA.120.017728
30. Wang X, Ouyang Y, Liu J, Zhu M, Zhao G, Bao W, et al. Fruit and vegetable consumption and mortality from all causes, cardiovascular disease, and cancer: systematic review and dose-response meta-analysis of prospective cohort studies. BMJ. (2014) 349:g4490–g4490. doi: 10.1136/bmj.g4490
31. Chudasama YV, Khunti K, Gillies CL, Dhalwani NN, Davies MJ, Yates T, et al. Healthy lifestyle and life expectancy in people with multimorbidity in the UK Biobank: a longitudinal cohort study. PLoS Med. (2020) 17:e1003332. doi: 10.1371/journal.pmed.1003332
32. Foster HME, Celis-Morales CA, Nicholl BI, Petermann-Rocha F, Pell JP, Gill JMR, et al. The effect of socioeconomic deprivation on the association between an extended measurement of unhealthy lifestyle factors and health outcomes: a prospective analysis of the UK Biobank cohort. Lancet Public Health. (2018) 3:e576–85. doi: 10.1016/S2468-2667(18)30200-7
33. Petrovic D, de Mestral C, Bochud M, Bartley M, Kivimäki M, Vineis P, et al. The contribution of health behaviors to socioeconomic inequalities in health: a systematic review. Prev Med (Baltim). (2018) 113:15–31. doi: 10.1016/j.ypmed.2018.05.003
34. Kollia N, Caballero FF, Sánchez-Niubó A, Tyrovolas S, Ayuso-Mateos JL, Haro JM, et al. Social determinants, health status and 10-year mortality among 10,906 older adults from the English longitudinal study of aging: the ATHLOS project. BMC Public Health. (2018) 18:1357. doi: 10.1186/s12889-018-6288-6
Keywords: public health, health behavior, epidemiology, cohort studies, socioeconomic status
Citation: Duarte Junior MA, Pintos Carrillo S, Martínez-Gómez D, Sotos Prieto M, Rodríguez-Artalejo F and Cabanas Sánchez V (2024) Lifestyle behaviors, social and economic disadvantages, and all-cause and cardiovascular mortality: results from the US National Health Interview Survey. Front. Public Health 12:1297060. doi: 10.3389/fpubh.2024.1297060
Received: 19 September 2023; Accepted: 31 January 2024;
Published: 28 February 2024.
Edited by:
Cyrille Delpierre, INSERM Public Health, FranceReviewed by:
Carolina Santamaria-Ulloa, University of Costa Rica, Costa RicaCopyright © 2024 Duarte Junior, Pintos Carrillo, Martínez-Gómez, Sotos Prieto, Rodríguez-Artalejo and Cabanas Sánchez. This is an open-access article distributed under the terms of the Creative Commons Attribution License (CC BY). The use, distribution or reproduction in other forums is permitted, provided the original author(s) and the copyright owner(s) are credited and that the original publication in this journal is cited, in accordance with accepted academic practice. No use, distribution or reproduction is permitted which does not comply with these terms.
*Correspondence: Mercedes Sotos Prieto, bWVyY2VkZXMuc290b3NAdWFtLmVz
Disclaimer: All claims expressed in this article are solely those of the authors and do not necessarily represent those of their affiliated organizations, or those of the publisher, the editors and the reviewers. Any product that may be evaluated in this article or claim that may be made by its manufacturer is not guaranteed or endorsed by the publisher.
Research integrity at Frontiers
Learn more about the work of our research integrity team to safeguard the quality of each article we publish.