 Tiziana Falcone
 Simona Del Ferraro
 Vincenzo Molinaro
 Loredana Zollo
 Paolo Lenzuni3
- 1Laboratory of Ergonomics and Physiology, Department of Occupational and Environmental Medicine, Epidemiology and Hygiene, National Institute for Insurance against Accidents at Work (INAIL), Monte Porzio Catone, Italy
- 2Unit of Advanced Robotics and Human-Centred Technologies, Campus Bio-Medico University of Rome, Rome, Italy
- 3Tuscany Regional Research Center, National Institute for Insurance against Accidents at Work (INAIL), Florence, Italy
Introduction: Early identification of hypothermia or hyperthermia is of vital importance, and real-time monitoring of core temperature (CT) of the workers exposed to thermal environments is an extremely valuable tool. From the existing literature studies, the model developed by Buller et al. in their study of 2013 that generates real-time estimates of CT from heart rate (HR) measurements using the Kalman filter (KF) shows good potential for occupational application. However, some aspects could be improved to reliably handle the existing very wide range of workers and work activities. This study presents a real-time CT estimation model, called the Biphasic Kalman filter-based (BKFB) model, based on HR measurement, with characteristics suited to application in the occupational field.
Methods: Thirteen healthy subjects (six female and seven male) were included in the study to perform three consecutive tasks simulating work activities. During each test, an ingestible CT sensor was used to measure CT and a HR sensor to measure HR. The KF methodology was used to develop the BKFB model.
Results: An algorithm with a biphasic structure was developed using two different models for the increasing and decreasing phases of CT, with the ability to switch between the two based on an HR threshold. CT estimates were compared with CT measurements, and with respect to overall root mean square error (RMSE), the BKFB model achieved a sizeable reduction (0.28 ± 0.12°C) compared to the Buller et al. model (0.34 ± 0.16°C).
Discussion: The BKFB model introduced some modifications over the Buller et al. model for a more effective application in the occupational field. It was developed using data collected from a sample of workers (heavily weighted toward middle-aged, not very fit, and with a considerable fraction of female workers), and it also included two different modeling of CT (for the up- and down-phases), which allowed for better behavioral modeling in the two different stages. The BKFB model provides CT estimates reasonably in comparison to the measured intra-abdominal temperature values in both the activity and recovery phases but is more practical and easier to use for a real-time monitoring system of the workers' thermal states.
1 Introduction
There are several occupational sectors (e.g., construction and agriculture) where specific combinations of environmental thermal conditions, clothing, and metabolic activity may induce a potentially critical thermal strain for the worker, for example, those occurring in recent years due to the effects of climate change. Some of the strategies that generally can be deployed involve work organizations (1, 2), technical interventions, and the use of innovative technologies (usually wearable devices); the latter strategy attempts to mitigate the effect of exposure to thermal environments (3–6) and/or to provide real-time thermophysiological monitoring of the worker. This monitoring can be accomplished through a sensorized wearable device designed ad hoc, which may allow, for example, the monitoring of the worker's thermal state in order to prevent the onset of any hypothermic or hyperthermic conditions and to alert the worker when necessary. The physiological parameter that is generally used as the indicator of human thermal state is the core body temperature (CT), i.e., the temperature of the deep tissues of the human body core (7). A wide range of methods, including the measurement of rectal, esophageal, intra-abdominal, sublingual, tympanic membrane, external auditory canal, and urine temperature [all of which are discussed in ISO 9886:2004 (8)], are available to record a “direct” estimate of CT. These methods are more typically used in the clinical field or in laboratory studies and appear impractical for continuous monitoring of CT in workplaces due to different reasons related to the invasive nature of the measurement, worker safety, possible interference with the work activity and any personal protective equipment (PPE), and non-acceptance by workers. A potentially more practical alternative is to get an “indirect” estimate of CT using one or more correlated physiological parameters that can be measured without introducing appreciable discomfort for the worker. There are two main approaches available to estimate CT indirectly: the first is based on thermoregulation models, and the second involves the use of data-driven models.
Thermophysiological models are typically more complex because they include several equations that simulate the behavior of the various functions of the human thermoregulation system. Several models have been developed, with different degrees of complexity depending on how many body segments and nodes are considered in the model (9). These include one-node models (10, 11) that simulate the human body as a single unit, two-node models (12–15) that consider the human body to consist of two shells (i.e., core and skin), multi-node models (16–18) that assume a multilayer structure of the human body, and multi-element models (19–22) that simulate different parts of the human body with their different geometric properties, but without considering the uniform temperatures of the nodes. These models are typically employed in laboratory studies, sometimes in combination with thermal manikins (23–25). Thermophysiological models typically necessitate various input variables that must be known in advance, difficult to acquire by a wearable device, and potentially less suitable to be used in real-time mode, due to the complexity of their management.
The alternative strategy for estimating CT is to employ data-driven models (26). These models rely on the exploration of relationships between the inputs and outputs of a system without direct knowledge of its physiological behavior. Using regression algorithms, these models enable the estimation of the value of a variable that is not directly observable from the measurement of one or more directly observable variables. Data-driven models are more suitable than thermoregulation models for real-time monitoring of CT in workplaces because they require less complex mathematical operations and fewer input variables (and, consequently, fewer sensors are worn by the worker, which, in turn, generates less discomfort).
A previous systematic review (27) identified several data-driven models for estimating CT in real-time but only few of these models appeared suitable for integration in a wearable device such as those based on heat flux (28, 29), skin temperatures (30), heart rate (HR) (31–34), or a combination of these (35–38). Among these parameters, HR seems to be a good compromise between being the most suitable for monitoring and application in occupational contexts (its measurement does not interfere with work activities or the presence of PPE), correlating with CT, easy to measure (using a non-invasive sensor) and accepted by workers. Buller et al. (31) developed a model that requires only continuous monitoring of HR and employs a simple but very powerful mathematical method, i.e., the Kalman filter (KF) (39, 40), to calculate the step-by-step time evolution of CT. The model has been updated over time. Different functional forms have been explored, starting with a linear function for the observational model (41), evolving first to a quadratic function (31) and finally to a sigmoidal functional form (42, 43). The original model has been tested by Buller et al. (31, 32) in a variety of settings with regard to the environment, activity performed, acclimatization, hydration, and clothing. Estimates of CT show good overall agreement with measurements (31, 32), although they appear to underestimate CT for low work rates (31, 34) and overestimate CT for very high work rates (31). The model also seems to provide better predictions during the activity phase with respect to the recovery phase (44), and this is likely due to the fact that it is based on a single relationship that correlates HR with CT, whereas the latter has an inherent hysteretic nature and can follow two separate behaviors during the warm-up and cool-down phases. One challenge associated with the use of this method is that it requires an initial (t = 0) CT value. Buller et al. (32) attempted to overcome this issue by comparing the Buller et al. model (31) performance outcomes obtained using the subjects' initially measured CT values vs. those obtained using the initial CT value set at 37.1°C for all participants. The results of this study revealed that the higher accuracy provided by the initial measured CT values was reduced within approximately 30 min.
In general, it is difficult to extend the findings from Buller et al.'s study (31) to the worker population, because most of the participants in the study were young, athletic, and male soldiers, while a large part of the workers are less young (45) and not fit, with a considerable fraction of women as well. It is well recognized that subjective factors, such as gender, as well as anthropometry, age, and fitness, may have an impact on the thermoregulation system response (46, 47); therefore, obtaining an estimation CT model calibrated to the real working population is crucial. Overall, while the method proposed by Buller et al. (31) provides an unquestionably significant advancement in CT estimation methods, there is still potential for improvement, especially in terms of the adaptation for use in the occupational field. In this context, the present study intends to contribute to the real time CT estimation modeling, developing an algorithm based on two different models (biphasic model). The algorithm is specifically designed in an attempt to provide a more accurate modeling of the CT up- and down-phases, with the ability to switch between the two phases automatically, and obtained by data collected from a population of workers (both male and female participants) during simulations of a sequence of work activities. The biphasic model developed was based on the application of the KF to HR data, which make the model implementable in a sensorized wearable device that is suitable to be used in workplaces.
2 Materials and methods
2.1 Participants
Thirteen healthy participants (six female and seven male) were included in the study, whose mean (m) ± 1 standard deviation (SD) of the descriptive characteristics are summarized in Table 1. The participants were recruited among the employees of the National Institute for Insurance against Accidents at Work (INAIL), Research Center of Monte Porzio Catone, Italy. Participants who do not have a history of metabolic, cardiovascular, pulmonary, musculoskeletal, and gastrointestinal diseases were selected for the study. All participants gave their written informed consent, and the study was conducted according to the Declaration of Helsinki and approved by the local ethics committee (protocol number 0078009/2021).
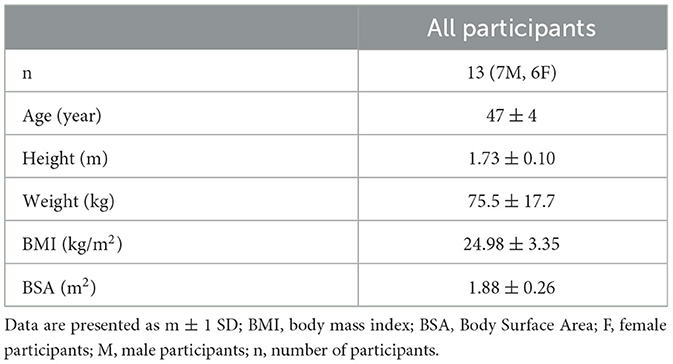
Table 1. Average descriptive characteristics of the participants.
2.2 Experimental protocol
Participants were asked to abstain from smoking, drinking alcohol or coffee, and performing heavy exercise in the 24 h prior to the test. For each participant, a training section was scheduled during the days before the test, and instructions about swallowing the ingestible core body temperature sensor 3 h before arriving at the laboratory were given. Participants, each on a different scheduled test day, arrived at the laboratory at the same time in the morning in order to rule out the effects of circadian rhythms. They wore a t-shirt, shorts, and athletic shoes and were asked to abstain from drinking throughout the duration of the experiment. The height and weight of participants were collected using a professional height rod (Height Rod 5003, Soehnle Industrial Solutions, Germany) and a digital scale (Seca supra 719, Seca, USA), respectively. An ingestible core body temperature sensor (CorTemp Monitoring System, HQ Inc., Palmetto, FL, accuracy ± 0.1°C) was used to measure CT values every 15 s that were wirelessly transmitted to a data recorder worn by the participant at the waist level. Participants were instrumented by a heart rate sensor (Polar Electro, Finland, accuracy ± 1%) positioned at the chest using a band to measure HR data and connected with a wearable metabolic system (K4b2, Cosmed, Italy), which recorded cardiorespiratory data breath by breath. Before the tests, participants remained seated in a room in a thermoneutral environment (ta = 23°C), allowing CT and HR to settle at the respective resting values. Once resting values were reached, participants were asked to enter the climate chamber (INAIL, Monte Porzio Catone, Italy) with an air temperature (ta) of 32°C, a relative humidity (RH) of 40%, and an air velocity (va) of 0.3 m/s and perform the following three consecutive tasks (with a total duration of 24 min, without pause between tasks):
• Task 1 (T1): going up and down from a three-step work ladder for 6 min with a repetition frequency of 28 actions per minute (14 ascents and 14 descents);
• Task 2 (T2): lifting a 5-kg plastic crate from the ground to a standing position and returning it to the ground, for 6 min with a repetition frequency of 12 lifts per minute;
• Task 3 (T3): walking on a treadmill for 12 min at a speed of 5 km/h.
For each task, a metronome imposed the rhythm at the repetition frequency selected for the task.
After completing the tasks, participants were asked to leave the climatic chamber and sit in the room at ta = 23°C to allow the parameters to reach the resting values.
2.3 Data analysis and signal processing
Data were processed using MATLAB software (version R2021a, MathWorks, Natick, MA, US).
HR and CT signals were synchronized. Any few missing CT data were reconstructed with estimates extrapolated from autoregressive fits of the remaining samples. The noise from the two signals was minimized by applying a smoothing, which uses an outlier non-influenced linear polynomial regression weight function between five neighboring data points. This method attributes a weight of zero to data outside six mean absolute deviations, excluding outliers from the smooth calculation. Both signals were averaged over consecutive time windows of 30 s.
2.4 Biphasic Kalman filter-based model
A model, called Biphasic Kalman filter-based (BKFB), was developed to estimate CT from HR independently during the up- and down-phases. The KF method was applied to develop the two analytical relations to model the up- and down-phases (39, 40):
• For the up-phase, the analytical relation was derived from the dataset that contained the data from all the 24 min of the activity phase that included T1, T2, and T3;
• For the down-phase, the analytical relation was obtained from the dataset that comprised data from the 19 min of the recovery period immediately following the activity phase.
As required by the KF methodology (39, 40), two sets of equations were implemented for each of the previous two phases corresponding to the time update and the measurement update. Two linear equations were derived for the time update by applying a linear regression between the CT values measured at time t and those measured at time t-1. The process noise (u) of the estimates was assumed to be a normal probability distribution [u~N(0, γ2)], and γ was calculated as the SD of the normal probability distribution of the ΔCT(CTt−CTt−1) on the time windows of 30 s. For the measurement update, 2 second-degree polynomial fits were derived employing the regression method and applied to the HR and CT data, the latter binned every 0.1°C, meaning that discretization with 0.1°C steps has been applied to the CT data in the CT–HR plane. This step implies that different HR values may correspond to the same detected CT value, and in order to obtain a univocal correspondence between CT and HR values, the HR values were averaged. The squared sum of error (SSE) weighted by the square of the uncertainty of each bin was minimized in the regression to yield the optimal estimation coefficients. The measurement noise (v) was assumed as a normal probability distribution [v~N(0, σ2)], and σ was computed as the mean of the SD of the HR values of each CT bin.
The BKFB model selects one of the two phases (either up or down) switching between them according to the following criteria: when at least three consecutive HR measurements exceed a given threshold, the model runs in the up-phase; when at least three consecutive HR values fall below the threshold, it runs in the down phase. The choice of the value to be assumed as the threshold was addressed by exploring different values, ranging from a minimum of 100 bpm to a maximum of 120 bpm with a step of 5 bpm, and looking for the one that minimized the total SSE, calculated as the sum of the SSE of all subjects over time. The analysis revealed that the optimal transition threshold was 115 bpm, and this value was assumed as the switching threshold. At the beginning of the estimation, this switching criterion requires three consecutive HR measurements and thus results in an initial three-sample lag. The initial CT value required by the model to derive the subsequent CT estimates was fixed at 37.43°C and was computed by averaging the CT data collected from all participants during 3 min of rest before the activity phase. The initial variance value (v0) required for estimating the variance over time was set to 0.
2.5 Performance evaluation
The root mean square error (RMSE) was computed to quantify the agreement between the measured and estimated values of CT.
2.6 Statistical analysis
The statistical analysis was performed using MATLAB software (version R2021a, MathWorks, Natick, MA, US).
The normality of the data was tested using the Kolmogorov-Smirnov test.
The Mann-Whitney U test was applied to detect statistical differences in the RMSE values between the BKFB model and the Buller et al. model (32) (inter-model analysis) and to compare the performance of the two models both by subject and overall (considering all subjects), with the statistical significance level set at a p-value of < 0.05.
3 Results
The results obtained in this study were presented first showing the time trends of the average measured data for CT and HR, then outlining the equations developed for the BKFB model, and finally exhibiting the comparison between the time trend of measured and estimated CT data [the latter by applying the Buller et al. (32) and the BKFB models] with corresponding performance outcomes.
3.1 Measured HR and CT
Figure 1 shows the time trend of the m and SD of the HR values measured during the activity phase (T1, T2, and T3) and the recovery phase for all 13 tested subjects.
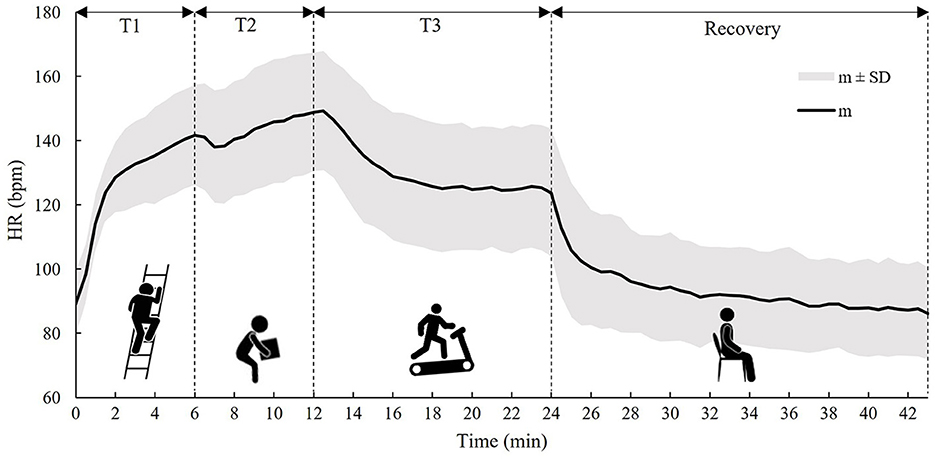
Figure 1. The time trend of the m ± 1 SD of the HR calculated on all subjects during the three tasks (T1, T2, and T3) and the recovery phase.
In Figure 1, it can be observed that HR starts to increase immediately with the onset of T1 and continues to increase in T2, while, with the onset of T3, HR starts to decrease and then stabilizes around the 6th min due to the lower metabolic activity compared to T2. In the recovery phase, an exponential trend toward pre-activity conditions was observed.
Figure 2 shows the time trend of m and SD of CT values measured by the ingestible core body temperature sensor during the activity phases (T1, T2, and T3) and the recovery phase for all 13 tested subjects.
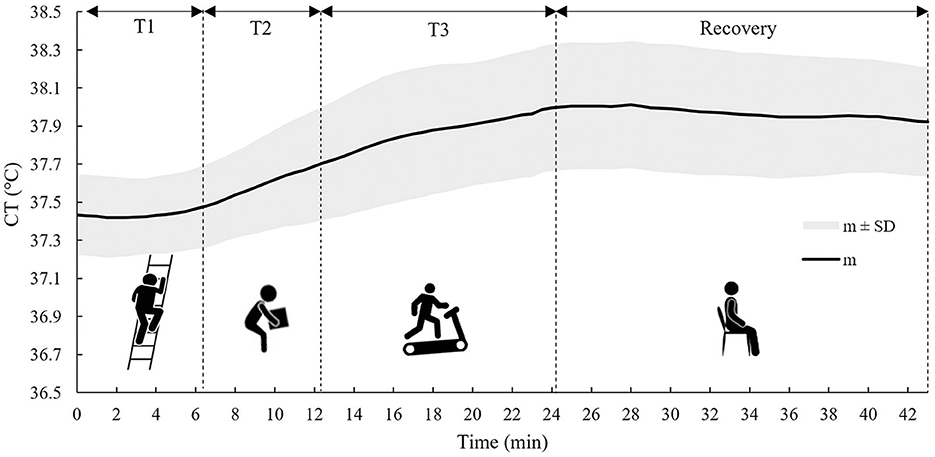
Figure 2. The time trend of the m ± 1 SD of the CT calculated on all subjects during the three tasks (T1, T2, and T3) and the recovery phase.
As can be noticed from Figure 2, CT showed a much slower response compared to HR; in fact, CT time course was approximately steady during T1, and it only started to increase in T2. In T3, it increased over time and then stabilized during the recovery phase, showing a very gradual decline.
3.2 Biphasic Kalman filter-based model
In both the up- and down-phases of the model, the same equation was obtained for the CT time update and is as follows (Eq. 1):
The regression coefficients were 0.9997 (determination coefficient, R2 = 1.00) and 1.0001 (R2 = 1.00) for the up- and down-phases of the model, respectively, and were then approximated to 1 for both phases.
For the up-phase of the model, γ was 0.016, while for the down-phase of the model, γ was 0.011. The two measurement update models of both the up- and down-phases, with the corresponding datasets from which the model was developed, are shown in Figure 3. The two graphs also include m and SD of HR values corresponding to each CT bin of 0.1°C.

Figure 3. The BKFB model: (A) The up-phase measurement update model with the corresponding datasets and m ± 1 SD of HR values corresponding to each CT bin of 0.1°C; (B) The down-phase measurement update model with the corresponding datasets and m ± 1 SD of HR values corresponding to each CT bin of 0.1°C.
The regression equation obtained for the up-phase measurement update model is given as follows (Eq. 2):
The respective R2 value was 0.46, while the regression equation for the down-phase measurement update model is as follows (Eq. 3):
The R2 value was 0.72.
For the up-phase, σ was 14.081, while for the down-phase, it was 8.692.
3.3 Measured vs. estimated core temperatures
CT estimates obtained by using the BKFB model were compared with the CT data measured with the ingestible core body temperature sensor and the CT estimates obtained by the Buller et al. model (32) on the same dataset, where the latter implemented a monophasic quadratic function and used 37.1°C as the initial CT value (t = 0). The comparisons were performed both by subject and considering all subjects (overall).
3.3.1 Comparisons by subject
Figures 4, 5 show, for each tested subject, the time trend of the CT as follows: (a) measured by using the ingestible core body temperature sensor; (b) estimated by the BKFB model; and (c) estimated by the Buller et al. model (32).
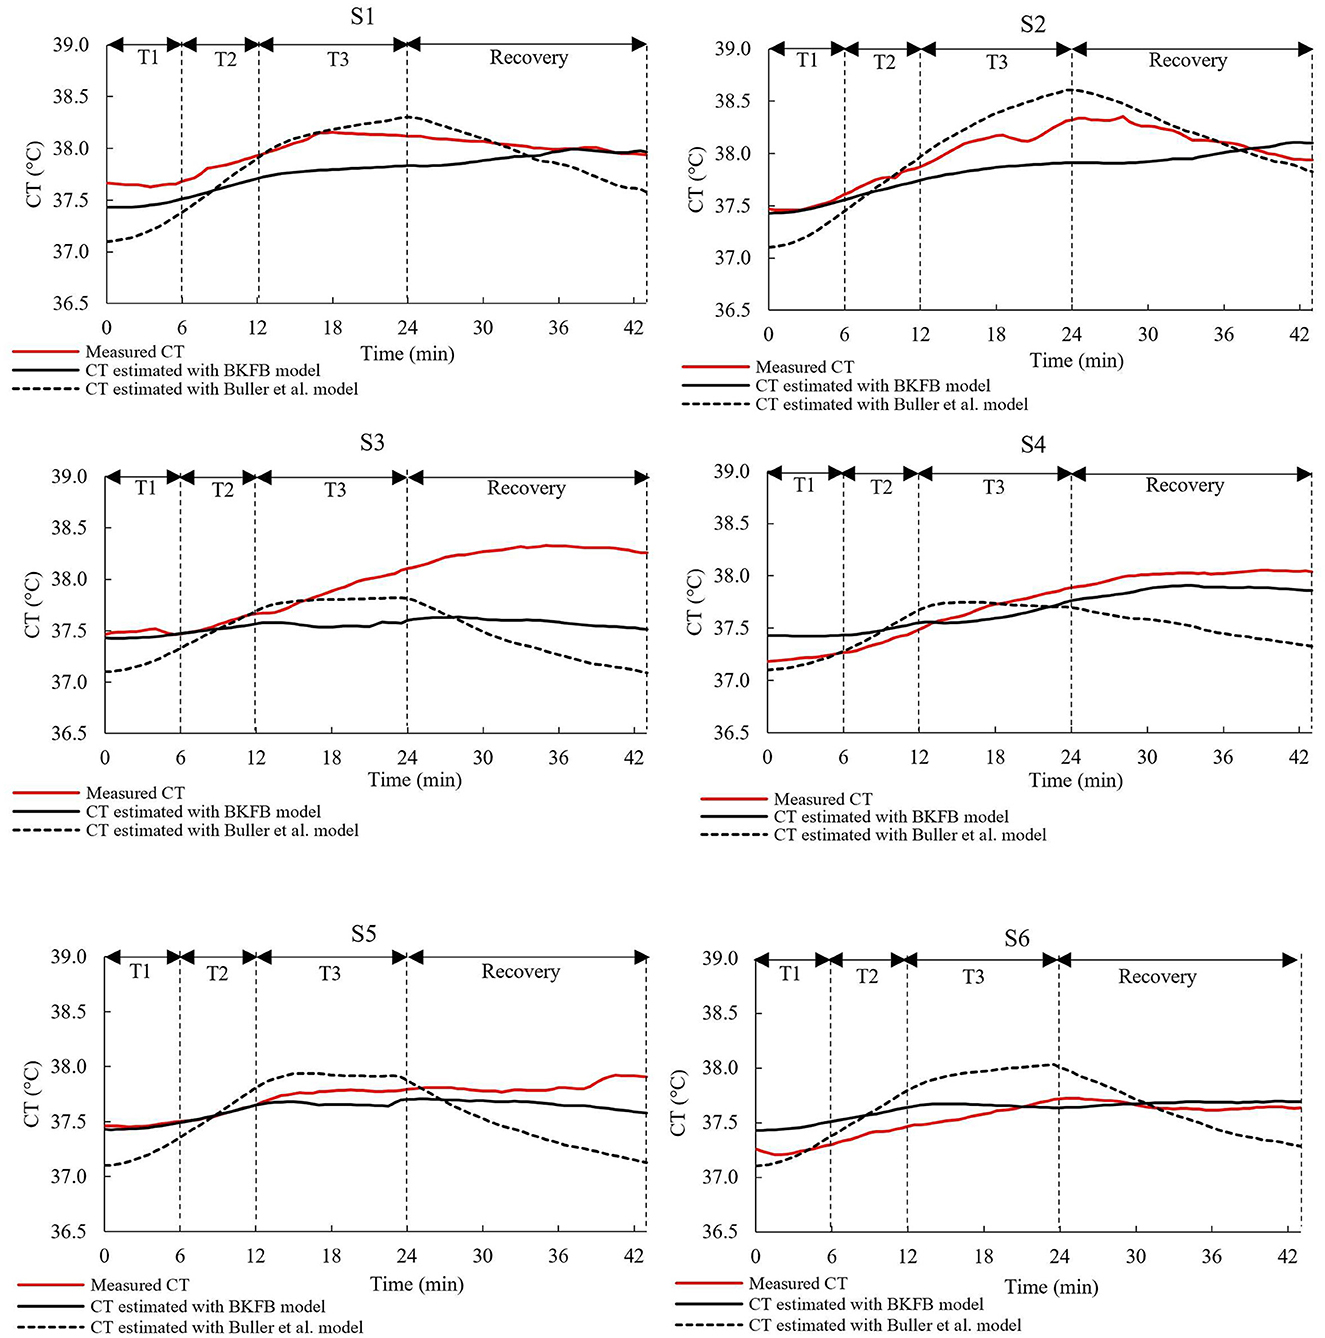
Figure 4. The time trends of the measured CT, the CT estimated by the BKFB model, and the CT estimated by the Buller et al. (32) model for subjects 1 to 6.
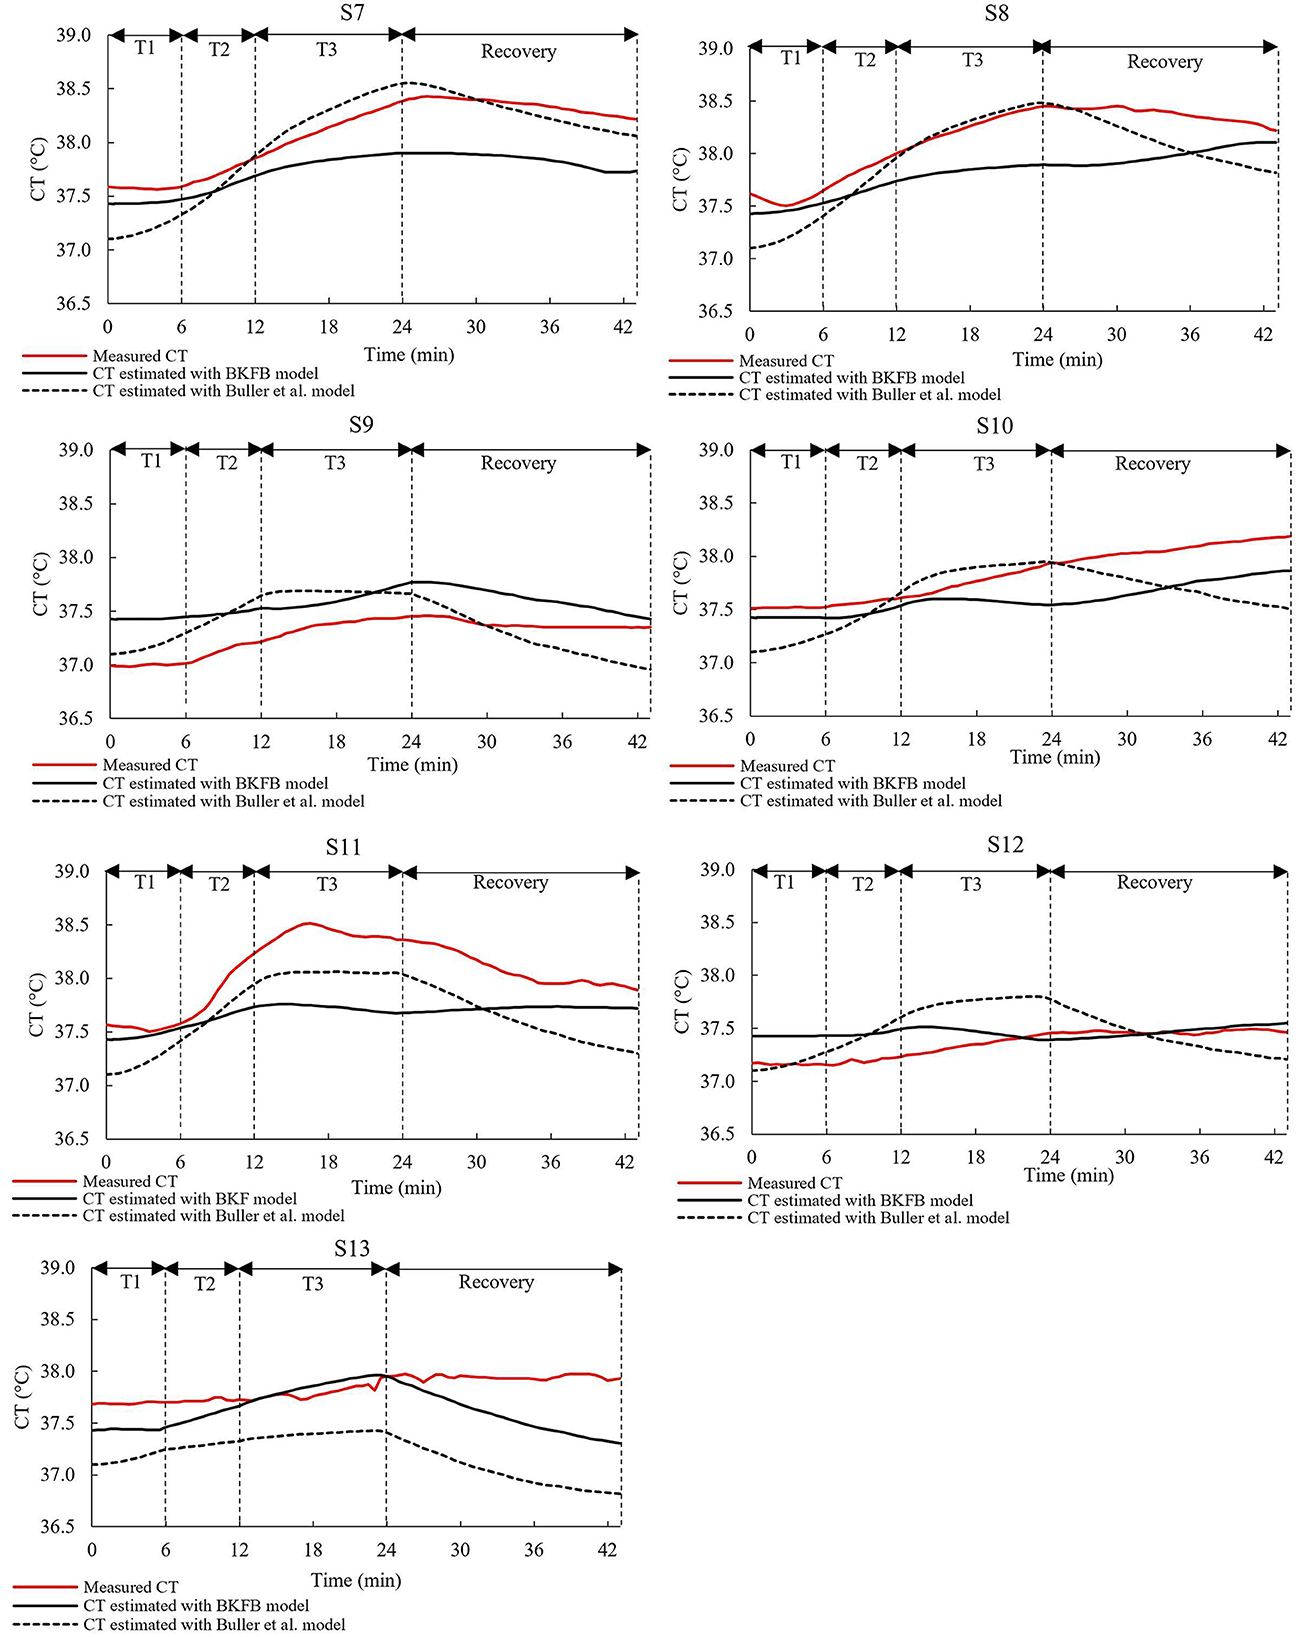
Figure 5. The time trends of the measured CT, the CT estimated by the BKFB model, and the CT estimated by the Buller et al. (32) model for subjects 7 to 13.
From the graphs in the two panels (Figures 4, 5), it can be observed that the BKFB model estimates CT time trend reasonably well for most subjects, following their CT behaviors over time. In 10 cases (S1, S2, S3, S4, S5, S7, S8, S10, S11, and S13), the BKFB model seemed to slightly underestimate the time trend of the corresponding measured CT for the majority of the time, while in three cases, the model seemed to slightly overestimate it (S6, S9, and S12) for most of the time. To quantify the subject-by-subject agreement between measured CT values and those estimated by the BKFB model and the Buller et al. model (32), the RMSE values were calculated over the entire duration of the test (RMSEtotal) and for the activity phase (RMSEactivity) and the recovery phase (RMSErecovery) and are listed in Table 2.
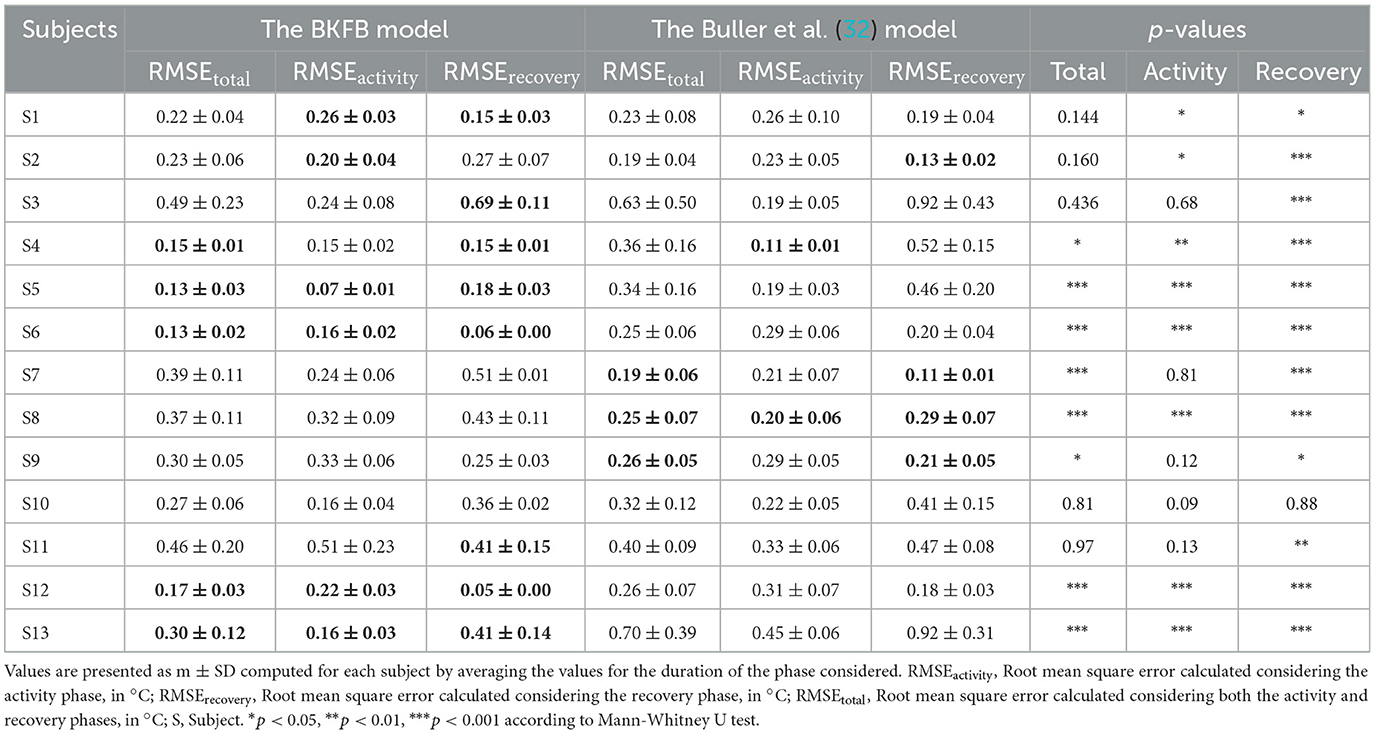
Table 2. RMSE and p-values calculated for subject-by-subject.
Based on the RMSE values reported in Table 2, three classes of agreement between the measured CT values and those estimated by models were assumed: high agreement with RMSEtotal ≤ 0.30°C, moderate agreement with 0.30°C <RMSEtotal <0.40°C, and poor agreement with RMSEtotal ≥ 0.40°C. With this assumption, an intra-model comparison revealed that the BKFB model showed 9 out of 13 subjects in high agreement, two (S7 and S8) in moderate agreement, and two (S3 and S11) in poor agreement, while the Buller et al. model (32) showed seven subjects in high agreement, three (S4, S5, and S10) in moderate agreement, and three (S3, S11, and S13) in poor agreement.
Table 2 shows the statistically significant differences in the RMSE values between the BKFB model and the Buller et al. model (32), by subject, for the three phases considered. Among the significant differences detected, the lowest RMSE value between the two models is highlighted in bold in Table 2. According to an inter-model comparison based on these values, the BKFB model obtained five out of eight (statistically significant) lowest RMSE values for the total phase [three out of eight for the Buller et al. model (32)], six out of eight for the activity phase [two out of eight for the Buller et al. model (32)], and eight out of twelve for the recovery phase [four out of twelve for the Buller et al. model (32)] showing progress associated with the BKFB model.
3.3.2 Comparisons considering all subjects
Figure 6 shows the time trend of the mean values (all subjects) of the measured and estimated CT [by both BKFB and Buller et al. (32) models].
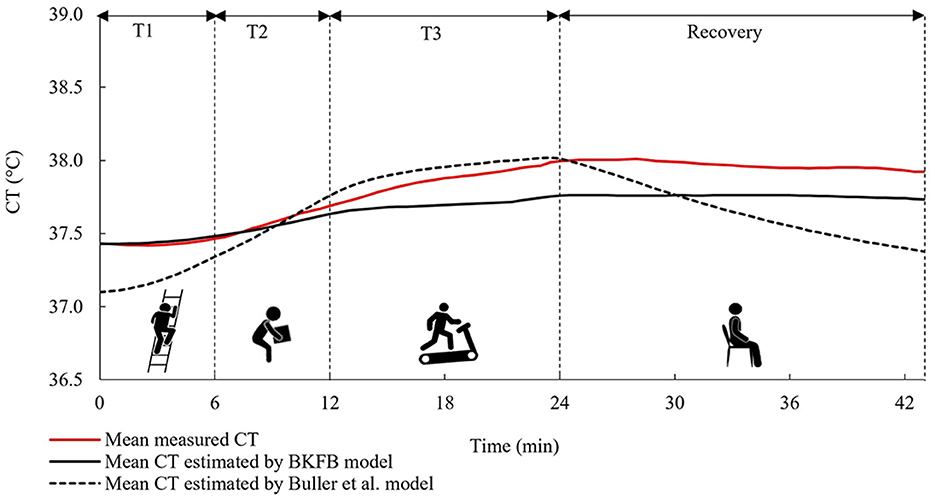
Figure 6. The time trends of the mean measured CT, the mean CT estimated by the BKFB model, and the mean CT estimated by the Buller et al. (32) model considering all subjects.
The mean trend obtained by the BKFB model showed similar behavior to the mean trend of measured CT in all the phases monitored, remaining below it from around the middle of T2.
The overall agreement between the measured and estimated values of CT [by both BKFB and Buller et al. (32) models] was also quantified using the overall RMSE values, which were calculated by averaging the RMSE over all tested subjects (Table 3). Three different overall RMSE values were calculated by taking averages, namely, (a) over the entire duration of the test (Overall RMSEtotal); (b) over the activity phase only (Overall RMSEactivity); and (c) over the recovery phase only (Overall RMSErecovery), and the inter-model differences were tested by the Mann-Whitney U test, as shown in Table 3.
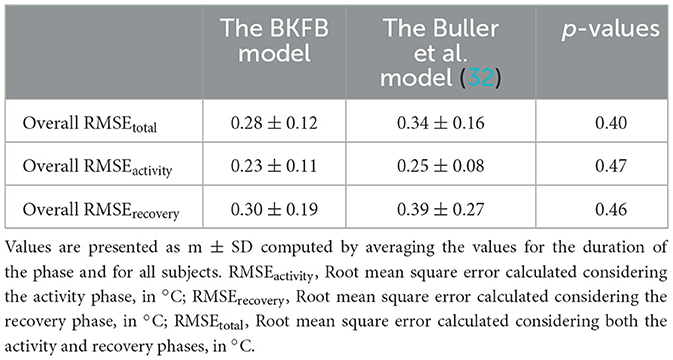
Table 3. Overall RMSE and p-values.
As can be noted in Table 3, an inter-model comparison between the BKFB model and the Buller et al. model (32) showed that the BKFB model recorded lower RMSE values than the Buller et al. model (32) for all the phases considered, even if the statistical analysis applied does not reveal significant differences between the two models.
4 Discussion
The present study proposes a biphasic model for real-time CT estimation to be implemented in a sensorized wearable device with the aim of providing thermophysiological monitoring of a worker during his work activity. The choices made to obtain the BKFB model are the result of an attempt to find the right compromise between the need for a reasonably acceptable accuracy of the CT estimations, a suitable computational complexity to be managed, and the non-invasiveness of the system. With this approach, the BKFB model has many strengths, such as: (a) being obtained from a sample of workers that is around middle-age, not very fit and includes both male and female workers; (b) being based on the HR, a physiological parameter that can be easily and continuously measured in a non-invasive way and is generally accepted by the workers; (c) using the KF which is suitable for real-time data processing; (d) being an algorithm that uses two different models to estimate the CT up and down-phases, all aspects that will be discussed in the following.
The use of the HR value alone in the estimation of CT makes the monitoring system simple, due to the HR sensor that can be easily worn by workers without causing interference with work activity or discomfort to the worker. CT and HR, however, behave differently in response to the activities performed (44), and in fact, as observed from Figures 1, 2, these two parameters react differently during the three tasks and the recovery phase. In particular, HR responds faster to changes in activity than CT, because the response of the latter is delayed by the large thermal inertia of the human body (44, 48). Nevertheless, HR appears to be a good predictor of CT (31, 41). The results obtained in this study suggest that the agreement between HR and CT is quite strong in the down-phase (R2 = 0.72), while it is more limited in the up-phase (R2 = 0.46). One of the potential solutions to improve the model's predictive ability could be to use more predictor variables (such as heat flux and skin temperature measured in various parts of the body) in combination with HR (36, 37). However, the use of more variables in the model implies a more complex handling of a real-time monitoring system. In addition, the worker has to wear several sensors, and this can cause inconvenience to the workers. Thus, the gain in performance may not justify the possible loss of monitoring practicality.
The choice of using the KF methodology to estimate CT from HR seems to be appropriate because this offers a powerful and fast recursive computational method, which is ideal for real-time data processing. Two functional forms were preliminarily explored for the development of the two measurement update models (in the up- and down-phases of CT) as required by the KF: a second-degree polynomial function [proposed in the study of Buller et al. (31, 32)] and a sigmoidal functional form [proposed by Looney et al. (42) as an updated version of the Buller et al. model (31) to increase the accuracy of the lowest CT estimates]. The application of the monophasic sigmoidal model (42) to the dataset of this study resulted in a slightly lower overall RMSErecovery (0.30 ± 0.20°C) than that obtained by applying the Buller et al. model (31) (quadratic monophasic function) to the same dataset, and a marginally higher overall RMSEactivity (0.29 ± 0.08°C). Because modeling the activity phase with the sigmoidal function was not performant and modeling the recovery phase was only marginally better, it was consequently decided to adopt the quadratic biphasic function for the BKFB model and to use the Buller et al. quadratic monophasic model (32) as the alternative reference method (in addition to measured CT) for comparisons with the model obtained in this study.
The BKFB model achieved very promising results in terms of the overall RMSE values during the activity phase (0.23 ± 0.11°C), during the recovery phase (0.30 ± 0.19°C), and when considering both (0.28 ± 0.12°C). The overall RMSE values obtained by the application of the BKFB model were lower than those obtained by the Buller et al. model (32) indicating better estimates of the CT data measured in this study. The RMSEtotal, RMSEactivity, and RMSErecovery were also calculated subject-by-subject in this study. The BKFB model in the recovery phase outperformed the Buller et al. model (32) in more cases compared to the activity phase, suggesting that the former likely modeled the recovery phases better. This finding is presumably because the Buller et al. model (32) used the same equation for both the activity and recovery phases, whereas the BKFB model uses an equation that is especially designed to shape the recovery phases. The lower number of cases in which the BKFB model outperformed the Buller et al. model (32) in the activity phase may depend on the limited dataset with a not very extensive CT range and the use of an initial estimated CT instead of the measured CT. Indeed, a big challenge in using the KF methodology for CT estimation is that an accurate CT value at t = 0 is required. In this study, it was decided to estimate the initial CT value by averaging the CT data collected from all participants during the 3 min rest period prior to the activity phase in order to obtain a more representative value of the workers' population considered. The initial CT value, on the other hand, may vary depending on the subjective characteristics (46, 47), and this subject-to-subject difference is also highlighted by the time courses of the measured CT of the 13 selected subjects (Figures 4, 5). In any case, the necessity to provide the model with the most accurate CT value to use at t = 0 is an ongoing common issue (32, 44), and more in-depth investigations on the quantification of the impact of the initial CT value on subsequent estimates are needed.
In general, the BKFB model appears to have the potential to be applied for real-time CT estimation in the occupational field. However, a limitation may be attributed to the not very wide range of CT values in the dataset that most likely made the determination of the measurement update models more challenging and may limit the predictive capabilities of the BKFB model to the CT values up to 38°C. A larger sample size (composed of a wider and more diversified population of workers in terms of age, anthropometry, and physical fitness) could improve the estimation and could also allow the development of age- or gender-specific models so as to make it oriented to the individual target groups. Future investigations should focus on testing the performance of the BKFB model in a wider range of stressful situations, with respect to (a) other work activities performed in real workplaces (considering also static work); (b) multi-layer clothing, possibly also including PPE; and (c) additional environmental thermal conditions, both warmer and colder conditions than those explored in this study. Effects due to psychological stress shall also be addressed. Estimation models should evolve toward progressive customization (i.e., taking into account age, gender, and other variables) as a contribution to future research.
5 Conclusion
This study focuses on the development of a real-time core temperature (CT) estimation model for application in the occupational field. Employing two separate phases, one designed specifically for the CT up-phase and the other for the CT down-phase, with the ability to switch between the two, a model was developed that leverages the Kalman filter (KF) to estimate CT from HR measurements.
The Biphasic Kalman filter-based (BKFB) model obtained introduces some modifications over the Buller et al. model (31) for a more effective application in the occupational field. In particular, the BKFB model was developed from CT and HR data acquired on a more realistic sample of workers (which is heavily weighted toward middle-aged, not very fit, and with a considerable part of female workers) while simulating real work activities. This new model also includes two different modeling of CT, namely, one for the increasing phase and the other for the decreasing phase, allowing for better behavioral modeling of the CT in the two different stages. The BKFB model only requires HR measurement to run, which is measured with a non-invasive sensor that can be used for extended periods, without disturbing the worker. In addition to being easily used in workplaces, the model found in this study performed well (overall RMSEtotal = 0.28 ± 0.12°C, overall RMSEactivity = 0.23 ± 0.11°C, and overall RMSErecovery = 0.30 ± 0.19°C) when its CT estimates were compared to CT measurements obtained from the ingestible core body temperature sensor. The BKFB model also achieved lower overall RMSE values than the Buller et al. model (32) (overall RMSEtotal = 0.34 ± 0.16°C, overall RMSEactivity= 0.25 ± 0.08°C, and overall RMSErecovery= 0.39 ± 0.27°C). Despite the CT application range of up to 38°C, it can be concluded that the BKFB model appears to be a suitable solution to be integrated into a real-time monitoring system of the workers' thermal state due to its good performance and its ease of application and management. Future studies should aim to extend the application range of the CT in order to model more stressful conditions.
Data availability statement
The raw data supporting the conclusions of this article will be made available by the authors, without undue reservation.
Ethics statement
The studies involving humans were approved by Local Ethics Committee (protocol number 0078009/2021). The studies were conducted in accordance with the local legislation and institutional requirements. The participants provided their written informed consent to participate in this study.
Author contributions
SDF, TF, and PL: methodology. SDF and TF: visualization. TF and PL: data curation, formal analysis, and software. VM: funding acquisition, project administration, resources, and supervision. SDF, TF, PL, and VM: conceptualization, investigation, validation, and writing of the original draft. All authors contributed to the revision of the manuscript, read, and approved the submitted version.
Acknowledgments
The authors would like to thank all the volunteers who kindly agreed to take part in this study.
Conflict of interest
The authors declare that the research was conducted in the absence of any commercial or financial relationships that could be construed as a potential conflict of interest.
Publisher's note
All claims expressed in this article are solely those of the authors and do not necessarily represent those of their affiliated organizations, or those of the publisher, the editors and the reviewers. Any product that may be evaluated in this article, or claim that may be made by its manufacturer, is not guaranteed or endorsed by the publisher.
References
1. Rowlinson S, YunyanJia A, Li B, ChuanjingJu C. Management of climatic heat stress risk in construction: a review of practices, methodologies, and future research. Accid Analy Prevent. (2014) 66:187–98. doi: 10.1016/j.aap.2013.08.011
2. Anttonen H, Anneli P, Juhani N. Safety at work in cold environments and prevention of cold stress. Ind Health. (2009) 47:254–61. doi: 10.2486/indhealth.47.254
3. Greszta A, Bartkowiak G, Dabrowska A, Gliścińska E, Machnowski W, Kozikowski P. Multilayer nonwoven inserts with Aerogel/PCMs for the improvement of thermophysiological comfort in protective clothing against the cold. Materials. (2022) 15:2307. doi: 10.3390/ma15062307
4. Del Ferraro S, Falcone T, Morabito M, Messeri A, Bonafede M, Marinaccio A et al. Cooling garments against environmental heat conditions in occupational fields: measurements of the effect of a ventilation jacket on the total thermal insulation. Int J Ind Ergon. (2021) 86:103230. doi: 10.1016/j.ergon.2021.103230
5. Del Ferraro S, Falcone T, Morabito M, Messeri A, Bonafede M, Marinaccio A et al. A potential wearable solution for preventing heat strain in workplaces: the cooling effect and the total evaporative resistance of a ventilation jacket. Environ Res. (2022) 212:113475. doi: 10.1016/j.envres.2022.113475
6. Sergi I, Montanaro T, Shumba AT, Catarinucci L, Colella R, Del Ferraro S et al. An IoT-aware smart system to detect heat-stress conditions in industrial environments. In: Proceeding of the 6th International Conference on Smart and Sustainable Technologies, SpliTech 2021. Split and Bol Croatia, (2021). doi: 10.23919/SpliTech52315.2021.9566378
7. Hall JE. Guyton and Hall Textbook of Medical Physiology. (12th ed) Philadelphia, PA: Saunders Elsevier. (2011).
8. ISO 9886 (2004) Ergonomics—Evaluation of Thermal Strain by Physiological Measurements. Geneva: International Standard Organization.
9. Katić K, Li R, Zeiler W. Thermophysiological models and their applications: a review. Build Environ. (2016) 106:286–300. doi: 10.1016/j.buildenv.2016.06.031
10. Fanger P. Thermal Comfort Analysis and Applications in Environmental Engineering. Copenhagen: Copenhagen Danish Technical Press. (1970).
11. Givoni B, Goldman RF. Predicting rectal temperature response to work, environment and clothing. J Appl Physiol. (1972) 32:812–822. doi: 10.1152/jappl.1972.32.6.812
12. Gagge AP, Stolwijk JAJ, Nishi Y. An effective temperature scale based on a simple model of human physiological regulatory response. ASHRAE Trans. (1971) 77:247–e262.
13. Takada S, Kobayashi H, Matsushita T. Thermal model of human body fitted with individual characteristics of body temperature regulation. Build Environ. (2009) 44:463e470. doi: 10.1016/j.buildenv.2008.04.007
14. Kingma BR, Frijns AJ, Schellen L, van Marken Lichtenbelt WD. Beyond the classic thermoneutral zone: including thermal comfort. Temperature. (2014) 1:142–9. doi: 10.4161/temp.29702
15. Foda E, Siren K. A new approach using the Pierce two-node model for different body parts. Int J Biometeorol. (2011) 55:519–e532. doi: 10.1007/s00484-010-0375-4
16. Fiala D, Lomas KJ, Stohrer M. Computer prediction of human thermoregulatory and temperature responses to a wide range of environmental conditions. Int J Biometeorol. (2001) 45:143–59. doi: 10.1007/s004840100099
17. Stolwijk JAJ. A mathematical model of physiological temperature regulation in man 1971. NASA Contractor Report. (1855).
18. Zhang H, Huizenga C, Arens E, Yu T. Considering individual physiological differences in a human thermal model. J Therm Biol. (2001) 26:401e408. doi: 10.1016/S0306-4565(01)00051-1
19. Wissler EH. Mathematical simulation of human thermal behaviour using whole body models. Heat Transf Med Biol. (1985) 1:325–e373.
20. Fu G. A transient, three-dimensional mathematical thermal model for the clothed human. [Ph.D thesis]. Kansas State University. (1995).
21. Ferreira MS, Yanagihara JI. A transient three-dimensional heat transfer model of the human body. Int Commun Heat Mass Transf. (2009) 36:718–e724. doi: 10.1016/j.icheatmasstransfer.2009.03.010
22. Tang Y, He Y, Shao H, Ji C. Assessment of comfortable clothing thermal resistance using a multi-scale human thermoregulatory model. Int J Heat Mass Transf. (2016) 98:568–83. doi: 10.1016/j.ijheatmasstransfer.2016.03.030
23. Del Ferraro S, Falcone T, Rondinone BM, Molinaro V. The effect of a power assisted filtering device on the local and whole body thermal response in cold and hot environments. Int J Ind Ergon. (2020) 75:102895. doi: 10.1016/j.ergon.2019.102895
24. Del Ferraro S, Falcone T, Rondinone BM, Molinaro V. Thermophysiological simulations with Newton manikin equipped with a power assisted filtering device in cold environments. J Therm Biol. (2018) 78:320–8. doi: 10.1016/j.jtherbio.2018.10.019
25. Del Ferraro S, Tombolini F, Plebani C, Molinaro V. Thermophysiological response of Newton manikin equipped with power-assisted filtering device incorporating a full-face mask in hot environment. Int J Hyperthermia. (2017) 33:717–23. doi: 10.1080/02656736.2017.1316874
26. Montáns F J, Chinesta F, Gómez-Bombarelli R, Kutz JN. Data-driven modeling and learning in science and engineering. Comptes Rendus Mécanique. (2019) 347:845–855. doi: 10.1155/2019/5040637
27. Falcone T, Cordella F, Molinaro V, Zollo L, Del Ferraro S. Real-time human core temperature estimation methods and their application in the occupational field: a systematic review. Measurement. (2021) 183:109776. doi: 10.1016/j.measurement.2021.109776
28. Mazgaoker S, Ketko I, Yanovich R, Heled Y, Epstein Y. Measuring core body temperature with a non-invasive sensor. J Therm Biol. (2017) 66:17–20. doi: 10.1016/j.jtherbio.2017.03.007
29. Roussey G, Géhin C, Massot B, Ait Ali I, Bernard T. A comparative study of two ambulatory core temperature assessment methods. Irbm. (2018) 39:143–50. doi: 10.1016/j.irbm.2018.02.004
30. Kim S, Lee JY. Skin sites to predict deep-body temperature while wearing firefighters' personal protective equipment during periodical changes in air temperature. Ergonomics. (2016) 59:496–503. doi: 10.1080/00140139.2015.1075604
31. Buller MJ, Tharion W, Cheuvront S, Montain S, Kenefick R, Castellani J, et al. Estimation of human core temperature from sequential heart rate observations. Physiol Measur. (2013) 34:781–98. doi: 10.1088/0967-3334/34/7/781
32. Buller MJ, Tharion WJ, Duhamel CM, Yokota M. Real-time core body temperature estimation from heart rate for first responders wearing different levels of personal protective equipment. Ergonomics. (2015) 58:1830–41. doi: 10.1080/00140139.2015.1036792
33. Hunt AP, Buller MJ, Maley MJ, Costello JT, Stewart IB. Validity of a noninvasive estimation of deep body temperature when wearing personal protective equipment during exercise and recovery. Milit Med Res. (2019) 6:20. doi: 10.1186/s40779-019-0208-7
34. Seo Y, DiLeo T, Powell JB, Kim JH, Roberge RJ, Coca A. Comparison of estimated core body temperature measured with the BioHarness and rectal temperature under several heat stress conditions. J Occup Environ Hyg. (2016) 13:612–20. doi: 10.1080/15459624.2016.1161199
35. Eggenberger P, MacRae BA, Kemp S, Bürgisser M, Rossi RM, Annaheim S. Prediction of core body temperature based on skin temperature, heat flux, and heart rate under different exercise and clothing conditions in the heat in young adult males. Front Physiol. (2018) 9:1780. doi: 10.3389/fphys.2018.01780
36. Niedermann R, Wyss E, Annaheim S, Psikuta A, Davey S, Rossi RM. Prediction of human core body temperature using non-invasive measurement methods. Int J Biometeorol. (2014) 58:7–15. doi: 10.1007/s00484-013-0687-2
37. Welles AP, Xu X, Santee WR, Looney DP, Buller MJ, Potter AW, et al. Estimation of core body temperature from skin temperature, heat flux, and heart rate using a Kalman filter. Comput Biol Med. (2018) 99:1–6. doi: 10.1016/j.compbiomed.2018.05.021
38. Xu X, Karis AJ, Buller MJ, Santee WR. Relationship between core temperature, skin temperature, and heat flux during exercise in heat. Eur J Appl Physiol. (2013) 113:2381–9. doi: 10.1007/s00421-013-2674-z
39. Kalman RE, A. new approach to linear filtering and prediction problems. J Basic Eng. (1960) 82:35–45. doi: 10.1115/1.3662552
40. Welch G, Bishop G. An introduction to the Kalman filter Technical Report TR 95-041. Department of Computer Science, University of North Carolina at Chapel Hill, NC (1995).
41. Buller MJ, Tharion WJ, Hoyt RW, Jenkins OC. Estimation of human internal temperature from wearable physiological sensors. In: 22nd Conference on Innovative Applications of Artificial Intelligence (IAAI). (2010) 1763–8. doi: 10.1609/aaai.v24i2.18809
42. Looney DP, Buller MJ, Gribok AV, Leger JL, Potter AW, Rumpler WV, et al. Estimating resting core temperature using heart rate. J Measur Phys Behav. (2018) 1:79–86. doi: 10.1123/jmpb.2017-0003
43. Buller MJ, Davey T, Fallowfield JL, Montain SJ, Hoyt RW, Delves SK. Estimated and measured core temperature responses to high-intensity warm weather military training: implications for exertional heat illness risk assessment. Physiol Meas. (2020) 41:065011. doi: 10.1088/1361-6579/ab934b
44. Falcone T, Del Ferraro S, Molinaro V, Zollo L, Lenzuni P. Estimation of human core temperature from heart rate: a preliminary study for application in occupational field. In: 2022 IEEE International Workshop on Metrology for Industry 4.0 and IoT, MetroInd 4.0 and IoT - Proceedings. (2022) 60–64. doi: 10.1109/MetroInd4.0IoT54413.2022.9831532
45. European Statistics (Eurostat). Statistics Explained, Employment - annual statistics. (2021). Available online at: https://ec.europa.eu/eurostat/statistics-explained/index.php?title=Employment-annual_statistics (accessed December 12, 2022).
46. Havenith G, van Middendorp H. The relative influence of physical fitness, acclimatization state, anthropometric measures and gender on individual reactions to heat stress. Eur J Appl Physiol. (1990) 61:419–27. doi: 10.1007/BF00236062
47. Wagner JA, Horvath SM. Influences of age and gender on human thermoregulatory responses to cold exposures. J Appl Physiol. (1985) 58:180–6. doi: 10.1152/jappl.1985.58.1.180
Keywords: human core temperature, thermal strain, estimation models, wearable devices, occupational health
Citation: Falcone T, Del Ferraro S, Molinaro V, Zollo L and Lenzuni P (2024) A real-time biphasic Kalman filter-based model for estimating human core temperature from heart rate measurements for application in the occupational field. Front. Public Health 12:1219595. doi: 10.3389/fpubh.2024.1219595
Received: 09 May 2023; Accepted: 20 February 2024;
Published: 11 March 2024.
Edited by:
Somayeh Farhang Dehghan, Shahid Beheshti University of Medical Sciences, IranReviewed by:
Behzad Fouladi, Ahvaz Jundishapur University of Medical Sciences, IranCharles Douglas Thake, Coventry University, United Kingdom
Steve Rowlinson, The University of Hong Kong, Hong Kong SAR, China
Copyright © 2024 Falcone, Del Ferraro, Molinaro, Zollo and Lenzuni. This is an open-access article distributed under the terms of the Creative Commons Attribution License (CC BY). The use, distribution or reproduction in other forums is permitted, provided the original author(s) and the copyright owner(s) are credited and that the original publication in this journal is cited, in accordance with accepted academic practice. No use, distribution or reproduction is permitted which does not comply with these terms.
*Correspondence: Tiziana Falcone, dC5mYWxjb25lLXNnJiN4MDAwNDA7aW5haWwuaXQ=; Simona Del Ferraro, cy5kZWxmZXJyYXJvJiN4MDAwNDA7aW5haWwuaXQ=