 Aklilu Abrham Roba
 Nega Assefa
 Kedir Teji Roba
 Yadeta Dessie
 Elena Hamler3
- 1College of Health and Medical Sciences, Haramaya University, Dire Dawa, Ethiopia
- 2Faculty of Health Science, Erciyes University, Kayseri, Türkiye
- 3Harvard T.H. Chan School of Public Health, Boston, MA, United States
Introduction: In Ethiopia, there is limited evidence on the effect of dietary protein intake on women’s body mass index. Therefore, this study investigated the association between dietary protein intake, diet quality, and overweight and obesity.
Methods: A cross-sectional study was conducted among 897 women of reproductive age. Food frequency questionnaires were used to assess 7-day dietary intake. It was converted into protein and other macro-nutrient intakes, Minimum Dietary Diversity for Women, and Global Dietary Quality Score. Body Mass Index (BMI) of overweight & obese women were defined as ≥25 kg/m2. An adjusted odds ratio with a 95% confidence interval (in a multivariate logistic regression model) was used to determine the strength of the association between BMI and dietary protein intake, adjusting for potential confounders.
Results: The median dietary protein intake was 41.3 (32.9, 52.6) grams/day or 0.8 (0.6, 1.0) grams/kilogram of body weight/day. The prevalence of overweight and obesity was 7.5% (n = 67). Only 220 (24.5%) women could meet the recommended minimum dietary diversity of five or more food groups out of 10 per day. Furthermore, only 255 (28.4%) women were found to have a low risk for nutrient adequacy. Interestingly, women who consumed moderate dietary protein had a significantly lower likelihood of being overweight or obese, with AOR of 0.21 (95% CI 0.10–0.48). Similarly, those who consumed a high amount of protein had even lower odds, with AOR of 0.03 (95% CI 0.01–0.14), compared to those who consumed a low amount of dietary protein. Age of 40–49 years (AOR = 3.33, 95% CI 1.24–8.95) compared to 18–29 years, non-farmers (AOR = 3.21, 95% CI 1.55–6.62), higher consumption of food from unhealthy groups (AOR = 1.30, 95% CI 1.05–1.61), and high fat intake (AOR = 1.06, 95% CI 1.04–1.09) were associated with overweight and obesity.
Conclusions and recommendations: The study indicated an inverse relationship between BMI and dietary protein intake. It also revealed that women who consumed foods from unhealthy or unhealthy when consumed in excessive amounts were more likely to be overweight or obese. Increasing dietary protein consumption can help reproductive-age women reduce the odds of obesity and overweight. Furthermore, community-based educational programs, policy changes, and healthcare services can support this effort.
Introduction
The definition of diet quality varies depending on dietary habits, cultural background, the availability of local foods, and individual requirements (such as age, gender, and level of physical activity). However, it can be stated as the adequacy of essential nutrients and energy in supporting bodily functions, promoting well-being, facilitating physical activity, preventing infections, and reducing the risk of diet-related noncommunicable diseases (1). A diet consisting of lower-quality foods, such as highly processed snacks, sugary drinks, white grains, refined sugar, fried foods, foods high in unhealthy fats, and high-glycemic foods like potatoes can lead to weight gain, obesity and other chronic conditions such as diabetes, cancer, heart diseases, and stroke (2–4). Conversely, high-quality foods consist of unrefined, minimally processed options like vegetables, fruits, whole grains, nuts, pulses, healthy vegetable and seed oils, healthy fats, and healthy sources of plant and animal proteins (3, 5). Consuming high-quality foods in appropriate portions helps in maintaining good health and attaining an ideal body weight without obesity, while also reducing inflammation within the body (3, 6).
In the past, the absence of a single, validated index to assess diet quality in low- and middle-income countries has led to the utilization of proxy measures like dietary diversity scales. However, in recent years, standardized tools like the Global Dietary Quality Score (GDQS), has emerged to measure diet quality (7, 8). A lower score has been linked to an increased risk of obesity and its related complications, whereas higher scores have been associated with more favorable anthropometric measurements, including lower body mass index, waist-to-height ratio, and waist circumference (9, 10).
Globally, the prevalence of overweight and obesity has increased in the last few decades, including in low- and middle-income countries (11). As the global prevalence tripled between 1975 and 2016, the same pattern continued in many African countries, including Ethiopia (12, 13). It caused 2.4 million deaths and 70.7 million disability-adjusted life years among females in 2017 in the world (14). Overweight and obese women are at risk of chronic diseases, untimely death, mental disorders, postpartum bleeding, and fetal macrosomia (15, 16).
The fundamental cause of overweight and obesity is an energy imbalance between calories consumed and expended (12). It is also well-established that unhealthy eating pattern leads to weight gain (17). Furthermore, overweight and obesity were associated with advancing age, urban residence, female gender, better educational status, and being in the affluent quintile (18, 19). Recent evidence indicates an inverse association between healthy diets, overweight, and obesity (20).
The role of dietary protein in the development of obesity is controversial. Some studies indicated that excess protein intake beyond recommended daily requirements may increase fat-free mass and adiposity, with a high potential to increase BMI (18). On the other hand, high protein and low carbohydrates resulted in significant weight loss among obese adults in interventional studies (21, 22).
In recent years, plant-based proteins have been considered a healthy option to meet the body’s protein demands (23). Plant-based proteins are a significant source of dietary protein, calories, and minerals in many low- and middle-income settings. Though people who consume more plant-based staple foods were challenged by low protein quality (24) and had lower muscle mass index (25), it has also had positive outcomes. For instance, people who obtain protein from plant source has a lower risk of hypertension, cardiovascular disease, metabolic syndrome, and type-2 diabetes (23, 25).
Animal-source proteins (ASP) are energy-dense and contain readily digestible protein along with micronutrients (minerals including iron, zinc, calcium, and vitamins such as vitamins B-12, vitamin A, and riboflavin) that are essential to meet the body’s requirements (26). However, evidence indicates that excess consumption of ASP is associated with hypertension, cardiovascular diseases, type-2 diabetes, and metabolic syndrome (23, 25, 27). On the other hand, a diet rich in plant-based proteins but low in animal-source protein is essential to maintain a healthy condition (28).
Understanding the usual protein intake and other macronutrients among women of reproductive age is essential for evaluating their nutritional status (29). In Ethiopia, there is limited evidence on the effect of dietary protein intake on women’s body mass index. Therefore, this study investigated the association between dietary protein intake, diet quality, and overweight and obesity among women in Kersa district, Ethiopia.
Methods
Study area and period
This study was conducted in Kersa Health and Demographic Surveillance Site (HDSS) in the Oromia region of eastern Ethiopia from June to September 2019. The study site mainly consists of rural areas and includes 21 rural kebeles (the smallest administrative unit in Ethiopia), as well as the three small towns of Kersa, Lange, and Weter. The baseline census was conducted in 2007 and updated every 6 months to register demographic and health events. At baseline, 10085 houses, 10,522 households, and 50,830 people were registered. The total fertility rate ranges from 4.0 to 5.3. The details of the study area were published somewhere (30).
Study design and population
This was a cross-sectional quantitative survey using face-to-face interviews and anthropometric measurements. The study’s eligibility criteria required households to have at least one married woman between the ages of 15 and 49. In cases where multiple women in the household met these criteria, a lottery method was employed to select one woman for the interview. Both breastfeeding and non-lactating mothers were included, but pregnant women (self-reported) were excluded from the study for uniformity of anthropometric values. Based on energy intake, women with less than 500 or greater than 5,000 calories were excluded from the analysis because of its implausibility (31).
Sample size
As part of a larger study involving 1,200 households with women of reproductive age (15–49 years old) (32), only 897 women were included in this particular study. This is because 303 women were excluded from the analysis based on their pregnancy status (pregnant).
A post-hoc power analysis was conducted using G∗Power 3.1.9.4 software (33) to determine the study’s power. The analysis took into account an alpha level of 0.05, a sample size of 897, and a one-tailed distribution. Based on the odds ratio between women’s body mass index and associated factors such as moderate and high dietary protein intake, non-farmers, total fat and carbohydrate intake, the study found a power of 0.99.
Data collection and measurements
Research assistants administered a demographic and dietary survey to selected women in the sampled households. The information included the socio-demographic and dietary characteristics of the study population. Individual-based food frequency questionnaires (FFQ) assessed dietary intake, including total, animal, and plant-based proteins, over the previous 7 days and 24 h. The FFQ included all major food groups in 20 clusters (75 food items and drinks), including foods made from grains; pulses; nuts and seeds; milk and milk products; organ meat; meat, fish, and poultry. A 24-h dietary intake was used to calculate MDD-W; otherwise, a 7-day intake was used.
Food matching was made by referencing the Ethiopia Food Composition Table (EFCT) (34). For food items not found in EFCT, mainly fruits and vegetables, the Tanzanian Food Composition Table was referenced (35). Each food’s energy and nutrient values were obtained by cross-referencing the sources cited above. After that, the average daily consumption of food items was calculated by dividing 7-days consumption by 7. Women’s daily dietary protein intake (g) was divided by their body weight (kg) to generate protein intake in units of g/kg body weight/day (31). The recommended dietary allowance (RDA) estimates the minimum daily average dietary intake level that meets the nutrient requirements of nearly 97 to 98% of healthy individuals (36).
The RDA for protein is 0.8 gram/kilogram of body weight/day or 46 grams/day (37). Low protein intake is defined as daily protein consumption below RDA (<0.8 grams/kilogram of body weight/day); moderate intake is from 0.8–1.2 grams/kilogram of body weight/day, whereas high intake is defined as > = 1.2 grams/ kilogram of body weight/day (38).
Minimum Dietary Diversity for Women (MDD-W) was constructed by asking the respondents to recall the foods and beverages consumed with their quantities from each food group in the past 24 h (39). According to MDD-W guidelines, there are ten food groups, namely: 1-grains, roots, and tubers; 2-pulses; 3-nuts and seeds; 4-dairy; 5-meat, poultry, and fish; 6-eggs; 7-dark green leafy vegetables; 8- other vitamin A-rich fruits and vegetables; 9-other vegetables; and 10-other fruits (39). Women who consumed at least five of the ten possible food groups were classified as having minimally adequate dietary diversity (ADD). In contrast, those who consumed less than five were classified as having a low dietary diversity (LDD) (39).
Global Dietary Quality Score (GDQS), the latest tool that measures overall diet quality regarding both nutrient adequacy and diet-related non-communicable disease (NCD) risk, was used. It constitutes 25 food groups, of which 16 are healthy (scored by giving more points for higher intake), seven unhealthy (more points for lower intake), and two food groups are classified as harmful when consumed beyond the acceptable limit (increasing points are given until specific amounts have been consumed, after which no points are given). It is computed by adding all of the 25 food groups ranging from 0 to 49, scoring higher points reflecting a healthier diet. GDQS scores of ≥23 is associated with a low risk of both nutrient adequacy and NCD risk, scores ≥15 and < 23 indicate moderate risk, and scores <15 indicate high risk. Diet-related NCD risks include metabolic syndrome, change in weight and waist circumference, and incident type 2 diabetes (7, 8).
Height and weight were measured twice, and the average was used. With a stadiometer, height was measured to the nearest 0.1 cm with the subject barefoot. Weight was measured to the nearest 0.1 kg with the subject barefoot and in light clothes, using a standard clinical scale. BMI was calculated as weight(kg)/height(m)2. Body mass index, or BMI, is defined as weight in kilograms divided by the square of height in meters. The National Institutes of Health (NIH) and the World Health Organization (WHO) have defined overweight as a BMI of 25 to 30 kg/m2 and obese as a BMI of 30 kg/m2 or higher. A normal BMI range from 18.5 kg/m2 to 25 kg/m2 (40).
The dependent variable for this study was overweight and obesity, while the primary explanatory variable of interest was dietary protein intake. In addition, this study considered the following as potential confounders: age (years, continuous), women’s lactation status (yes/no), educational attainment (no formal education, attended formal education), if women are married (yes, no), wealth index (poor, middle, wealthy), occupation (farmer, non-farmer). We also examined the relationships of minimum dietary diversity of women (low/adequate), positive and negative global dietary quality score as continuous variables, total fat (continuous), and total carbohydrate (continuous) with overweight/obesity.
Statistical analysis
The normality of data was determined using Shapiro–Wilk’s test. Both BMI and dietary protein consumption were skewed to the right. Outlier detection was made by visual inspection of histograms and box plots. Therefore, the median values with 25th and 75th percentiles were chosen as the cut-offs to report the findings. A binary logistic regression model was used to determine the association between overweight and obesity and dietary protein consumption taking women with normal BMI as a reference group. An adjusted odds ratio (with 95% CI) was used to determine the strength of the association in models adjusting for intake of fat and carbohydrate, age, wealth index, education, marital, occupation, and lactational status. Statistical significance was determined using a value of p <0.05. Analysis was conducted using Stata version 16.0 (41).
Results
Socio-demographic characteristics and nutritional status
A total of 897 women (18–49 years) were included in this analysis. The median age of the participants was 30 (27, 35) years. The majority of the participants, 734 (81.8%), were farmers, 849 (94.6%) were Muslims, 876 (97.7%) were married, and 597 (66.6%) were lactating (not pregnant). Based on the wealth index, 33.9, 33.6, and 32.5% of the women were classified into poor, medium, and rich wealth quartiles, respectively. The prevalence of overweight and obesity among women of reproductive age in Kersa was 7.5% (67/897) (Table 1).
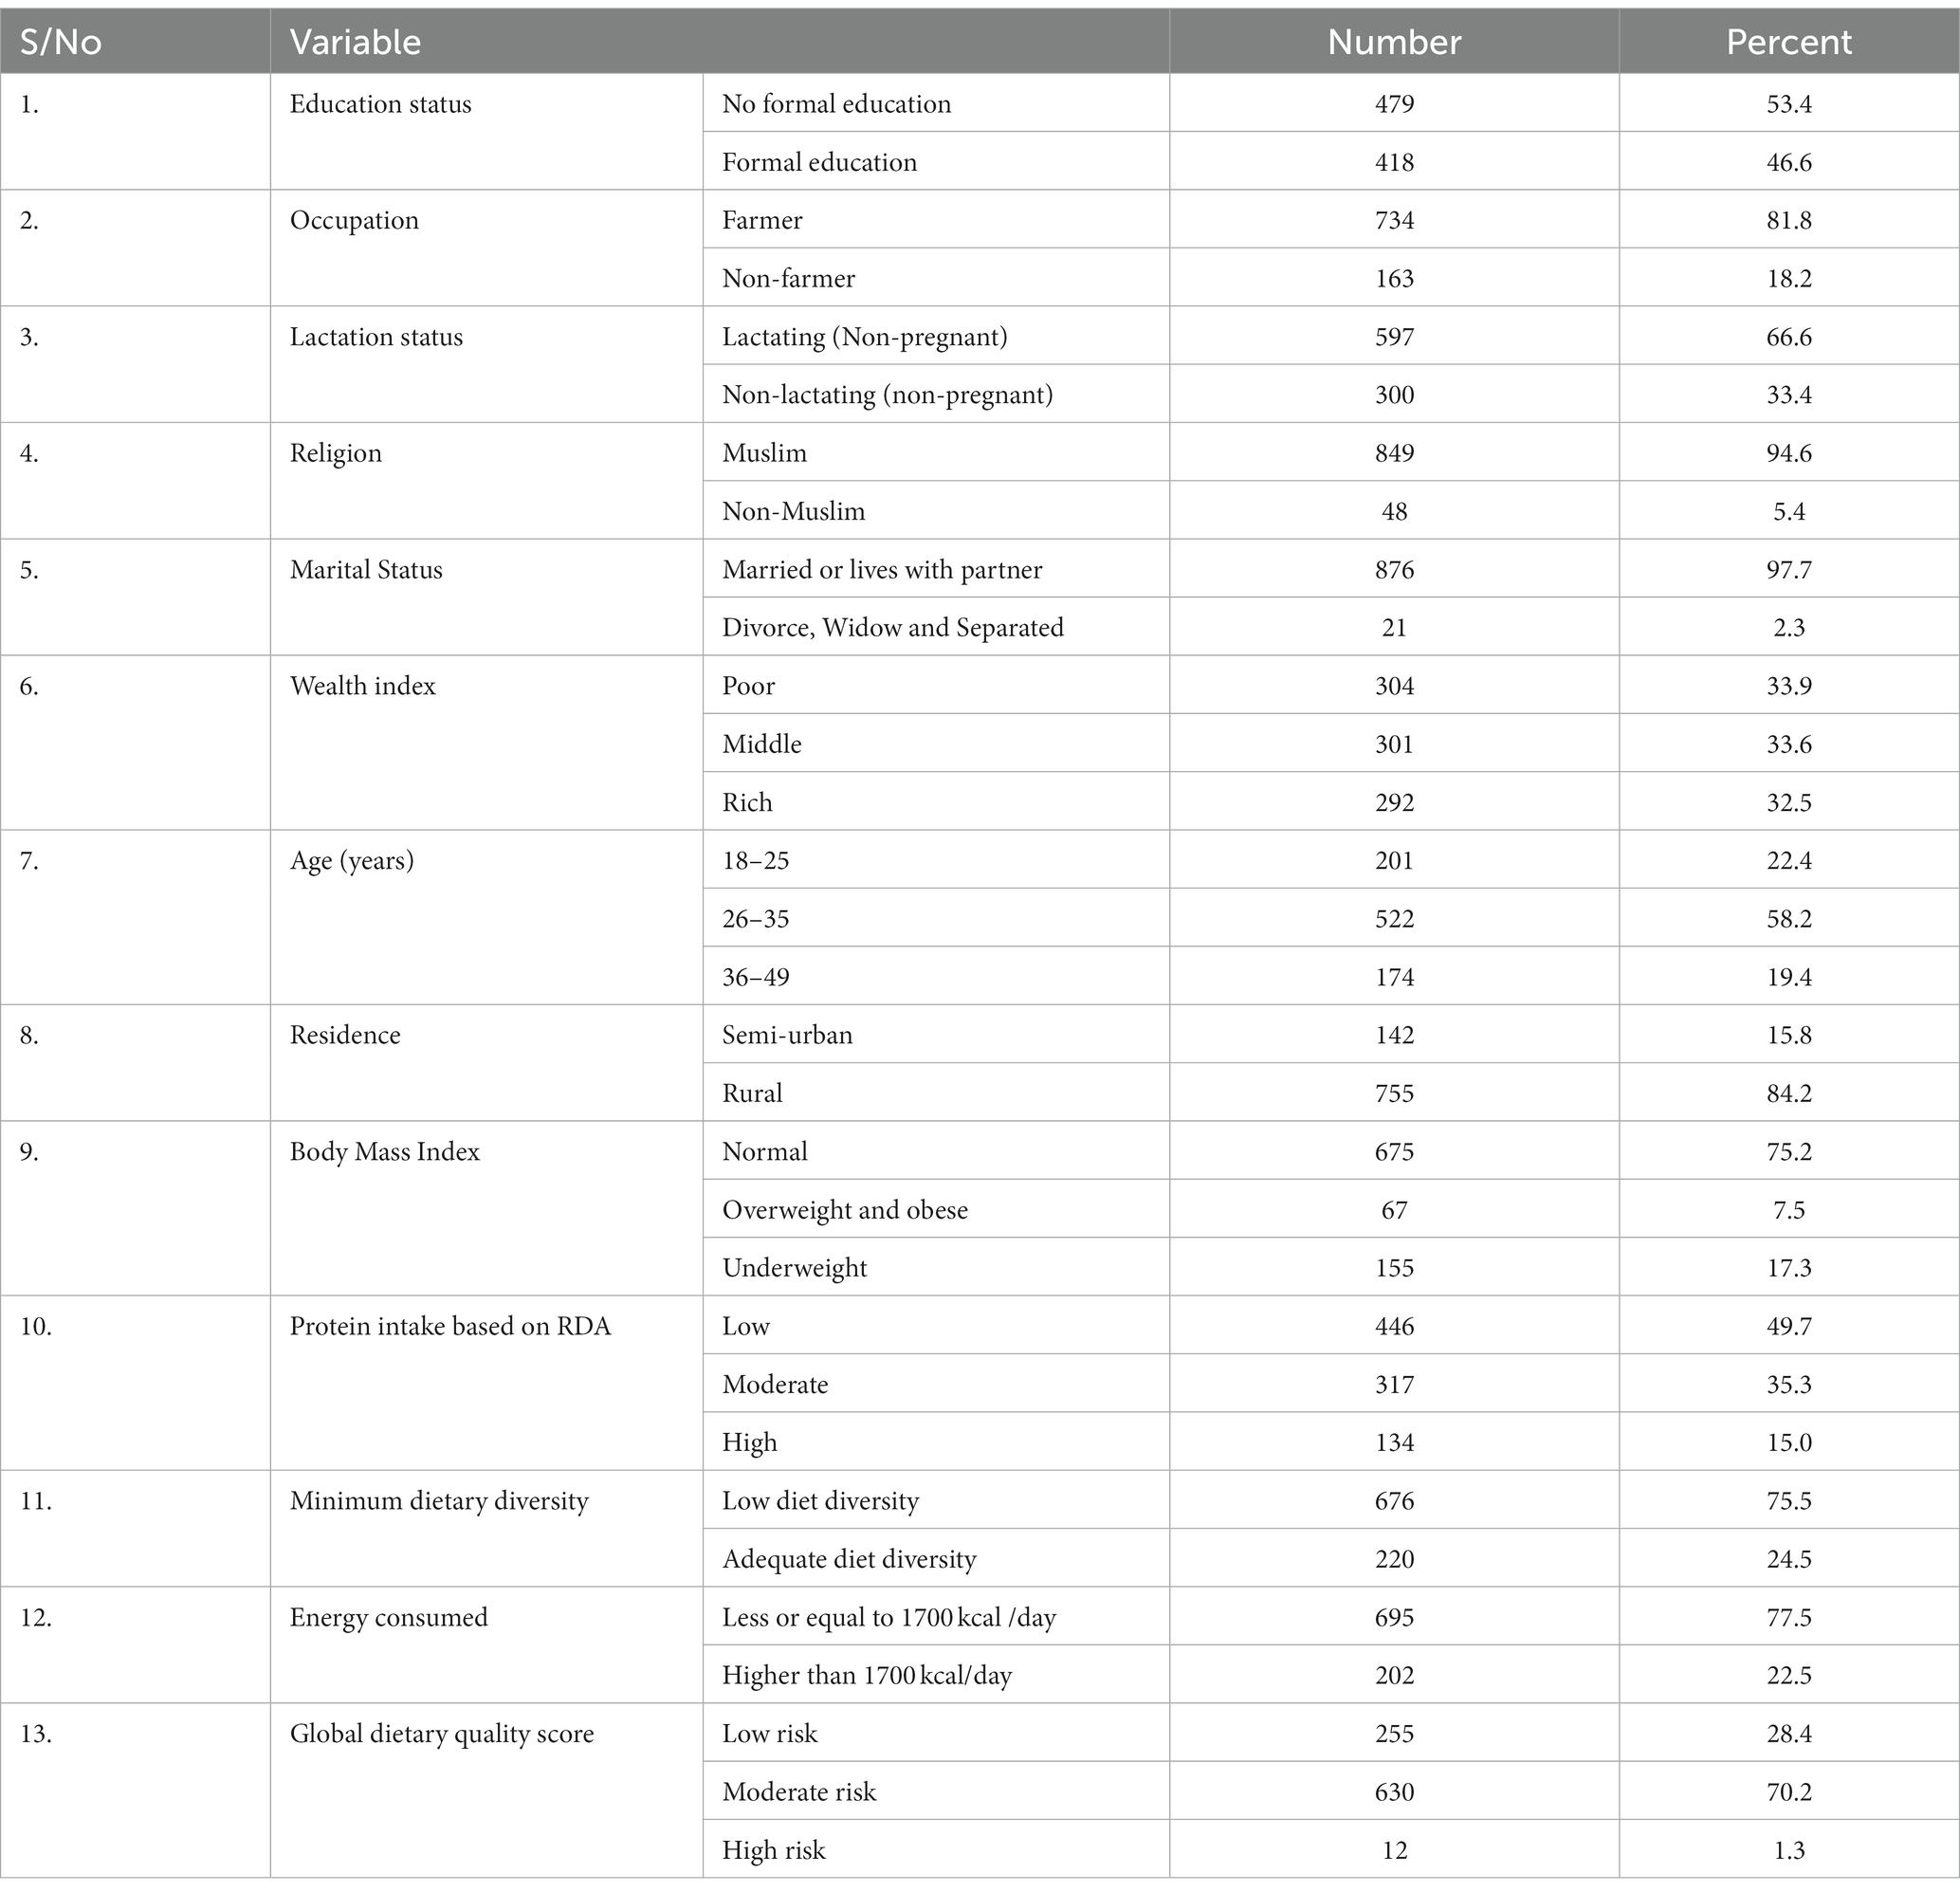
Table 1. Socio-economic status of reproductive age women in Kersa, 2019.
Minimum dietary diversity for women (MDD-W)
Three out of four women in Kersa had a low dietary diversity (LDD), whereas only 220 (24.5%) achieved the recommended minimum dietary diversity of five or more food groups out of 10 per day. Median dietary diversity was low, with women consuming three out of 10 possible food groups Figure 1. Almost all participants reported consuming “grains, roots and tubers” and other vegetables. 559 (62.4%) participants consumed dairy products. The least frequently (less than 10%) consumed food groups were “meat, fish and poultry,” “nuts and seeds,” “eggs,” and other fruits Figure 2.
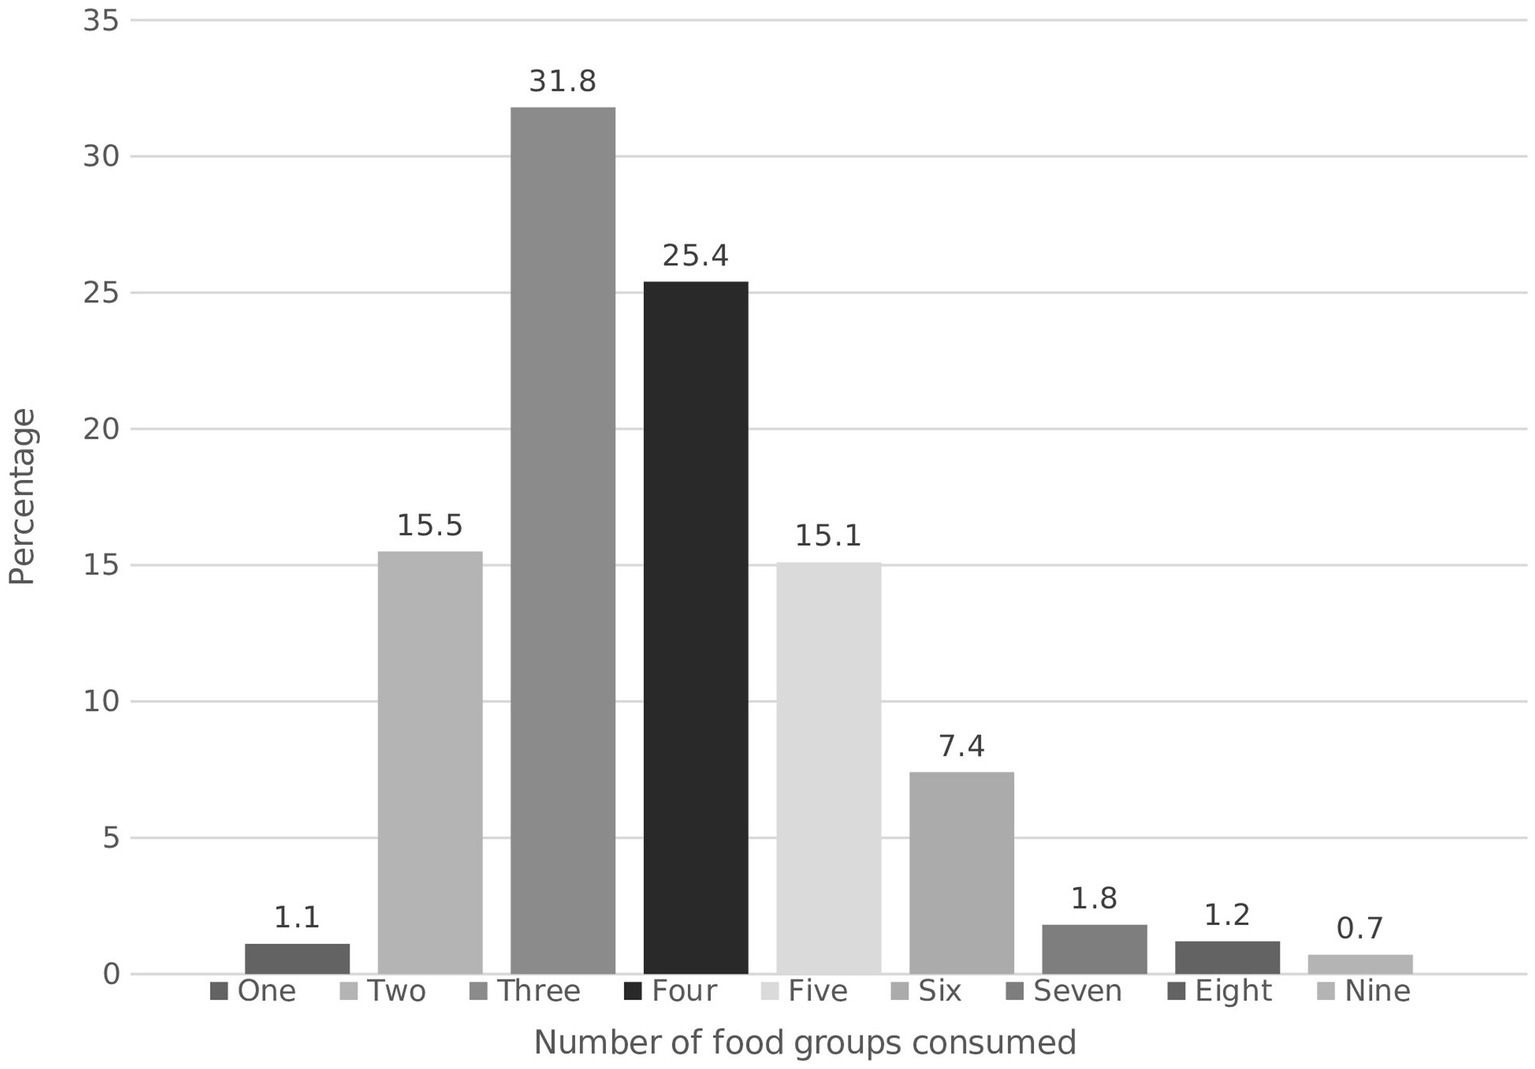
Figure 1. Dietary Diversity of women in Kersa, Ethiopia 2019.
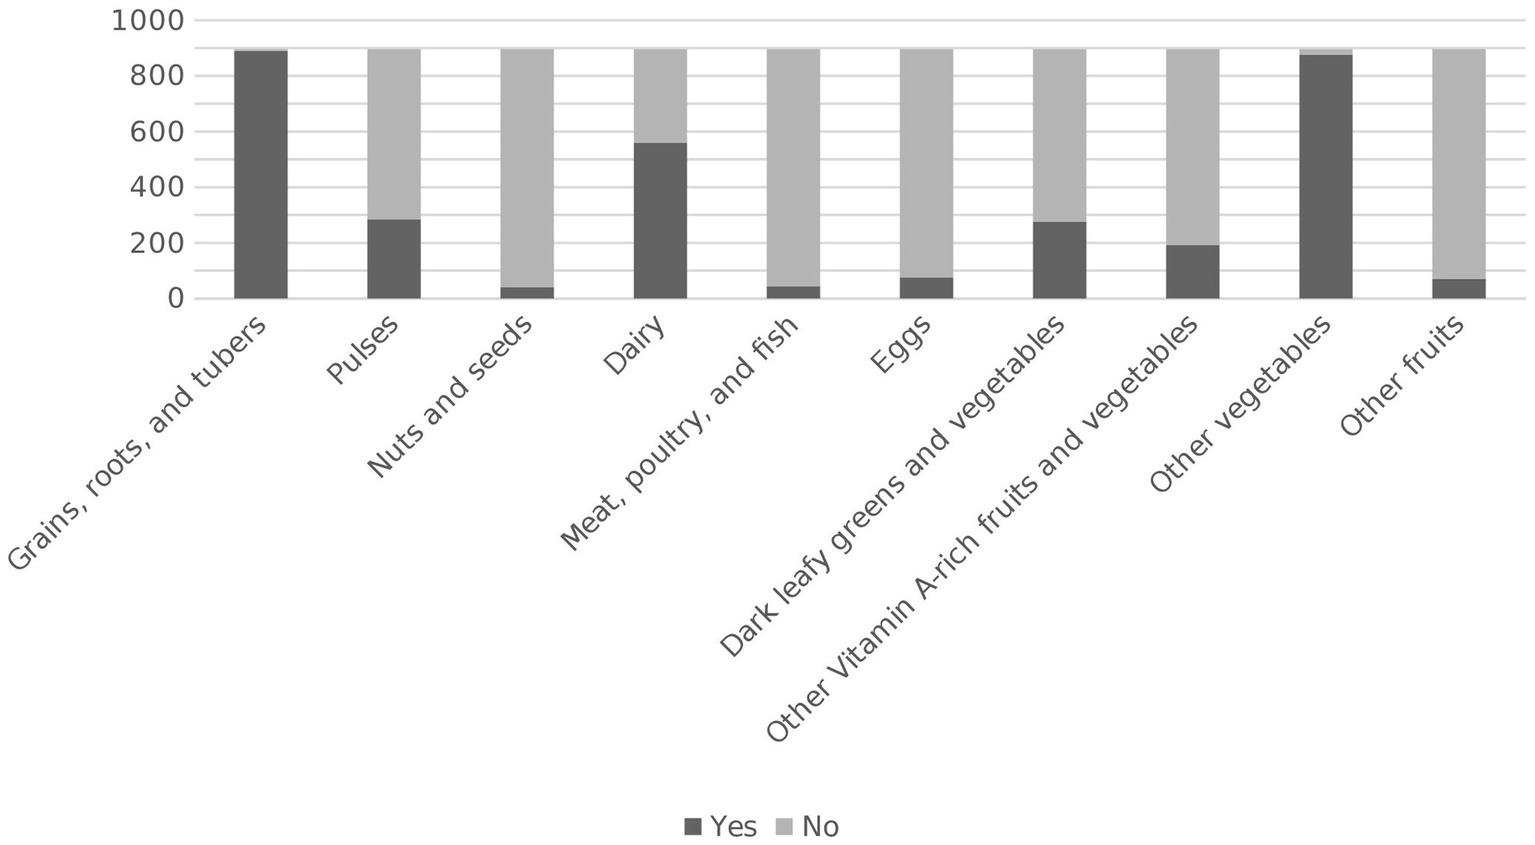
Figure 2. Consumption of food groups among women of reproductive age women in Kersa Ethiopia 2019.
Protein and energy intake
The median protein intake was 41.3 (32.9, 52.6) grams/day or 0.8 (0.6, 1.0) grams/ kilogram of body weight/day. Most dietary proteins were plant-based, with a median of 32.9 (26.1, 41.5) grams/day, while the median animal protein intake was 9.2 (2.0, 12.8) grams/day. Only 33.7% of reproductive-age women reported meeting the RDA for protein. Only 2.4% of total energy intake was derived from animal protein, while 10.1% was from plant protein. Most women, 695 (77.5%), consumed energy less than or equal to 1700 kcal /day Table 2.
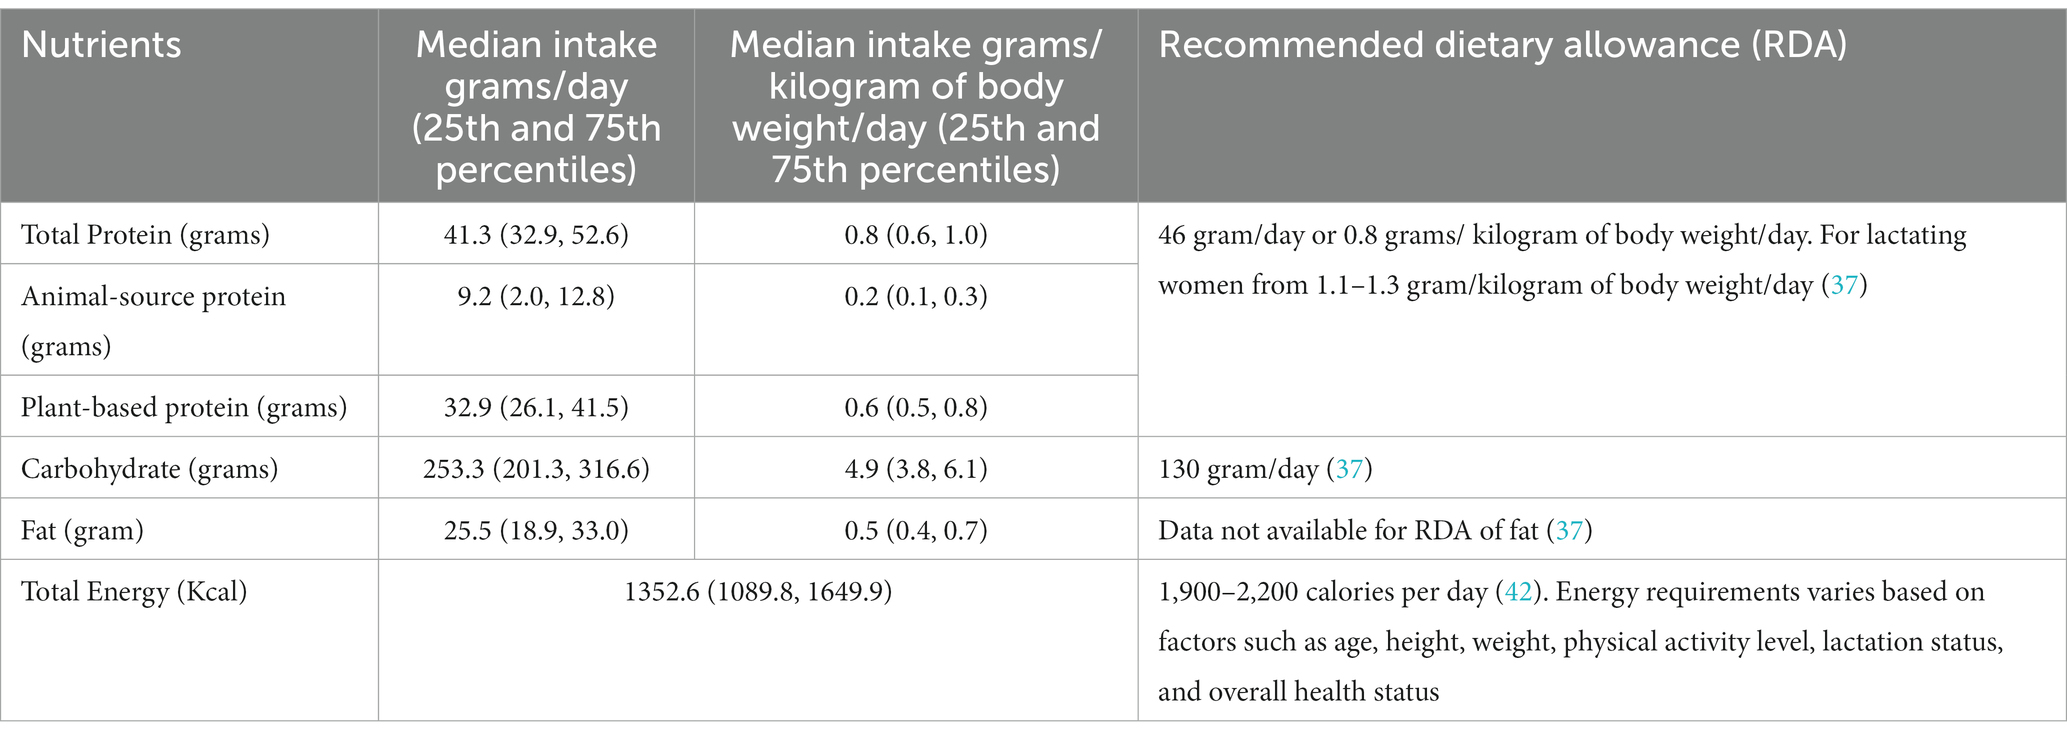
Table 2. Intake of protein, other macro-nutrients, and total energy among women in Kersa, 2019.
Global dietary quality score (GDQS)
GDQS scores show 255 (28.4%) of participants are with a low risk of both nutrient adequacy and diet-related NCD risk, 630 (70.2%) were at moderate risk, and 12 (1.3%) were at high risk. The overall diet quality score ranges from 14 to 33; the median score was 20.5 (18.5, 23.0). The GDQS+ sub-metric score, which has 16 healthy food groups, ranges from 2 to 19 with a median of 6.5 (3.5, 9.3). On the other hand, the GDQS- sub metric, the 9 GDQS food groups of unhealthy or unhealthy in excessive amounts, has a range from 9 to 16. The median score of GDQS- sub-metric was 14 (13.0, 16.0).
Association between dietary protein intake and overweight/obesity
Being overweight and obese was inversely associated with dietary protein intake in adjusted models. Reproductive age women who consumed a moderate amount of dietary protein had a significantly lower likelihood of being overweight or obese, with AOR of 0.21 (95% CI 0.10–0.48). Similarly, those who consumed a high amount of dietary protein had even lower odds, with AOR of 0.03 (95% CI 0.01–0.14), compared to those who consumed a low amount of dietary protein. On the other hand, the odds of being overweight and obese were three times (AOR = 3.33, 95% CI 1.24–8.95) higher among women in the age group of 40–49 years compared with women in 18–29 years. Similarly, non-farmers were three times (AOR = 3.24, 95% CI 1.54–6.82) more likely to be overweight and obese when compared to farmer women. Additionally, it was found that an increase in fat intake by one unit resulted in a 6% higher likelihood of being overweight or obese (AOR = 1.06, 95% CI 1.04–1.09). Furthermore, a unit increase in consumption of food groups from unhealthy or unhealthy in excessive amounts (GDQS-) has 30% (AOR = 1.30, 95% CI 1.05–1.61) increased likelihood of overweight and obesity. Finally, while the association was weak, there was a positive association between total carbohydrate intake and overweight and obesity (AOR = 1.005, 95% CI 1.00–1.01) Table 3.
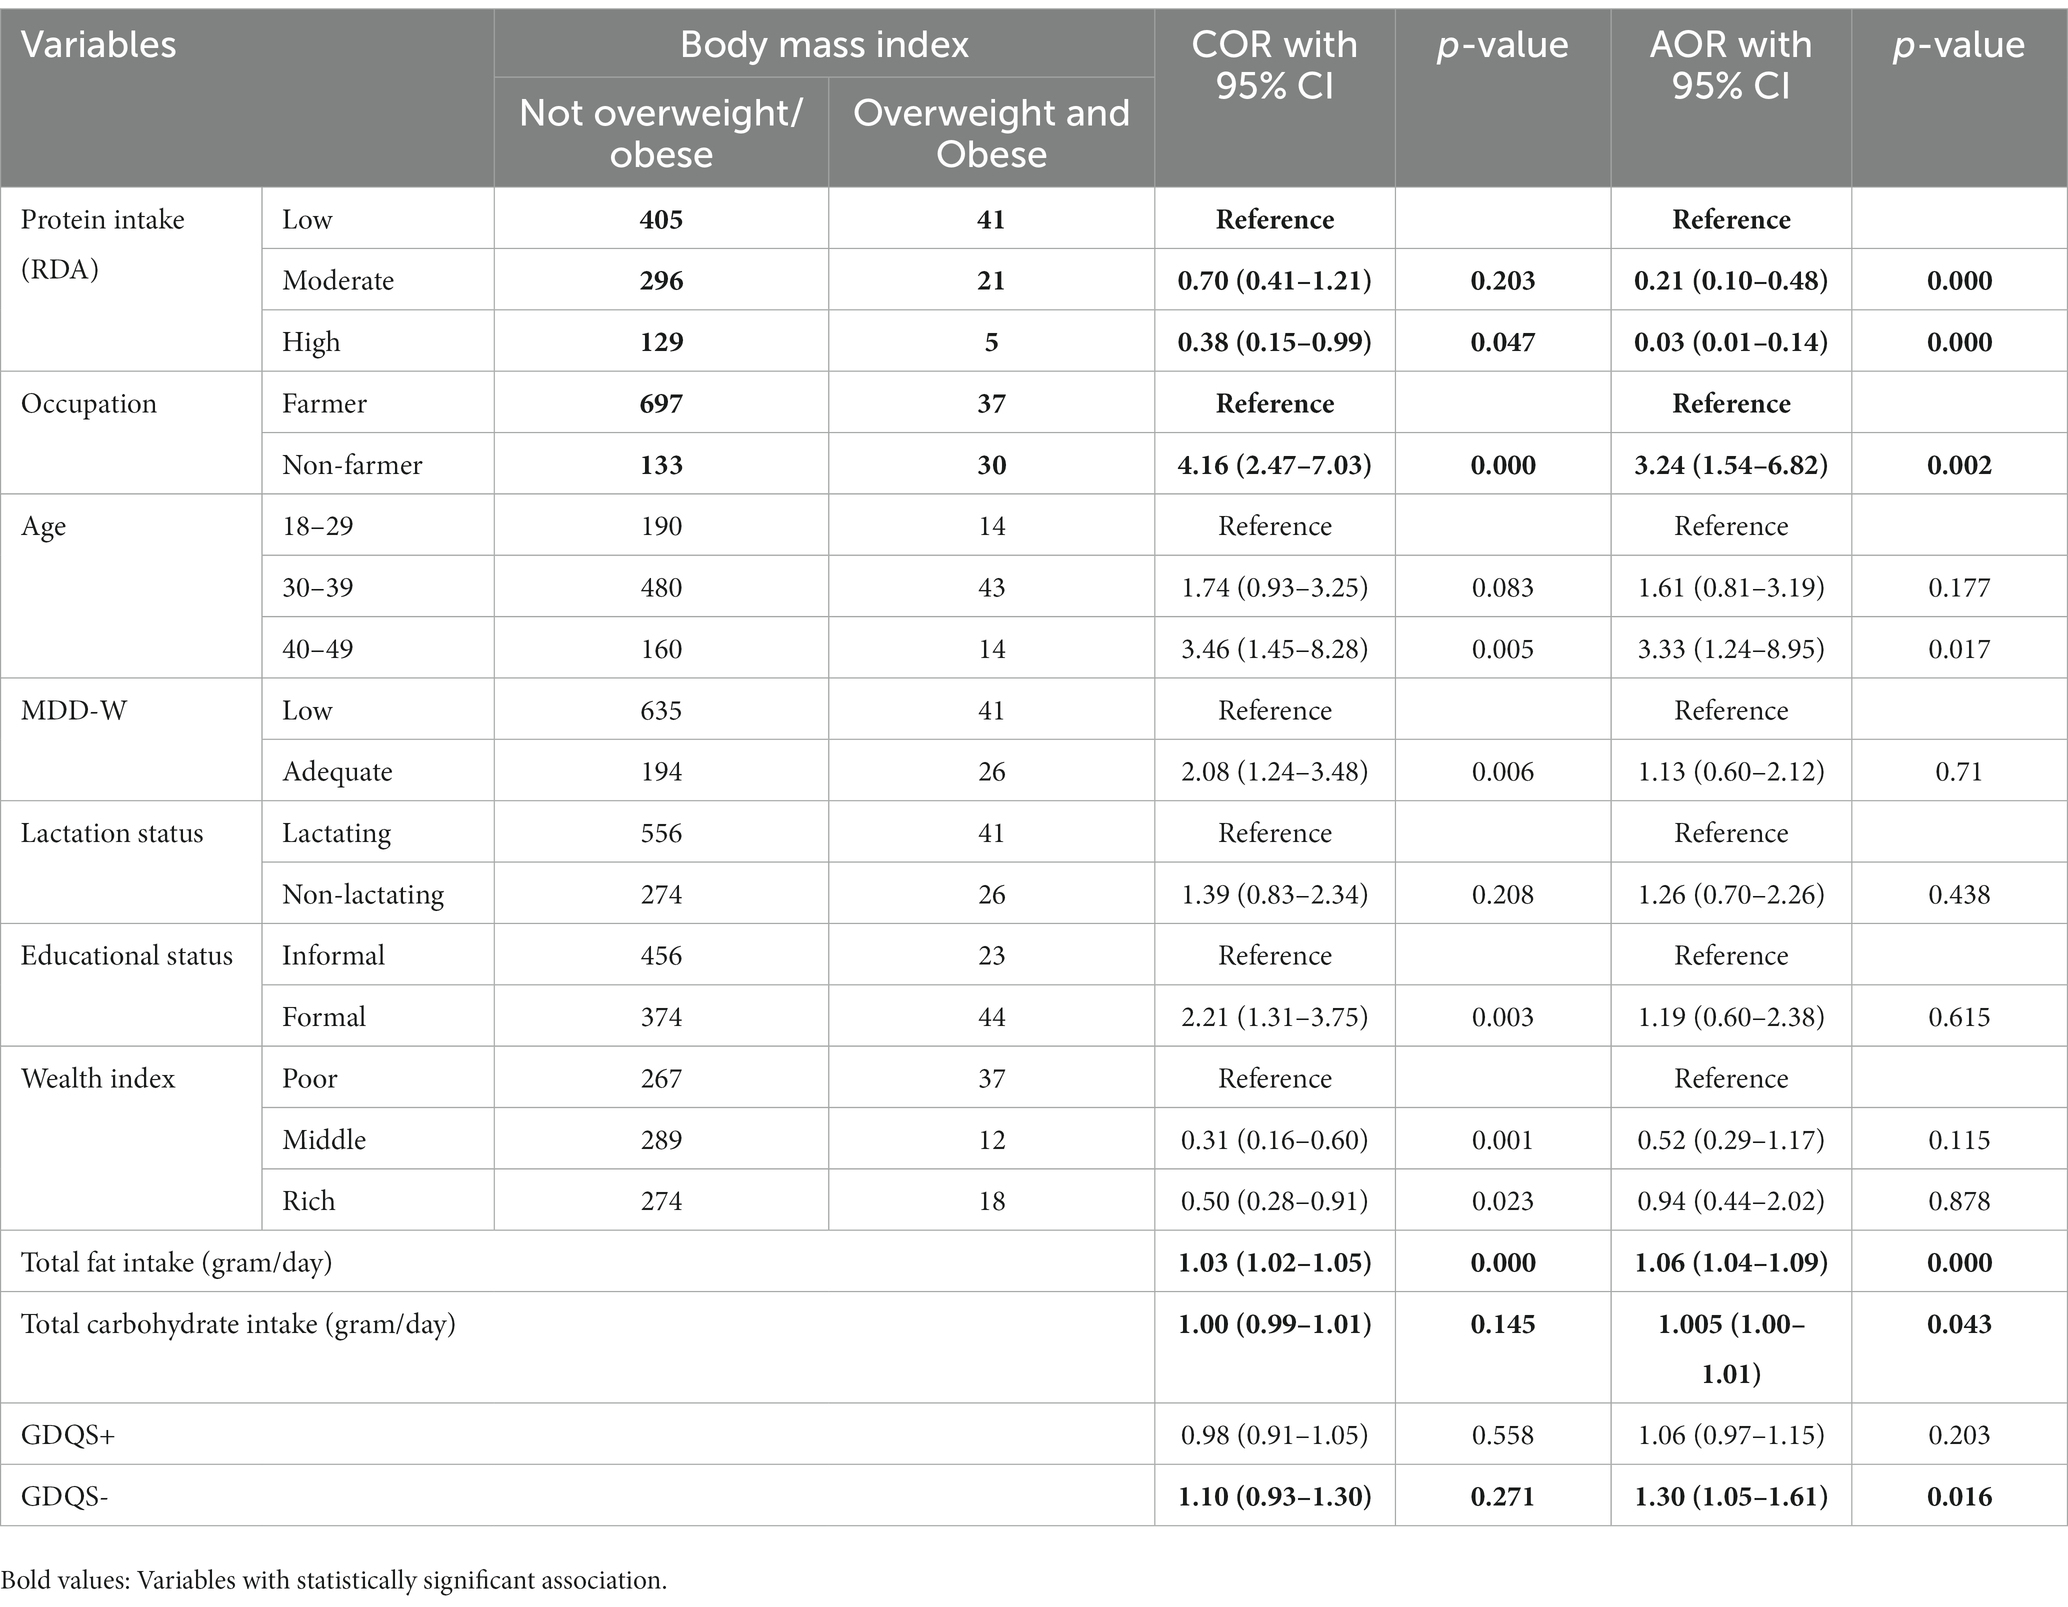
Table 3. Association of protein intake with overweight and obesity while controlling for MDD-W, GDQS, sociodemographic, and other variables in Kersa, 2019.
Discussion
This study found that 7.5% of reproductive-age women in Kersa were overweight and obese. The recommended minimum dietary diversity of five or more food groups out of 10 per day was achieved by only 24.5% of women. Global Diet Quality Scores show 28, 70.8, and 1.2% of participants had a low, moderate, and high risk of nutrient adequacy and diet-related non-communicable diseases. Being overweight and obese was inversely associated with dietary protein intake per kilogram of body weight in adjusted models. Similarly, advancing age, non-farmers, higher consumption of food from unhealthy groups, and high fat intake were associated with overweight and obesity. Lastly, the study identified moderate dietary protein intake, non-farming occupation, middle age, better education, and wealth determinants of adequate diversity score.
The predominantly rural Kersa HDSS exhibited a higher prevalence of overweight and obesity (7.5%) among women of reproductive age compared to the national prevalence of 4% for rural residents in Ethiopia in 2016 (43). Notably, reports indicate a consistent rise in the prevalence of overweight and obesity in this age group, increasing from 3% in 2000 to 8% in 2016 in Ethiopia (44). The prevalence of overweight and obesity reached an alarming level in some developing countries such as 50.4% in Tanzania (45), 35.2% in Bangladesh (46), and 55.20% in Brazil (47). This shows the urgent need for targeted interventions and policies to address this growing issue and improve the health outcomes of women and their children.
In the current study, moderate and higher dietary protein intake is associated with low BMI among women of reproductive age. This is in line with similar studies that the consumption of high-protein diets produced more significant weight loss, lower BMI, loss of fat mass, and preserved lean mass compared with the consumption of normal-protein diets (48, 49). Unlike high fat and high carbohydrates (50), high protein intake, especially plant-based, does not result in excess energy and weight gain (51). Dietary protein is protective against overweight and obesity because it promotes satiety, energy expenditure and changes body composition in favor of fat-free body mass (52). However, the majority of reproductive age women in Kersa experience energy deficiency, which can be attributed to factors such as low socio-economic status, limited access to nutritious and diverse food options, and inadequate access to clean water and sanitation facilities. These factors can compromise the health and energy levels of women.
This study revealed that total carbohydrate intake has a weak but positive association with overweight and obesity among women of reproductive age. In this rural area, three fourth of energy was derived from carbohydrates such as foods made from cereals. However, in the body of the literature, there are controversies in selecting carbohydrates for weight reduction and reducing the risk of NCDs (53). On the other hand, a combination of low carbohydrates and high protein is emerging as an intervention to reduce body weight (54). Consistent with a critical review, women who consumed higher protein diets were less likely to be overweight and obese (55). This is due to high protein diets causing an increase in thermogenesis, decrease in fat absorption, and increase in fecal fat excretion (dairy products) or altering the intake of other nutrients, including carbohydrates and fats (56).
According to this study, the median dietary protein consumption for women in Kersa was found to be 0.8 grams per kilogram of body weight per day. This is slightly lower than the World Health Organization’s recommendation of 0.83 grams per kilogram of body weight per day to meet the needs of 97.5% of a healthy adult population. The study also found that lactating mothers in Kersa had slightly lower average daily dietary protein and energy intake compared to non-lactating women. This is in contrast to the WHO’s recommendation that lactating women should consume an additional 19 grams of protein per day in the first 6 months postpartum and 12.5 grams of protein per day after 6 months (57). Additionally, breastfeeding women are advised to consume an extra 500 kilocalories per day to compensate for the energy cost of lactation, in addition to the recommended energy intake for non-pregnant women (58).
The GDQS and dietary diversity are two important factors that are often associated with overweight and obesity. In Kersa, a unit increase in the consumption of food groups categorized as unhealthy or unhealthy in excessive amounts (GDQS-), increased the likelihood of overweight and obesity in 30% but dietary diversity was not associated with overweight and obesity. This is compatible with other similar studies (59, 60). However, some studies shows that higher dietary diversity increases the odds of obesity and overweight (61–63). It is important to be cautious when promoting health messages to the community, as consuming energy-dense foods from a variety of groups can lead to weight gain and obesity. On the other hand, women with lower are more likely to be overweight or obese, while those with higher GDQS have a lower risk (20, 59). Therefore, it is important to strike a balance between a high GDQS and appropriate dietary diversity in order to maintain a healthy weight and prevent overweight and obesity.
This study has provided valuable insights into the dietary protein intake and body mass index of reproductive-age women in Kersa. However, it is important to acknowledge that there are limitations to this study. Like all cross-sectional designs, it does not allow for causal inferences to be made. Therefore, future longitudinal studies should be conducted to examine dietary protein intake, as well as other macronutrients, energy intake, diet quality, and the entire range of body mass index in a similar population. Additionally, it is crucial to consider other factors such as lifestyle and behaviors, as the complex etiology of obesity cannot be fully explained by dietary protein intake alone. Lastly, it is worth noting that the Ethiopian food composition table did not include all the food items consumed in Kersa, so the Tanzanian food composition table was also used for missing food items. This may result in some differences in nutrient content between the two countries.
Conclusions and recommendations
The study indicated an inverse relationship between body mass index (BMI) and dietary protein intake. It also revealed that women who consumed foods from unhealthy or unhealthy when consumed in excessive amount group were more likely to be overweight or obese. By increasing dietary protein consumption, reproductive age women can minimize the odds of becoming obese or overweight. Furthermore, it is crucial to implement interventions that encompass community-based educational programs that promote healthy eating, policy that support healthy food choices and increase accessibility of protein rich foods, and healthcare services to provide regular health screenings for women to identify underlying health concerns related to weight management and offer personalized guidance on incorporating dietary protein into their diets.
Data availability statement
The original contributions presented in the study are included in the article/Supplementary material, further inquiries can be directed to the corresponding author.
Ethics statement
The studies involving humans were approved by Institutional Health Research and Ethics Review Committee of College of Health and Medical Sciences, Haramaya University. The studies were conducted in accordance with the local legislation and institutional requirements. The participants provided their written informed consent to participate in this study.
Author contributions
AR: Conceptualization, Data curation, Formal analysis, Investigation, Methodology, Project administration, Resources, Software, Supervision, Validation, Visualization, Writing – original draft, Writing – review & editing. NA: Conceptualization, Data curation, Funding acquisition, Investigation, Methodology, Project administration, Resources, Software, Supervision, Validation, Visualization, Writing – review & editing. KR: Conceptualization, Data curation, Investigation, Methodology, Software, Supervision, Validation, Visualization, Writing – review & editing. YD: Conceptualization, Data curation, Investigation, Software, Supervision, Validation, Writing – review & editing. EH: Conceptualization, Data curation, Investigation, Methodology, Software, Validation, Visualization, Writing – review & editing. WF: Conceptualization, Data curation, Funding acquisition, Investigation, Methodology, Software, Supervision, Validation, Visualization, Writing – review & editing.
Funding
The author(s) declare that no financial support was received for the research, authorship, and/or publication of this article.
Conflict of interest
The authors declare that the research was conducted in the absence of any commercial or financial relationships that could be construed as a potential conflict of interest.
Publisher’s note
All claims expressed in this article are solely those of the authors and do not necessarily represent those of their affiliated organizations, or those of the publisher, the editors and the reviewers. Any product that may be evaluated in this article, or claim that may be made by its manufacturer, is not guaranteed or endorsed by the publisher.
Supplementary material
The Supplementary material for this article can be found online at: https://www.frontiersin.org/articles/10.3389/fpubh.2023.1258515/full#supplementary-material
Abbreviations
AOR, Adjusted Odds Ration; BMI, Body Mass Index; CI, Confidence Interval; DALYs, Disability-adjusted life years; FFQ, EFCT, Ethiopia Food Composition Table; Food Frequency Questionnaire; GDQS, Global Diet Quality Score; IQR, Interquartile Range; MDD-W, Minimum Dietary Diversity for Women; NCD, Non-Communicable Disease; RDA, Recommended Dietary Allowance; ASP, Animal-source proteins
References
1. Miller, V, Webb, P, Micha, R, and Mozaffarian, D. Defining diet quality: a synthesis of dietary quality metrics and their validity for the double burden of malnutrition. Lancet Planet Health. (2020) 4:e352–70. doi: 10.1016/S2542-5196(20)30162-5
2. Gakidou, E, Afshin, A, Abajobir, AA, Abate, KH, Abbafati, C, Abbas, KM, et al. Global, regional, and national comparative risk assessment of 84 behavioural, environmental and occupational, and metabolic risks or clusters of risks, 1990–2016: a systematic analysis for the global burden of disease study 2016. Lancet. (2017) 390:1345–422. doi: 10.1016/S0140-6736(17)32366-8
3. Health HTcSoP (2023). The best diet: quality counts. Available at: https://www.hsph.harvard.edu/nutritionsource/healthy-weight/best-diet-quality-counts/
4. CDC (2023). Poor nutrition: National Center for Chronic Disease Prevention and Health Promotion (NCCDPHP). Available at: https://www.cdc.gov/chronicdisease/resources/publications/factsheets/nutrition.htm#:~:text=Consuming%20unhealthy%20food%20and%20beverages,in%20postmenopausal%20women%2C%20and%20colorectal
5. Singh, RB, Isaza, A, Fatima, G, Maheshwari, A, Verma, N, Joshi, S, et al. The twelve fundamental dimensions of a high quality indo-Mediterranean diet. Scr Med. (2023) 54:1–7. doi: 10.5937/scriptamed54-42288
6. Singh, RB, Takahashi, T, Fatima, G, Horiuchi, R, Fedacko, J, Huzova, Z, et al. Effects of antioxidant-rich indo-mediterranean foods on pre-heart failure: results from the Meta-analysis of randomized controlled trials. J Inflamm. (2020) 8:1–6. doi: 10.2174/1875041902008010001
7. Bromage, S, Batis, C, Bhupathiraju, SN, Fawzi, WW, Fung, TT, Li, Y, et al. Development and validation of a novel food-based global diet quality score (GDQS). J Nutr. (2021) 151:75S–92S. doi: 10.1093/jn/nxab244
8. Fung, TT, Li, Y, Bromage, S, Bhupathiraju, SN, Batis, C, Fawzi, W, et al. Higher global diet quality score is associated with less 4-year weight gain in US women. J Nutr. (2021) 151:162S–7S. doi: 10.1093/jn/nxab170
9. Fallaize, R, Livingstone, KM, Celis-Morales, C, Macready, AL, San-Cristobal, R, Navas-Carretero, S, et al. Association between diet-quality scores, adiposity, total cholesterol and markers of nutritional status in European adults: findings from the Food4Me study. Nutrients. (2018) 10:49. doi: 10.3390/nu10010049
10. George, SM, Ballard-Barbash, R, Manson, JE, Reedy, J, Shikany, JM, Subar, AF, et al. Comparing indices of diet quality with chronic disease mortality risk in postmenopausal women in the Women's Health Initiative observational study: evidence to inform national dietary guidance. Am J Epidemiol. (2014) 180:616–25. doi: 10.1093/aje/kwu173
11. Ng, M, Fleming, T, Robinson, M, Thomson, B, Graetz, N, Margono, C, et al. Global, regional, and national prevalence of overweight and obesity in children and adults during 1980–2013: a systematic analysis for the global burden of disease study 2013. Lancet. (2014) 384:766–81. doi: 10.1016/S0140-6736(14)60460-8
12. Organization WH. World Health Organization factsheets, obesity and overweight, 2017. Geneva: WHO (2017).
13. Amugsi, DA, Dimbuene, ZT, Mberu, B, Muthuri, S, and Ezeh, AC. Prevalence and time trends in overweight and obesity among urban women: an analysis of demographic and health surveys data from 24 African countries, 1991–2014. BMJ Open. (2017) 7:e017344. doi: 10.1136/bmjopen-2017-017344
14. Dai, H, Alsalhe, TA, Chalghaf, N, Riccò, M, Bragazzi, NL, and Wu, J. The global burden of disease attributable to high body mass index in 195 countries and territories, 1990–2017: an analysis of the global burden of disease study. PLoS Med. (2020) 17:e1003198. doi: 10.1371/journal.pmed.1003198
15. Knight, JA. Diseases and disorders associated with excess body weight. Ann Clin Lab Sci. (2011) 41:107–21.
16. Organization WH. Global health risks: Mortality and burden of disease attributable to selected major risks. Geneva: World Health Organization (2009).
17. Mozaffarian, D, Hao, T, Rimm, EB, Willett, WC, and Hu, FB. Changes in diet and lifestyle and long-term weight gain in women and men. N Engl J Med. (2011) 364:2392–404. doi: 10.1056/NEJMoa1014296
18. Moslehi, N, Ehsani, B, Mirmiran, P, Hojjat, P, and Azizi, F. Association of dietary proportions of macronutrients with visceral adiposity index: non-substitution and iso-energetic substitution models in a prospective study. Nutrients. (2015) 7:8859–70. doi: 10.3390/nu7105436
19. Yeshaw, Y, Kebede, SA, Liyew, AM, Tesema, GA, Agegnehu, CD, Teshale, AB, et al. Determinants of overweight/obesity among reproductive age group women in Ethiopia: multilevel analysis of Ethiopian demographic and health survey. BMJ Open. (2020) 10:e034963. doi: 10.1136/bmjopen-2019-034963
20. Bromage, S, Andersen, CT, Tadesse, AW, Passarelli, S, Hemler, EC, Fekadu, H, et al. The global diet quality score is associated with higher nutrient adequacy, midupper arm circumference, venous hemoglobin, and serum folate among urban and rural Ethiopian adults. J Nutr. (2021) 151:130S–42S. doi: 10.1093/jn/nxab264
21. Kalam, F, Gabel, K, Wiseman, E, and Varady, K. Alternate day fasting combined with a high protein/low carbohydrate diet: effect on body weight and metabolic disease risk factors in obese adults (P21-018-19). Current developments. Nutrition. (2019) 3:nzz041. doi: 10.1093/cdn/nzz041.P21-018-19
22. Frestedt, JL, Zenk, JL, Kuskowski, MA, Ward, LS, and Bastian, ED. A whey-protein supplement increases fat loss and spares lean muscle in obese subjects: a randomized human clinical study. Nutr Metab. (2008) 5:1–7. doi: 10.1186/1743-7075-5-8
23. Richter, CK, Skulas-Ray, AC, Champagne, CM, and Kris-Etherton, PM. Plant protein and animal proteins: do they differentially affect cardiovascular disease risk? Adv Nutr. (2015) 6:712–28. doi: 10.3945/an.115.009654
24. De Vries-Ten, HJ, Owolabi, A, Steijns, J, Kudla, U, and Melse-Boonstra, A. Protein intake adequacy among Nigerian infants, children, adolescents and women and protein quality of commonly consumed foods. Nutr Res Rev. (2020) 33:102–20. doi: 10.1017/S0954422419000222
25. Aubertin-Leheudre, M, and Adlercreutz, H. Relationship between animal protein intake and muscle mass index in healthy women. Br J Nutr. (2009) 102:1803–10. doi: 10.1017/S0007114509991310
26. Neumann, C, Harris, DM, and Rogers, LM. Contribution of animal source foods in improving diet quality and function in children in the developing world. Nutr Res. (2002) 22:193–220. doi: 10.1016/S0271-5317(01)00374-8
27. Shang, X, Scott, D, Hodge, A, English, DR, Giles, GG, Ebeling, PR, et al. Dietary protein from different food sources, incident metabolic syndrome and changes in its components: an 11-year longitudinal study in healthy community-dwelling adults. Clin Nutr. (2017) 36:1540–8. doi: 10.1016/j.clnu.2016.09.024
28. Iwamoto, M, Yagi, K, Yazumi, K, Komine, A, Shirouchi, B, and Sato, M. Eating a healthy lunch improves serum alanine aminotransferase activity. Lipids Health Dis. (2013) 12:1–7. doi: 10.1186/1476-511X-12-134
29. Hoffmann, K, Boeing, H, Dufour, A, Volatier, J, Telman, J, Virtanen, M, et al. Estimating the distribution of usual dietary intake by short-term measurements. Eur J Clin Nutr. (2002) 56:S53–62. doi: 10.1038/sj.ejcn.1601429
30. Assefa, N, Oljira, L, Baraki, N, Demena, M, Zelalem, D, Ashenafi, W, et al. HDSS profile: the Kersa health and demographic surveillance system. Int J Epidemiol. (2016) 45:94–101. doi: 10.1093/ije/dyv284
31. Beasley, JM, Deierlein, A, Morland, K, Granieri, E, and Spark, A. Is meeting the recommended dietary allowance (RDA) for protein related to body composition among older adults?: results from the cardiovascular health of seniors and built environment study. J Nutr Health Aging. (2016) 20:790–6. doi: 10.1007/s12603-015-0707-5
32. Assefa, N, Abdullahi, YY, Abraham, A, Hemler, EC, Madzorera, I, Dessie, Y, et al. Consumption of dietary folate estimates and its implication for reproductive outcome among women of reproductive age in Kersa: cross-sectional survey. BMC Nutr. (2021) 7:69. doi: 10.1186/s40795-021-00476-6
33. Faul, F, Erdfelder, E, Lang, A-G, and Buchner, A. G* power 3: a flexible statistical power analysis program for the social, behavioral, and biomedical sciences. Behav Res Methods. (2007) 39:175–91. doi: 10.3758/BF03193146
34. Agren, G, and Gibson, RS. Food composition table for use in Ethiopia. Bokhandel: Almövist & Wiksell (1969).
35. Lukmanji, Z, Hertzmark, E, Mlingi, N, Assey, V, Ndossi, G, and Fawzi, W. Tanzania food composition tables. Dar Es Salaam: MUHAS-TFNC (2008).
36. Allowances, RD. Recommended dietary allowances. Washington, DC: National Research Council-National Academy Press (1989).
37. Institute of Medicine, Food and Nutrition Board, Standing Committee on the Scientific Evaluation of Dietary Reference Intakes, Subcommittee on Interpretation and Uses of Dietary Reference Intakes, Subcommittee on Upper Reference Levels of Nutrients, Panel on the Definition of Dietary Fiber. Dietary reference intakes for energy, carbohydrate, Fiber, fat, fatty acids, cholesterol, protein, and amino acids (macronutrients): National Academy of Sciences. J Am Diet Assoc. (2005) 102:1621–30. doi: 10.1016/s0002-8223(02)90346-9
38. Jun, S, Cowan, AE, Dwyer, JT, Campbell, WW, Thalacker-Mercer, AE, Gahche, JJ, et al. Dietary protein intake is positively associated with appendicular lean mass and handgrip strength among middle-aged US adults. J Nutr. (2021) 151:3755–63. doi: 10.1093/jn/nxab288
39. Project I. Data4Diets: Building blocks for diet-related food security analysis. Arlington, VA: USAID Advancing Nutrition (2018).
40. Meyers, LD, Hellwig, JP, and Otten, JJ. Dietary reference intakes: The essential guide to nutrient requirements. Washington, DC: National Academies Press (2006).
41. StataCorp, L. Stata statistical software: Release, vol. 16. College Station, TX: StataCorp (2019).
42. National Research Council, Commission on Life Sciences, Food and Nutrition Board. Subcommittee on the tenth edition of the recommended dietary Allowances. Recommended DIETARY Allowances: 10th edition (DIETARY REFERENCE INTAKES). 10th ed. Washington, DC: National Academies Press (1989).
43. Mengesha Kassie, A, Beletew Abate, B, and Wudu, KM. Education and prevalence of overweight and obesity among reproductive age group women in Ethiopia: analysis of the 2016 Ethiopian demographic and health survey data. BMC Public Health. (2020) 20:1–11. doi: 10.1186/s12889-020-08941-w
44. Central Statistical Agency (CSA) [Ethiopia], ICF. Ethiopia Demographic and Health Survey. Addis Ababa, Ethiopia, and Rockville, Maryland: CSA and ICF (2016).
45. Mosha, D, Paulo, HA, Mwanyika-Sando, M, Mboya, IB, Madzorera, I, Leyna, GH, et al. Risk factors for overweight and obesity among women of reproductive age in Dar Es Salaam, Tanzania. BMC Nutr. (2021) 7:1–10. doi: 10.1186/s40795-021-00445-z
46. Ahammed, B, Sarder, MA, Kundu, S, Keramat, SA, and Alam, K. Multilevel exploration of individual-and community-level factors contributing to overweight and obesity among reproductive-aged women: a pooled analysis of Bangladesh demographic and health survey, 2004–2018. Public Health Nutr. (2022) 25:2074–83. doi: 10.1017/S1368980022001124
47. Lyrio, AO, Souza, ES, Conceição, SDS, Batista, JE, Brito, SM, Gomes Filho, IS, et al. Prevalence of overweight and obesity and associated factors among women of childbearing age in Brazil. Public Health Nutr. (2021) 24:5481–90. doi: 10.1017/S1368980021000409
48. Hemler, EC, Bromage, S, Tadesse, AW, Zack, R, Berhane, Y, Canavan, CR, et al. Associations of percentage energy intake from total, animal and plant protein with overweight/obesity and underweight among adults in Addis Ababa. Ethiopia Public Health Nutr. (2022) 25:3107–20. doi: 10.1017/S1368980022001100
49. Westerterp-Plantenga, MS, Lemmens, SG, and Westerterp, KR. Dietary protein - its role in satiety, energetics, weight loss and health. Br J Nutr. (2012) 108:S105–12. doi: 10.1017/S0007114512002589
50. Austin, GL, Ogden, LG, and Hill, JO. Trends in carbohydrate, fat, and protein intakes and association with energy intake in normal-weight, overweight, and obese individuals: 1971-2006. Am J Clin Nutr. (2011) 93:836–43. doi: 10.3945/ajcn.110.000141
51. Adams, SH. Emerging perspectives on essential amino acid metabolism in obesity and the insulin-resistant state. Adv Nutr. (2011) 2:445–56. doi: 10.3945/an.111.000737
52. Drummen, M, Tischmann, L, Gatta-Cherifi, B, Adam, T, and Westerterp-Plantenga, M. Dietary protein and energy balance in relation to obesity and co-morbidities. Front Endocrinol (Lausanne). (2018) 9:443. doi: 10.3389/fendo.2018.00443
53. Naude, CE, Brand, A, Schoonees, A, Nguyen, KA, Chaplin, M, and Volmink, J. Low-carbohydrate versus balanced-carbohydrate diets for reducing weight and cardiovascular risk. Cochrane Database Syst Rev. (2022) 2022:CD013334. doi: 10.1002/14651858.CD013334.pub2
54. Hession, M, Rolland, C, Kulkarni, U, Wise, A, and Broom, J. Systematic review of randomized controlled trials of low-carbohydrate vs. low-fat/low-calorie diets in the management of obesity and its comorbidities. Obes Rev. (2009) 10:36–50. doi: 10.1111/j.1467-789X.2008.00518.x
55. Halton, TL, and Hu, FB. The effects of high protein diets on thermogenesis, satiety and weight loss: a critical review. J Am Coll Nutr. (2004) 23:373–85. doi: 10.1080/07315724.2004.10719381
56. Cao, YJ, Wang, HJ, Zhang, B, Qi, SF, Mi, YJ, Pan, XB, et al. Associations of fat and carbohydrate intake with becoming overweight and obese: an 11-year longitudinal cohort study. Br J Nutr. (2020) 124:715–28. doi: 10.1017/S0007114520001579
57. WHO, FAO, UNU. Protein and amino acid requirements in human nutrition. World Health Organ Tech Rep Ser. (2007) 935:1–265.
59. Paulo, HA, Mosha, D, Mwanyika-Sando, M, Mboya, IB, Madzorera, I, Killewo, J, et al. Role of dietary quality and diversity on overweight and obesity among women of reproductive age in Tanzania. PLoS One. (2022) 17:e0266344. doi: 10.1371/journal.pone.0266344
60. Salehi-Abargouei, A, Akbari, F, Bellissimo, N, and Azadbakht, L. Dietary diversity score and obesity: a systematic review and meta-analysis of observational studies. Eur J Clin Nutr. (2016) 70:1–9. doi: 10.1038/ejcn.2015.118
61. Jayawardena, R, Byrne, NM, Soares, MJ, Katulanda, P, Yadav, B, and Hills, AP. High dietary diversity is associated with obesity in Sri Lankan adults: an evaluation of three dietary scores. BMC Public Health. (2013) 13:314. doi: 10.1186/1471-2458-13-314
62. Mohajeri, M, Hoojeghani, S, Pourfarzi, F, Ghahremanzadeh, M, and Barzegar, A. Association between dietary diversity and obesity in Ardebil adults: a case-control study. Nutr Food Sci. (2020) 50:555–67. doi: 10.1108/NFS-04-2019-0118
Keywords: protein intake, obesity, overweight, MDD-W, global dietary quality score, reproductive age women, Ethiopia
Citation: Roba AA, Assefa N, Roba KT, Dessie Y, Hamler E and Fawzi W (2023) Association between dietary protein intake, diet quality and diversity, and obesity among women of reproductive age in Kersa, Ethiopia. Front. Public Health. 11:1258515. doi: 10.3389/fpubh.2023.1258515
Edited by:
Corinna May Walsh, University of the Free State, South AfricaReviewed by:
Emmanuel Osei Bonsu, Kwame Nkrumah University of Science and Technology, GhanaRenatha Pacific, Sokoine University of Agriculture, Tanzania
Copyright © 2023 Roba, Assefa, Roba, Dessie, Hamler and Fawzi. This is an open-access article distributed under the terms of the Creative Commons Attribution License (CC BY). The use, distribution or reproduction in other forums is permitted, provided the original author(s) and the copyright owner(s) are credited and that the original publication in this journal is cited, in accordance with accepted academic practice. No use, distribution or reproduction is permitted which does not comply with these terms.
*Correspondence: Aklilu Abrham Roba, YWtsaWx0aW1uYXRoc2VyYWhAZ21haWwuY29t