 Habtamu Demelash Enyew
 Abebe Beyene Hailu
 Seid Tiku Mereta
- 1Department of Public Health, College of Health Sciences, Debre Tabor University, Gondar, Ethiopia
- 2Department of Environmental Health Science and Technology, Institution of Health, Jimma University, Jimma, Ethiopia
Background: Combustion of solid biomass fuels using traditional stoves which is the daily routine for 3 billion people emits various air pollutants including fine particulate matter which is one of the widely recognized risk factors for various cardiorespiratory and other health problems. But, there is only limited evidences of kitchen PM2.5 concentrations in rural Ethiopia.
Objective: This study is aimed to estimate the 24-h average kitchen area concentrations of PM2.5 and to identify associated factors in rural households of northwest Ethiopia.
Method: The average kitchen area PM2.5 concentrations were measured using a low-cost light-scattering Particle and Temperature Sensor Plus (PATS+) for a 24-h sampling period. Data from the PATS+ was downloaded in electronic form for further analysis. Other characteristics were collected using face-to-face interviews. Independent sample t-test and one-way analysis of variance were used to test differences in PM2.5 concentrations between and among various characteristics, respectively.
Result: Mixed fuels were the most common cooking biomass fuel. The 24-h average kitchen PM2.5 concentrations was estimated to be 405 μg/m3, ranging from 52 to 965 μg/m3. The average concentrations were 639 vs. 336 μg/m3 (p < 0.001) in the thatched and corrugated iron sheet roof kitchens, respectively. The average concentration was also higher among mixed fuel users at 493 vs. 347 μg/m3 (p = 0.042) compared with firewood users and 493 vs. 233 μg/m3 (p = 0.007) as compared with crop residue fuel users. Statistically significant differences were also observed across starter fuel types 613 vs. 343 μg/m3 (p = 0.016) for kerosene vs. dried leaves and Injera baking events 523 vs. 343 μg/m3 (p < 0.001) for baked vs. not baked events.
Conclusion: The average kitchen PM2.5 concentrations in the study area exceeded the world health organization indoor air quality guideline value of 15 μg/m3 which can put pregnant women at greater risk and contribute to poor pregnancy outcomes. Thatched roof kitchen, mixed cooking fuel, kerosene fire starter, and Injera baking events were positively associated with high-level average kitchen PM2.5. concentration. Simple cost-effective interventions like the use of chimney-fitted improved stoves and sensitizing women about factors that aggravate kitchen PM2.5 concentrations could reduce kitchen PM 2.5 levels in the future.
Introduction
Every day, nearly 3 billion people rely on solid biomass fuels (wood, dung, plant leaves, and charcoal) to cook their foods and to provide heat and light (1–3). Burning of these solid biomass fuels with open fires or inefficient stoves results in large amounts of health-damaging pollutants including a multitude of complex particulate matter and carbon monoxide (4–6) that exceed world health organization (WHO) air quality guidelines (24-h mean PM2.5 concentrations of 15 μg/m3) (7). Based on WHO report, in regions where solid biomass fuels are widely used, average levels of PM2.5 were very high in kitchens 972 μg/m3 and for personal exposure of women 267 μg/m3 (8). In Africa, especially in the east, west, central, and southern parts of the continent, an estimated three-fourths of the population relies on solid biomass fuels for cooking and is exposed to high concentrations of harmful pollutants at home every day (3, 9).
In Ethiopia, more than 95% of the population used solid biomass fuels for cooking and were exposed to kitchen smoke which is typical for low-income countries (10, 11). Evidences from rural Ethiopia showed that women, girls, and children at early age were exposed to extremely high levels of PM2.5 (12–14). Previous studies also reported 24-h average particulate matter concentrations of 818 ug/m3 in slum areas of Addis Ababa, 1,297 ug/m3 in three regions (Amhara, Oromia, and South Nation Nationalities and People) of Ethiopia, 772 μg/m3 in Wolaita Sodo town and 410 ug/m3 in Butajira town (13–16) all exceeded 24-h WHO safety level (17). As previously reported, these differences in concentrations may be due to differences in fuel and kitchen types, measuring devices, sampling seasons, and cooking patterns within households (13, 18–20).
Epidemiological studies are also increasingly showing that exposure to high levels of indoor air pollution from biomass fuel use kills millions and is a major contributor to global climate change (4–6). Household air pollution (HAP) contributed to more than 3.2 million annual premature deaths and 91.5 million disability-adjusted life years (DALYs) worldwide with a clear geographical variation where the majority of the burden is found in southeast Asia and sub-Saharan Africa (21–23). In 2019, air pollution was responsible for 1.1 million deaths across Africa, with more than half of those fatalities associated with household pollutants (24). Pneumonia and stroke are the leading causes of premature death due to HAP (3, 22, 23). About 400,000 children under 5 years old die each year as a result of HAP, primarily in sub-Saharan Africa and Asia (25).
In addition to detrimental cardiovascular effects, growing evidence shows potential perinatal risks associated with solid biomass burning (26–28). Adverse pregnancy outcomes such as low birth weight (LBW), pre-term birth (PTB), intrauterine growth restriction, and post-neonatal infant mortality are associated with biomass fuel smoke exposure (29). Fetuses are the most vulnerable stage to air pollution due to susceptibility at early ages (30, 31). In 2019, more than 100,000 deaths and 11.3 million DALYs related to preterm birth worldwide (66% in western sub-Saharan Africa and south Asia) were caused by excess PM2.5, of which nearly two-thirds of them were attributable to household particulate matters PM2.5 (32).
According to the local burden of disease estimate in Ethiopia, exposure to HAP from solid biomass fuel use was the second highest risk factor for child pneumonia deaths next to child malnutrition (33). The available local epidemiological studies have reported strong correlations between elevated PM2.5 levels and acute respiratory infections (ARIs) among under-five children (16, 34–36). In Adama (southeast Ethiopia), HAP causes premature death and a significant number of DALYs due to biomass fuel use among women (37). Other existing evidences in Ethiopia revealed that the prevalence of acute respiratory infection including pneumonia among under-five children in households using solid biomass fuel remains high, ranging from 8 to 30 percent (34, 38–40).
Research on kitchen area concentration of particulate matter is limited in Ethiopia. Even the available evidences reported different results due to differences in the technologies used in the measurements, the sampling period, the study area (urban vs. rural), the season of measurements (dry vs. wet), the fuel and kitchen types, housing conditions, and other characteristics. Therefore, measuring local kitchen PM2.5 concentrations and understanding different factors that influence kitchen particle concentration can inform measures to maximize the effectiveness of various interventions.
Methods and materials
Study setting
This study was conducted in a low-income rural community of the south Gondar zone, northwest Ethiopia as part of the ongoing stove intervention study. Pregnant women were recruited from six kebeles (the smallest administrative unit) of the Guna–Tana integrated field research and development center catchment area. The field research center was established in 2013 by Debre Tabor University to integrate education, research, and community services. It is located 650 km away from the capital city of Ethiopia, Addis Ababa, toward northwest Ethiopia and 105 km far away from the capital city of Amhara regional state, Bahir Dar. Solid biomass fuel is exclusively a household energy source for cooking with traditional three-stone stoves in the study area. Kebeles in the two ecological zones (cold and temperate) were included to represent a diversity of characteristics expected to influence kitchen concentration of particulate matter including altitude, cooking practices, fuel types, and socioeconomic conditions. Tobacco smoking is uncommon and vehicle emission is almost negligible in the study community.
Study design and population
A cross-sectional data was analyzed using the baseline measurements from an ongoing improved stove randomized controlled field trial study1 to estimate PM2.5 concentrations in kitchens of pregnant women cooking with solid biomass fuel in traditional stoves. The study participants who fulfilled the eligibility criteria were randomly selected and recruited from households in the stove trial project. To be eligible and participate in this study, a pregnant woman must meet the following inclusion criteria: Aged 18–38 years, being the primary cook of the household, in her first or second-trimester gestation (gestational age ≤ 24 weeks), exclusively using the traditional biomass-fueled stove or locally modified mud stove and having enclosed cooking area separated from or attached to the main house. But, pregnant women who had the plan to move permanently outside the study area in the next 12 months and who are engaged in local alcohol production activities were excluded from the study.
Sample size
The number of households with eligible pregnant women for kitchen PM2.5 concentration measurement was determined based on standard conventional power calculations in the HAP intervention studies (41). These standard conventions include achieving a statistical power of 0.80, a value of p of 5% in two-tailed tests, and detecting a 64% HAP reduction due to an improved stove from a previous study (14). But, a reliable Ethiopia-based estimate of the coefficient of variation in HAP reduction was not available before our study to compute the minimum sample size. Therefore, a conservative COV estimate of 0.7 (41) was used which gave a minimum sample size of 43 households in each arm (a total of 86 households with pregnant women). Hence, all the baseline data collected from the upcoming stove trail study were analyzed for 86 randomly selected households.
Variable definitions and measurements
Kitchen
In this study, the kitchen is used to indicate all enclosed cooking spaces separated from or attached to the main house in rural households.
Kitchen types
There were two main kitchen types included in this study. The first one is a small thatched-roof kitchen near the main house. This type of kitchen had low-lying ceilings and very tightly enclosed walls resulting in the accumulation of dense biomass smoke during meal cooking due to the lack of an outlet at the highest part of the roof (Figure 1). The second kitchen is the small congrugated iron sheet(CIS) roof-enclosed kitchen with outlets between the wall and the roof for smoke removal (Figure 2).
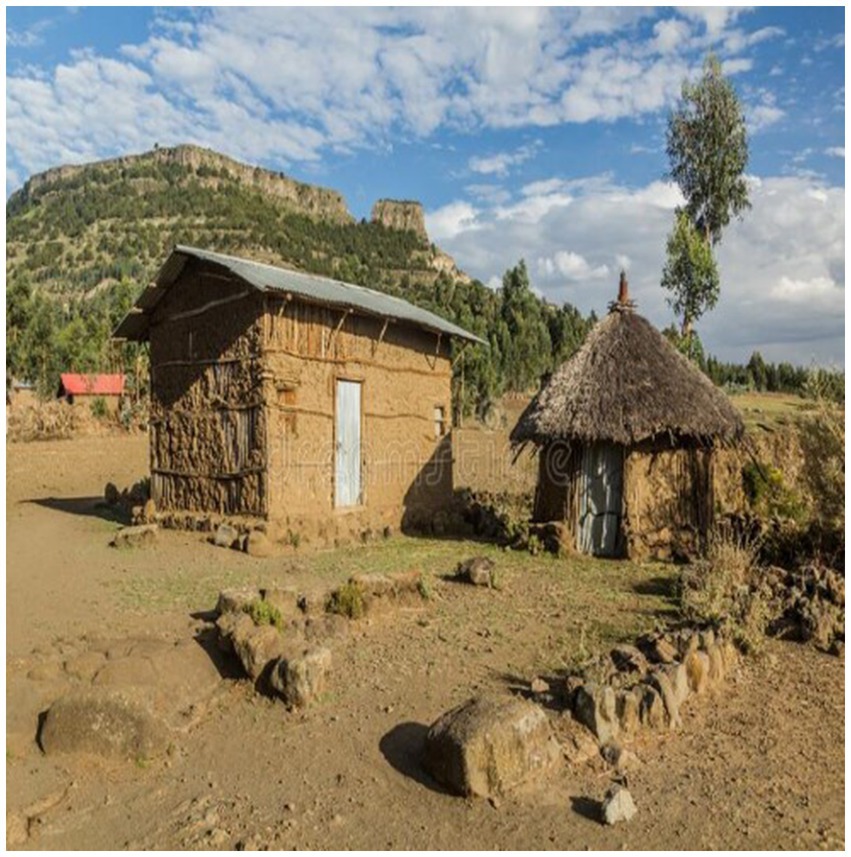
Figure 1. Small thatched roof kitchen near the main house.
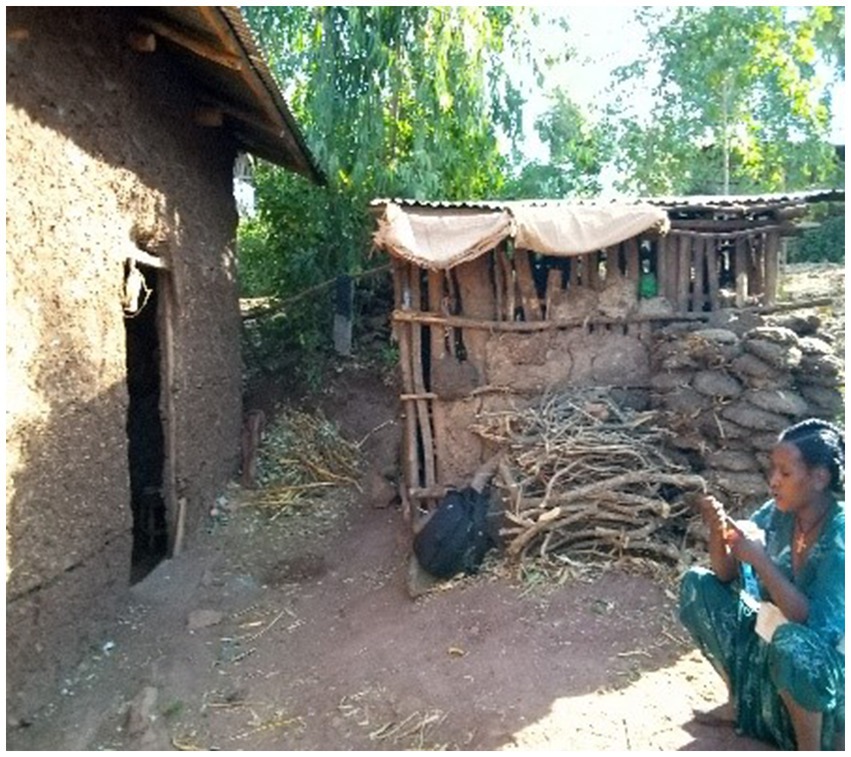
Figure 2. Small corrugated iron sheet roof kitchen near the main house.
PM2.5 concentrations
It is the daily average concentrations of PM2.5 calculated for the 24-h sampling period. Continuous PM2.5 measurements were done using PATS+ following standard protocol. In this study, the device logged particle concentration with a logging interval of 1 min.
Biomass fuel
Any plant or animal matter which when burned provide heat or light. The type of cooking fuel was re-categorized into three classes; (a) firewood (b) cow dung (c) agricultural residue and (d) mixed fuels (using two or more biomass fuels together).
Primary biomass fuel
It is the first fuel choice that is usually cheap and easily available in villages. It’s the primary practical option for rural households.
Family size
The total number of individuals permanently living in the household was assessed by recording all individuals (male, female, under-five children) and further categorized as (a) less than five individuals and (b) greater than or equal to five individuals. This classification was based on the average household size in Ethiopia reported by the Ethiopian Demography and health survey of 2016 (10).
Data collection procedures
Survey
All relevant baseline data were collected as part of an ongoing randomized controlled trial study. Face-to-face interviews using structured and pretested questionnaires and observational checklists were conducted by trained first-degree environmental health professionals in the local language (Amharic). The key data were collected on economic status (using the list of assets owned by the households), housing characteristics (floor, wall, roof, number of rooms, windows, and doors), kitchen characteristics (size, presence of windows, and location), fuel types, frequency of cooking, and frequency of Injera baking. Injera is the staple food in Ethiopia which is a flatbread-like pancake prepared from a tiny grain called Teff. Baking Injera is very energy-intensive to cook which uses approximately 50% of the energy consumed in the household (42). We also collected updated information on fuels used and the time activity pattern of the day during the particle measurement phase.
Particulate matter (PM2.5) measurements
In this study, kitchen PM2.5 concentrations were measured in 86 households using Particle and Temperature Sensor Plus (PATS+) which is a light-scattering particle sensor developed by Berkeley Air Monitoring Group, California. PATS+ is quite popular in this field as it is easy to transport and required less place to install. It had an internal power supply for 80 h of continuous measurement after being completely charged and provided data in a minute interval of time (43, 44). The device had a lower particulate matter detection limit of 10 μg/m3 and an upper particulate matter detection limit of 50,000 μg/m3 with a logging particle concentration interval of 1 min. Previous field validation tests have shown that PATS+ relates well to gravimetric PM2.5 estimates in laboratory settings (R2 = 0.97) and in rural biomass-using households (R2 = 0.74) (43).
PATS+ was calibrated using gravimetric filters co-located in a previous study conducted in Ethiopia. Based on the regression result, an adjustment factor was estimated to be 0.8065 (14). But, for this particular study, it was not possible to calibrate the instrument specifically for local particulate matter due to the harsh sampling environments. Instead, we conducted side-by-side inter-comparison tests between PATS+ and DylosDC1700 air monitor devices in a real setting in 11 kitchens following standardized experimental procedures. The result confirmed good data comparability across PATS+ devices (Pearson correlation coefficients: 0.75 to 0.86).
A 24-h continuous kitchen air monitoring was carried out covering all Ethiopian main meals of the day (breakfast, lunch, and dinner) during the study period. Then, for each household, average concentrations were calculated as the means of these minute-by-minute average concentrations for each household with data on a sufficient number of hours (more than 20 h). In each household, monitoring for PM2.5 started in the morning at around 8:30 am. We used the morning to the morning as starting and ending points of a sampling day. A total of 4 PATS+ were rotated through households during this study.
Instrument placement in the kitchens
The air monitoring devices were placed in the main kitchen at least 1 m away from the edge of the stove (to prevent from damaging as the devices cannot tolerate extreme temperatures and to represent the general cooking area), at a height of 1.5 m above the floor (the approximate breathing height of standing women), 1.5 m away from doors, windows, and other openings horizontally (to minimize ambient air entering the room) (45), and at a safe location to minimize the risk of interrupting normal household activities or being disturbed (Figure 3). The air monitors were attached to a wall or suspended from the ceiling and run for 24 h to consider households’ typical daily cooking activities. In addition to measuring mean PM2.5 concentrations, the PATS+ monitors also measured humidity and temperature.
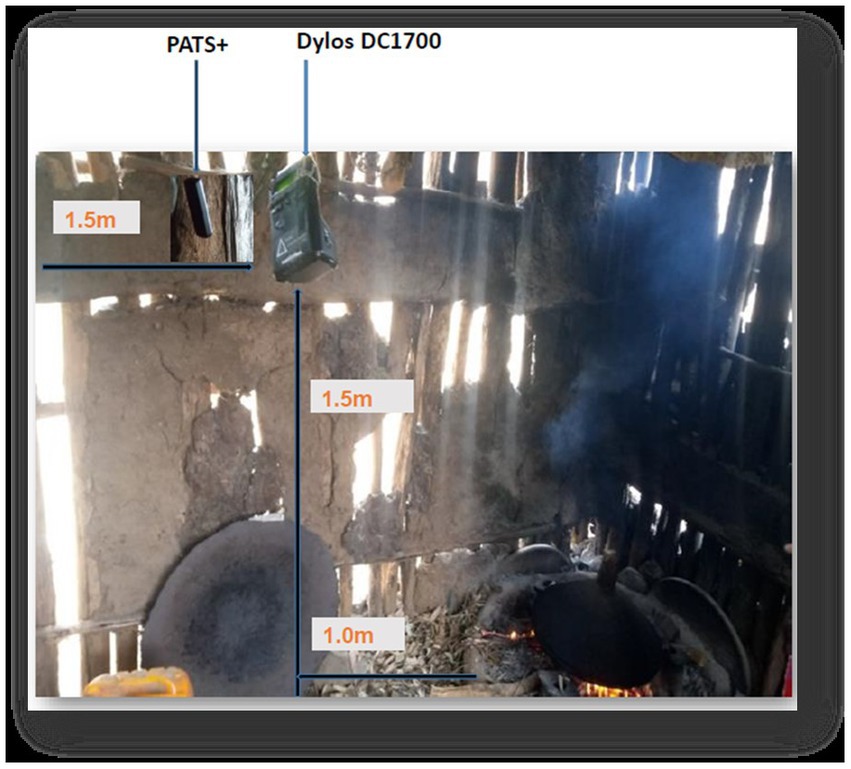
Figure 3. Placement position of particulate matter monitoring devices in the kitchen area.
Data quality
Field workers were trained in the use of the sampling equipment (PATS+ and Dylos DC1700), and a detailed manual with pictorial aids developed by the Berkeley air monitoring group (46) was used to assist them. They instructed to follow the standard operating procedures for installing indoor air pollution instruments in a home (45) in gathering kitchen air samples. To ensure that each 24-h period was representative (capturing a typical number of cooking events), measurements of PM2.5 concentrations were removed from analysis when the total sampling time was shorter than 20 h.
In a previous study, PATS+ has been validated against gravimetric samples in Ethiopian settings, with the resulting strong linear correlation (r2 > 0.80) (14). We have also conducted side-by-side inter-comparison tests between PATS+ and DylosDC1700 air monitor devices in a real setting in 11 kitchens following standardized experimental procedures which yield comparable data across PATS+ devices (Pearson correlation coefficients: 0.75 to 0.86). All PATS+ were zeroed in a plastic bag for 10 min before and after deployment in the kitchens. Though readings of optical air monitors are significantly affected by relative humidity levels usually at >80%, the relative humidity recorded in this study area ranged from 53 to 61% and would be unlikely to affect readings by more than 5% as reported from previous literature (47).
Data analysis
Data from the PATS+ air monitoring devices were downloaded in electronic form using the Platform for Integrated Cook Stove Assessment (PICA) software to the computer with CSV format Excel spreadsheets and text files. Paper-based data on the socioeconomics and demographic characteristics including housing conditions, kitchen types, fuel types, and cooking behavior were entered into SPSS software. Before formal statistical analyzes, simple tabulations and diagrams were constructed to gain a good understanding of the data and to identify gross outliers. Then, descriptive statistics including frequencies and percentages for categorical variables, and mean and standard deviations for continuous variables were calculated and presented using tables and graphs. In addition, we examined the pick hours at which the pollutant concentration in the kitchen measures high.
One-way analysis of variance (ANOVA) within 95% limits of a confidence interval, and value of p <0.05 was used to test differences in PM2.5 concentrations among different characteristics with multiple levels. Tukey’s Honest Significant Difference (HSD) test was done following ANOVA, to assess the significance of differences between pairs of groups. An independent sample t-test was used to check for differences in PM2.5 concentrations between two different characteristics at a significant level of 5%. Data were analyzed using the statistical package for social science (SPSS) version 24.0 software and Microsoft Excel for better graphical visuals.
Ethical approval
This study was approved by the institutional review boards of Jimma University with ethical clearance provided (Ref No: IHRPGD/538/2021) to conduct the study. Information about the purpose of the study and potential study outcomes were provided to all participants. All participants were asked to give consent for participation before the commencing of the data collection. As a significant proportion of this population was illiterate, verbal informed consent was received from all participating households. Official letters of cooperation were given to the south Gondar zone health department and respective district health offices and permission to conduct the study was obtained. The right of the respondent to withdraw from the interview or not to participate was respected. During air pollution monitoring sessions, field staff received permission from participants to place air pollution monitoring devices in their kitchens. Devices chosen for pollution have no risk for participants.
Results
Household characteristics
In this study, a total of 86 households (HHs) with eligible pregnant women were approached for kitchen PM2.5 concentration measurement. However, air monitoring data from 3 HHs were discarded due to the following reasons; (a) in one HH, an air monitoring device (PATS+) was taken from the kitchen to the main house to prevent it from theft, (b) in another HH, an air monitoring device was covered with the cloth to prevent it from damaging by children and (c) data from the third HH was discarded due to short sampling period (18 h).
All participants were Amhara by ethnicity, Orthodox Christian, and most of them were married. They were living on an earthen floor, wood/mud wall, and corrugated iron sheet (CIS) roof house which is typical in the study area. The mean age of the respondents was 28.7 (SD ± 5.34) years. In this study, there were an average of 4.5 (SD ±1.4) individuals permanently living in the household.
Kitchen characteristics
All households included in this study had a one-roomed separate kitchen with earthen floors and without windows. Nearly, three-fourths of participants had congregated iron sheet (CIS) roofed kitchens 64 (76.7%) and the rest 19 (23.3%) cooked in thatched roofed kitchens near the main house. When cooking, the kitchen doors of all participants’ kitchens opened partially or completely. The thatched roof kitchens have no sufficient opening to vent out cooking smoke, making pregnant women more vulnerable. Whereas the kitchens with CIS roofs, though there were no formal ventilations, there were openings between the wall and the ceiling which provided informal ventilation and reduces smoke exposure.
Cooking practices
All participants lived in households where cooking was regularly practiced. Mixed fuels (mainly wood with dung) were the most common fuels used by 34 (40.7%) of the respondents followed by firewood where 27 (32.6%) of the interviewed pregnant women used to cook their food. Nearly three-fourths of the participants 62 (74.7%) used additional fuel to start the kitchen fire, from whom 22 (35.5%) used dried plant leaves and 19(30.6%) used agricultural straws. All participants were baking Injera at least twice per week and other meals daily (average cooking time = 2.8 (SD 0.92) hours/ day) for an average of 5 (SD 1.4) individuals during the study period (Table 1).
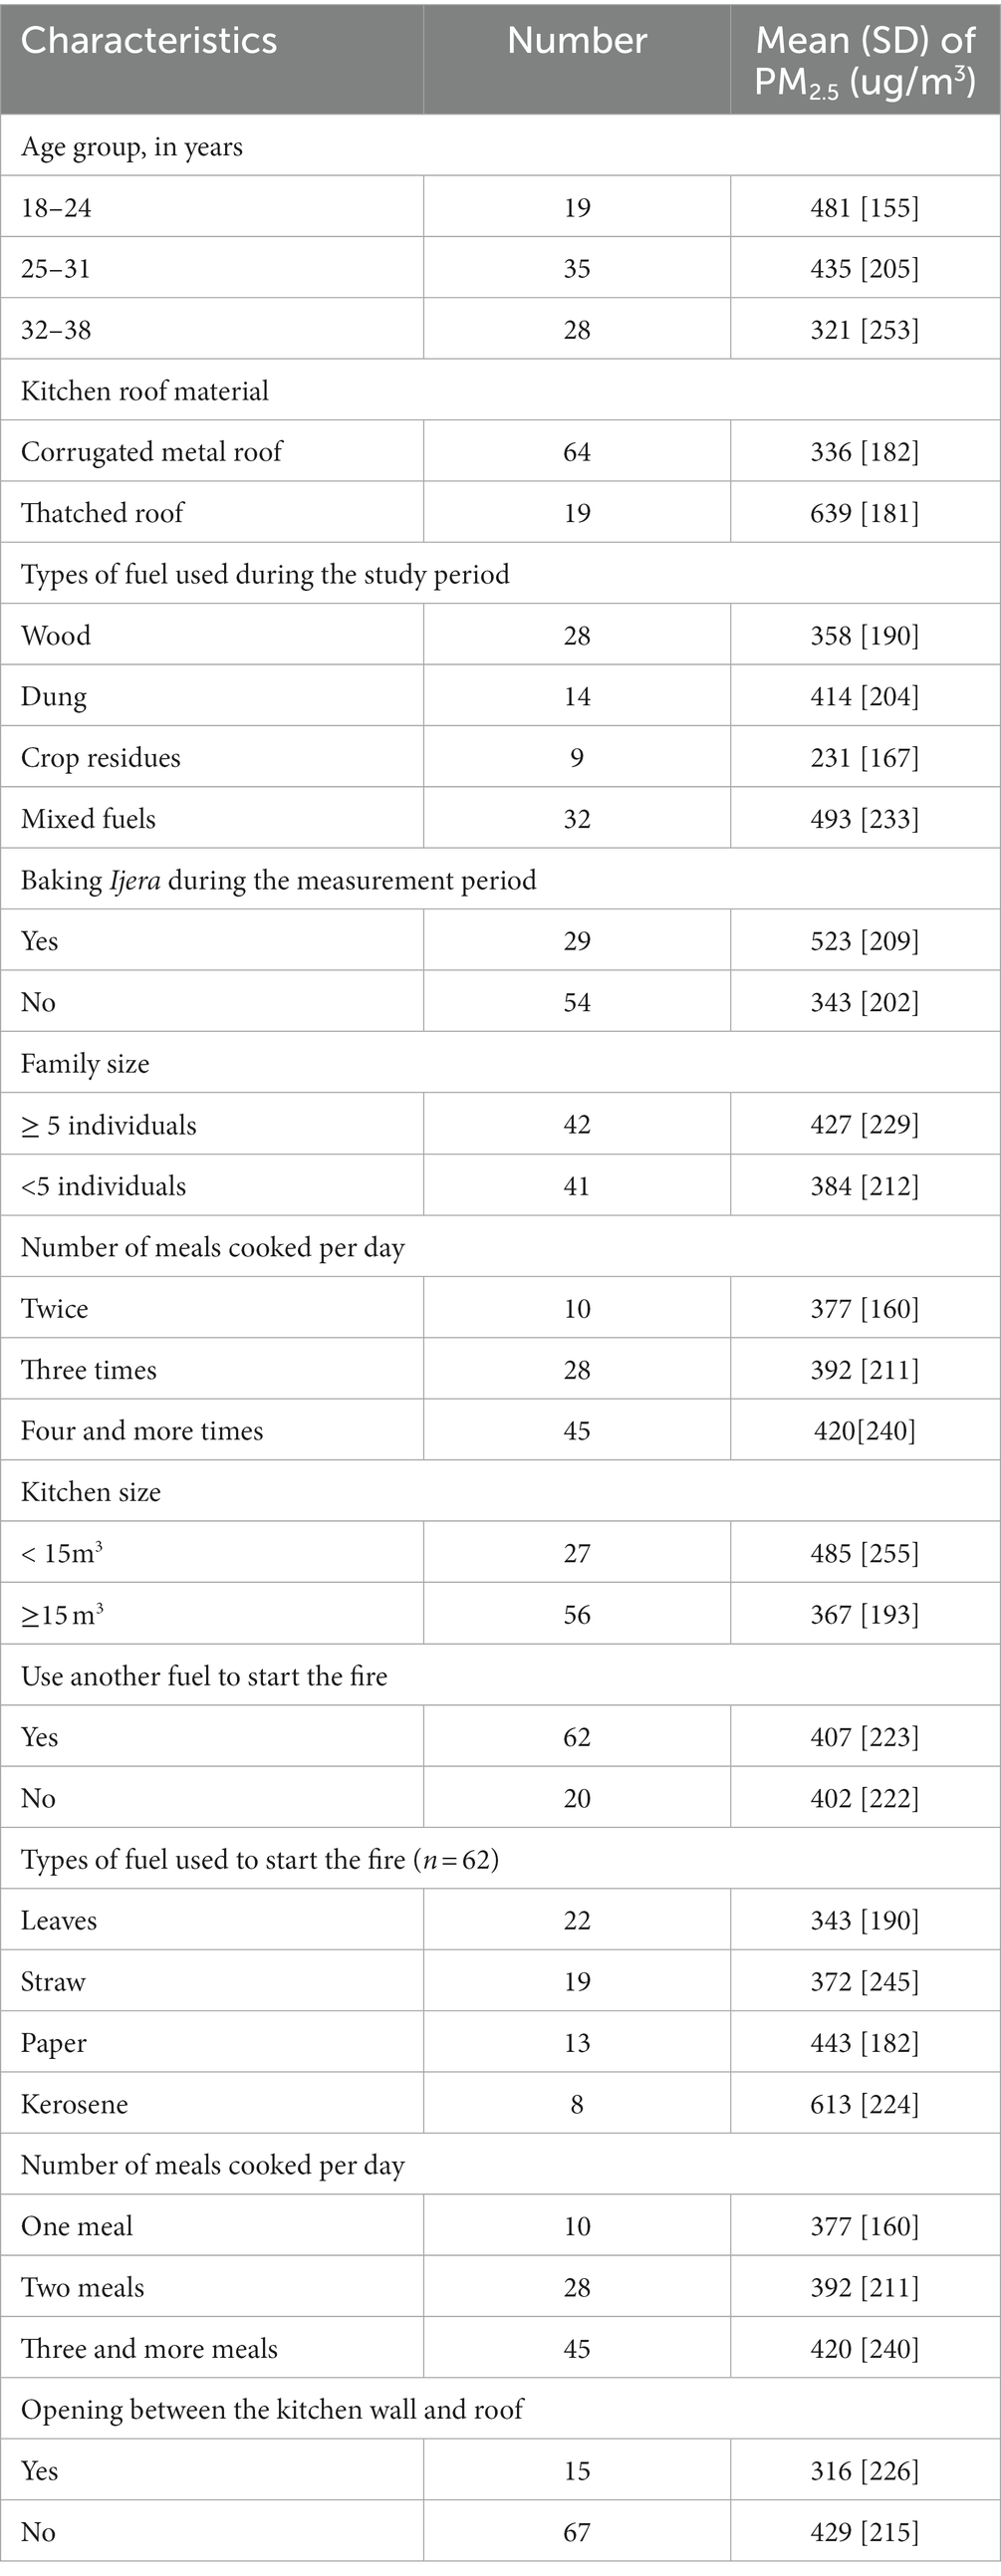
Table 1. Cooking related characteristics and distribution of kitchen PM2.5 concentration in rural households of north-west Ethiopia (n = 83).
Kitchen PM2.5 concentration
The average daily sampling time per household was 22.7 h with a range of 21 to 24 h. Because, some of the participating women faced unexpected social issues like funerals, health problems, and other family issues that enforced them to go far away from their residences. In this case, they have to lock their kitchen and the installed air monitors have to be uninstalled. Since we planned to consider measurements undertaken for more than 20 h, we excluded one measurement due to the short sampling period (18 h). The average temperature was 20.4°C, while the average humidity was 57% for the cooking area.
The average 24-h kitchen area PM2.5 concentrations were estimated to be 405 μg/m3 (SD 221 μg/m3) ranging from 52 to 965 μg/m3 and the median concentrations were less than the mean at 383 μg/m3. The continuous PM2.5 concentration profile consistently showed slight diurnal peaks reflecting morning and evening cooking periods and was lowest overnight when the stove was likely off (Figure 4).
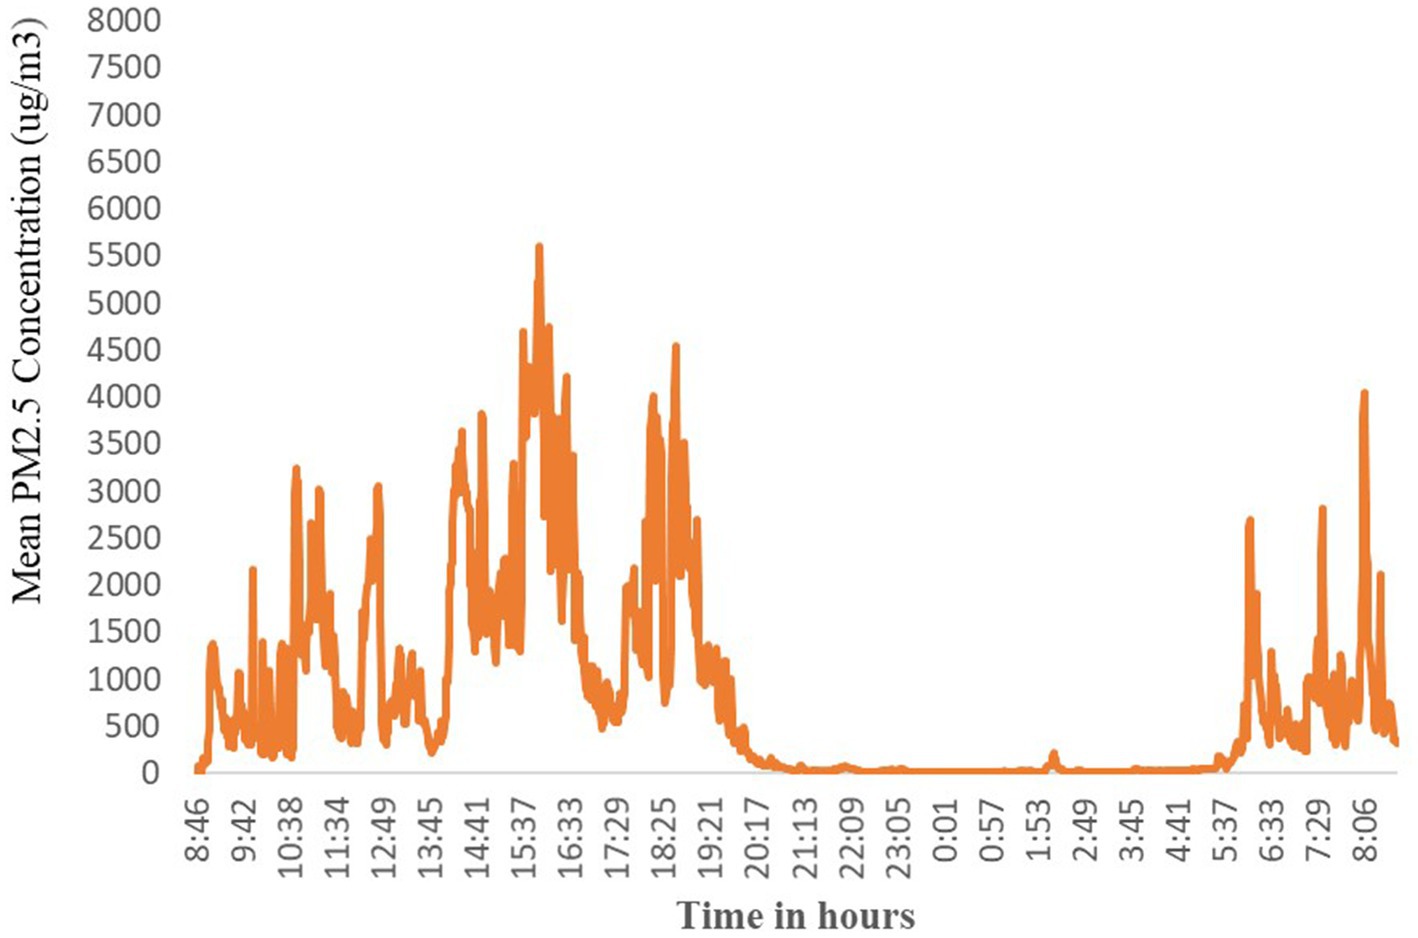
Figure 4. The distribution of kitchen area hourly average concentrations of PM2.5 (μg/m3) by the time of day.
PM2.5 concentrations by kitchen characteristics
The presence of an enclosed kitchen was one of the criteria for the HHs to be included in the kitchen area PM2.5 concentration measurement. The average PM2.5 concentrations was highest in the kitchen with a thatched roof (639 μg/m3) with daily average concentration ranging from 309 to 965 μg/m3 as compared with CIS roofed kitchen at an average concentration of 337 μg/m3 with a range from 52 to 671 μg/m3 (Figure 5).
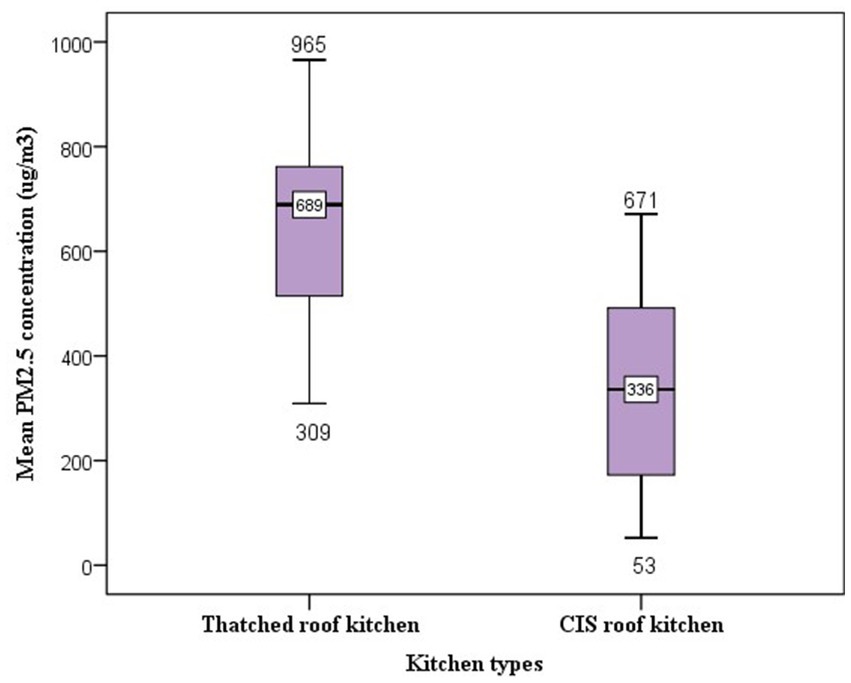
Figure 5. Box and whisker plots of 24- h kitchen PM2.5 concentrations by kitchen roof type. The ends of the box are at quartiles, so that the length of the box is the interquartile range (IQR). The median is marked by a line within the box. The two whiskers outside the box extend to the smallest and largest observations.
The difference in average PM2.5 concentrations is mainly due to a lack of outlet between the wall and the roof in the thatched roof kitchen where cooking smoke is trapped. Because the thatched roof kitchens had low-lying ceilings and very tightly enclosed walls resulting in the accumulation of dense biomass smoke during meal cooking. While the CIS roofed kitchen had many outlets at the highest part of the roof which served as smoke removal.
PM2.5 concentrations by fuel types
In this study, the average PM2.5 concentrations vary with different biomass fuel types used to cook the meal. Burning of mixed biomass fuel in the kitchen produces the highest average PM2.5 concentrations. In the kitchens where mixed fuel was used, the average PM2.5 concentrations were estimated to be 493 μg/m3 with a median of 527 μg/m3. The corresponding average concentration in kitchens with cow dung fuel was estimated to be 414 μg/m3. For firewood cooking fuel, the average particle concentration was 358 μg/m3 with a median of 344 μg/m3 and the least particle concentration was recorded among agricultural residue users at the PM2.5 concentrations of 231 μg/m3 (Figure 6).
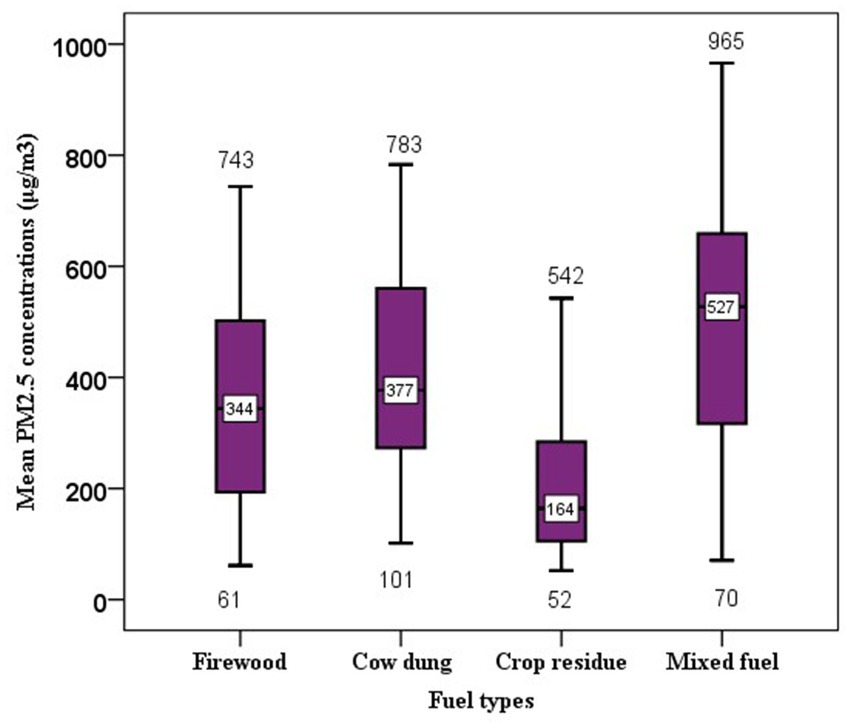
Figure 6. Box and whisker plots of 24- h kitchen PM2.5 concentrations by types of cooking fuel used during sampling period. The whole boxes represent the interquartile range; numbers on the horizontal line inside the box indicate median. The top and bottom whiskers are minimum and maximum values, respectively.
In addition to cooking fuel, the use of additional starter fuel to initiate the wood fire affects the concentration of particles in the kitchen. Accordingly, in the kitchen where kerosene was used to start the fire, the average PM2.5 concentrations was 493 μg/m3 followed by 414 μg/m3 among straw/grass starter fuel users (Figure 7).
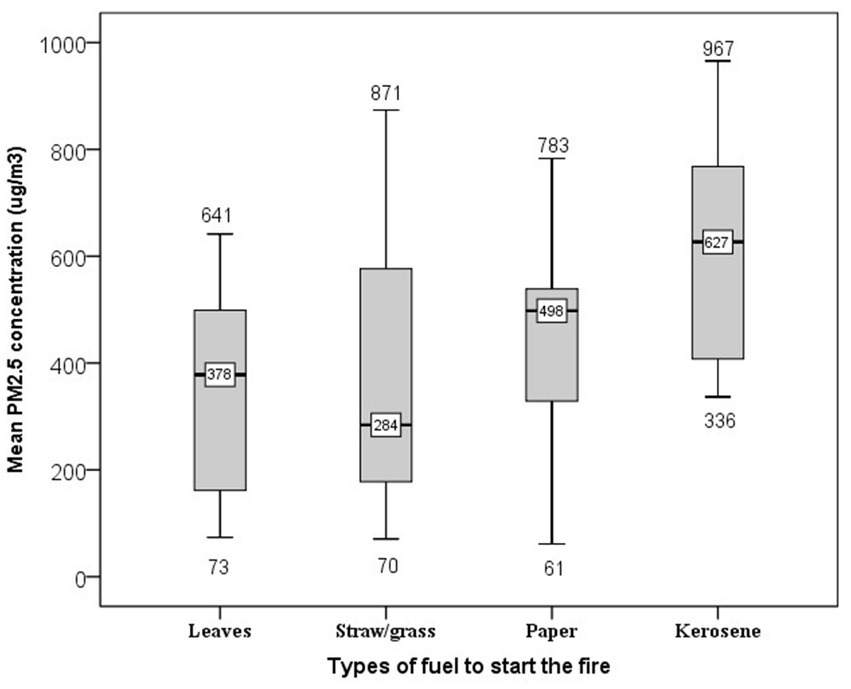
Figure 7. Box plot presenting the 24-h Kitchen area PM2.5 concentrations using different fuel types to start the fire in the kitchen. The whole boxes represent the interquartile range; numbers on the horizontal line inside the box indicate median. The top and bottom whiskers are minimum and maximum values, respectively.
Determinants of daily average kitchen concentrations of PM2.5
In addition to graphical visualization of raw relationships between different factors and average particle concentration, the model-based analysis provides a quantitative confirmation of important findings. As a result, we used the one-way analysis of variance (ANOVA) test to determine whether there is a significant difference in the mean concentration of PM2.5 by each of, the fuel types used to cook, fuel types used to start the fire, number of meals cooked per day and other variables with more than two groups.
An independent sampling t-test was also used to compare the average concentration of two different groups and check for significant differences between these average concentrations. All significance values of Levene’s test/statistics based on a comparison of the average concentration were greater than 0.05 indicating the requirement of homogeneity of variance has been met and the ANOVA and independent sample t-tests can be considered to be robust.
Accordingly, a statistically significant difference was observed in average PM2.5 concentrations between the thatched roof and CIS roof kitchens. The results indicated that cooking in a thatched roof kitchen emitted on average 639 μg/m3 (SD = 181) PM2.5 concentrations, compared with cooking in a CIS roofed kitchen which emitted an average concentration of 336 μg/m3 (SD = 182) PM2.5. This difference was statistically significant at 0.05 level (t = 6.37, p < 0.001). Using eta-square to examine the effect size, about 33.4% of the variation of PM2.5 concentrations could be explained by kitchen roof types.
Similarly, in the kitchen where Injera was baked the average concentration of PM2.5 was recorded to be 523 μg/m3 (SD = 209), compared with the kitchen where Injera was not baked which emitted an average of 343 μg/m3 (SD = 202) PM2.5. This difference was statistically significant at the 0.05 level (t = 3.81, p < 0.001). Based on the eta-square effect size estimate, only 15.2% of the variation could be explained by Injera baking events.
Regardless of the kitchen type, the result of one-way ANOVA showed a significant difference between fuel types used during the air monitoring period (firewood, cow dung, crop residue, and mixed fuel) and the average concentration of PM2.5 (F = 4.46, p = 0.006). A Tukey post hoc test showed that burning of mixed biomass fuel (mean = 493 ug/m3, SD = 233 ug/m3) emitted significantly high average PM2.5 concentrations than using both firewood (mean = 347 ug/m3, SD = 189 ug/m3) and agricultural residues (mean = 232 ug/m3, SD =167 ug/m3). But there is no significant difference in average kitchen PM2.5 concentrations among firewood, cow dung, and crop residue users.
Similarly, a statistically significant difference was observed between the types of fuel used to start the fire (dried leaves, straw/grass, and kerosene) and the average concentration of PM2.5 (F = 3.48, p = 0.021). Accordingly, a Tukey post hoc pairwise comparison test showed that the use of kerosene to start the fire (mean = 613 ug/m3, SD = 224 ug/m3) has significantly higher average PM2.5 concentrations than using dried plant leaves (mean = 343 ug/m3, SD = 190 ug/m3), straw/grass (mean = 372 ug/m3, SD = 245 ug/m3) and papers (mean = 443 ug/m3, SD = 182 ug/m3) to initiate the fire in the kitchen. Although 24-h average PM2.5 concentrations at different meal cooking frequencies and the presence of openings between the kitchen wall and roof differed, the pairwise comparison indicated that it is not statistically significant (p > 0.05; Table 2).
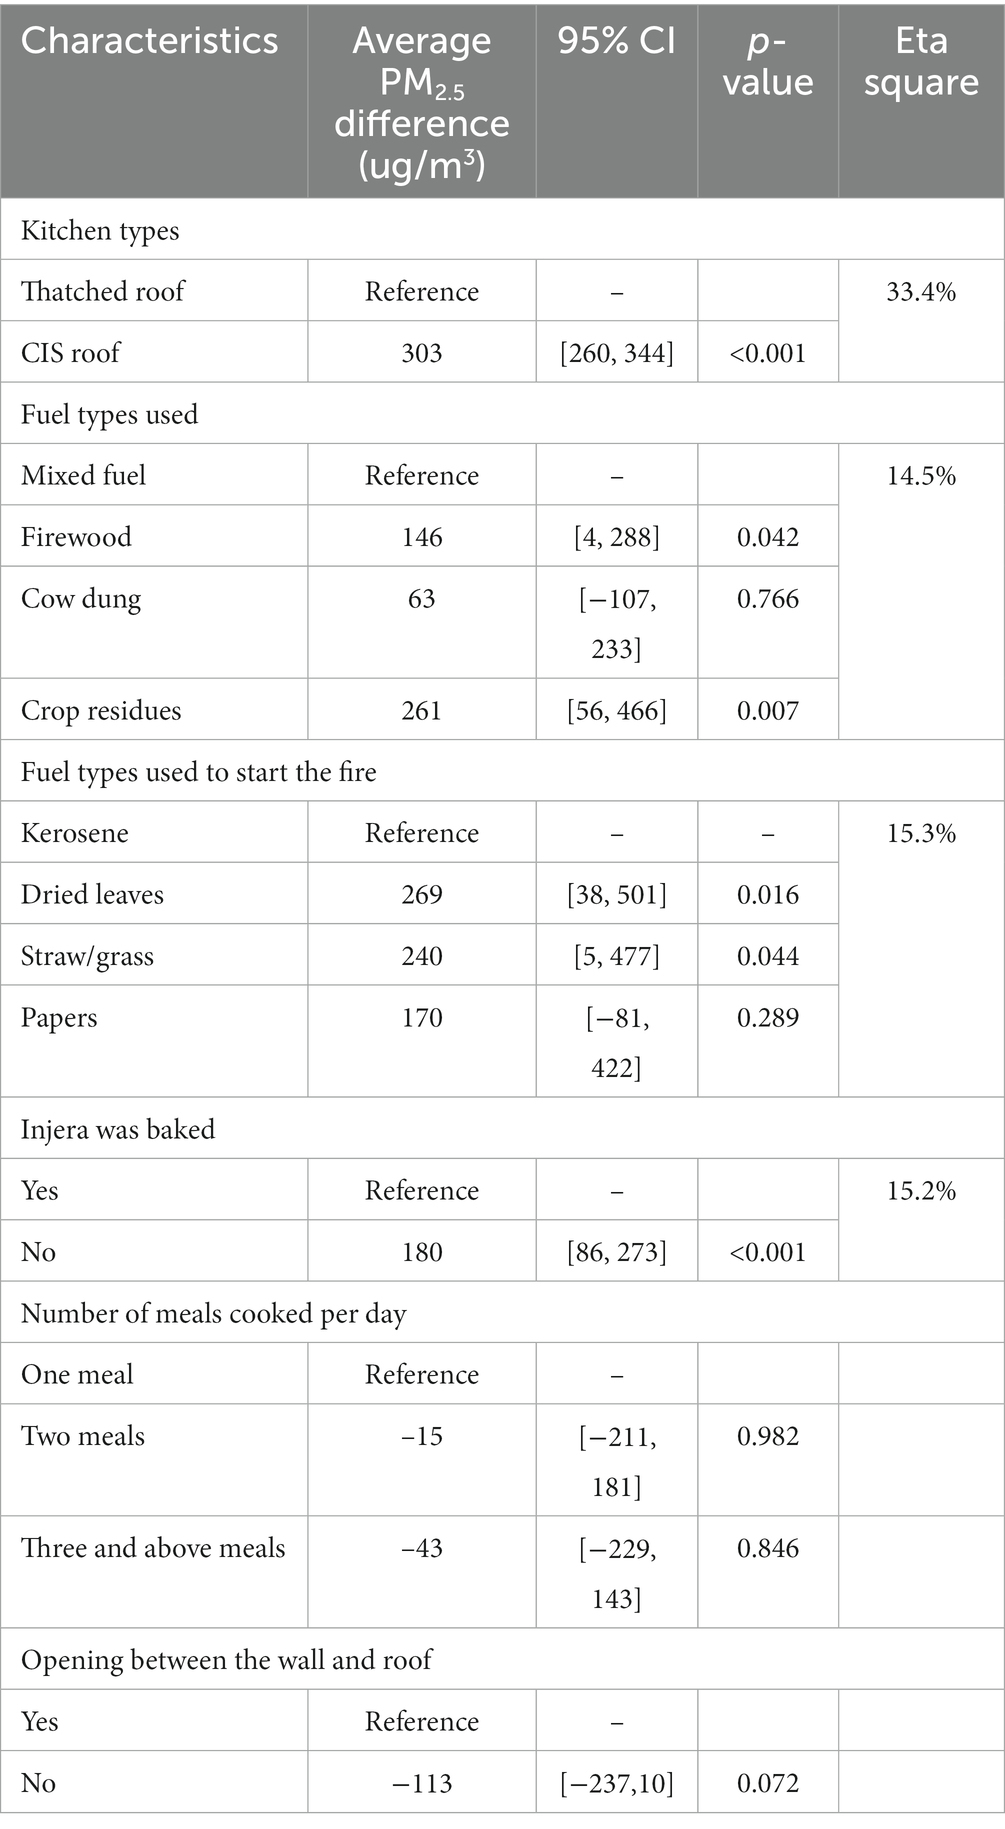
Table 2. Cooking practices and kitchen characteristics associated with average PM2.5 concentrations in rural households of north-west Ethiopia.
Discussion
In the study area, solid biomass fuels are often used with inefficient and poorly vented cook stoves that result in a high concentration of toxic pollutants (13, 48, 49). In this study, mixed fuels (mainly firewood with cow dung) were the main type of fuel used for cooking. Similar studies reported biomass fuel as the main domestic energy source for rural Ethiopia (11, 50, 51). The study on fuel consumption patterns in India also revealed that the majority of households used solid biomass fuel (predominantly cow dung and wood) for cooking (52). However, this study’s findings are different from results reported in Uganda and Kenya where charcoal and firewood only were reported to be the most commonly used cooking fuels, respectively (53, 54). These differences in fuel preference could be due to accessibility, types of a meal cooked, the design of used stoves, local temperature, and other behavioral and environmental factors.
In this study, the 24-h average kitchen area PM2.5 concentration was estimated to be 405 μg/m3 which is 27 times higher than the safety limit of 15 μg/m3 recommended by the WHO 24-h mean air quality guideline and five times higher than the most flexible interim WHO target (IT-I) of 75 μg/m3 (7) indicating the severity of kitchen area PM2.5 levels in study rural households.
This estimated 24-h average kitchen area concentration of PM2.5 was comparable to what is observed from the results of other kitchen air pollution monitoring studies in Ethiopia. Studies conducted in southern Ethiopia using similar (13) and different (15) air monitor devices in the kitchen have reported comparable results of 410 μg/m3 and 413 μg/m3, respectively. Another published review report in Ethiopia also revealed 24-h average PM2.5 concentration of 477 μg/m3 (55). Another measurement of PM2.5 during a single Injera baking event in Northwest Ethiopia reported an average PM2.5 concentration of 855 μg/m3 (56).
Nearly similar results were reported from studies conducted in India where a 24-h average concentration of 468 μg/m3 was reported (57) and in Nepal with a 48-h average concentration of 417 ug/m3 (58). A relatively higher concentration was reported in Pakistan where the average PM2.5 concentration was 531 μg/m3 (59) and in four states in India, 24-h average kitchen PM2.5 concentrations of 600 μg/m3 were reported (60). The differences in kitchen particle concentration suggest possible differences in local cooking practices, types of a meal cooked, and fuel types used. These high concentrations of PM2.5 as reported both from this study and previously conducted research in the kitchens might be due to the inefficient burning of biomass fuels and inefficient dispersion of particles in the kitchen area.
Because of the differences in kitchen design, the kitchen area concentration of PM2.5 also varies (61). Based on the independent sampling t-test, we found higher kitchen PM2.5 concentrations in households with thatched roof kitchens compared to households with metal sheet roofed kitchens. This result is similar to research reports conducted in Nepal and Peru where having metal sheet roof kitchens showed some association with decreased PM2.5 concentrations compared to roofs made of thatched/grass/straw (62, 63). Research results from Punjab in India also revealed that the concentration of PM2.5 varies across different kitchen types (52). As was also evidenced by another study, having a thatched roof was positively associated with increased 24-h PM concentrations (64). The possible reason might be due to better and faster dilution and dispersion of the pollutant taking place in different openings (in the case of metal sheet roofed kitchens) as compared to the confined kitchen (most thatched/grass roofed kitchens).
In this study, we also found that kitchen PM2.5 concentrations varied with different fuel types used for cooking. Hence, burning of mixed biomass fuels (mainly firewood with cow dung) emitted average higher PM2.5 concentrations than using firewood or agricultural residues only. A similar study on the effect of the fuel type used for cooking in the household showed that women who cooked with dung cake had the highest exposures compared with those who cooked with crop residues and firewood, respectively, in Ethiopia (12). Similarly, the maximum PM2.5 emissions were reported from the burning of dung cakes followed by agricultural residues and mixed fuel (wood and dung) uses in India (52). Another study in Nepal reported that biomass fuel was the most significant source of PM2.5 followed by kerosene (62). But, in Uganda, women who used crop residues had higher exposures to PM2.5 compared to those using wood (12). Because, many characteristics, including heating value, moisture content, chemical composition, and the size and density of the fuel, affect the amount of particles released and these characteristics can vary from fuel to fuel (65).
It is also common practice to use additional fuel to start the wood fire in the kitchen. Dried plant leaves, paper, kerosene, and straw/grass were commonly used wood fire starter fuels in the study area. We also found high PM2.5 levels variability by starter fuel type. In the kitchen where kerosene was used to start the wood fire, the average PM2.5 concentrations were higher followed by straw/grass users. It is also evidenced that rural Indian women commonly used kerosene to start a fire in the kitchen (66). Though the epidemiological evidence is limited in this regard, paper, plastics, or kerosene are used to start the fire because they have low ignition temperatures which help to catch fire immediately and help the wood or the dung to reach its required ignition temperature.
Recognizing the public health impact of HAP from biomass fuel use and considering the use of biomass fuels in developing countries is likely to remain stable in the near future, WHO suggested several practical interventions for a clean cooking transition before widespread affordable access to electricity (67–69). The introduction of locally acceptable improved stoves, improved housing and ventilation design (replacing thatched roof kitchen with CIS roofed kitchen), and education and awareness-raising to support necessary changes in cultural habits related to cooking are some of the strategies for reducing exposure to household air pollution (17, 56, 70). There is an evidence that a chimney-fitted improved stove reduced wood smoke exposures and was associated with reduced low birth weight occurrence (71). But the most effective way to improve indoor air quality is the use of cleaner fuels, such as biogas, ethanol, and liquefied petroleum gas (9, 17, 72) and electric, wind, and solar are the cleanest option for health (1, 67, 73) however, transition to these fuels is not yet feasible for low-income countries.
Conclusion
Rural households in the study area entirely depend on biomass fuel with traditional three-stone stoves for cooking which emits high levels of particulate matter that exceeded WHO guideline values. The reported kitchen PM2.5 concentrations in this study are sufficiently high to be a cause for public health concerns. Since the average PM2.5 concentrations were found to be highest in the thatched roof kitchens, replacing the kitchen’s roof with CIS to ensure that it allows air exchange during cooking times may be of benefit. Types of cooking fuel, types of fuel used for igniting the cooking fuel, and Injera baking events are also significantly associated with higher PM2.5 concentrations. Simple cost-effective interventions like the use of chimney-fitted improved stoves could also reduce kitchen PM 2.5 levels in the future. This study may be used as a starting point for intervention studies employing quantification of PM2.5 levels and other parameters that has to be considered in reducing the PM2.5 levels. Our findings also highlight the need to create awareness of the effects of HAP exposure and to identify best practices for reducing exposure in the kitchen to reduce pollution levels.
Potential limitations
Though seasonal variations were reported in previous studies with high concentrations recorded during the cold season (19, 62), the presence of this variation was not captured in this study. The PATS+ measures fine particles at concentrations ranging from 10 to 50,000 ug/m3 and performed well when tested against a gravimetric standard. Due to the harsh sampling environment, we were unable to validate our continuous monitoring against the gravimetric analysis of samples collected in parallel. Therefore, the absolute values of the PM2.5 measurements may not be fully accurate and should be interpreted with caution. Although households were randomly selected for air monitoring from those participating in the stove trail study, the latter were recruited based on inclusion criteria which may exclude relevant households. Finally, we did not measure ambient air pollution and therefore cannot account for the proportion of concentration from ambient PM2.5 sources.
Data availability statement
The raw data supporting the conclusions of this article will be made available by the authors, without undue reservation.
Ethics statement
The studies involving humans were approved by the institutional review boards of Jimma University. The studies were conducted in accordance with the local legislation and institutional requirements. The participants provided their written informed consent to participate in this study.
Author contributions
HE and AH: conceptualization, designing of the methodology, recruitment, training of supervisors, and data collectors. SM and AH: formal data analysis, interpreting the result, writing draft manuscript, and editing. All authors contributed to the article and approved the submitted version.
Funding
This study was supported by Jimma University and Debre Tabor University. This research was also funded in part by a grant from SEAL awards, the nature conservancy foundation.
Acknowledgments
We would like to thank Debre Tabor University, Jimma University, and SEAL Awards, nature conservancy foundation for financial support. We also would like to thank the South Gondar Zone health department and respective district health offices for their cooperation to commence this study. Special thanks go to Gaia clean energy Association, Ethiopia for providing HAP monitoring devices (PATS+) and GEOHealth for Research and Training for Eastern Africa supported by NIH Fogarty International Center, NIEHS, CDC/NIOSH, and the Stockholm Environmental Institute, Kenya for the Daylos DC1700 to use for the PM2.5 measurements. We are also grateful to the data collectors and supervisors for maintaining data quality.
Conflict of interest
The authors declare that the research was conducted in the absence of any commercial or financial relationships that could be construed as a potential conflict of interest.
Publisher’s note
All claims expressed in this article are solely those of the authors and do not necessarily represent those of their affiliated organizations, or those of the publisher, the editors and the reviewers. Any product that may be evaluated in this article, or claim that may be made by its manufacturer, is not guaranteed or endorsed by the publisher.
Footnotes
1. ^https://pactr.samrc.ac.za/; Identifier: ACTR202111534227089.
References
1. WHO. Opportunities for transition to clean household energy: Application of the household energy assessment rapid tool (HEART). Ghana: WHO (2018).
2. WHO. The energy access situation in developing countries. World Health Organization and the United Nations development Programme. New York: WHO (2009).
3. Wright, CY, Mathee, A, Piketh, S, Langerman, K, Makonese, T, Bulani, S, et al. Global statement on air pollution and health: opportunities for Africa. Ann Glob Health. (2019) 85:144. doi: 10.5334/aogh.2667
4. Ranathunga, N, Perera, P, Nandasena, S, Sathiakumar, N, Kasturiratne, A, and Wickremasinghe, R. Effect of household air pollution due to solid fuel combustion on childhood respiratory diseases in a semi urban population in Sri Lanka. BMC Pediatr. (2019) 19:1–12. doi: 10.1186/s12887-019-1674-5
5. Rosenthal, J, Quinn, A, Grieshop, AP, Pillarisetti, A, and Glass, RI. Clean cooking and the SDGs: integrated analytical approaches to guide energy interventions for health and environment goals. Energy Sustain Dev. (2018) 42:152–9. doi: 10.1016/j.esd.2017.11.003
6. Walker, ES, Clark, ML, Young, BN, Rajkumar, S, Benka-Coker, ML, Bachand, AM, et al. Exposure to household air pollution from biomass cookstoves and self-reported symptoms among women in rural Honduras. Int J Environ Health Res. (2020) 30:160–73. doi: 10.1080/09603123.2019.1579304
7. WHO. WHO global air quality guidelines: Particulate matter (PM2. 5 and PM10), ozone, nitrogen dioxide, sulfur dioxide and carbon monoxide: Executive summary. Geneva: WHO (2021).
8. Bryden, KM, Bruce, N, and Peck, M. WHO indoor air quality guidelines: Household fuel combustion. Geneva: World Health Organization (2015).
9. Health Effects Institute. The state of air quality and health impacts in Africa. A report from the state of global air initiative. Boston, MA: Health Effects Institute (2020).
10. Ethiopia and Calverton. Ethiopia demographic and health survey, Addis Ababa. Maryland, USA: Ethiopia and Calverton (2016).
11. Mondal, MAH, Bryan, E, Ringler, C, Mekonnen, D, and Rosegrant, M. Ethiopian energy status and demand scenarios: prospects to improve energy efficiency and mitigate GHG emissions. Energy. (2018) 149:161–72. doi: 10.1016/j.energy.2018.02.067
12. Okello, G, Devereux, G, and Semple, S. Women and girls in resource poor countries experience much greater exposure to household air pollutants than men: results from Uganda and Ethiopia. Environ Int. (2018) 119:429–37. doi: 10.1016/j.envint.2018.07.002
13. Tamire, M, Kumie, A, Addissie, A, Ayalew, M, Boman, J, Skovbjerg, S, et al. High levels of fine particulate matter (Pm2. 5) concentrations from burning solid fuels in rural households of Butajira, Ethiopia. Int J Environ Res Public Health. (2021) 18:6942. doi: 10.3390/ijerph18136942
14. Bluffstone, R, LaFave, D, Mekonnen, A, Dissanayake, S, Beyene, AD, Gebreegziabher, Z, et al. Do improved biomass Cookstoves reduce PM2. 5 concentrations? If so, for whom? Empirical evidence from rural Ethiopia. If so, for Whom? Empirical Evidence from Rural Ethiopia. World Bank Policy Research Working Paper No. 8930 (2019).
15. Admasie, A, Kumie, A, Worku, A, and Tsehayu, W. Household fine particulate matter (PM 2.5) concentrations from cooking fuels: the case in an urban setting, Wolaita Sodo, Ethiopia. Air Qual Atmos Health. (2019) 12:755–63. doi: 10.1007/s11869-019-00700-0
16. Sanbata, H, Asfaw, A, and Kumie, A. Association of biomass fuel use with acute respiratory infections among under-five children in a slum urban of Addis Ababa, Ethiopia. BMC Public Health. (2014) 14:1–8. doi: 10.1186/1471-2458-14-1122
17. Carvalho, H. New WHO global air quality guidelines: more pressure on nations to reduce air pollution levels. Lancet Planet Health. (2021) 5:e760–1. doi: 10.1016/S2542-5196(21)00287-4
18. Benka-Coker, ML, Peel, JL, Volckens, J, Good, N, Bilsback, KR, L’Orange, C, et al. Kitchen concentrations of fine particulate matter and particle number concentration in households using biomass cookstoves in rural Honduras. Environ Pollut. (2020) 258:113697. doi: 10.1016/j.envpol.2019.113697
19. Chan, KH, Xia, X, Ho, KF, Guo, Y, Kurmi, OP, Du, H, et al. Regional and seasonal variations in household and personal exposures to air pollution in one urban and two rural Chinese communities: a pilot study to collect time-resolved data using static and wearable devices. Environ Int. (2021) 146:106217. doi: 10.1016/j.envint.2020.106217
20. Coffey, ER, Pfotenhauer, D, Mukherjee, A, Agao, D, Moro, A, Dalaba, M, et al. Kitchen area air quality measurements in northern Ghana: evaluating the performance of a low-cost particulate sensor within a household energy study. Atmos. (2019) 10:400. doi: 10.3390/atmos10070400
21. HEI. State of global air 2019: A special report on global exposure to air pollution and its disease burden. Boston, MA, USA: Health Effects Institute (2019).
22. Murray, CJ, Aravkin, AY, Zheng, P, Abbafati, C, Abbas, KM, and Abbasi-Kangevari, M. Global burden of 87 risk factors in 204 countries and territories, 1990–2019: a systematic analysis for the global burden of disease study 2019. Lancet. (2020) 396:1223–49. doi: 10.1016/S0140-6736(20)30752-2
23. Keel, J, Walker, K, and Pant, P. Air pollution and its impacts on health in Africa-insights from the state of global air 2020. Clean Air J. (2020) 30:1–2. doi: 10.17159/caj/2020/30/2.9270
24. Fisher, S, Bellinger, DC, Cropper, ML, Kumar, P, Binagwaho, A, Koudenoukpo, JB, et al. Air pollution and development in Africa: impacts on health, the economy, and human capital. Lancet Planet Health. (2021) 5:e681–8. doi: 10.1016/S2542-5196(21)00201-1
25. Mock, CN, Smith, KR, Kobusingye, O, Nugent, R, Abdalla, S, Ahuja, RB, et al. Injury prevention and environmental health: Key messages from disease control priorities. (2018).
26. Lee, KK, Bing, R, Kiang, J, Bashir, S, Spath, N, Stelzle, D, et al. Adverse health effects associated with household air pollution: a systematic review, meta-analysis, and burden estimation study. Lancet Glob Health. (2020) 8:e1427–34. doi: 10.1016/S2214-109X(20)30343-0
27. Tipre, M, Wickremesinghe, R, Nandasena, S, Kasturiratne, A, Larson, R, Meleth, S, et al. Prenatal exposure to household air pollution and adverse birth outcomes among newborns in Sri Lanka. bioRxiv. (2018):461632. doi: 10.1101/461632
28. Weber, E, Adu-Bonsaffoh, K, Vermeulen, R, Klipstein-Grobusch, K, Grobbee, DE, Browne, JL, et al. Household fuel use and adverse pregnancy outcomes in a Ghanaian cohort study. Reprod Health. (2020) 17:1–8. doi: 10.1186/s12978-020-0878-3
29. Palma, A, Petrunyk, I, and Vuri, D. Air pollution during pregnancy and birth outcomes in Italy. CEIS Working Paper No. 464, (2019).
30. Mulenga, D, Nyirenda, HT, Chileshe-Chibangula, M, Mwila, P, and Siziya, S. Pregnancy outcomes associated with chronic indoor air pollution-related maternal respiratory III health in Ndola and Masaiti, Zambia. Intern Med. (2018) 8:2. doi: 10.4172/2165-8048.1000269
31. Olsson, D. Adverse effects of exposure to air pollutants during fetal development and early life: With focus on pre-eclampsia, preterm delivery, and childhood asthma. Sweden: Umeå Universitet (2014).
32. Liu, X-X, Fan, SJ, Luo, YN, Hu, LX, Li, CC, Zhang, YD, et al. Global, regional, and national burden of preterm birth attributable to ambient and household PM2. 5 from 1990 to 2019: worsening or improving? Sci Total Environ. 871:161975. doi: 10.1016/j.scitotenv.2023.161975
33. Reiner, RC, Welgan, CA, Casey, DC, Troeger, CE, Baumann, MM, Nguyen, QAP, et al. Identifying residual hotspots and mapping lower respiratory infection morbidity and mortality in African children from 2000 to 2017. Nat Microbiol. (2019) 4:2310–8. doi: 10.1038/s41564-019-0562-y
34. Adane, MM, Alene, GD, Mereta, ST, and Wanyonyi, KL. Prevalence and risk factors of acute lower respiratory infection among children living in biomass fuel using households: a community-based cross-sectional study in Northwest Ethiopia. BMC Public Health. (2020) 20:1–13. doi: 10.1186/s12889-020-08515-w
35. Admasie, A, Kumie, A, and Worku, A. Children under five from houses of unclean fuel sources and poorly ventilated houses have higher odds of suffering from acute respiratory infection in Wolaita-Sodo, southern Ethiopia: a case-control study. J Environ Public Health. (2018) 2018:1–9. doi: 10.1155/2018/9320603
36. Tefera, W, Asfaw, A, Gilliland, F, Worku, A, Wondimagegn, M, Kumie, A, et al. Indoor and outdoor air pollution-related health problem in Ethiopia: review of related literature. Ethiop J Health Dev. (2016) 30:5–16.
37. Balidemaj, F, Isaxon, C, Abera, A, and Malmqvist, E. Indoor air pollution exposure of women in Adama, Ethiopia, and assessment of disease burden attributable to risk factor. Int J Environ Res Public Health. (2021) 18:9859. doi: 10.3390/ijerph18189859
38. Desalegn, B, Suleiman, H, and Asfaw, A. Household fuel use and acute respiratory infections among younger children: an exposure assessment in Shebedino Wereda, southern Ethiopia. Afr J Health Sci. (2011) 18:31–6.
39. Geberetsadik, A, Worku, A, and Berhane, Y. Factors associated with acute respiratory infection in children under the age of 5 years: evidence from the 2011 Ethiopia demographic and health survey. Pediatr Health Med Ther. (2015) 6:9.
40. Tsegay, T, and Biyadgie, W. Association of indoor air pollution and other risk factors with acute respiratory infections among children in Sheka zone, south West Ethiopia. J Harmon Res Med Health Sci. (2018) 5:1. doi: 10.30876/JOHR.5.1.2018.1-9
41. Edwards, R, Hubbard, A, Khalakdina, A, Pennise, D, and Smith, KR. Design considerations for field studies of changes in indoor air pollution due to improved stoves. Energy Sustain Dev. (2007) 11:71–81. doi: 10.1016/S0973-0826(08)60401-9
42. Asmamaw, FGAY. Epidemiology of burn injury among children’s attended felege hiwot referral hospital in Bahir Dar town, Amhara regional state, Ethiopia, 2017. J Pediatr Neonatal Care. (2020) 10:21–7. doi: 10.15406/jpnc.2020.10.00408
43. Group WBW. Transparent climate and health metrics: An open data dashboard and wireless platform for Cookstove monitoring, in Nexleaf analytics. (2017).
44. Ajay Pillarisetti, TA, Ruiz-Mercado, I, Edwards, R, Chowdhury, Z, Charity Garland, L, Drew Hill, ID, et al. Small, smart, fast, and cheap: microchip-based sensors to estimate air pollution exposures in rural households. Sensors. (2017) 17:1879. doi: 10.3390/s17081879
46. Group BAM. Platform for integrated Cookstove assessment (PICA): Particle and temperature sensor (PATS+) and software specifications. (2016).
47. Wang, Z, Calderón, L, Patton, AP, Sorensen Allacci, MA, Senick, J, Wener, R, et al. Comparison of real-time instruments and gravimetric method when measuring particulate matter in a residential building. J Air Waste Manage Assoc. (2016) 66:1109–20. doi: 10.1080/10962247.2016.1201022
48. Benti, NE, Gurmesa, GS, Argaw, T, Aneseyee, AB, Gunta, S, Kassahun, GB, et al. The current status, challenges and prospects of using biomass energy in Ethiopia. Biotechnol Biofuels. (2021) 14:1–24. doi: 10.1186/s13068-021-02060-3
49. Kanno, GG, Anbesse, AT, Shaka, MF, Legesse, MT, and Andarge, SD. Investigating the effect of biomass fuel use and kitchen location on maternal report of birth size: A cross-sectional analysis of 2016 Ethiopian demographic health survey data. medRxiv. (2020) 2020:20197871. doi: 10.1016/j.puhip.2021.100211
50. Gebreegziabher, Z, Beyene, AD, Bluffstone, R, Martinsson, P, Mekonnen, A, and Toman, MA. Fuel savings, cooking time and user satisfaction with improved biomass cookstoves: evidence from controlled cooking tests in Ethiopia. Resour Energy Econ. (2018) 52:173–85. doi: 10.1016/j.reseneeco.2018.01.006
51. Geissler, S, Hagauer, D, Horst, A, Krause, M, and Sutcliffe, P. Biomass energy strategy Ethiopia. AMBERO Consulting Gesellschaft mbH Immanuel-Kant-Str, No. 41. p. 61476. (2013).
52. Sidhu, MK, Ravindra, K, Mor, S, and John, S. Household air pollution from various types of rural kitchens and its exposure assessment. Sci Total Environ. (2017) 586:419–29. doi: 10.1016/j.scitotenv.2017.01.051
53. Kansiime, WK, Mugambe, RK, Atusingwize, E, Wafula, ST, Nsereko, V, Ssekamatte, T, et al. Use of biomass fuels predicts indoor particulate matter and carbon monoxide concentrations; evidence from an informal urban settlement in Fort Portal city, Uganda. BMC Public Health. (2022) 22:1723. doi: 10.1186/s12889-022-14015-w
54. Musyoka, D, and Muindi, K. A descriptive assessment of household air pollution in rural kitchens in Kenya. Atmos. (2022) 13:2115. doi: 10.3390/atmos13122115
55. Asefa, EM, and Mergia, MT. Human exposure to indoor air pollution in Ethiopian households. Heliyon. (2022) 8:e11528. doi: 10.1016/j.heliyon.2022.e11528
56. Adane, MM, Alene, GD, and Mereta, ST. Biomass-fuelled improved cookstove intervention to prevent household air pollution in Northwest Ethiopia: a cluster randomized controlled trial. Environ Health Prev Med. (2021) 26:1–15. doi: 10.1186/s12199-020-00923-z
57. Mukhopadhyay, R, Sambandam, S, Pillarisetti, A, Jack, D, Mukhopadhyay, K, Balakrishnan, K, et al. Cooking practices, air quality, and the acceptability of advanced cookstoves in Haryana, India: an exploratory study to inform large-scale interventions. Glob Health Action. (2012) 5:19016–3. doi: 10.3402/gha.v5i0.19016
58. Bartington, S, Bakolis, I, Devakumar, D, Kurmi, OP, Gulliver, J, Chaube, G, et al. Patterns of domestic exposure to carbon monoxide and particulate matter in households using biomass fuel in Janakpur, Nepal. Environ Pollut. (2017) 220:38–45. doi: 10.1016/j.envpol.2016.08.074
59. Fatmi, Z, Ntani, G, and Coggon, D. Levels and determinants of fine particulate matter and carbon monoxide in kitchens using biomass and non-biomass fuel for cooking. Int J Environ Res Public Health. (2020) 17:1287. doi: 10.3390/ijerph17041287
60. Balakrishnan, K, Ghosh, S, Ganguli, B, Sambandam, S, Bruce, N, Barnes, DF, et al. State and national household concentrations of PM2. 5 from solid cookfuel use: results from measurements and modeling in India for estimation of the global burden of disease. Environ Health. (2013) 12:1–14. doi: 10.1186/1476-069X-12-77
61. Nayek, S, and Padhy, PK. Daily personal exposure of women cooks to respirable particulate matters during cooking with solid bio-fuels in a rural community of West Bengal, India. Aerosol Air Qual Res. (2017) 17:245–52. doi: 10.4209/aaqr.2016.01.0028
62. Pokhrel, AK, Bates, MN, Acharya, J, Valentiner-Branth, P, Chandyo, RK, Shrestha, PS, et al. PM2. 5 in household kitchens of Bhaktapur, Nepal, using four different cooking fuels. Atmos Environ. (2015) 113:159–68. doi: 10.1016/j.atmosenv.2015.04.060
63. Fandiño-del-Rio, M, Kephart, JL, Williams, KN, Moulton, LH, Steenland, K, Checkley, W, et al. Household air pollution exposure and associations with household characteristics among biomass cookstove users in Puno. Peru Environ Res. (2020) 191:110028. doi: 10.1016/j.envres.2020.110028
64. Pollard, SL, Williams, D’AL, Breysse, PN, Baron, PA, Grajeda, LM, Gilman, RH, et al. A cross-sectional study of determinants of indoor environmental exposures in households with and without chronic exposure to biomass fuel smoke. Environ Health. (2014) 13:1–12. doi: 10.1186/1476-069X-13-21
65. McClure, CD, Lim, CY, Hagan, DH, Kroll, JH, and Cappa, CD. Biomass-burning-derived particles from a wide variety of fuels–part 1: properties of primary particles. Atmos Chem Phys. (2020) 20:1531–47. doi: 10.5194/acp-20-1531-2020
66. Lam, NL, Smith, KR, Gauthier, A, and Bates, MN. Kerosene: a review of household uses and their hazards in low-and middle-income countries. J Toxicol Environ Health Part B. (2012) 15:396–432. doi: 10.1080/10937404.2012.710134
67. WHO. Burning opportunity: Clean household energy for health, sustainable development, and wellbeing of women and children. Geneva: WHO (2016).
70. Edelstein, M, Pitchforth, E, Asres, G, Silverman, M, and Kulkarni, N. Awareness of health effects of cooking smoke among women in the Gondar region of Ethiopia: a pilot survey. BMC Int Health Hum Rights. (2008) 8:1–7. doi: 10.1186/1472-698X-8-10
71. Thompson, LM, Bruce, N, Eskenazi, B, Diaz, A, Pope, D, and Smith, KR. Impact of reduced maternal exposures to wood smoke from an introduced chimney stove on newborn birth weight in rural Guatemala. Environ Health Perspect. (2011) 119:1489–94. doi: 10.1289/ehp.1002928
Keywords: biomass fuel, kitchen concentration, fine particle, cooking, Ethiopia
Citation: Enyew HD, Hailu AB and Mereta ST (2023) Kitchen fine particulate matter (PM2.5) concentrations from biomass fuel use in rural households of Northwest Ethiopia. Front. Public Health. 11:1241977. doi: 10.3389/fpubh.2023.1241977
Edited by:
Ghulam Mujtaba Kayani, Hubei University of Economics, ChinaReviewed by:
Masoume Taherian, Ahvaz Jundishapur University of Medical Sciences, IranMichael Poteser, Medical University of Vienna, Austria
Sasan Faridi, Tehran University of Medical Sciences, Iran
Dusan Jandacka, University of Žilina, Slovakia
Copyright © 2023 Enyew, Hailu and Mereta. This is an open-access article distributed under the terms of the Creative Commons Attribution License (CC BY). The use, distribution or reproduction in other forums is permitted, provided the original author(s) and the copyright owner(s) are credited and that the original publication in this journal is cited, in accordance with accepted academic practice. No use, distribution or reproduction is permitted which does not comply with these terms.
*Correspondence: Habtamu Demelash Enyew, aGFidGRlbUBkdHUuZWR1LmV0