 Ying Zhang
 Shaobo Zhang1
 Jinyuan Xin
- 1Plateau Atmosphere and Environment Key Laboratory of Sichuan Province, School of Atmospheric Sciences, Chengdu University of Information Technology, Chengdu, China
- 2State Key Laboratory of Atmospheric Boundary Layer Physics and Atmospheric Chemistry, Institute of Atmospheric Physics, Chinese Academy of Sciences, Beijing, China
- 3Beijing Anzhen Hospital, Capital Medical University, Beijing, China
- 4Chinese Center for Disease Control and Prevention, National Institute for Communicable Disease Control and Prevention, Beijing, China
- 5Department of Respiratory and Critical Care Medicine, Beijing Institute of Respiratory Medicine and Beijing Chao-Yang Hospital, Capital Medical University, Beijing, China
Introduction: In recent years, air pollution caused by co-occurring PM2.5 and O3, named combined air pollution (CAP), has been observed in Beijing, China, although the health effects of CAP on population mortality are unclear.
Methods: We employed Poisson generalized additive models (GAMs) to evaluate the individual and joint effects of PM2.5 and O3 on mortality (nonaccidental, respiratory, and cardiovascular mortality) in Beijing, China, during the whole period (2014–2016) and the CAP period. Adverse health effects were assessed for percentage increases (%) in the three mortality categories with each 10-μg/m3 increase in PM2.5 and O3. The cumulative risk index (CRI) was adopted as a novel approach to quantify the joint effects.
Results: The results suggested that both PM2.5 and O3 exhibited the greatest individual effects on the three mortality categories with cumulative lag day 01. Increases in the nonaccidental, cardiovascular, and respiratory mortality categories were 0.32%, 0.36%, and 0.43% for PM2.5 (lag day 01) and 0.22%, 0.37%, and 0.25% for O3 (lag day 01), respectively. There were remarkably synergistic interactions between PM2.5 and O3 on the three mortality categories. The study showed that the combined effects of PM2.5 and O3 on nonaccidental, cardiovascular, and respiratory mortality were 0.34%, 0.43%, and 0.46%, respectively, during the whole period and 0.58%, 0.79%, and 0.75%, respectively, during the CAP period. Our findings suggest that combined exposure to PM2.5 and O3, particularly during CAP periods, could further exacerbate their single-pollutant health risks.
Conclusion: These findings provide essential scientific evidence for the possible creation and implementation of environmental protection strategies by policymakers.
1. Introduction
Significant epidemiological research has shown that short-term exposure to ambient air pollution is substantially related to numerous detrimental health consequences (Fan et al., 2020; Stafoggia et al., 2022) (1). Among the various ambient air pollutants, particles with diameters ≤2.5 μm (PM2.5) and ozone (O3) are considered have serious dangerous to human health (2).
At one time, China, the world’s largest developing country, had the worst air pollution issue than other countries, which led to almost 2 million premature deaths annually (3). The Chinese government has implemented a variety of pollution prevention and control measures since 2013 to protect public health, including policy changes in energy, industrial, and transportation infrastructure (4). According to (5), there was a significant reduction of 30–50% in PM2.5 concentrations from 2013 to 2017. Despite this reduction, PM2.5 pollution episodes persist in China, especially in megacities (6, 7). Furthermore, the decreased PM2.5 also slow down the sink of hydroperoxy radicals and thus speeding up O3 production, resulting in the ground-level O3 levels in China have grown annually (8). Consequently, there was a cooccurrence of PM2.5 and O3 pollution (9–11). This cooccurrence is known as combined air pollution (CAP). CAP has received much interest in atmospheric environmental research (12, 13). However, the health risks caused by CAP are still unclear.
Given that humans are exposed to more than one air pollutant in real life, biological responses to inhaled pollutants likely depend on the interaction between individual pollutants (14). Ground-level O3 and PM2.5 are closely related and interact with each other, and thus they may have a combined negative impact on human body (15). Traditional time-series studies have focused on assessing health effects using single-pollutant models. Research on the combined health effects of multiple pollutants has been inadequate. In recent years, some new models and methods have been developed to simultaneously quantify the combined health effects of multiple pollutants. One such technique is the use of the cumulative risk index (CRI), which involves the linear combination of individual coefficients. This approach enables accurate estimation of cumulative effects, even in cases where there is a high correlation among variables (14), and has been recommended for joint estimates of multipollutant exposure effects on health outcomes (16). However, CRI-related studies are quite limited; most of these studies have been conducted in developed countries, and studies in developing countries are lacking (17, 18).
Beijing, as the capital of China, has a serious air pollution issue. CAP appears in Beijing from time to time, and the frequency continues to increase (19). It is still unknown how the CAP affects the health outcomes of a local population. Therefore, the goal of this manuscript was to evaluate the individual and combined effects of PM2.5 and O3 on nonaccidental and cause-specific mortality in Beijing, China, across the entire time period and during the CAP period, respectively. The joint health effects of PM2.5 and O3 were estimated by using the CRI index.
2. Data and methods
2.1. Health data
In this study, we collected data on the daily death counts in Beijing from January 1, 2014, to December 31, 2016, from the Chinese Center for Disease Control and Prevention (CDC). To classify the causes of death, we used the International Classification of Diseases, Tenth Revision (ICD-10). Nonaccidental causes, cardiovascular diseases, and respiratory diseases were categorized as A00-R99, I00-I99, and J00-J99, respectively.
2.2. Environmental data
PM2.5 and O3 data were retrieved from the China National Environmental Monitoring Center. The maximal 8-h average ozone concentration was selected as the O3 concentration metric according to World Health Organization (WHO) recommendations (20). PM2.5 and O3 concentrations were recorded hourly at 12 stationary monitoring sites (Olympic Sports Center, Dongsi, Changping, Tiantan, Guanyuan, Shunyi, Huairou, Dingling, Agriculture Exhibition Hall, Haidian, Wanshou Temple, and Gucheng) in Beijing. We first calculated the mean of the hourly PM2.5 and O3 concentrations from all 12 monitoring sites and then calculated the 24-h mean PM2.5 and daily maximal 8-h average ozone concentrations. Details of the PM2.5 and O3 concentration data collection methods can be found in our published articles (21). According to the Ministry of Ecology and Environment of China’s national Ambient Air Quality Standards released in 2012 (22), PM2.5 pollution levels are defined as daily average PM2.5 concentrations >75 μg·m−3, and O3 pollution levels are defined as daily average O3 concentrations >160 μg·m−3. As a result, CAP days were designated as days when both O3 and PM2.5 values were above the criterion for co-occurring air pollution, with O3 concentrations >160 μg·m−3 and PM2.5 concentrations >75 μg·m−3. In addition, we collected data on some meteorological factors, including the daily average surface temperature (°C) and relative humidity (RH) (%), which were retrieved from the China Meteorological Data Sharing Service System.1
2.3. Statistical methods
We employed four parallel time-series Poisson generalized additive models (GAMs) to evaluate the individual and joint effects of O3 and PM2.5 on nonaccidental, cardiovascular, and respiratory mortality during the whole period and the CAP period. These models include a single-pollutant model, multipollutant model, nonparametric bivariate response surface model, and stratification model.
First, we utilized the single-pollutant model as the basis to assess the individual effects of a single pollutant on health outcomes at different lag days, including single (lag days 0 and 1) and cumulative (lag days 01 and 04) effects. The following is an expression for Model 1:
where Yt and E(Yt) signify the daily death counts and predicted death counts on day t, respectively. refers to the intercept. is the natural cubic spline function. According to the minimum Akaike information criterion (AIC), Time with the degrees of freedom (df) 6/year was selected to control for secular trends, and the df of the daily mean temperature (Temp) and RH are both 3. DOW and Holiday are two dummy variables that indicate weekday and public holidays, respectively (23). and denote the specific air pollutant concentrations and the corresponding coefficient on day t, respectively. Additionally, COVs represent all covariates including time, mean temperature, relative humidity, weekday, public holidays, and the intercept, respectively.
On this basis, we utilized a multipollutant model to evaluate the joint effects of PM2.5 and O3 on health outcomes at different lag days. The CRI, which was developed using estimates from multipollutant models, was used to assess the joint effects of multipollutant exposures (24). The multipollutant model and the formula for the CRI can be expressed as follows:
where and denote the specific air pollutant concentrations and the corresponding coefficient on day t, respectively. The COVs are identical to those in Model (1). indicates the type of air pollutant. CRIt denotes the joint effects of p air pollutant mixtures on day t.
The CRIs obtained from the multipollutant models were compared with the effect estimates of the single-pollutant models. If the effect estimate from the single-pollutant model was as high as the CRI from the multipollutant model, it indicated that the influence of only one pollutant was adequate to reflect the total pollutant mixture and that there were no synergistic effects.
Third, we also used a nonparametric bivariate response surface model to intuitively analyze the combined effects of PM2.5 and O3 on health outcomes. The model can be expressed as follows:
() denotes the cubic regression splines. The COVs are identical to those in Model (1).
Fourth, the pollutant stratification model was employed to quantitatively assess the joint effects of PM2.5 and O3 on health outcomes during the CAP period. The model can be expressed as follows:
where m is an indicator variable that is used to represent the CAP days. m = 1 represents co-occurring air pollution of PM2.5 and O3; otherwise, m = 0. βit and βjt represent the coefficients of O3 and PM2.5 on day t, respectively. The COVs are the same as those in Model (1).
To evaluate the models’ robustness, several sensitivity studies were carried out. We changed the df of Time from 7 to 10 per year and the df of mean temperature and RH from 3 to 5 for the single-pollutant model.
R 4.2.3 software with the “mgcv” package was used for all analyzes. For each 10-μg/m3 increase in PM2.5 and O3, the estimated individual and joint effects are shown as percentage changes (%) along with 95% confidence intervals (95% CIs).
3. Results
Table 1 summarizes the environmental and mortality data in Beijing, China, from 2014 to 2016. On average, there were 146 nonaccidental deaths per day, of which 64 were due to cardiovascular diseases and 17 were due to respiratory diseases. The annual mean temperature and RH were 15.65°C and 53%, respectively. Additionally, the annual average concentrations of PM2.5 and O3 were 78.97 and 118.10 μg/m3, respectively. Based on the statistical analysis, the daily average PM2.5 and O3 concentrations exceeded the threshold set by the Air Quality II Guidelines (75 μg·m−3 for PM2.5 and 160 μg·m−3 for O3, respectively) on 322 and 280 days, respectively (22). There were 59 CAP days during the study period, indicating serious air pollution in Beijing, China.
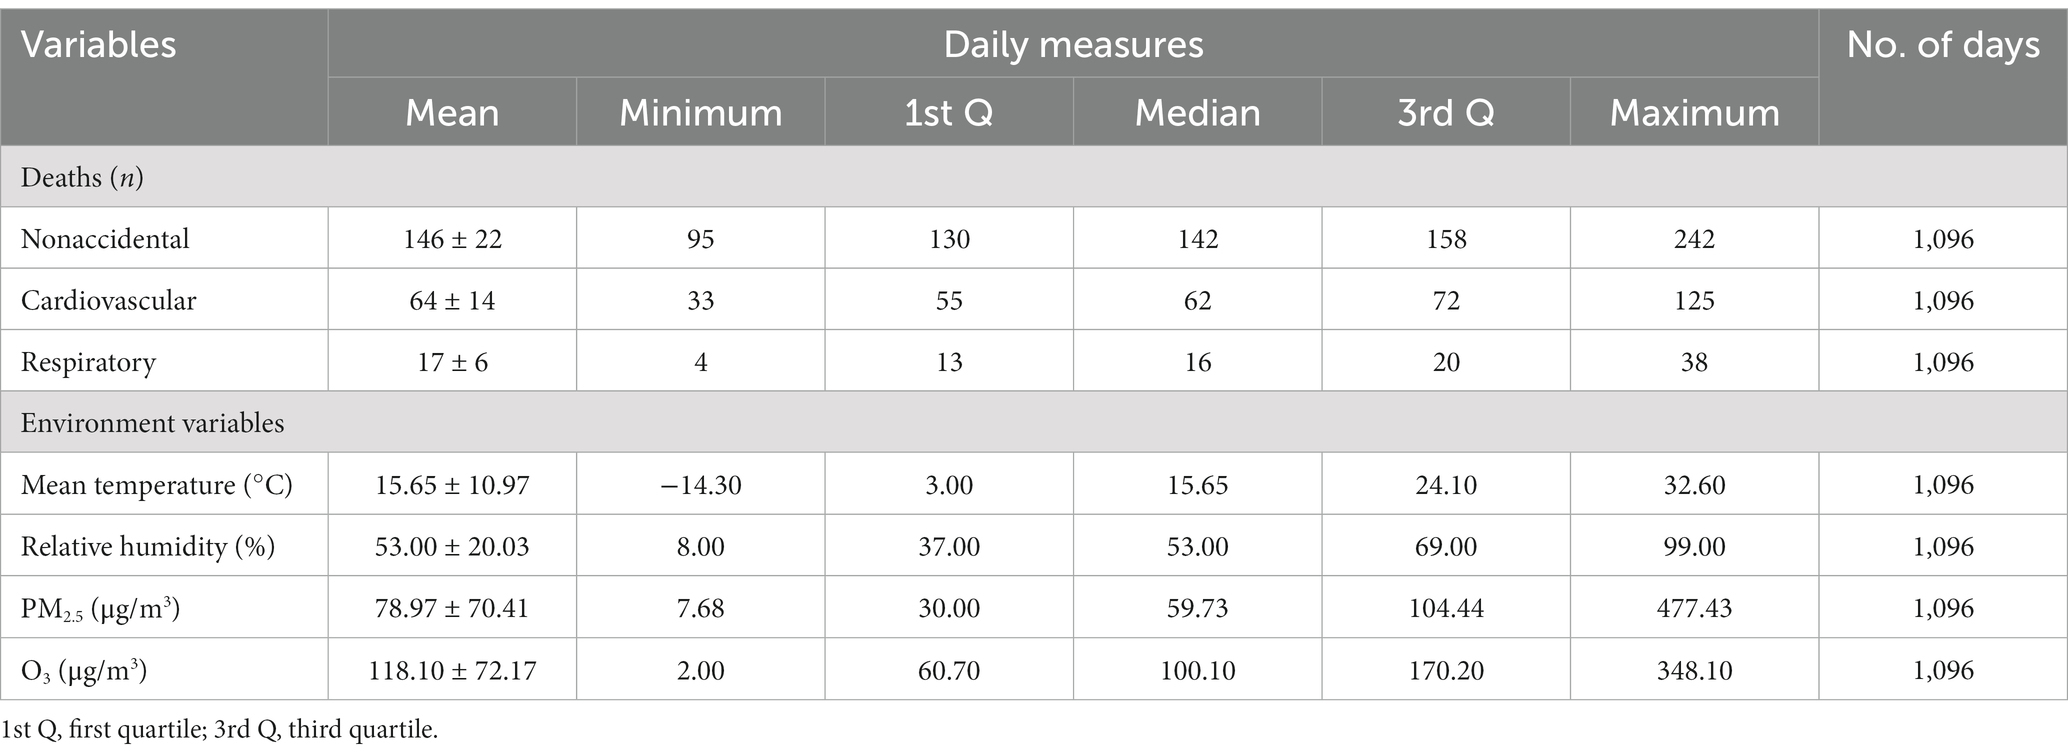
Table 1. Daily summary statistics of the air pollution levels, meteorological variables and number of deaths in Beijing, China, from 2014 to 2016.
The Spearman correlation coefficients of the three mortality categories and different environmental factors are shown in Figure 1. The three mortality categories were all significantly negatively correlated with the mean temperature, RH, and O3 concentration and significantly positively correlated with the PM2.5 concentration. The Spearman correlation between PM2.5 and O3 was low even though it was statistically significant (r = −0.07, p < 0.001), indicating the possibility of interaction effects on three mortality categories.
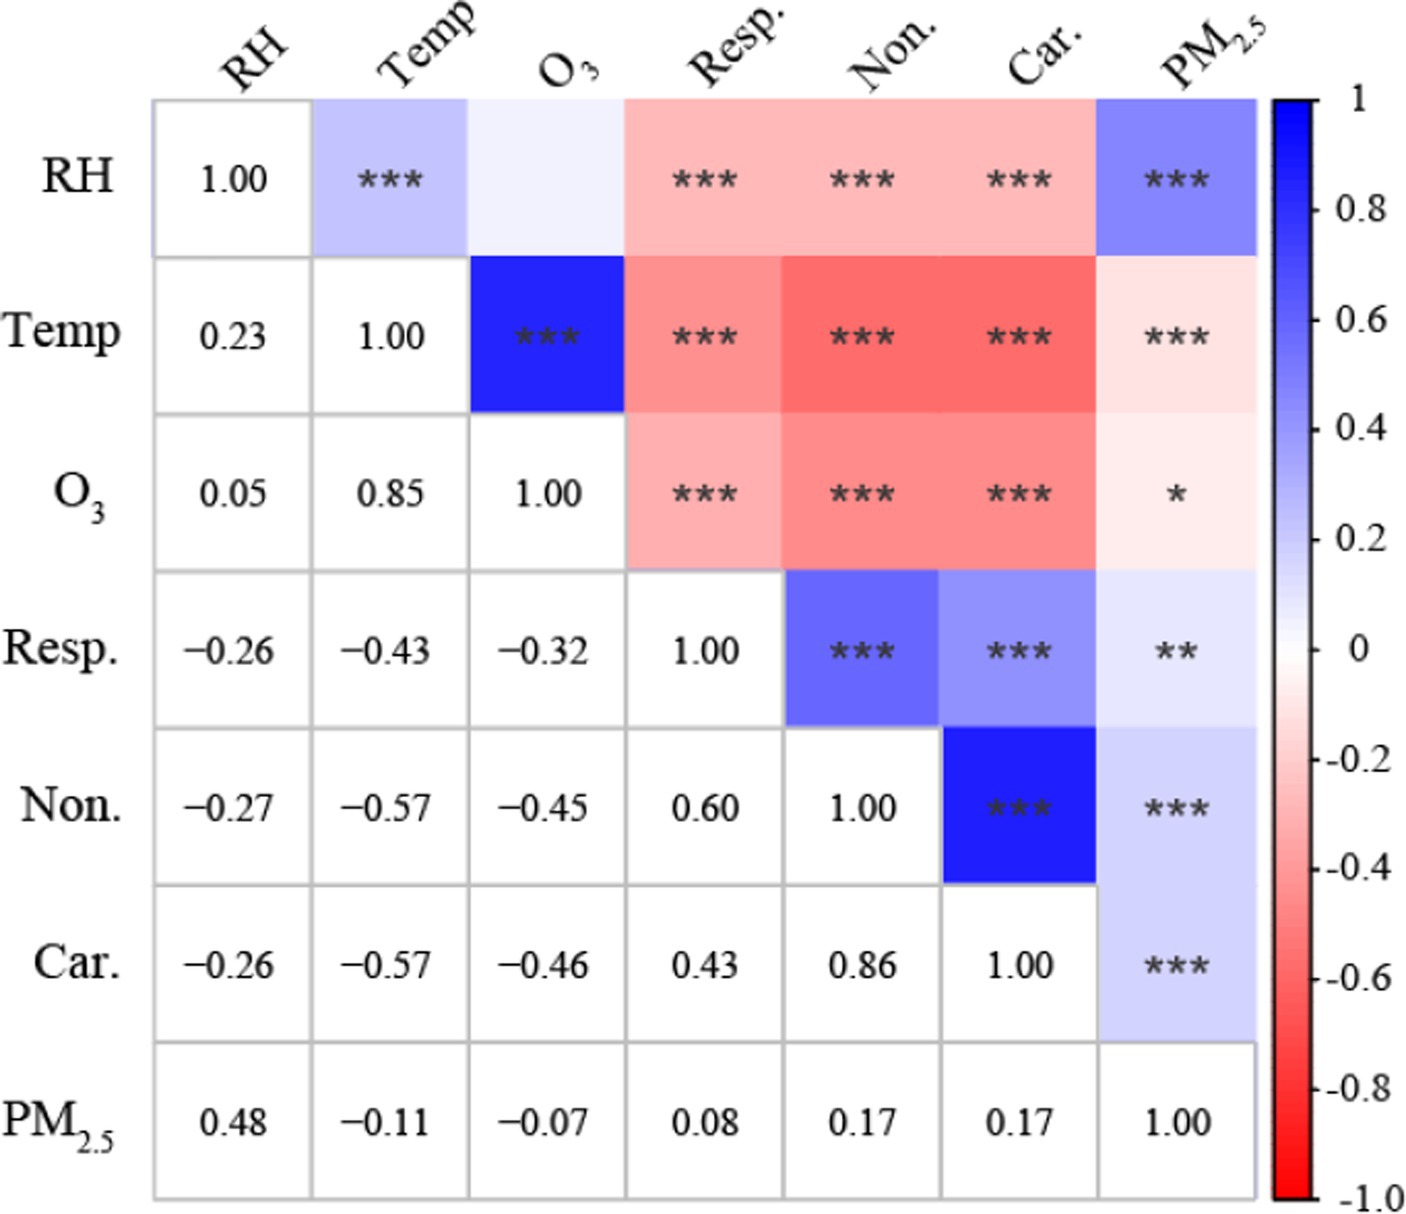
Figure 1. Spearman correlation matrix between the three mortality categories and different environmental factors in Beijing, China. *p < 0.05, **p < 0.01, ***p < 0.001. Non, Nonaccidental mortality; Car, Cardiovascular mortality; Resp, Respiratory mortality; Temp, mean temperature; RH, relative humidity.
Figure 2 illustrates the individual effects of PM2.5 and O3 on health outcomes at different lags. The individual effects of PM2.5 and O3 on the three mortality categories all peaked at lag day 01. Specifically, the increase in the nonaccidental, cardiovascular, and respiratory mortality categories was 0.32% (95% CI: 0.21, 0.43%), 0.36% (95% CI: 0.21, 0.50%), and 0.43% (95% CI: 0.28, 0.58%) for each 10-μm−3 increase in the PM2.5 concentration (lag day 01), and 0.22% (95% CI: 0.08, 0.36%), 0.37% (95% CI: 0.21, 0.53%), and 0.25% (95% CI: 0.12, 0.37%) for each 10-μg/m3 increase in the O3 concentration (lag day 01), respectively.
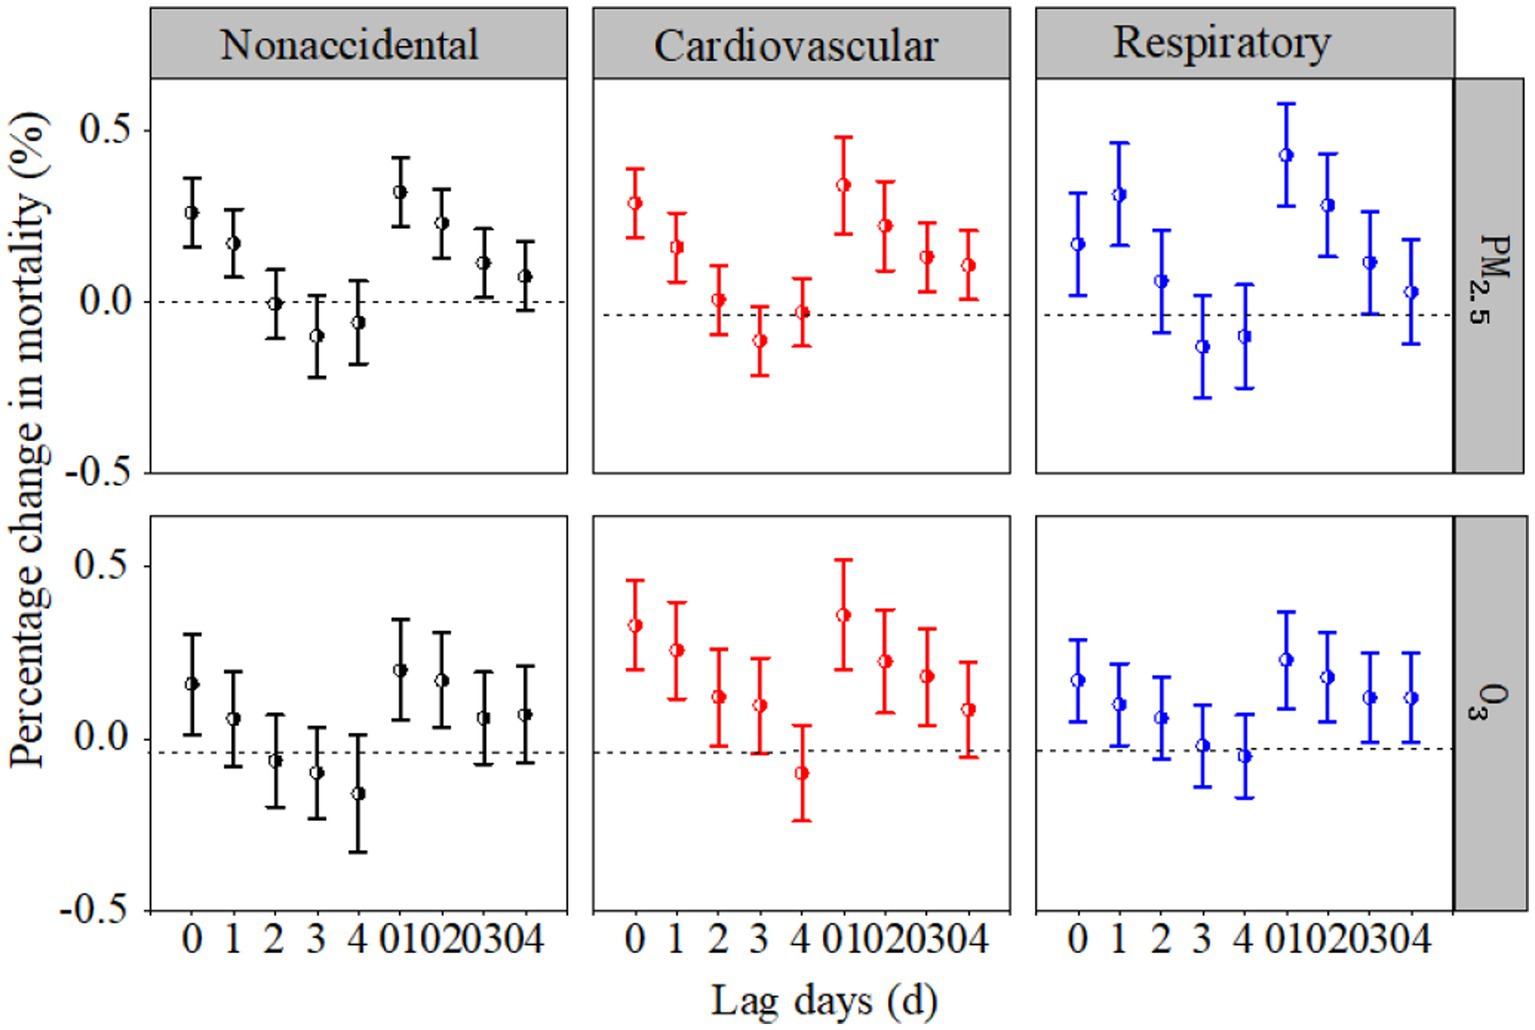
Figure 2. Percentage changes (%) in the three mortality categories associated with each 10-μg/m3 increase in PM2.5 and O3 concentrations at different lag days in the single-pollutant models.
Figure 3 depicts the joint effects of PM2.5 and O3 on health outcomes at different lags. As with the individual effects of PM2.5 and O3, the joint effects of PM2.5 and O3 on the three mortality categories all peaked at lag day 01. The corresponding CRIs for nonaccidental, respiratory and cardiovascular mortality were 0.34% (95% CI: 0.16, 0.52%), 0.43% (95% CI: 0.21, 0.65%), and 0.46% (95% CI: 0.23, 0.70%), respectively. Importantly, for the same category of diseases, the joint effect represented by CRI was higher than for any single pollutant effect estimate at lag day 01. Overall, the CRIs implied that a single-pollutant effect did not accurately represent the whole health effects of the mixture. In the subsequent analysis, both PM2.5 and O3 at lag day 01 were used as the research objects.
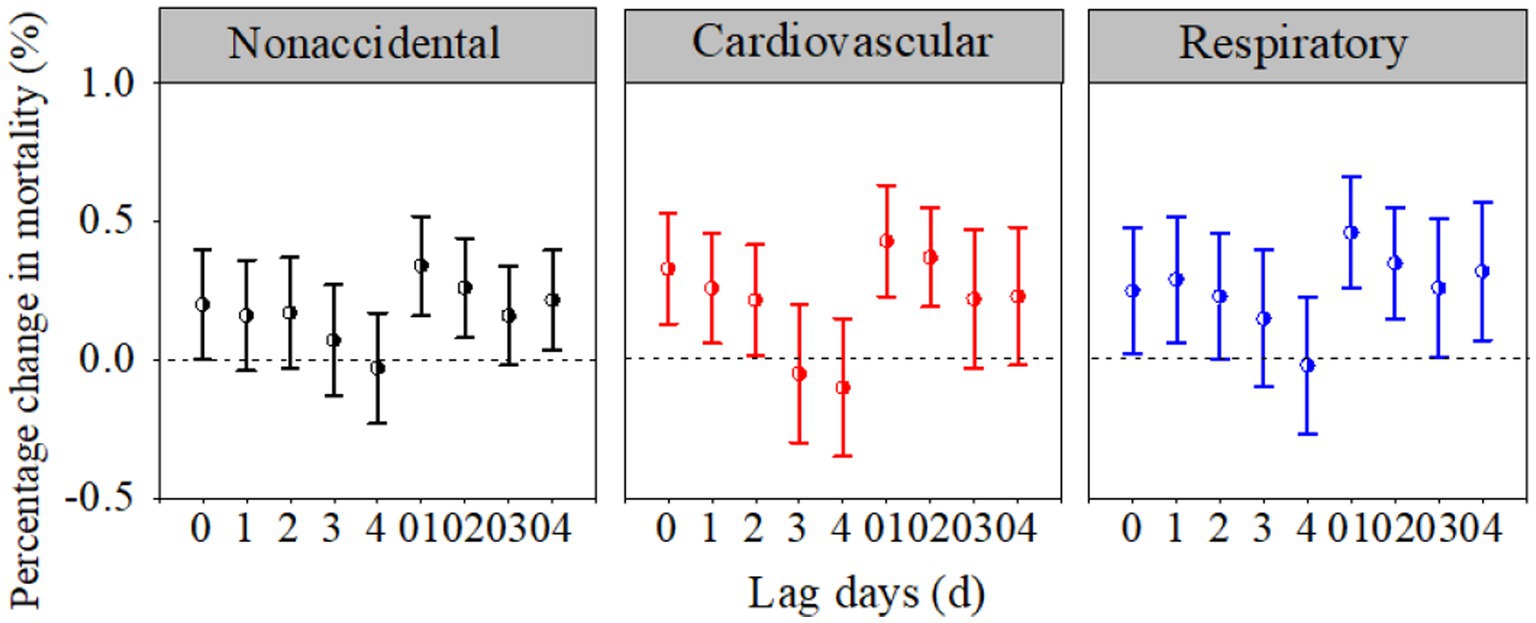
Figure 3. Percentage changes (%) in the three mortality categories associated with each 10-μg/m3 increase in the PM2.5 and O3 concentrations at different lag days in the multipollutant models.
Figure 4 illustrates the combined effects of PM2.5 and O3 on the three mortality categories using three-dimensional visualization graphs. The response surfaces show that the combined effects of PM2.5 (lag day 01) and O3 (lag day 01) on nonaccidental, cardiovascular, and respiratory deaths were complicated. Notably, when high concentrations of PM2.5 and O3 coexisted, all three categories (nonaccidental, cardiovascular, and respiratory fatalities) reached their maximums, showing that the interaction effects could be synergistic.
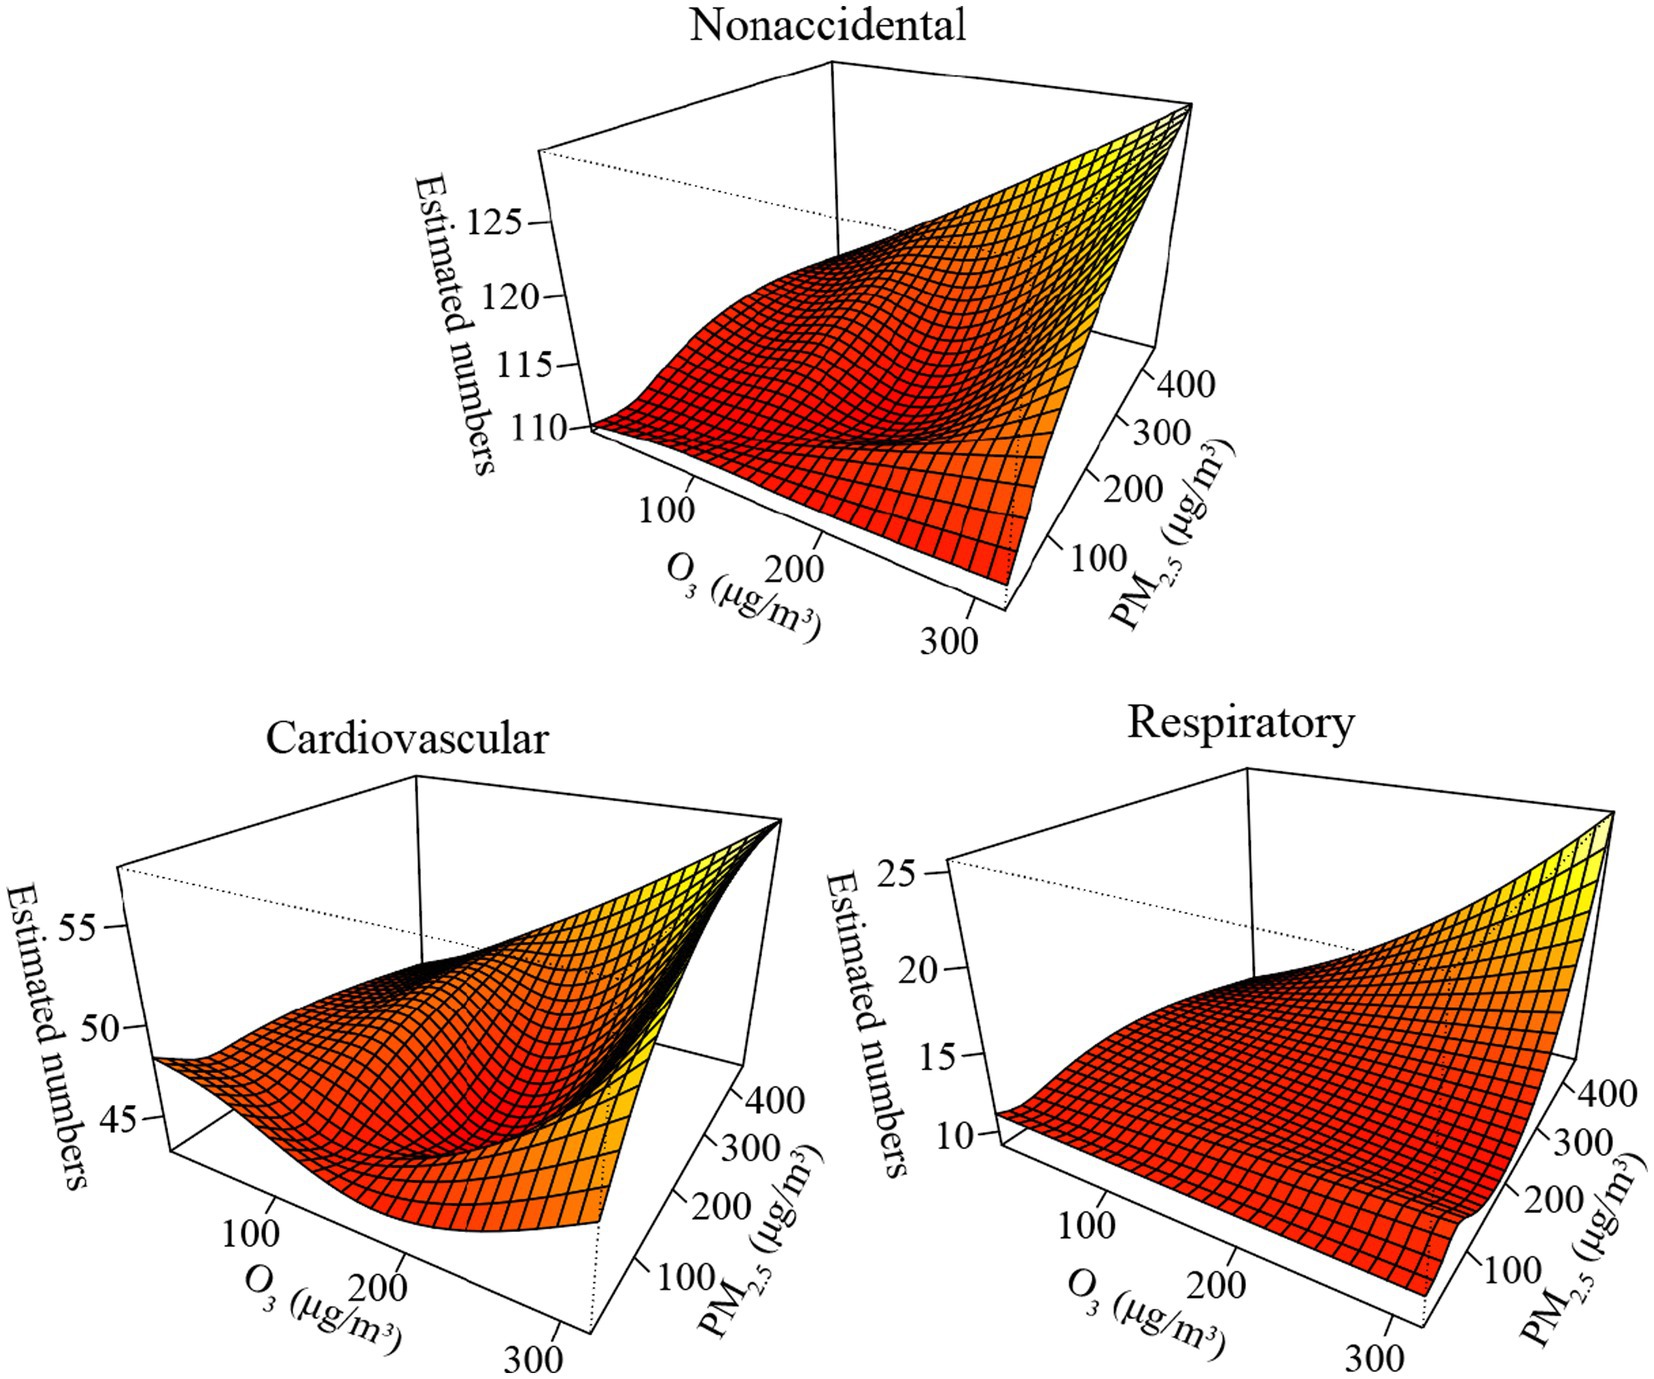
Figure 4. Bivariate response surfaces of PM2.5 and O3 for nonaccidental, cardiovascular, and respiratory deaths in Beijing, China.
Table 2 depicts the individual and joint effects of PM2.5 (lag day 01) and O3 (lag day 01) on health outcomes during the whole period and the CAP period. For the same kind of illness, the CRIs of the joint effects during both the whole period and the CAP period were higher than any single-pollutant effect estimates. In addition, the joint effects during the CAP period were remarkably larger than those during the whole period, indicating that the CAP period further exacerbated the combined effects of PM2.5 and O3 on the three mortality categories.
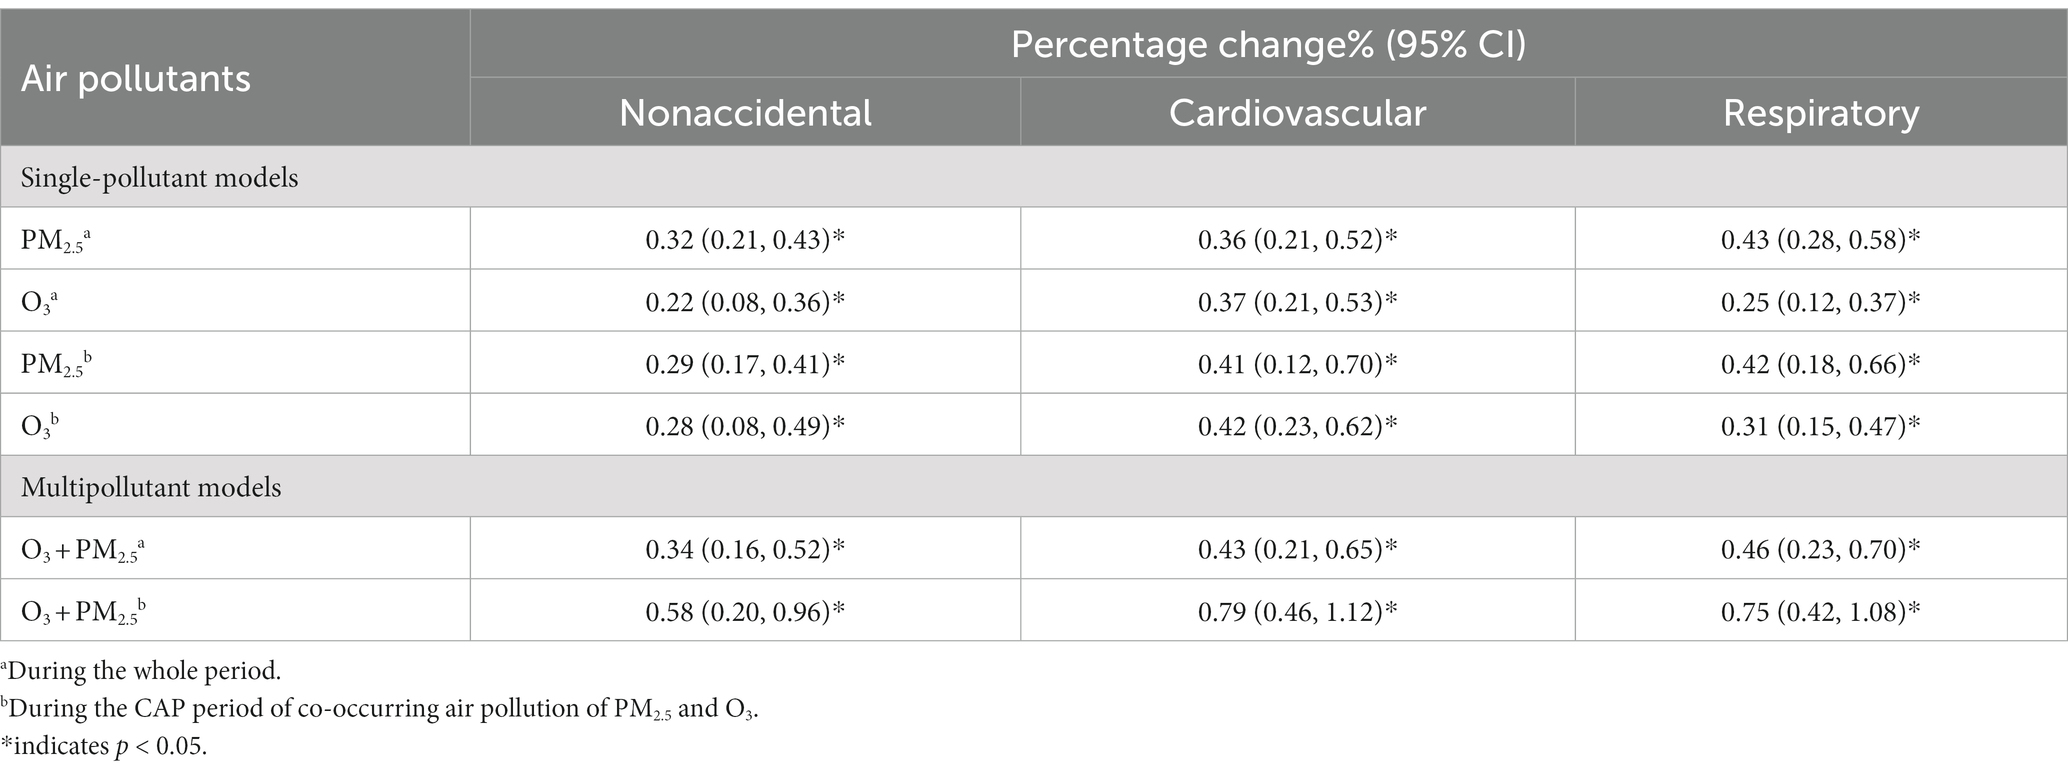
Table 2. Percentage changes (%) in nonaccidental, respiratory, and cardiovascular mortality associated with each 10-μg/m3 increase in the PM2.5 and O3 concentrations during the whole period and the CAP period.
According to the results of the sensitivity analyzes, the effects of O3 (or PM2.5) remained robust regardless of the change in the df of the time (see Supplementary Figure S1), the df of the mean temperature, and the df of the RH (see Supplementary Table S1).
4. Discussion
The CAP of PM2.5 and O3 has become a major environmental and health concern worldwide (7). Evaluating the short-term individual and joint effects of PM2.5 and O3 on health outcomes could provide valuable evidence for policymakers to regulate and prevent the accumulation of PM2.5 and O3. Our findings demonstrated that PM2.5/O3 was significantly associated with nonaccidental and cause-specific (cardiovascular and respiratory) mortality in Beijing, China. Additionally, the joint effects of the dual pollutants could further exacerbate their individual effects, especially during the CAP period.
Numerous studies of the individual effects of air pollutants, particularly PM2.5 and O3, on public health have been conducted (1, 25). For example, a meta-analysis conducted in 272 Chinese cities by Chen et al. (26) showed that a 10-μg/m3 increase in the PM2.5 concentration was associated with an increase in nonaccidental, cardiovascular, and respiratory mortality of 0.27, 0.39, and 0.29%, respectively. Another meta-analysis in China (27) revealed that an increase of 10-μg/m3 in the O3 concentration caused increases of 0.24 and 0.27% in nonaccidental and cardiovascular mortality, respectively. In this study, the results from the single-pollutant models revealed that each 10-μg/m3 increase in the PM2.5 concentration caused increases of 0.32, 0.36, and 0.43% in nonaccidental, cardiovascular, and respiratory mortality, respectively, and each 10-μg/m3 increase in the O3 concentration caused increases of 0.22, 0.37, and 0.25% in nonaccidental, cardiovascular, and respiratory mortality, respectively, in Beijing, China. Our estimates of the PM2.5–mortality and O3–mortality relationships were generally consistent with those of previous studies.
In the multipollutant models, our findings suggested that the estimates of the joint effects of the two air pollutants on mortality were higher than those for any individual effect for the same kind of illness. Consistent with our findings, a study conducted by Lei et al. (28) in Hefei, China, indicated that the effects of the health risks caused by PM2.5 on nonaccidental mortality increased when O3 was included, and vice versa, indicating that O3 and PM2.5 could aggravate each other’s unfavorable health effects. A cross-sectional study conducted in six countries revealed a synergistic interaction effect of PM2.5 and O3 on disease deterioration (29). However, in contrast to our findings, Qu et al. (30) observed that when O3 was included, the effect of PM2.5 on nonaccidental mortality was reduced. Moreover, several earlier studies showed no interaction effects of PM2.5 and O3 (31, 32). This inconsistency could be attributed to differences in the chemical composition, source, and toxicity of PM2.5 and O3 in different regions. Furthermore, the differences in study methods and individual sensitivity to pollutants can also lead to different results (33).
Notably, the patterns of the combined effects of PM2.5 and O3 on mortality demonstrated that coexisting high concentrations of PM2.5 and O3 could have synergistic effects on three mortality categories (34). Biological mechanisms have been somewhat postulated to explain the potential interaction effect of PM2.5 and O3 pollution on respiratory and cardiovascular mortality, despite the lack of clear evidence for a direct synergistic effect of the two pollutants on illnesses. For example, a few toxicology experiments on rats validated that the particulate matter served as a carrier for O3, delivering O3 into the body (35). Inhaling particles and O3 together had a synergistic impact on airway responsiveness and allergic inflammation in mice (36), suggesting that combined exposure to O3 and PM2.5 markedly increased health risks (37). Therefore, people, especially those with chronic respiratory and cardiovascular diseases, should strengthen protection measures and reduce outdoor activities, especially on CAP of PM2.5 and O3 days.
The key advantage of this study is as follows: Current research on CAP primarily focuses on the characteristics of changes in PM2.5 and O3 concentrations, meteorological causes, and their mutual influences. However, there is less emphasis on the joint health effects of PM2.5 and O3 during CAP periods (7, 38). Furthermore, traditional multipollutant models mainly focus on describing the difference in the health effects of a single pollutant before and after the addition of other pollutants without quantifying the combined effects of multiple pollutants (6). Our study differs from traditional studies, as we utilized multiple methods to examine the harmful health effects associated with exposure to one and two pollutants. We also conducted stratification studies on pollution, with a specific focus on the combined health effects of PM2.5 and O3 during the CAP period. Furthermore, we used the CRI to accurately quantify the joint effects of PM2.5 and O3 during both the whole and CAP periods. This approach addresses the limitations of previous research to a significant extent (16).
There are several limitations of our study that should be acknowledged. First and foremost, due to the difficulty in obtaining disease data in China, the study only included a 3-year disease death time series, and the time coverage was relatively limited. The latest year’s death data could not be obtained, which could reduce the statistical power. Second, in keeping with many previous studies (4, 39), we did not collect data on the real-time pollution exposure levels of individuals and only used the outdoor air pollutant concentration to represent individual PM2.5 and O3 exposure levels, which inevitably led to some deviation in the results (33). Third, the two most dangerous pollutants in China at this time are PM2.5 and O3. This study only tentatively carried out research on the interaction effect between PM2.5 and O3 on public health and did not carry out in-depth research on interaction effects with other air pollutants (such as O3 and nitrogen dioxide, sulfur dioxide and PM2.5). Therefore, with the improvement of research methods at a later stage, further in-depth study of the health effects of interactions between different air pollutants on human health should be carried out.
5. Conclusion
Our findings showed that exposure to PM2.5 and O3 may be significant risk factors for nonaccidental, cardiovascular, and respiratory mortality in Beijing, China. Moreover, we found that combined exposure to PM2.5 and O3 could amplify their individual effects on three mortality categories, particularly during CAP of PM2.5 and O3 periods. Therefore, during the CAP periods, the public should take timely preventive measures and reduce outdoor activities to some extent to reduce air pollution hazards.
Data availability statement
The data analyzed in this study is subject to the following licenses/restrictions: Authors are not allowed to disclose data. Requests to access these datasets should be directed to YZ, emhhbmd5ODgxMjA4QDEyNi5jb20=.
Author contributions
YZ: writing—review and editing, methodology, designed the research, and wrote the manuscript. SZ and XH: methodology and designed the research. JX: methodology, designed and reviewed the research, and reviewed the research. SW: formal analysis and reviewed the research. CZ: collected and analyzed the data. SL: writing—review and editing, formal analysis, and collected and analyzed the data. All authors contributed to the article and approved the submitted version.
Funding
This study was supported by the National Nature Science Foundation of China (42005136), Innovation Team Fund of Southwest Regional Meteorological Center, China Meteorological Administration (XNQYCXTD-202203), China Postdoctoral Science Foundation (2020M670419), and National Key Research and Development Project Program of China (2016YFA0602004). This work was supported in part by Chengdu Plain Urban Meteorology and Environment Sichuan Provincial Field Scientific Observation and Research Station, Chengdu, China.
Conflict of interest
The authors declare that the research was conducted in the absence of any commercial or financial relationships that could be construed as a potential conflict of interest.
Publisher’s note
All claims expressed in this article are solely those of the authors and do not necessarily represent those of their affiliated organizations, or those of the publisher, the editors and the reviewers. Any product that may be evaluated in this article, or claim that may be made by its manufacturer, is not guaranteed or endorsed by the publisher.
Supplementary material
The Supplementary material for this article can be found online at: https://www.frontiersin.org/articles/10.3389/fpubh.2023.1232715/full#supplementary-material
Footnotes
References
1. Bont, J, Jaganathan, S, Dahlquist, M, Persson, Å, Stafoggia, M, and Ljungman, P. Ambient air pollution and cardiovascular diseases: an umbrella review of systematic reviews and meta-analyses. J Intern Med. (2022) 291:779–800. doi: 10.1111/joim.13467
2. Dimakopoulou, K, Grivas, G, Samoli, E, et al. Determinants of personal exposure to ozone in school children. Results from a panel study in Greece. Environmental research. (2017) 154:66–72.
3. Yin, P, Brauer, M, Cohen, AJ, Wang, H, Li, J, Burnett, RT, et al. The effect of air pollution on deaths, disease burden, and life expectancy across China and its province, 1990-2017: an analysis for the global of disease study 2017. Lancet Planet Health. (2020) 4:e386–98. doi: 10.1016/S2542-5196(20)30161-3
4. Chen, K, Wolf, K, Hampel, R, Stafoggia, M, Breitner, S, Cyrys, J, et al. Does temperature-confounding control influence the modifying effect of air temperature in ozone–mortality associations? Environ Epidemiol. (2018) 2:1. doi: 10.1097/EE9.0000000000000008
5. Fan, S J, Heinrich, J, Bloom, M S, et al. Ambient air pollution and depression: a systematic review with meta-analysis up to 2019. Sci. Total Environ.. (2020) 701:134721.
6. Li, M, Dong, H, Wang, B, Zhao, W, Zare Sakhvidi, MJ, Li, L, et al. Association between ambient ozone pollution and mortality from a spectrum of causes in Guangzhou China. Sci. Total Environ. (2020) 754:142110. doi: 10.1016/j.scitotenv.2020.142110
7. Wu, XY, Xin, JY, Zhang, WY, Gao, W, Ma, Y, Ma, Y, et al. Variation characteristics of air combined pollution in Beijing City. Atmos Res. (2022) 274:106197. doi: 10.1016/j.atmosres.2022.106197
8. Li, K, Jacob, DJ, Liao, H, Shen, L, Zhang, Q, and Bates, KH. Anthropogenic drivers of 2013–2017 trends in summer surface ozone in China. Proc Natl Acad Sci. (2019) 116:422–7. doi: 10.1073/pnas.1812168116
9. Lu, X, Zhang, L, Wang, X, Gao, M, Li, K, Zhang, Y, et al. Rapid increases in warm-season surface ozone and resulting health impact in China since 2013. Environ Sci Technol Lett. (2020) 7:240–7. doi: 10.1021/acs.estlett.0c00171
10. Luo, Y, Zhao, T, Yang, Y, Zong, L, Kumar, KR, Wang, H, et al. Seasonal changes in the recent decline of combined high PM2.5 and O3 pollution and associated chemical and meteorological drivers in the Beijing–Tianjin–Hebei region, China. Sci Total Environ. (2022) 838:156312. doi: 10.1016/j.scitotenv.2022.156312
11. Zhai, SX, Jacob, DJ, Wang, X, Shen, L, Li, K, Zhang, Y, et al. Fine particulate matter (PM2.5) trends in China, 2013–2018: separating contributions from anthropogenic emissions and meteorology. Atmos Chem Phys. (2019) 19:11031–41. doi: 10.5194/acp-19-11031-2019
12. Chen, XK, Jiang, Z, Shen, YN, Li, R, Fu, Y, Liu, J, et al. Chinese regulations are working-why is surface ozone over industrialized areas still high? Applying lessons from northeast US air quality evolution. Geophys Res Lett. (2021) 48:e2021GL092816. doi: 10.1029/2021GL092816
13. Zhao, SP, Yin, DY, Yu, Y, Kang, S, Qin, D, Dong, L, et al. PM2.5 and O3 pollution during 2015–2019 over 367 Chinese cities: spatiotemporal variations, meteorological and topographical impacts. Environ Pollut. (2020) 264:114694. doi: 10.1016/j.envpol.2020.114694
14. Winquist, A, Kirrane, E, Klein, M, Strickland, M, Darrow, LA, Sarnat, SE, et al. Joint effects of ambient air pollutants on pediatric asthma emergency department visits in Atlanta, 1998-2004. Epidemiology. (2014) 25:666–73. doi: 10.1097/EDE.0000000000000146
15. Bae, S, Lim, Y H, and Hong, Y C. Causal association between ambient ozone concentration and mortality in Seoul, Korea. Environ Res. (2020) 182:109098.3.
16. Huang, WZ, He, WY, Knibbs, LD, Jalaludin, B, Guo, YM, Morawska, L, et al. Improved morbidity-based air quality health index development using Bayesian multi-pollutant weighted model. Environ Res. (2022) 204:112397. doi: 10.1016/j.envres.2021.112397
17. Costa, AF, Hoek, G, Brunekreef, B, and Ponce de Leon, ACM. Air pollution and deaths among elderly residents of São Paulo, Brazil: an analysis of mortality displacement. Environ Health Perspect. (2017) 125:349–54. doi: 10.1289/EHP98
18. Samoli, E, Atkinson, RW, Analitis, A, Fuller, GW, Green, DC, Mudway, I, et al. Associations of short-term exposure to traffic-related air pollution with cardiovascular and respiratory hospital admissions in London UK. Occup Environ Med. (2016) 73:300–7. doi: 10.1136/oemed-2015-103136
19. Meng, X, and Long, Y. Shrinking cities in China: evidence from the latest two population censuses 2010–2020. Environ Plan A. (2022) 54:449–53. doi: 10.1177/0308518X221076499
20. WHO. Meta-Analysis of Time-Series Studies and Panel Studies of Particulate Matter (PM) and Ozone (O3). Document EUR/04/5042688. Copenhagen: WHO Regional Office for Europe (2004).
21. Zhang, Y, Wang, S, Fan, X, and Ye, X. Temperature modulation of the health effects of particulate matter in Beijing, China. Environ Sci Pollut Res. (2018) 25:10857–66. doi: 10.1007/s11356-018-1256-3
22. GB 3095-2012. Ambient air quality standards. Available at: http://www.wxbh.gov.cn/doc/2021/11/04/3479116.shtml
23. Gasparrini, A, Guo, YM, Hashizume, M, Lavigne, E, Zanobetti, A, Schwartz, J, et al. Mortality risk attributable to high and low ambient temperature: a multicountry observational study. Lancet. (2015) 386:369–75. doi: 10.1016/S0140-6736(14)62114-0
24. Jerrett, M, Burnett, RT, Beckerman, BS, Turner, MC, Krewski, D, Thurston, G, et al. Spatial analysis of air pollution and mortality in California. Am J Respir Crit Care Med. (2013) 188:593–9. doi: 10.1164/rccm.201303-0609OC
25. Stafoggia, M, Oftedal, B, Chen, J, et al. Long-term exposure to low ambient air pollution concentrations and mortality among 28 million people: results from seven large European cohorts within the ELAPSE project. Lancet Planet. Health. (2022) 6:e9–e18.
26. Chen, R, Yin, P, Meng, X, Liu, C, Wang, L, Xu, X, et al. Fine particulate air pollution and daily mortality. A nationwide analysis in 272 Chinese cities. Am J Respir Crit Care Med. (2017) 196:73–81. doi: 10.1164/rccm.201609-1862OC
27. Yin, P, Chen, R, Wang, L, Meng, X, Liu, C, Niu, Y, et al. Ambient ozone pollution and daily mortality: a nationwide study in 272 Chinese cities. Environ Health Perspect. (2017) 125:117006. doi: 10.1289/EHP1849
28. Lei, R, Zhu, F, Cheng, H, Liu, J, Shen, C, Zhang, C, et al. Short-term effect of PM2.5/O3 on non-accidental and respiratory deaths in highly polluted area of China. Atmospheric. Pollut Res. (2019) 10:1412–9. doi: 10.1016/j.apr.2019.03.013
29. Lin, H, Guo, Y, Ruan, Z, Yang, Y, Chen, Y, Zheng, Y, et al. Ambient PM2.5 and O3 and their combined effects on prevalence of presbyopia among the elderly: a cross-sectional study in six low-and middle-income countries. Sci Total Environ. (2019) 655:168–73. doi: 10.1016/j.scitotenv.2018.11.239
30. Qu, Y, Pan, Y, Niu, H, He, Y, Li, M, Li, L, et al. Short-term effects of fine particulate matter on non-accidental and circulatory diseases mortality: a time series study among the elder in Changchun. PLoS One. (2018) 13:e0209793. doi: 10.1371/journal.pone.0209793
31. Guo, J, Ma, MY, Xiao, CL, Zhang, C, Chen, J, Lin, H, et al. Association of air pollution and mortality of acute lower respiratory tract infections in Shenyang, China: a time series analysis study. Iran J Public Health. (2018) 47:1261–71.
32. Song, J, Lu, M, Zheng, L, Liu, Y, Xu, P, Li, Y, et al. Acute effects of ambient air pollution on outpatient children with respiratory diseases in Shijiazhuang, China. BMC Pulm Med. (2018) 18:1–10. doi: 10.1186/s12890-018-0716-3
33. Zhang, Y, Wang, S, Zhang, X, Ni, C, Zhang, J, and Zheng, C. Temperature modulation of the adverse consequences on human mortality due to exposure to fine particulates: a study of multiple cities in China. Environ Res. (2020) 185:109353. doi: 10.1016/j.envres.2020.109353
34. Pope, CA, Burnett, RT, Thurston, GD, Thun, MJ, Calle, EE, Krewski, D, et al. Cardiovascular mortality and Long-term exposure to particulate air pollution epidemiological evidence of general pathophysiological pathways of disease. Circulation. (2004) 109:71–7. doi: 10.1161/01.CIR.0000108927.80044.7F
35. Warren, D L, and Last, J A. Synergistic interaction of ozone and respirable aerosols on rat lungs: III. Ozone and sulfuric acid aerosol. Toxicol. Appl. Pharmacol. (1987) 88:203–216.
36. Kobzik, L, Goldsmith, CA, Ning, YY, Qin, G, Morgan, B, Imrich, A, et al. Effects of combined ozone and air pollution particle exposure in mice. Res Rep Health Eff Inst. (2001) 106:5–29.
37. Mølhave, L, Kjærgaard, SK, Sigsgaard, T, and Lebowitz, M. Interaction between ozone and airborne particulate matter in office air. Indoor Air. (2005) 15:383–92. doi: 10.1111/j.1600-0668.2005.00366.x
38. Wang, M, Tang, G, Liu, Y, Ma, M, Yu, M, Hu, B, et al. The difference in the boundary layer height between urban and suburban areas in Beijing and its implications for air pollution. Atmos Environ. (2021) 260:118552. doi: 10.1016/j.atmosenv.2021.118552
Keywords: PM2.5, O3, combined air pollution, joint effects, mortality, Beijing
Citation: Zhang Y, Zhang S, Xin J, Wang S, He X, Zheng C and Li S (2023) Short-term joint effects of ambient PM2.5 and O3 on mortality in Beijing, China. Front. Public Health. 11:1232715. doi: 10.3389/fpubh.2023.1232715
Edited by:
Zhaobin Sun, Chinese Academy of Meteorological Sciences, ChinaReviewed by:
Jianxiong Hu, Guangdong Provincial Center for Disease Control and Prevention, ChinaZhang Shuwen, Beijing University of Chinese Medicine, China
Copyright © 2023 Zhang, Zhang, Xin, Wang, He, Zheng and Li. This is an open-access article distributed under the terms of the Creative Commons Attribution License (CC BY). The use, distribution or reproduction in other forums is permitted, provided the original author(s) and the copyright owner(s) are credited and that the original publication in this journal is cited, in accordance with accepted academic practice. No use, distribution or reproduction is permitted which does not comply with these terms.
*Correspondence: Jinyuan Xin, eGp5QG1haWwuaWFwLmFjLmNu; Shihong Li, bHNobHR6MUAxNjMuY29t