
95% of researchers rate our articles as excellent or good
Learn more about the work of our research integrity team to safeguard the quality of each article we publish.
Find out more
ORIGINAL RESEARCH article
Front. Public Health , 04 August 2023
Sec. Infectious Diseases: Epidemiology and Prevention
Volume 11 - 2023 | https://doi.org/10.3389/fpubh.2023.1190085
This article is part of the Research Topic Emerging and Re-emerging Viral Infections: Epidemiology, Pathogenesis and New Methods for Control and Prevention View all 31 articles
 Feyiso Bati Wariso1*
 Jemal Ayalew2
 Ammar Barba1Birra Bejiga Bedassa1Gemechu Gudeta Ebo1
 Jaleta Bulti Tura1Mohammed Rameto1Wudinesh Belete Belihu1
 Derbachew Asfaw1Minilik Demissie Amogne1
 Lemessa Negeri1Sileshi Lulseged3Saro Abdella Abrahim1
Background: Sexually transmitted infections (STIs) remain a major public health problem worldwide, with the burden of these infections being high among female sex workers (FSWs), who are often not aware of their infection status. This study aimed to determine the factors that are associated with the number of STIs among FSWs in Ethiopia.
Methods: A cross-sectional bio-behavioral study involving respondent-driven sampling (RDS) was conducted among 6,085 FSWs in 16 towns in Ethiopia. The hurdle Poisson regression model was fitted using STATA Version 16.2. The incident rate ratio and adjusted odds ratio with a 95% confidence interval were employed to show the strength and direction of the association. A p-value of ≤0.05 was used as a threshold for statistical significance.
Results: At least one STI was identified in 1,444 (23.64%) of the FSWs. Age group 35–49 years [IRR = 2.32; 95% CI (1.43, 3.74)], forced first sex [IRR = 1.32; 95% CI (1.01, 1.74)], condom breakage [IRR = 1.32; 95% CI (1.01, 1.74)], and a history of depression [IRR = 1.55; 95% CI (1.12, 2.18)] increase the number of STIs. FSWs aged 25–34 years [AOR = 2.99; % CI (2.54, 3.52)] and 35 = 59 years [AOR = 8.05; % CI (6.54, 9.91)], who were selling sex for 5–10 years [AOR = 1.30; 95% CI (1.1, 1.55)], and above 11 years [AOR = 1.21; 95% CI (1.03, 1.43)] were more likely to get STIs.
Conclusion: STIs are common in Ethiopia. The covariates age, educational status, monthly income, condom failure, age at the first sexual encounter, and long duration of sexual practice are significant predictors of STIs. Health interventions among FSWs need to include awareness generation about the prevention and control of STIs and address the determinants identified in this analysis.
- What is already known on this topic: The prevalence of STIs among FSWs varies across different countries and is determined by various sociodemographic factors, which are not known in Ethiopia.
- What this study adds: STIs are highly prevalent among FSWs in Ethiopia, and factors such as age, educational status, monthly income, and condom use determine their occurrence.
- How this study might affect research, practice, or policy: Awareness generation on the high prevalence and the determinants need to be considered in health policy and strategy formulation and further research on the prevention and control of STIs among FSWs.
Sexually transmitted infections (STIs) are common and constitute public health concerns globally (1, 2). They include viral infections such as human immunodeficiency virus (HIV), hepatitis B virus (HBV), and hepatitis C virus (HCV), as well as other bacterial STIs, specifically syphilis. According to the World Health Organization's (WHO) estimate, more than 1 million people are newly infected worldwide with STIs each day (2). This is equivalent to 374 million people infected per year, of which 96 million are in Africa. Globally, more than 4.5 million people contract HIV and viral hepatitis each year, and among adults aged 15 to 49, 7.1 million new cases of syphilis are identified (2–4).
STIs remain a major public health problem in Africa (5, 6). The Global Burden of Disease (GBD) (1) estimates that the age-standardized incidence rate (ASIR) for STIs is 9,535 per 100,000 person-years, with the highest rate estimated at 19,973 per 100,000 person-years in 2019 being in sub-Saharan Africa (SSA). STIs constitute the second-leading cause of mortality and disability-adjusted life years (DALYs) in low- and middle-income countries, particularly among those aged 20–24 years (3). Globally, over 2.3 million people died as a result of STIs (4) in 2021, which also accounted for the increased number of years of life lost (1). According to a study conducted in Botswana, DALYs increased with time due to HIV and other STIs (7).
STIs also increase the risk of cancer and account for 13% of global cancer incidence, with the highest rate in SSA in 2018 (4). HBV and HCV are the most common primary causes of cancer (8). STIs increase medical costs (9), are drug resistant, and are associated with an array of maternal and neonatal morbidities (3, 10), as well as a stigma among FSWs (11).
STIs are prevalent, particularly among key populations, including adolescents, young adults, and FSWs (4), owing to the high probability of co-infections, overlapping routes of transmission, and common health determinants. FSWs bear the greatest burden of STIs (4) because of their sexual behavior, which puts them at higher risk of acquiring the infection (1, 12); their vulnerability to violence and having the most limited access to health and social services exacerbate the problem (4).
The prevalence of STIs among FSWs varies by country and across different studies (11, 13–16) ranging from 13.3% (14) to 43.2% (11). In Ethiopia, 23% of FSWs reported having one or more STIs (15). The prevalence of STI co-infection in FSWs also varies across studies from different countries (14, 17–19). The prevalence of HIV and syphilis co-infection ranges across studies from 1.09 (14) to 43% (17), and HCV and HBV were reported in 40 and 2% of FSWs with HIV/AIDS worldwide, respectively.
The prevalence of STIs and co-infections is high among FSWs (9, 18, 20). Several factors determining the occurrence of STIs among FSWs have been reported, including age, lower education level (21), and unemployment (21, 22). Factors such as frequent unsafe intercourse with various sex workers (21, 23), current drug use, inconsistent condom use (24), HIV stigma (22), previous exposure to violence (25), lack of access to treatment, and the ability to pay for services (25) are among the most frequently identified determinants.
Concurrent multiple STIs occurring in individuals are often associated with having multiple sexual partners and can be a source of an STI epidemic among FSWs (26). In this population group, there is variation in STI co-infection prevalence and the associated determinants in different settings (14, 18, 19). Indeed, there is a need for further studies on the drivers of the number of STIs. The suggested STI categories (zero STI and at least one STI) in the data count used in previous studies might exhibit excess zero counts (no STI), and excluding the zero counts increases the possibility of biased estimates (27). In addition, counting data as non-negative might be over-dispersed and contain excess zeros, making data analysis complex (28). Therefore, in this analysis, we aimed to determine the factors that are associated with the number of STIs among FSWs in Ethiopia using robust statistical methods.
This study was a cross-sectional bio-behavioral study among FSWs conducted in 16 towns in Ethiopia between December 2019 and May 2020. The target towns include Adama, Addis Ababa, Arba Minch, Bahir Dar, Kombolcha/Dessie, Dilla, Dire Dawa, Gambella, Gonder, Harar, Hawassa, Jimma, Logia/Semera, Mizan, Nekemite, and Shashemane. We conducted respondent-driven sampling (RDS) on 6,085 FSWs aged 15 years and older who had received money or other benefits from selling sex to four or more people in the previous 30 days and had lived or worked in the surveyed town for at least the last month.
To recruit the participants, we employed respondent-driven sampling (RDS), a technique with benefits well-documented in previous reports (29, 30). As an initial step, 5 to 12 initial study participants referred to as “seeds” were selected from each study town. The seed participants were informed about the study, consent was obtained from each, and each participant was provided with three coupons for recruiting three eligible participants from her social network. All newly recruited participants were given three coupons as was done for the initial seeds to invite additional study participants. The data were collected through an anonymous interview administered by the study team in a private room using an Open Data Kit (ODK) electronic data management system with built-in skip patterns and logical validations.
The outcome variable in this study was the total number of STIs per FSW, categorized as zero STI, one STI, two STIs, three STIs, and four STIs. The independent sociodemographic variables included participants' age, the age at first sex sale, educational and married status, average monthly income, and the duration of sex work. Behavioral factors included alcohol and drug use, condom breakage, desired or forced first sex, HIV knowledge, and depression status.
The depression level was computed using the Patient Health Questionnaire (PHQ9) assessment tool (31). Participants with scores 0–4 were labeled as “non-minima”, 5–9 as “mild”, 10–14 as “moderate”, 15–19 as “moderately severe,” and 20–27 as “severe” depression severity levels.
Alcohol dependence level was computed using the alcohol use disorder identification test (AUDIT) (31). Drinking levels with scores 0–8 were labeled “social drinking”, 9–13 “harmful or hazardous drinking” for females, and 13–40 “alcohol dependence” severity levels.
Compressive HIV knowledge was computed from the four prevention and treatment and three misunderstanding knowledge questions. Respondents with seven true answers were labeled “had comprehensive knowledge” and otherwise “did not have comprehensive knowledge”.
The study used whole blood to test for HIV, HBV, HCV, and syphilis using a rapid diagnostic kit. HIV testing was done using the national algorithm, which included three rapid tests: assay 1 (STAT-PAK (HIV1/2, USA), assay 2 (ABONE, HIV1/2/O Tri-Line Device, Hangzhou, China), and assay 3 (SD Bioline, HIV1/2, USA). According to the algorithm, those who tested positive for all three were considered HIV-positive.
Hepatitis B surface antigen (HbsAg) detection was performed by the Virucheck HbsAg test kit manufactured in India. A one-step test for HbsAg detects the presence of HbsAg in serum or plasma specimens. Hepatitis C was screened using the Flaviscreen PLUSTM Test Kit produced in India. Flaviscreen is a rapid, third-generation, two-site sandwich immunoassay for the detection of total antibodies specific to the hepatitis C virus. It utilizes the principle of agglutination of antibodies or antisera with the respective antigen in the immunochromatography format.
Syphilis was screened using the Syphicheck-WB Screen and Confirm Assay produced in Kerala, India. Syphicheck is a rapid, qualitative immunoassay for the detection of antibodies to Treponema pallidum. It utilizes the principle of agglutination of antibodies in immunochromatography format. The interpretation of HBV, HCV, and Syphilis test results was according to the manufacturer's guide using the test kit insert.
The study staff received training to ensure the safety and effectiveness of the testing techniques, and standard operating procedures were followed throughout the process, including specimen collection, transportation, testing, and storage. The temperature was monitored while transporting the specimens, and invalid test results were repeated.
Data were collected on tablet computers using the ODK software, exported to MS Excel, cleaned, and imported into STATA Version 16 for analysis. The RDS recruitment process (Tree of recruitment), RDS assumption assessment, and RDS weight generation were all carried out using the RDS package inbuilt into R statistical software (30, 32). Homophily and convergence, two common assumptions in RDS, were checked in HIV status, consistent condom usage, and FSW type and met the RDS criteria. The RDS weights were exported to STATA using the RDS-II function and merged with the entire dataset for further analysis. Descriptive statistics such as the crude and RDS-adjusted frequency, mean, and standard deviation were computed using RDS-II as a weighting variable. Univariable analysis was conducted to select potential risk factors to be considered in the final multivariable analysis using a modest level of significance (α = 0.25).
The Poisson, negative binomial, zero-inflated Poisson, zero-inflated negative binomial, hurdle Poisson, and hurdle negative binomial models were employed. The Poison regression model is a baseline count model for count data in which the variance of the dependent variable is equivalent to its mean (33). The deviance and Pearson's chi-square statistic values corresponding to their degree of freedom were used to test the presence of over-dispersion after fitting the Poisson regression model. In this case, the mean and variance were 0.27 and 0.53, respectively; thus, the assumption is violated, indicating that the data were dispersed. Then, a negative binomial regression model, the extension of the Poisson regression model was fitted to handle the problem of over-dispersion in the dataset (33). However, count data often exhibit an excess number of zeros (one cause of over-dispersion) which cannot be accommodated by the Poisson and negative binomial regression models (33). In the presence of zero inflation and over-dispersion, zero-inflated (zero-inflated Poisson and zero-inflated negative binomial) and hurdle models (hurdle Poisson and hurdle negative binomial) were frequently used to fit epidemiological data (27, 28, 33), and they provide a flexible and effective framework for modeling (33). The models have two parts: the first predicts non-zero STI counts (i.e., at least one STI), and the second predicts the zero-hurdle model (zero infections vs. not zero infections) among FSWs.
The hurdle Poisson regression model has two components: a truncated Poisson component with a rate parameter u, u > 0 that models non-zero positive counts, and a logit component with success probability, π0, π0 ≥ 0 that models the probability of zero counts. If the discrete random variable Yi follows hurdle Poisson distribution, then the hurdle Poisson probability mass function is given as follows:
where 0 ≤ π0 ≤ 1, and defined by π0 = p (y = 0)
For the logit part, the conditional mean is given by E {p(Yi = 0/xi)} = π0 (xi) = . Taking natural logarithms in both sides of the equation, we have as follows:
where is a vector of independent variables, is a vector of regression coefficients, and log() is the log transformation of the odds of at least one STI.
Similarly, the conditional mean for the truncated Poisson is given by: E(Yi/xi) = ui = exp()
Therefore, the truncated Poisson regression model is given by:
where and β = are a vector of independent variables and regression coefficients, respectively.
Each model's goodness-of-fit was evaluated using the Akaike Information Criteria (AIC), and rootogram visual assessment (34, 35). Both the count and the zero-inflated parts were analyzed. Finally, a 95% confidence interval (CI) was reported for the incident rate ratio and adjusted odds ratio. A p-value of ≤ 0.05 was used to define statistical significance.
Ethiopian Public Health Institutes' Scientific and Ethical Research Office provided ethical clearance for the survey protocol (Ethical approval number: EPHI-IRB-108-2018). Each survey participant gave her consent to be interviewed, have blood specimens taken, and have the biospecimens stored for testing. Individuals who tested positive for STIs were transferred to the nearest or preferred health facility for appropriate clinical care. All collected information including the test results and seed contact information were kept entirely confidential.
Locally available organizations working on HIV prevention interventions, such as the HIV/AIDS Prevention and Control Office (HAPCO), District Health offices, and Drop-in Centers (DICs) were used to identify the initial participants (seeds) of the survey.
The seeds were selected based on the type of sexual worker, age category, and geographic location of the site. An FSW with a known social network was given three coupons so that she could invite her friends or other FSW contacts that were in her network. This approach allowed the study to reach as many eligible FSWs as possible. Finally, the findings of the study were shared with the FSW associations, HAPCO, and District Health offices through officially written letters and documents and using different platforms such as technical working group meetings and workshops.
Among the 6,085 FSWs involved in the study, 18.2% had HIV, 6.2% had syphilis, 2.5% had HBV, and 0.5% had HCV (Figure 1). Approximately one quarter, 1,439 (23.64%) of them, had at least 1 STI; 1,236 (19.90%) had 1 STI, 190 (3.34%) had 2 STIs, 10 (0.16%) had 3 STIs, and 3 (0.08%) had 4 STIs (Figure 2). The mean number of STIs among the FSWs was 0.27 [95% CI (0.26, 0.29)]. As shown in Tables 1, 2, comparing the mean number of STIs by category of the categorical covariates, on average, a higher number of STIs were observed among FSWs aged 35 years and above (0.64 ± 0.70), those who have a history of condom failure (0.34 ± 0.58), no formal education (0.45± 0.64), have moderate to severe depression (0.36±0.61), and are residing at Jimma (0.36 ± 0.62).
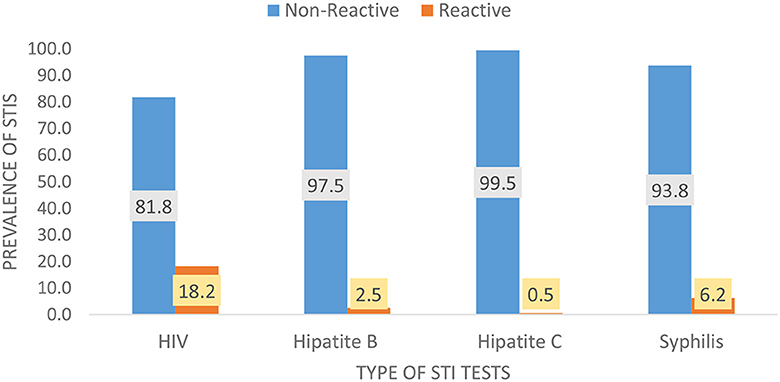
Figure 1. Weighted (RDS-adjusted) prevalence for the types of STIs among female sex workers in Ethiopia, bio-behavioral survey 2020.
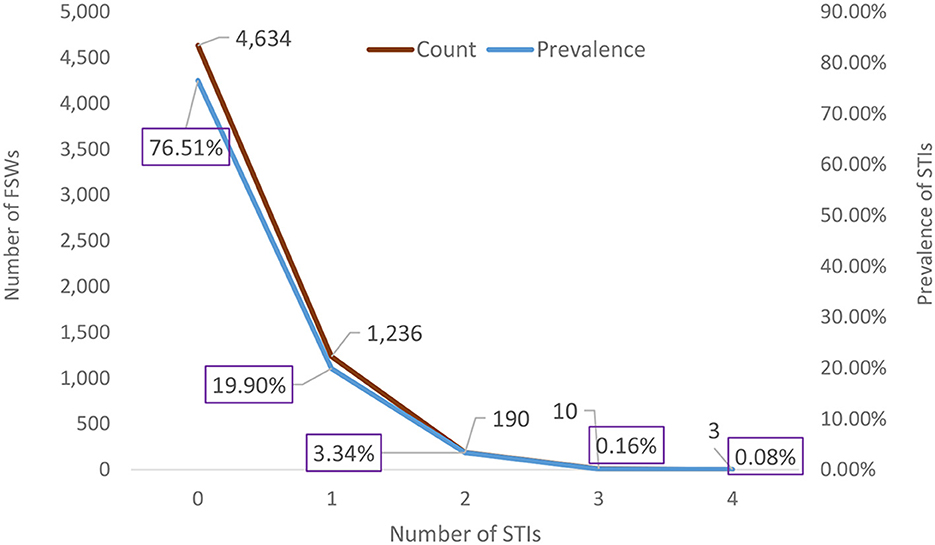
Figure 2. Weighted prevalence of the number of STIs among female sex workers in Ethiopia, bio-behavioral survey 2020.
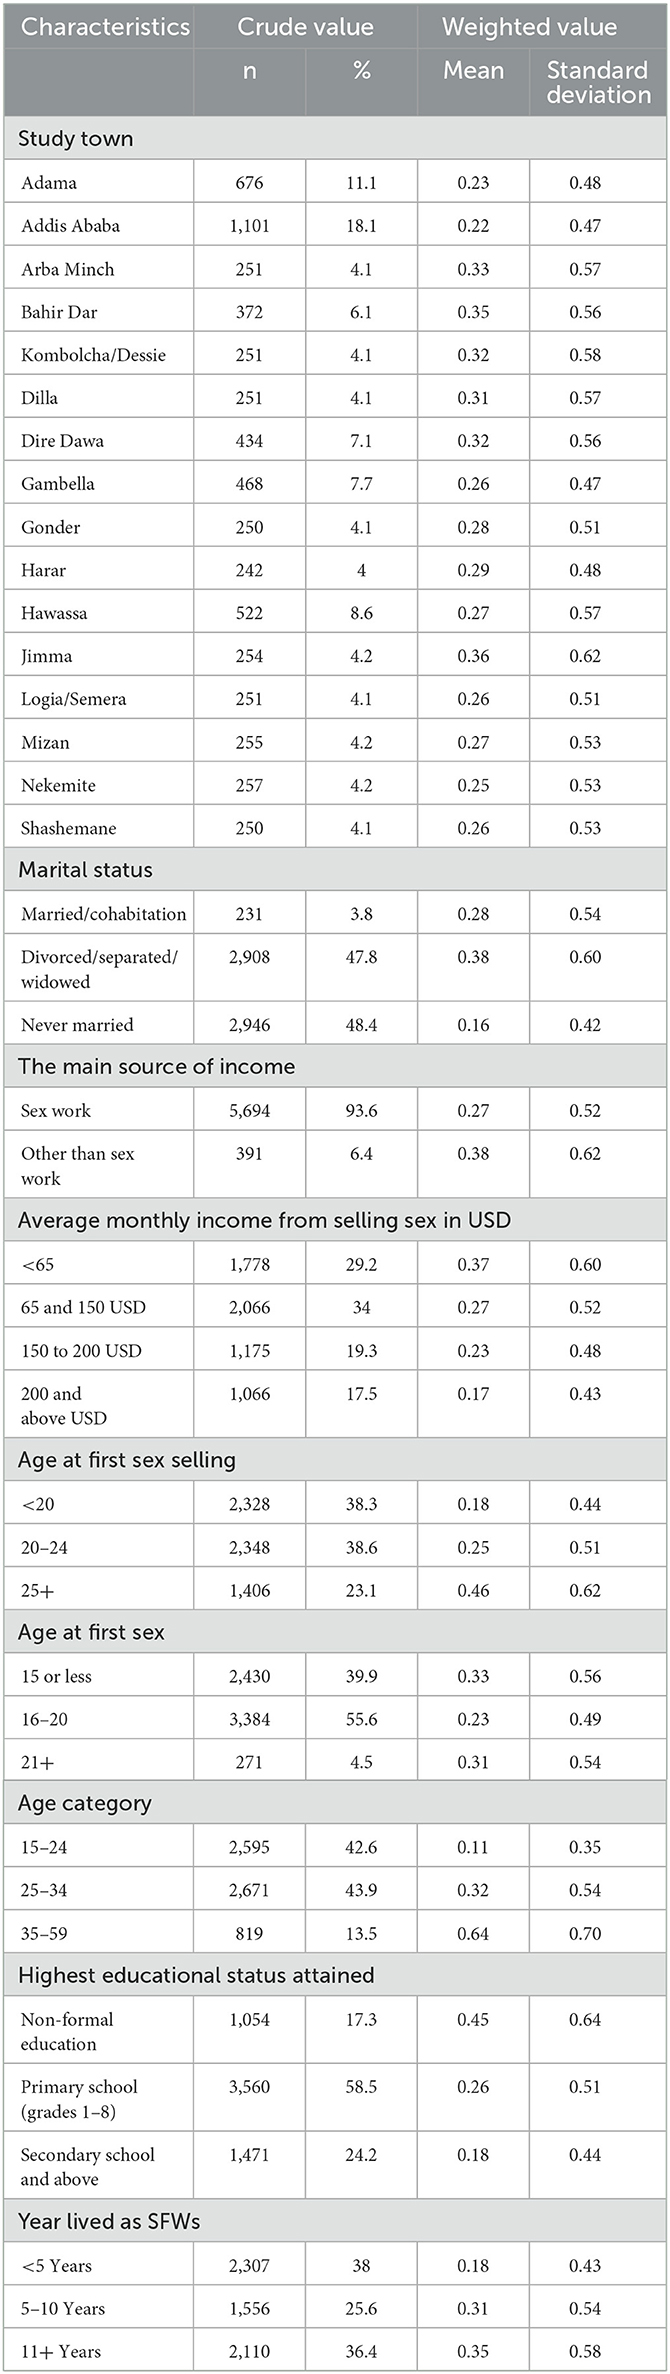
Table 1. Sociodemographic characteristics of female sex workers with sexually transmitted infections, bio-behavioral survey, Ethiopia, 2020 (N = 6,085).
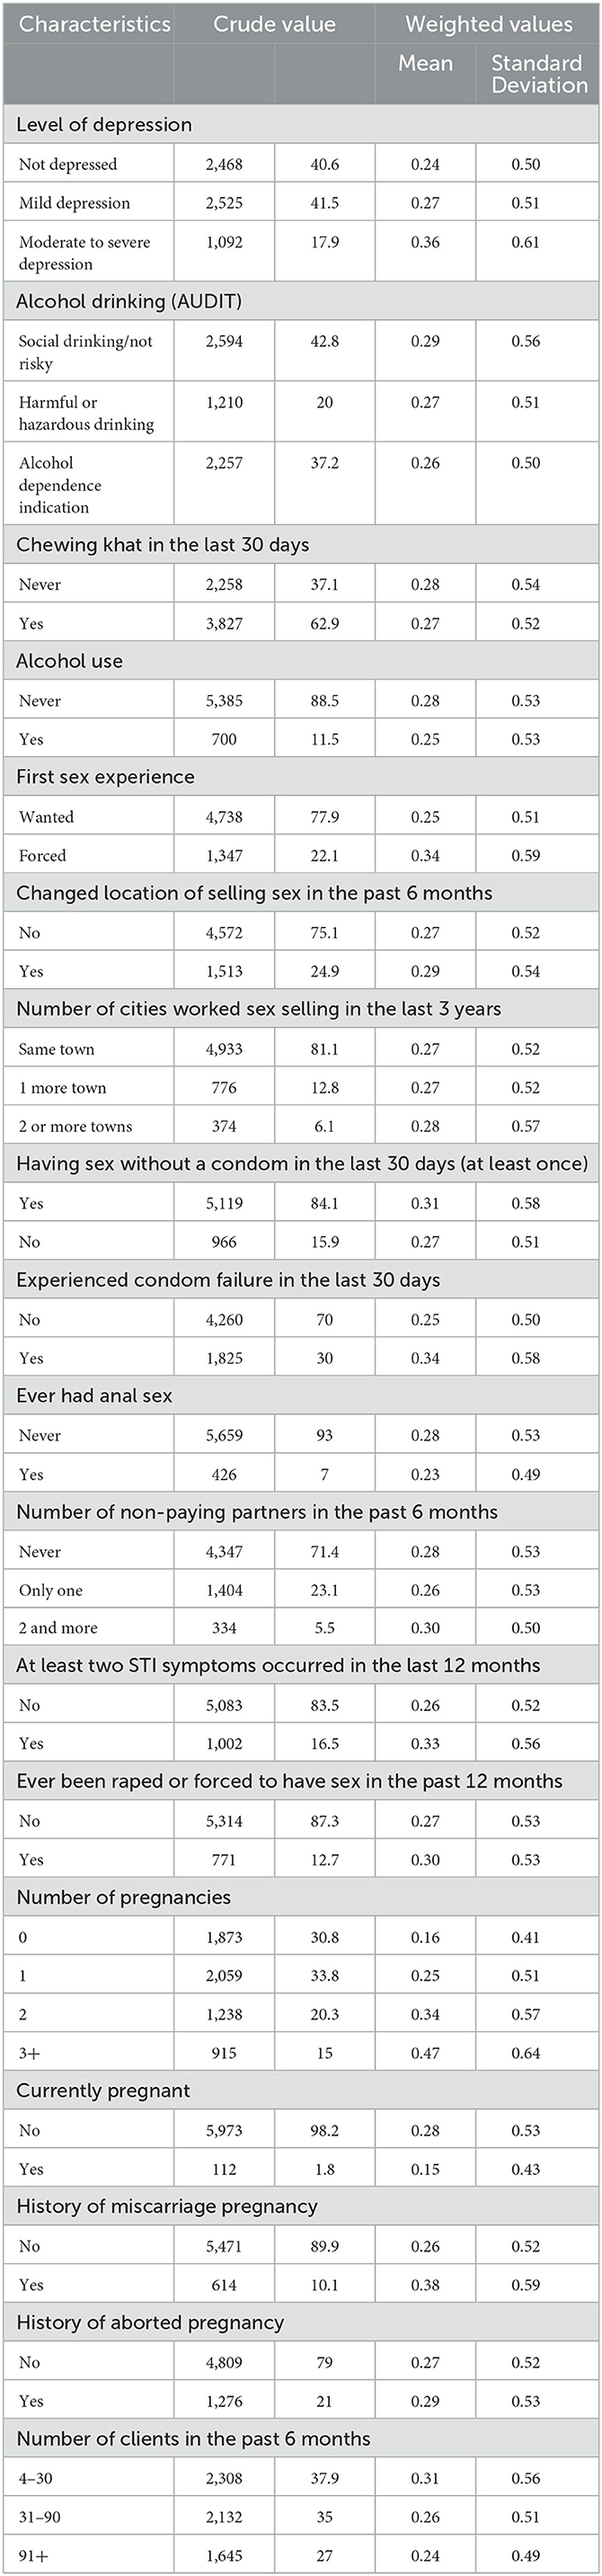
Table 2. Behavioral and clinical characteristics of female sex workers with sexually transmitted infections, bio-behavioral survey, Ethiopia, 2020 (N = 6,085).
The distribution of the number of STIs is skewed to the right, signifying the likelihood of over-dispersion. The zero STIs on the bar charts in Figure 2 are highly selected, suggesting that count data models that account for excess zeros, such as zero-inflated models and hurdle models, would better fit the data of the number of STIs. The hurdle Poisson model has the smallest AIC value and is considered the final model (see Table 3). Furthermore, a visual assessment of the fit was made in terms of the rootogram.
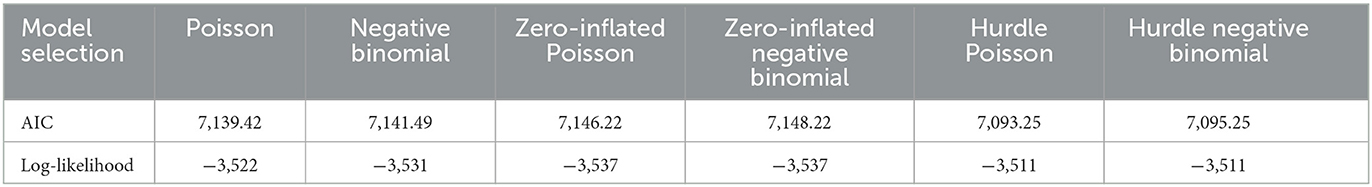
Table 3. Model selection and comparison of the number of STIs among female sex workers.
Hurdle negative binomial has an inferior fit, with some low numbers over-predicted. The hurdle Poisson model was found to be the best fit for the data based on their respective log-likelihood, AIC, and rootogram (Figure 3).
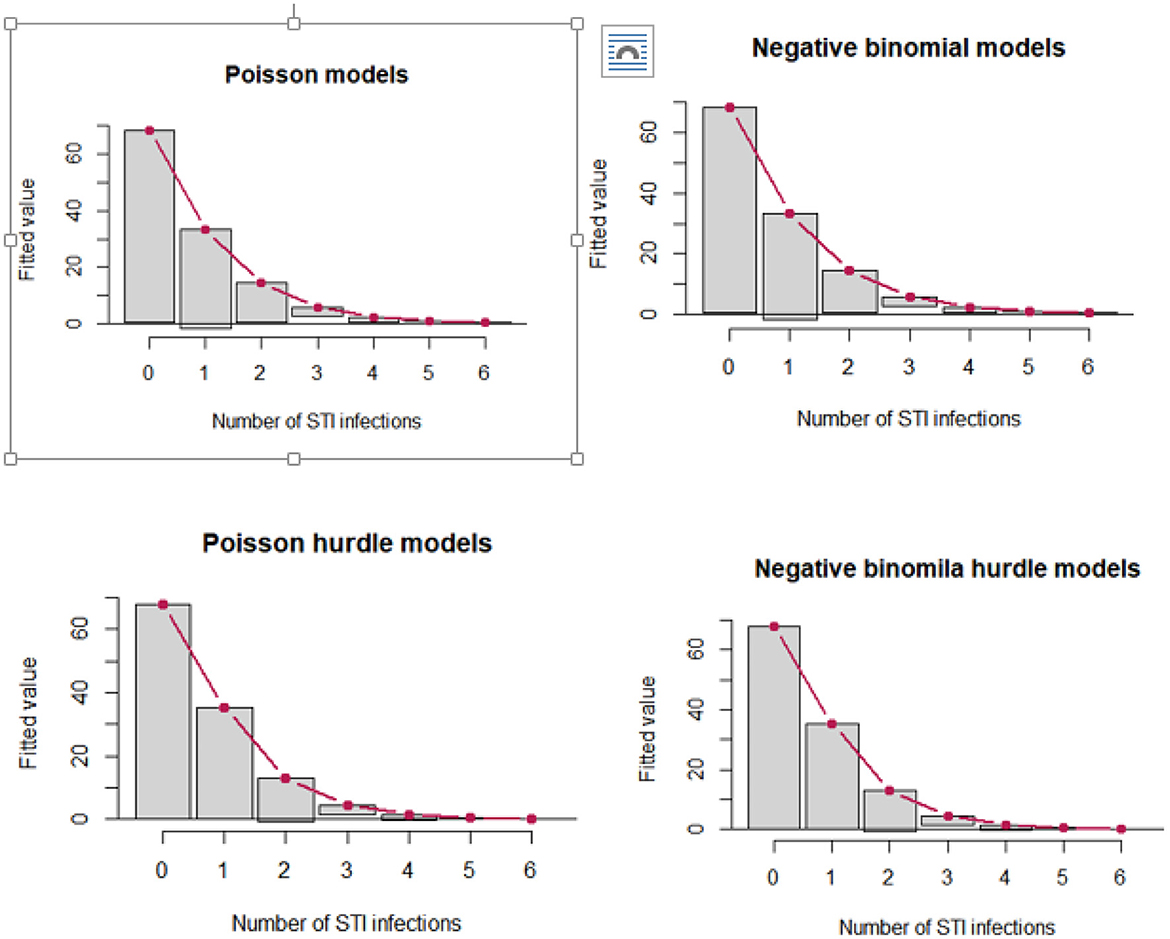
Figure 3. Hanging rootograms for count regression models of STIs among female sex workers in Ethiopia, bio-behavioral survey 2020.
The model is divided into two sections (Table 4): the first predicts non-zero counts of STIs (truncated negative binomial with log link), and the second predicts the zero-hurdle model (binomial with logit link) with zero STIs vs. no zero STIs.
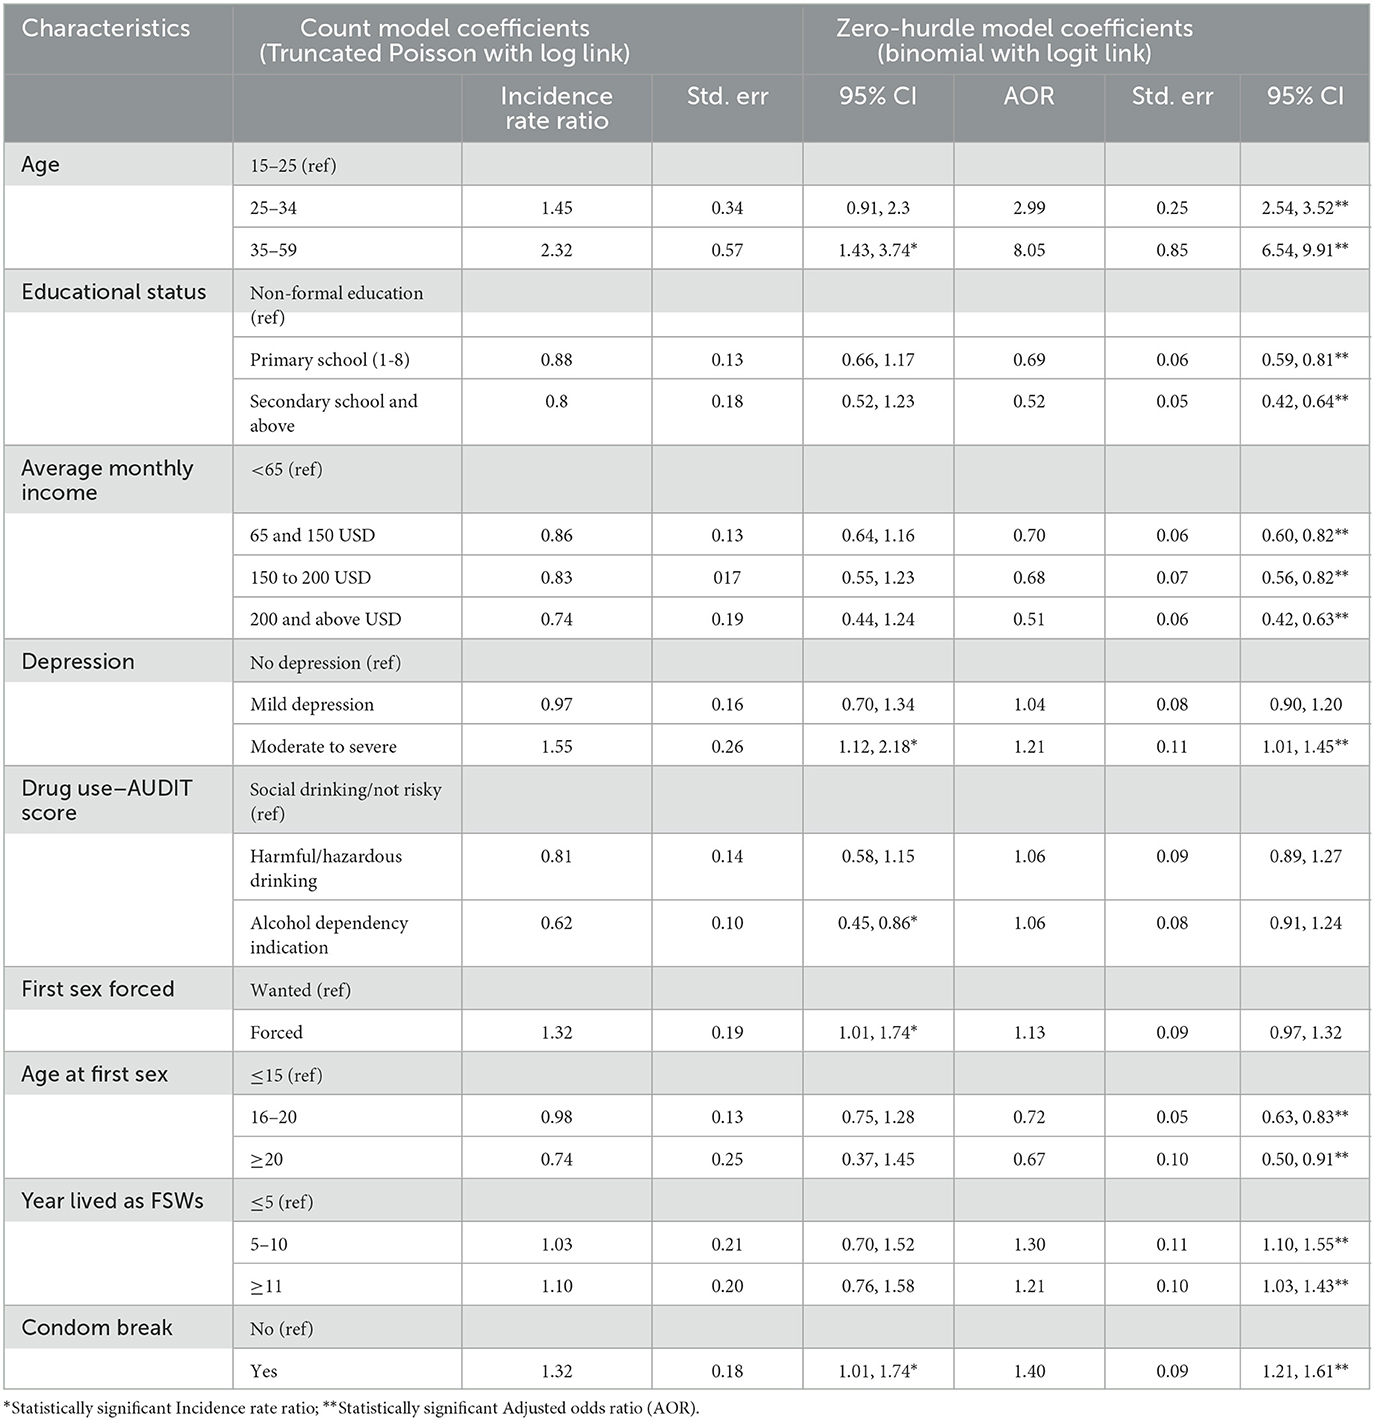
Table 4. Factors associated with the number of sexually transmitted infections (STIs) among female sex workers, bio-behavioral survey, Ethiopia, 2020.
Table 4 shows the results of hurdle Poisson model parameter estimates, incidence rate ratio (IRR), standard error, P-values, and 95% CIs for IRR. In the results of a truncated Poisson with a log link function to predict the number of at least one STI found, after controlling for the effect of other characteristics, FSWs' age, condom breakage, a history of moderate to severe depression, and drug use were significant predictors of STIs.
When compared to FSWs under the age of 25 years, those aged 35–49 were approximately 2.3 times [IRR = 2.3; 95% CI (1.43, 3.74)] more likely to experience STIs. FSWs with moderate to severe depression were 1.55 times (IRR = 1.554; 95 % CI: 1.15, 2.18) more likely to have STIs compared to those without depression.
FSWs who were forced to have sex at their first sexual encounter were 1.32 times [IRR = 1.32; 95% CI (1.01, 1.74)] more likely to have STIs compared with those who willingly had sex at their first encounter. When compared to FSWs who had not experienced condom breakage during sexual intercourse, those who had experienced condom breakage were 1.32 times [IRR = 1.32; 95% CI (1.01, 1.74)] more likely to have STIs.
The estimated frequency of STIs experienced by an FSW was significantly associated with the alcohol dependency indicator. Compared to social drinking/not risky FSWs, those with alcohol dependency signs had a 37.7% (IRR = 0.62; 95% CI: 0.45, 0.86) lower risk of STIs.
The second predicts the zero-hurdle model (binomial with logit link) with zero STIs vs. no STIs. The zero-hurdle model's estimated adjusted odds ratio (AOR) and 95% CI for the factor change in the odds of experiencing at least one STI are shown in Table 4. After controlling for all other factors in the model, the probability of having an STI was found to be significantly associated with age, education level, average monthly income, depression, age at selling sex, years spent as FSWs, and condom breakage.
From the results of the hurdle model (binomial with logit link), the odds of having STI (at least one STI) were lower by 31% [AOR = 0.69; 95% CI (0.59, 0.81)] and 48% [AOR = 0.52; 95% CI (0.42, 0.64)] for FSWs who had attended primary and secondary school or above, respectively, compared to those who had no formal education. FSWs aged 25–34 and 35–59 years had approximately three times [AOR = 2.99; 95% CI (2.54, 3.52)] and eight times [AOR = 8.051; 95% CI: (6.54, 9.91)] the chances of having at least one STI, respectively, compared to FSWs aged 24 years or younger.
FSWs earning between 65 and 150 USD, 150 to 200 USD, and 200 and above USD had a 30% [AOR = 0.70; 95% CI (0.60, 0.82)], 33% [AOR = 0.68; 95% CI (0.56, 0.82)], and 49% [AOR = 0.51; 95% CI (0.42, 0.63)] lower risk of having at least one STI. Those who began selling first sex between the ages 16–20 years and at the age of 20 or more had a 28% [AOR = 0.72; 95% CI (0.63, 0.83)] and 33% [AOR = 0.67; 95% CI (0.50, 0.91)] lower risk of experiencing at least one STI than those who began selling first sex at the age of 15 years below. FSWs who worked on this business for <5 years were 1.3 [AOR = 1.3; 95% CI (1.1, 1.55)] and 1.21 [AOR = 1.21; 95% CI (1.03, 1.43)] times more likely to have at least one STI.
FSWs with a history of condom breakage were 1.4 [AOR = 1.4; 95% CI (1.21, 1.61)] times more likely to have at least one STI than those without a history of condom breakage. The odds of experiencing at least one STI were 1.21 [AOR = 1.21; 95% CI (1.01, 1.45)] times higher in FSWs who were moderately or seriously depressed compared to those who did not have depression.
This study found that 18.2% of the 6,085 FSWs studied had HIV, 6.2% had syphilis, 2.5% had HBV, and 0.5% had HCV. This study found that at least one STI was found in 23.64% of the FSWs, which is consistent with the findings of previous reports from Ethiopia (15), Mexico (16), and Ecuador (13) where at least 17.6% of FSWs were infected with STIs. Our finding could be a higher estimate because the other studies used polymerase chain reaction (PCR) to test for STIs.
The finding among the FSWs in our study is higher than those of the reports from Brazil of 13.3% (14), but lower than the Russian report (11), which showed that 43.2% of participants had at least one STI. This disparity could be due to differences in sociodemographic characteristics, STI diagnostic methods, types, and the number of STIs included in the specific studies.
Age, educational status, and average monthly income, as well as a history of depression, condom breakage, early initiation of sex selling, and living as a sex worker for a long time were associated with the frequency of STIs in our study. This suggests that the country has to make a greater effort to work toward increasing awareness among FSWs as well as the general population and improving prevention, care, and treatment services for STIs among FSWs.
Our study found that FSWs over the age of 30 were more likely to have at least one STI. This finding is comparable to those reported by studies conducted in Namibia (21), the Republic of Congo (29), South Africa (36), Ecuador (13), and Rwanda (19). Studies show an increase in STIs and co-infections with age, probably due to older FSWs not considering themselves high risk and failing to persuade customers to use condoms (13, 20). This could also be due to the cohort effect, where older women have more chances of acquiring STIs. Consequently, FSWs in this age group could be the major drivers of STIs among FSWs and their clients unless effective and comprehensive programs are implemented. In contrast, a report from Iran indicates that being under the age of 25 is independently associated with increased STIs (37). This disparity could be associated with sociocultural differences between population groups, but it requires further exploration.
Similar to a finding in Rwanda (19), FSWs who were in the business for a long time in our study had higher odds of getting at least one STI. Similarly, those who began selling sex at a young age had the highest odds of having at least one STI, observations also reported from Iran (37). This may be explained by the fact that young sex workers are more likely to report inconsistent condom use and condomless sex with their last clients (38, 39). FSWs who started the business at earlier ages are also more likely to drink alcohol heavily (40) and experience multiple clients each day (41). However, these findings contrast the Rwandan study (38), which found no statistically significant association between sex work starting at earlier ages and STIs.
Our finding shows that, compared to those who had no formal education, the odds of experiencing at least one STI was lower among educated FSWs is consistent with findings from the studies in Rwanda (19), Russia (11), and Namibia (21). As reported by others (21), this could be because those with low educational levels are more likely to be unemployed and engage in risky sexual behaviors associated with STIs (42). Similarly, FSWs with low average monthly income were more likely to experience at least one STI in our series, which could be because the sex workers earned less money as they got older and had to do sex work more often with many clients, and the clients decided to use condoms (41).
Condom breakage increases the frequency of STIs and increases the probability of having STIs among FSWs as shown by our study, which identified that those with a history of condom breakage had an increase in the rate of developing at least one STI by 46%. This may be because those experiencing condom breakage were exposed to pornography and used sexual enhancement products (43). The finding is consistent with previous reports for Ethiopia (15) and China (44). Available evidence has also shown that consistent and high levels of condom use among FSWs decrease the incidence of STIs among sex workers as well as the general population.
Overall, the advantage of our study, which was a nationwide survey involving a large sample of FSWs recruited by using the RDS technique from 16 towns across the country, outweighs a venue-based selection approach in terms of obtaining a representative sample. However, as this was a cross-sectional study, temporal relationships between determinants and the outcome cannot be established. In addition, key measures rely on self-report; biases such as social desirability response bias could have some effect. The rapid test/serological markers we used in this survey do not detect the duration of infections as recent or long-term. In this study, we only considered HIV, HBV, HCV, and syphilis, our results could underestimate the overall prevalence of STIs.
The prevalence of STIs among FSWs is high in Ethiopia. Age, educational status, average monthly income, history of depression, history of condom breakage, early initiations of selling sex, and living as FSWs for a long period of time are identified as independent predictors for developing at least one STI. Targeted STI prevention and control programs need to be improved, with a focus on promoting higher education among women, condom distribution, and the creation of awareness on proper and consistent use, enhancing STI testing, prevention, care and treatment, interventions, and supporting income-generating activities. Further epidemiological research is needed on STIs among FSWs in Ethiopia to determine the magnitude of the problem, which should include a broader list of STIs, confirmatory diagnostic tests, and recency testing.
The raw data supporting the conclusions of this article will be made available by the authors, without undue reservation.
The studies involving human participants were reviewed and approved by PHI-IRB-108-2018 and the Ethiopian Public Health Institute. The participants provided their written informed consent to participate in this study.
FW, SA, JA, SL, and BB conceived the manuscript. FW wrote the first draft and with further contributions from all authors. JA and DA conducted the statistical analysis with support from FW, BB, JT, AB, MR, and SA. JA and DA undertook data management. LN, GE, WB, MA, FW, and SA are principal investigators (PIs). FW was the guarantor of the manuscript, accepted full responsibility for the study, had access to the data, and controlled the decision to publish. All authors contributed to data interpretation, reviewed successive drafts, and approved the final version of the manuscript.
The authors declare that the research was conducted in the absence of any commercial or financial relationships that could be construed as a potential conflict of interest.
All claims expressed in this article are solely those of the authors and do not necessarily represent those of their affiliated organizations, or those of the publisher, the editors and the reviewers. Any product that may be evaluated in this article, or claim that may be made by its manufacturer, is not guaranteed or endorsed by the publisher.
1. Zheng Y, Yu Q, Lin Y, Zhou Y, Lan L, Yang S, et al. Global burden and trends of sexually transmitted infections from 1990 to 2019: an observational trend study. Lancet Infect Dis. (2021) 22:541–551. doi: 10.1016/S1473-3099(21)00448-5
2. World Health Organization. Global health sector strategies on, respectively, HIV, viral hepatitis and sexually transmitted infections for the period 2022-2030. Geneva: World Health Organization (2022). Available online at: https://www.who.int/publications-detail-redirect/9789240053779 (accessed December 14, 2022).
3. Holmes KK, Bertozzi S, Bloom BR, Jha P, Gelband H, DeMaria LM, et al. Major infectious diseases: key messages from disease control priorities, Third Edition. In:Holmes KK, Bertozzi S, Bloom BR, Jha P, , editors Major Infectious Diseases, Washington (DC): The International Bank for Reconstruction and Development/The World Bank (2017). doi: 10.1596/978-1-4648-0524-0_ch1
4. World Health Organization. Global progress report on HIV, viral hepatitis and sexually transmitted infections, 2021: accountability for the global health sector strategies 2016–2021: actions for impact: web annex 2: data methods. Geneva: World Health Organization (2021). p. 28. Available online at: https://apps.who.int/iris/handle/10665/342813 (accessed March 2, 2022).
5. Lewis DA. HIV/sexually transmitted infection epidemiology, management and control in the IUSTI Africa region: focus on sub-Saharan Africa. Sex Transm Infect. (2011) 87:ii10–3. doi: 10.1136/sextrans-2011-050178
6. Gerbase AC, Mertens TE. Sexually transmitted diseases in Africa: time for action. Afr Health. (1998) 20:10–2.
7. Hanass-Hancock J, Carpenter B. Trends in health and disability in Botswana. An analysis of the global burden of disease study. Disabil Rehabil. (2021) 43:3606–12. doi: 10.1080/09638288.2020.1743774
8. de Martel C, Georges D, Bray F, Ferlay J, Clifford GM. Global burden of cancer attributable to infections in 2018: a worldwide incidence analysis. Lancet Glob Health. (2020) 8:e180–90. doi: 10.1016/S2214-109X(19)30488-7
9. Rashti R, Alavian SM, Moradi Y, Sharafi H, Mohamadi Bolbanabad A, Roshani D, et al. Global prevalence of HCV and/or HBV coinfections among people who inject drugs and female sex workers who live with HIV/AIDS: a systematic review and meta-analysis. Arch Virol. (2020) 165:1947–58. doi: 10.1007/s00705-020-04716-1
10. Chemaitelly H, Weiss HA, Smolak A, Majed E, Abu-Raddad LJ. Epidemiology of Treponema pallidum, Chlamydia trachomatis, Neisseria gonorrhoeae, Trichomonas vaginalis, and herpes simplex virus type 2 among female sex workers in the Middle East and North Africa: systematic review and meta-analytics. J Glob Health. (2019) 9:020408. doi: 10.7189/jogh.09.020408
11. Bernier A, Rumyantseva T, Reques L, Volkova N, Kyburz Y, Maximov O, et al. HIV and other sexually transmitted infections among female sex workers in Moscow (Russia): prevalence and associated risk factors. Sex Transm Infect. (2020) 96:601–7. doi: 10.1136/sextrans-2019-054299
12. Peitzmeier SM, Wirtz AL, Peryshkina A, Sherman S, Colantuoni E, Beyrer C, et al. Associations between violence and HIV risk behaviors differ by perpetrator among Russian sex workers. AIDS Behav. (2020) 24:812–22. doi: 10.1007/s10461-019-02668-5
13. Llangarí-Arizo LM, Sadiq ST, Márquez C, Cooper P, Furegato M, Zhou L, et al. Sexually transmitted infections and factors associated with risky sexual practices among female sex workers: A cross sectional study in a large Andean city. PLoS ONE. (2021) 16:e0250117. doi: 10.1371/journal.pone.0250117
14. Costa Ferreira-Júnior O, Guimarães MD, Damacena GN, de Almeida WD, de Souza-Júnior PR, Szwarcwald CL, et al. Prevalence estimates of HIV, syphilis, hepatitis B and C among female sex workers (FSW) in Brazil, 2016. Medicine (Baltimore). (2018) 97:S3–8. doi: 10.1097/MD.0000000000009218
15. Metaferia Y, Ali A, Eshetu S, Gebretsadik D. Seroprevalence and associated factors of human immunodeficiency virus, Treponema pallidum, Hepatitis B virus, and hepatitis C virus among female sex workers in Dessie city, northeast Ethiopia. BioMed Res Int. (2021) 2021:6650333. doi: 10.1155/2021/6650333
16. Patterson TL, Strathdee SA, Semple SJ, Chavarin CV, Abramovitz D, Gaines TL, et al. Prevalence of HIV/STIs and correlates with municipal characteristics among female sex workers in 13 Mexican cities. Salud Publica Mex. (2019) 61:116–24. doi: 10.21149/8863
17. Ingabire R, Parker R, Nyombayire J, Ko JE, Mukamuyango J, Bizimana J, et al. Female sex workers in Kigali, Rwanda: a key population at risk of HIV, sexually transmitted infections, and unplanned pregnancy. Int J STD AIDS. (2019) 30:557–68. doi: 10.1177/0956462418817050
18. Zalla LC, Herce ME, Edwards JK, Michel J, Weir SS. The burden of HIV among female sex workers, men who have sex with men and transgender women in Haiti: results from the 2016 Priorities for Local AIDS Control Efforts (PLACE) study. J Int AIDS Soc. (2019) 22:e25281. doi: 10.1002/jia2.25281
19. Mutagoma M, Nyirazinyoye L, Sebuhoro D, Riedel DJ, Ntaganira J. Syphilis and HIV prevalence and associated factors to their co-infection, hepatitis B and hepatitis C viruses prevalence among female sex workers in Rwanda. BMC Infect Dis. (2017) 17:525. doi: 10.1186/s12879-017-2625-0
20. Liu H, Dumenci L, Morisky DE, Xu Y, Li X, Jiang B. Syphilis among middle-aged female sex workers in China: a three-site cross-sectional study. BMJ Open. (2016) 6:e010420. doi: 10.1136/bmjopen-2015-010420
21. Jonas A, Patel SV, Katuta F, Maher AD, Banda KM, Gerndt K, et al. HIV Prevalence, Risk Factors for Infection, and Uptake of Prevention, Testing, and Treatment among Female Sex Workers in Namibia. J Epidemiol Glob Health. (2020) 10:351–8. doi: 10.2991/jegh.k.200603.001
22. Owczarzak J, Phillips SD, Cho W. “Pure” drug users, commercial sex workers and “ordinary girls”: gendered narratives of HIV risk and prevention in post-Soviet Ukraine. Cult Health Sex. (2018) 20:1171–84. doi: 10.1080/13691058.2017.1421708
23. Kalemi G, Gkioka S, Tsapatsari P, Tzeferakos G, Kandri T, Psarra ML, et al. Stigma and self-esteem: A case of HIV-positive sex-workers. Psychiatr Psychiatr. (2017) 28:67–74. doi: 10.22365/jpsych.2017.281.67
24. Mo PKH, Lau JTF, Xin M, Fong VWI. Understanding the barriers and factors to HIV testing intention of women engaging in compensated dating in Hong Kong: The application of the extended theory of planned behavior. PLoS ONE. (2019) 14:e0213920. doi: 10.1371/journal.pone.0213920
25. Prakash R, Manthri S, Tayyaba S, Joy A, Raj SS, Singh D, et al. Effect of physical violence on sexually transmitted infections and treatment seeking behaviour among female sex workers in Thane District, Maharashtra, India. PLoS ONE. (2016) 11:e0150347. doi: 10.1371/journal.pone.0150347
26. Chemaitelly H, Weiss HA, Calvert C, Harfouche M, Abu-Raddad LJ, HIV. epidemiology among female sex workers and their clients in the Middle East and North Africa: systematic review, meta-analyses, and meta-regressions. BMC Med. (2019) 17:119. doi: 10.1186/s12916-019-1349-y
27. Pittman B, Buta E, Krishnan-Sarin S, O'Malley SS, Liss T, Gueorguieva R. Models for analyzing zero-inflated and overdispersed count data: an application to cigarette and marijuana use. Nicotine Tob Res. (2018) 22:1390–8. doi: 10.1093/ntr/nty072
28. Bertoli W, Conceição KS, Andrade MG, Louzada F. A new regression model for the analysis of overdispersed and zero-modified count data. Entropy Basel Switz. (2021) 23:646. doi: 10.3390/e23060646
29. Navarrete MS, Adrian C, Bachelet VC. Respondent-driven sampling: Advantages and disadvantages from a sampling method. Medwave. (2022) 21:e8513. doi: 10.5867/medwave.2022.01.002528
30. Garcini LM, Galvan T, Peña JM, Chen N, Klonoff E. Effectiveness of Respondent-Driven Sampling for Conducting Health Studies Among Undocumented Immigrants at a Time of Heightened Immigration Enforcement. J Immigr Minor Health. (2022) 24:102–10. doi: 10.1007/s10903-020-01112-4
31. World Health Organization US Centers for Disease Control Prevention UNAIDS FHI360. Biobehavioral survey guidelines for populations at risk for HIV. Geneva: World Health Organization (2017). p. 208. Available online at: https://apps.who.int/iris/handle/10665/258924 (accessed May 20, 2023).
32. Lee S, Ong AR, Chen C, Elliott M. Respondent Driven Sampling for Immigrant Populations: A Health Survey of Foreign-Born Korean Americans. J Immigr Minor Health. (2021) 23:784–92. doi: 10.1007/s10903-020-01077-4
33. Schober P, Vetter TR. Count data in medical research: poisson regression and negative binomial regression. Anesth Analg. (2021) 132:1378–9. doi: 10.1213/ANE.0000000000005398
34. Kleiber C, Zeileis A. Visualizing count data regressions using rootograms. Am Stat. (2016) 70:296–303. doi: 10.1080/00031305.2016.1173590
35. Green JA. Too many zeros and/or highly skewed? A tutorial on modelling health behaviour as count data with Poisson and negative binomial regression. Health Psychol Behav Med. (2021) 9:436–55. doi: 10.1080/21642850.2021.1920416
36. Coetzee J, Jewkes R, Gray GE. Cross-sectional study of female sex workers in Soweto, South Africa: Factors associated with HIV infection. PLoS ONE. (2017) 12:e0184775. doi: 10.1371/journal.pone.0184775
37. Moayedi-Nia S, Bayat Jozani Z, Esmaeeli Djavid G, Entekhabi F, Bayanolhagh S, Saatian M, et al. HIV, HCV, HBV, HSV, and syphilis prevalence among female sex workers in Tehran, Iran, by using respondent-driven sampling. AIDS Care. (2016) 28:487–90. doi: 10.1080/09540121.2015.1109582
38. Kelly-Hanku A, Weikum D, Badman SG, Willie B, Boli-Neo R, Kupul M, et al. Factors associated with HIV and syphilis infection among female sex workers in three cities in Papua New Guinea: findings from Kauntim mi tu, a biobehavioral survey. Sex Health. (2020) 17:311–20. doi: 10.1071/SH19218
39. Parcesepe AM, L'Engle KL, Martin SL, Green S, Suchindran C, Mwarogo P. Early sex work initiation and condom use among alcohol-using female sex workers in Mombasa, Kenya: a cross-sectional analysis. Sex Transm Infect. (2016) 92:593–8. doi: 10.1136/sextrans-2016-052549
40. Amogne MD, Agardh A, Abate E, Ahmed J, Asamoah BO. Determinants and consequences of heavy episodic drinking among female sex workers in Ethiopia: A respondent-driven sampling study. PLoS ONE. (2021) 16:e0252432. doi: 10.1371/journal.pone.0252432
41. Han L, Zhou C, Li Z, Poon AN, Rou K, Fuller S, et al. Differences in risk behaviours and HIV/STI prevalence between low-fee and medium-fee female sex workers in three provinces in China. Sex Transm Infect. (2016) 92:309–15. doi: 10.1136/sextrans-2015-052173
42. Liu H. Egocentric network and condom use among mid-age female sex workers in China: a multilevel modeling analysis. AIDS Patient Care STDs. (2016) 30:155–65. doi: 10.1089/apc.2015.0349
43. Bradley J, Rajaram SP, Isac S, Gurav K, Ramesh BM, Gowda C, et al. Pornography, sexual enhancement products, and sexual risk of female sex workers and their clients in Southern India. Arch Sex Behav. (2016) 45:945–54. doi: 10.1007/s10508-015-0486-4
Keywords: serology, epidemiology, sexually transmitted infections, female sex workers, hurdle poison regression model
Citation: Wariso FB, Ayalew J, Barba A, Bedassa BB, Ebo GG, Tura JB, Rameto M, Belihu WB, Asfaw D, Amogne MD, Negeri L, Lulseged S and Abrahim SA (2023) Determinants of sexually transmitted infections among female sex workers in Ethiopia: a count regression model approach. Front. Public Health 11:1190085. doi: 10.3389/fpubh.2023.1190085
Received: 20 March 2023; Accepted: 14 July 2023;
Published: 04 August 2023.
Edited by:
Jawhar Gharbi, King Faisal University, Saudi ArabiaReviewed by:
Sondes Haddad-Boubaker, Pasteur Institute of Tunis, TunisiaCopyright © 2023 Wariso, Ayalew, Barba, Bedassa, Ebo, Tura, Rameto, Belihu, Asfaw, Amogne, Negeri, Lulseged and Abrahim. This is an open-access article distributed under the terms of the Creative Commons Attribution License (CC BY). The use, distribution or reproduction in other forums is permitted, provided the original author(s) and the copyright owner(s) are credited and that the original publication in this journal is cited, in accordance with accepted academic practice. No use, distribution or reproduction is permitted which does not comply with these terms.
*Correspondence: Feyiso Bati Wariso, ZmF5ZW51cnNAZ21haWwuY29t
Disclaimer: All claims expressed in this article are solely those of the authors and do not necessarily represent those of their affiliated organizations, or those of the publisher, the editors and the reviewers. Any product that may be evaluated in this article or claim that may be made by its manufacturer is not guaranteed or endorsed by the publisher.
Research integrity at Frontiers
Learn more about the work of our research integrity team to safeguard the quality of each article we publish.