 Kenisha Russell Jonsson
 Maria Corell1
 Nicholas Kofi Adjei
- 1School of Public Health and Community Medicine, Institute of Medicine, Gothenburg University, Göteborg, Sweden
- 2Department of Public Health, Policy and Systems, University of Liverpool, Liverpool, United Kingdom
- 3Leibniz Institute for Prevention Research and Epidemiology–BIPS, Bremen, Germany
- 4Health Sciences Bremen, University of Bremen, Bremen, Germany
Background: Knowledge of the distribution, prevalence, and clustering of multiple health and lifestyle related behaviors (HLBs) among adolescents can inform the development of effective health-promoting policies and interventions. We assessed the clustering of multiple HLBs among 11, 13 and 15-year-old Swedish adolescents and examined the socioeconomic and demographic correlates for the identified clusters.
Methods: We used data from the 2017/2018 Swedish Health Behaviour in School-aged children (HBSC) study to conduct sex and age-stratified latent class analysis (LCA). The LCA was based on five HLBs: eating behavior and habits (EBH), physical activity (PA), tobacco usage (TU), alcohol consumption (AC) and sleeping habits and patterns (SHPs). Multinomial logistic regression models were used to assess the associations between the identified clusters and the socioeconomic and demographic characteristics of adolescents and their parents.
Results: Health behaviors varied by sex and age. Four distinct clusters were identified based on sex: cluster 1 (Mixed eating behaviors and habits, physical activity and low alcohol consumption), cluster 2 (Healthy lifestyle behaviors), cluster 3 (Unhealthy lifestyle behaviors), and cluster 4 (Breakfast, low alcohol consumption and tobacco usage). In the age-stratified analyzes, three clusters were identified: cluster 1 (Unhealthy lifestyle behaviors), cluster 2 (Moderately healthy lifestyle behaviors) and cluster 3 (Healthy lifestyle behaviors). The multinomial analysis showed that sex, age, family situation and perceived family wealth were strong predictors of health behaviors. Unhealthy behaviors were most commonly associated with socioeconomic disadvantage, having a migrant background, and living in reconstructed families or single-parent households.
Conclusion: Health behaviors vary significantly based on socioeconomic and demographic circumstances. Targeted policies and intervention programs are necessary to improve HLBs among vulnerable and at-risk adolescents.
Introduction
Health and lifestyle behaviors (HLBs) in adolescence, such as eating behavior and habits (EBH), physical activity (PA), tobacco usage (TU), alcohol consumption (AC) and sleeping habits and patterns (SHP) may have both short and long-term health consequences (1–5). In Sweden, there are public health concerns about the impact of HLBs on adolescents physical and mental health (6, 7). Adolescence is a critical developmental stage and an important life stage where HLBs and inequalities are shaped (8–12). Prior evidence suggests that HLBs formed during adolescence persist into adulthood (8–12). Engaging in unhealthy lifestyle behaviors increases the immediate risks of poor physical and mental health problems (1, 4, 6, 13–15), but also elevates the risk of morbidity and mortality in adulthood (2, 3, 16).
Poor HLBs have been linked to significant increases in non-communicable diseases (NCDs) such as obesity, diabetes, cancer and heart diseases (17). NCDs are known contributors to the burden of disease and premature death among adults in Sweden [13]. They impose significant costs on both individuals and society, particularly on the health and care systems [18]. Moreover, research has shown that EBH, PA, TU, AC and SHP tend to co-occur or cluster in complex ways (19, 20), and that the combination of these behaviors may have more conducive or detrimental effects on an individual’s health, than the effects of single HLBs (21). The literature further suggests that the effects of HLBs may be multiplicative and cumulative rather than additive (21). Previous studies from high income countries have shown that HLBs tend to cluster among people with similar socioeconomic and demographic characteristics (20–24). Notably, individuals from lower socioeconomic backgrounds have been associated with engaging in less healthy behaviors (20, 22–25).
Socioeconomic inequalities in health have been identified in Sweden (26, 27), suggesting that patterns of health behaviors may cluster differently based on socioeconomic and demographic factors. Therefore, understanding how multiple HLBs cluster is crucial in order to develop appropriate public health strategies and interventions (19, 28). However, the clustering of health behaviors among adolescents, and the socioeconomic and demographic determinants of multiple HLBs among adolescents is understudied (24, 29), leading to a knowledge gap. This study will therefore contribute to the literature by assessing the patterning of multiple HLBs in the Swedish context.
Research aims
The aim of the study was twofold. Firstly, the study aimed to assess the clustering of five health and lifestyle behaviors [eating behavior and habits (EBH), physical activity (PA), tobacco usage (TU), alcohol consumption (AC) and sleeping habits and patterns (SHP)] among Swedish adolescents aged 11, 13 and 15 stratified by sex and age. Secondly, we aimed to investigate the associations between the identified clusters and the socioeconomic and demographic characteristics of adolescents and their parents (i.e., sex, age, migrant background, family situation, perceived family wealth and family affluence).
Methods
Data and sample
The analyzes were based on a nationally representative, cross-sectional sample of adolescents from the 2017/2018 Swedish component of the Health Behavior in School-Aged Children (HBSC) survey. It is a World Health Organization (WHO) collaborative study (30), conducted by the Public Health Agency of Sweden and Statistics Sweden. It is a school based study, conducted during school hours. Participation is voluntary and anonymous. The Swedish HBSC participants were selected based on a two-stage cluster design. First, a nationally representative sample of 450 schools were selected, and in the second stage, a single class from each school (5th graders ≈ 11 year olds, 7th graders ≈13 year olds, 9 graders ≈ 15 year olds) was randomly selected to participate. All students in the selected classes were then invited to participate in the survey. The final sample included 4,215 students from 213 schools, with a response rate of 89% in the participating schools, consisting of 2,114 girls (50.2%) and 2,101 boys (49.8%).
Health and lifestyle behavior measures
Eating behaviors and habits
We assessed EBH using seven individual items that captured the regularity of breakfast and the frequency of intake of four food items among adolescents. The first two items assessed the regularity of breakfast consumption on school days and weekends/non-school days. Respondents were asked to estimate the number of weekdays/weekends they had breakfast (more than having than a glass of milk or fruit juice). The responses provided were dichotomized as every day (5 days a week) vs. less than every day (do not consume breakfast on a daily basis). Similarly, breakfast on weekends/non-school days were coded as every day (both Saturday and Sunday) vs. less than every day (never or one of the two days). This coding is in line with how these variables have been treated in other studies using HBSC data (31, 32). Additionally, four items were used to assess the frequency of intake per week, for: (1) fruits, (2) vegetables, (3) sugary soft drinks, and (4) sweets (including chocolate). Participants could choose from the following response options: “never,” “less than once a week,” “once a week,” “two to four times a week,” “five to six times a week,” “once a day,” or “more than once a day.” The consumption of fruits and vegetables was then categorized as “at least once a day” or “less than once a day.” The consumption of sugary soft drinks and sugary foods was categorized as “once a week or less” or “more than once a week.”
EBH was operationalized to ensure comparability with international HBSC reporting standards (31, 32). The exception is sugary soft drinks and sweets, which were coded to reflect Swedish traditions of Saturday candy ‘lördagsgodis’ and cozy Fridays ‘fredagsmys’, where families indulge in these dietary behaviors (33).
Physical activity
PA was captured with responses to the question, “how many days in the past week were you physically active for 60 minutes or more?,” and this was exemplified as any activity that increased the heart rate and breathlessness. The responses provided ranged from 0–7 days. From this, two separate measures were coded. First, Low PA was operationalized as respondents who reported engaging in at least 1 hour of physical activity but on fewer than 3 days during the week. The second measure categorized respondents as having high PA if they engaged in physical activity for at least 1 hour per day, 7 days per week were categorized as having high PA. In accordance with the WHO physical activity recommendations (34), these items reflect low respective sufficient physical activity levels for an adolescent. In addition to information on General PA, the HBSC study also collects data on adolescents’ participation in any sports-related activities outside of school hours, i.e., during leisure time. This was assessed with the question, “Outside of school hours, how many days per week do you usually exercise in your free time so much that you get out of breath or sweat?” The possible responses ranged from 1 (every day) to 7 (never). This was dichotomized to create a measure of Vigorous Physical Activity (VPA) indicating adolescents engaged sports-related PA at least 4 times per week vs. those engaging in sports-related PA less than 4 times per week. This was coded in line with international standards and previous usage (34, 35).
Tobacco use
Tobacco usage (TU) was assessed with two questions asking “how many days (if any) have you smoked cigarettes in your life?” and “how many days (if any) have you used snus/snuff in your life?’. Possible responses ranged from 1 (never) to 7 (30 days or more) (32). The responses from both were re-categorized into a single dichotomous measure with responses coded 1 to indicate respondents who had never engaged in TU compared to those who had previously used at least one of these tobacco products (no tobacco usage vs. tobacco usage).
Alcohol consumption
Three questions were used to measure the prevalence of AC including drunkenness and binge drinking among adolescents (36). First, respondents were asked “how many days (if any) have you drunk alcohol in your life?,” and provided with responses ranging from 1 (never) to 7 (30 days or more). This was recoded as a dichotomous indicator never drank alcohol vs. drank previously (≥1). Two additional questions were created from responses to the question “have you ever drunk so much alcohol that you got really drunk… (i) in your life (lifetime prevalence) or (ii) during the last 30 days (current prevalence)?” Possible responses ranged from 1 (never) to 7 (more than 10 times). Two dichotomous variables were then created, the first indicating no binge drinking vs. binge drinking (≥1), which is a high frequency of AC during the last 30 days, and the second indicating whether the respondent had never been drunk vs. drunkenness (≥1) at any time previously.
Sleeping habits and patterns
SHPs on school days and weekends/holidays (non-school days) were based on four items asking respondents: “When do you usually go to bed?” and “When do you usually wake up?” Bedtimes ranged in half-hour intervals from “No later than 21:00” to “2:00 or later” for school days, and to “4:00 or later” on non-school days. Waketimes ranged in half-hour intervals from “No later than 5:00” to “8:00 or later” for school days and from “No later than 7:00” to “14:00 or later” on non-school days. Sleep duration for school and non-school days was calculated as the difference between bedtimes and waketimes. For responses at the ends of the scale, we used the minimum/maximum stated time (e.g., 14:00 if the waketime response was “14:00 or later” and 5:00 if the waketime response was “No later than 5:00”). We assessed whether adolescents in the sample slept 9 h or more based on current international guidelines recommending that school-aged children sleep between 9–11 h and adolescents 8–10 h (37, 38).
Covariates
Socioeconomic circumstances was assessed using (a) Perceived family wealth, which is a relative measure of wealth, based on the adolescent’s perception of their family’s economic situation. This was categorized as: (1) quite or very well off, (2) average, (3) not so well off/not at all well off; (b) The Family Affluence Scale (FAS) is a widely used and validated absolute measure of wealth (39). It is scored using six items (range: 0–13), based on a family’s material possessions and lifestyle including number of: cars (0, 1, 2 or more); bathrooms (0, 1, 2, 3 or more), computers (0, 1, 2, > 2); and holidays abroad during the last 12 months (0, 1, 2, 3 or more); and whether they shared a bedroom (no/yes); or had a dishwasher (no/yes). The sum is then converted into a so-called “ridit-based score” and is used to divide the study participants into quintiles. Adolescents in the lowest quintile were categorized low FAS (equivalent to a score of 0–7), the middle three quintiles were categorized as medium FAS(equivalent to a score of 8–11) and the highest quintile were categorized as having high FAS (equivalent to a score of 12–13) (39). Family situation described the composition of each household and was categorized to include adolescents residing (a) with both parents; (b) in reconstructed families (including step-parents); (c) single parent households and (d) in foster/children’s home or with other caregivers. Migrant background was categorized to indicate respondents who were foreign born, those born in Sweden and the migrant status of their parents, that is, whether one or both parents were born abroad. Finally, sex and the three sampled age groups (32) were used to stratify the analyzes.
Analytical strategy
First, multiple clusters of HLBs were identified by estimating a series of Latent class analysis (LCA) using PROC LCA command (SAS version 1.3.2) (40). Five successive sex and age-stratified models of 2 to 6 clusters were estimated separately. One thousand iterations of each model using random starting values were fitted to ensure model identification, missing data was assumed to be at random and handled within the EM algorithm. G2 frequencies were compared and the solution with the most common and lowest G2 value was identified as reaching a maximum likelihood solution (40). Statistical fit indices including the Akaike Information Criterion (AIC) (41) and Bayesian Information Criterion (BIC) (42) were examined to determine the number of clusters that best fit the data. Low AIC and BIC values are generally deemed to be good fitting models (40). In addition, the appropriate number of clusters were chosen based on conceptual considerations, theory, cluster distinctiveness and interpretability (40).
The second step of the analysis consisted of conducting multinomial logistic regression to assess the socioeconomic and demographic correlates of each identified cluster while taking into account classification uncertainty in each latent cluster. The likelihood of cluster membership were described as risk ratios (RR) with 95% confidence interval (CI). Analyzes were conducted in Stata version 16.1.
Results
Descriptive characteristics of the sample
Table 1 shows the descriptive characteristics of the final sample (N = 3,937). The overall distribution was fairly equal by sex (Girls: 51% vs. Boys: 49%). The proportion of respondents increased by age: Approximately 28.2% of the sample were 11-year-olds, 33.8% were 13-year-olds and 38.0% were 15-year-olds. Overall, the mean age was 13.2 years (SD = 1.6). There were notable differences in the proportion of adolescents living with both parents (64.8%), compared to those living in reconstructed families (12.9%), single parent households (7.1%) or foster/children’s home or other caregivers (4.3%). Regarding migrant background, 10.2% of the sample were foreign born while the majority were born in Sweden 64.6% and of those born in Sweden 12.7% had one parent with a migrant background and 12.5% had both parents with a migrant background. The distribution of FAS indicated that approximately 17.5% of respondents were classified as having high affluence, the majority were classified as having medium affluence (59.4%) and 20.0% as having low affluence. Regarding perceived family wealth, the majority perceived their family as being quite or very well off (80.7%). Approximately 15% perceived their family as having average wealth and 2.5% as not at all/not so well off.
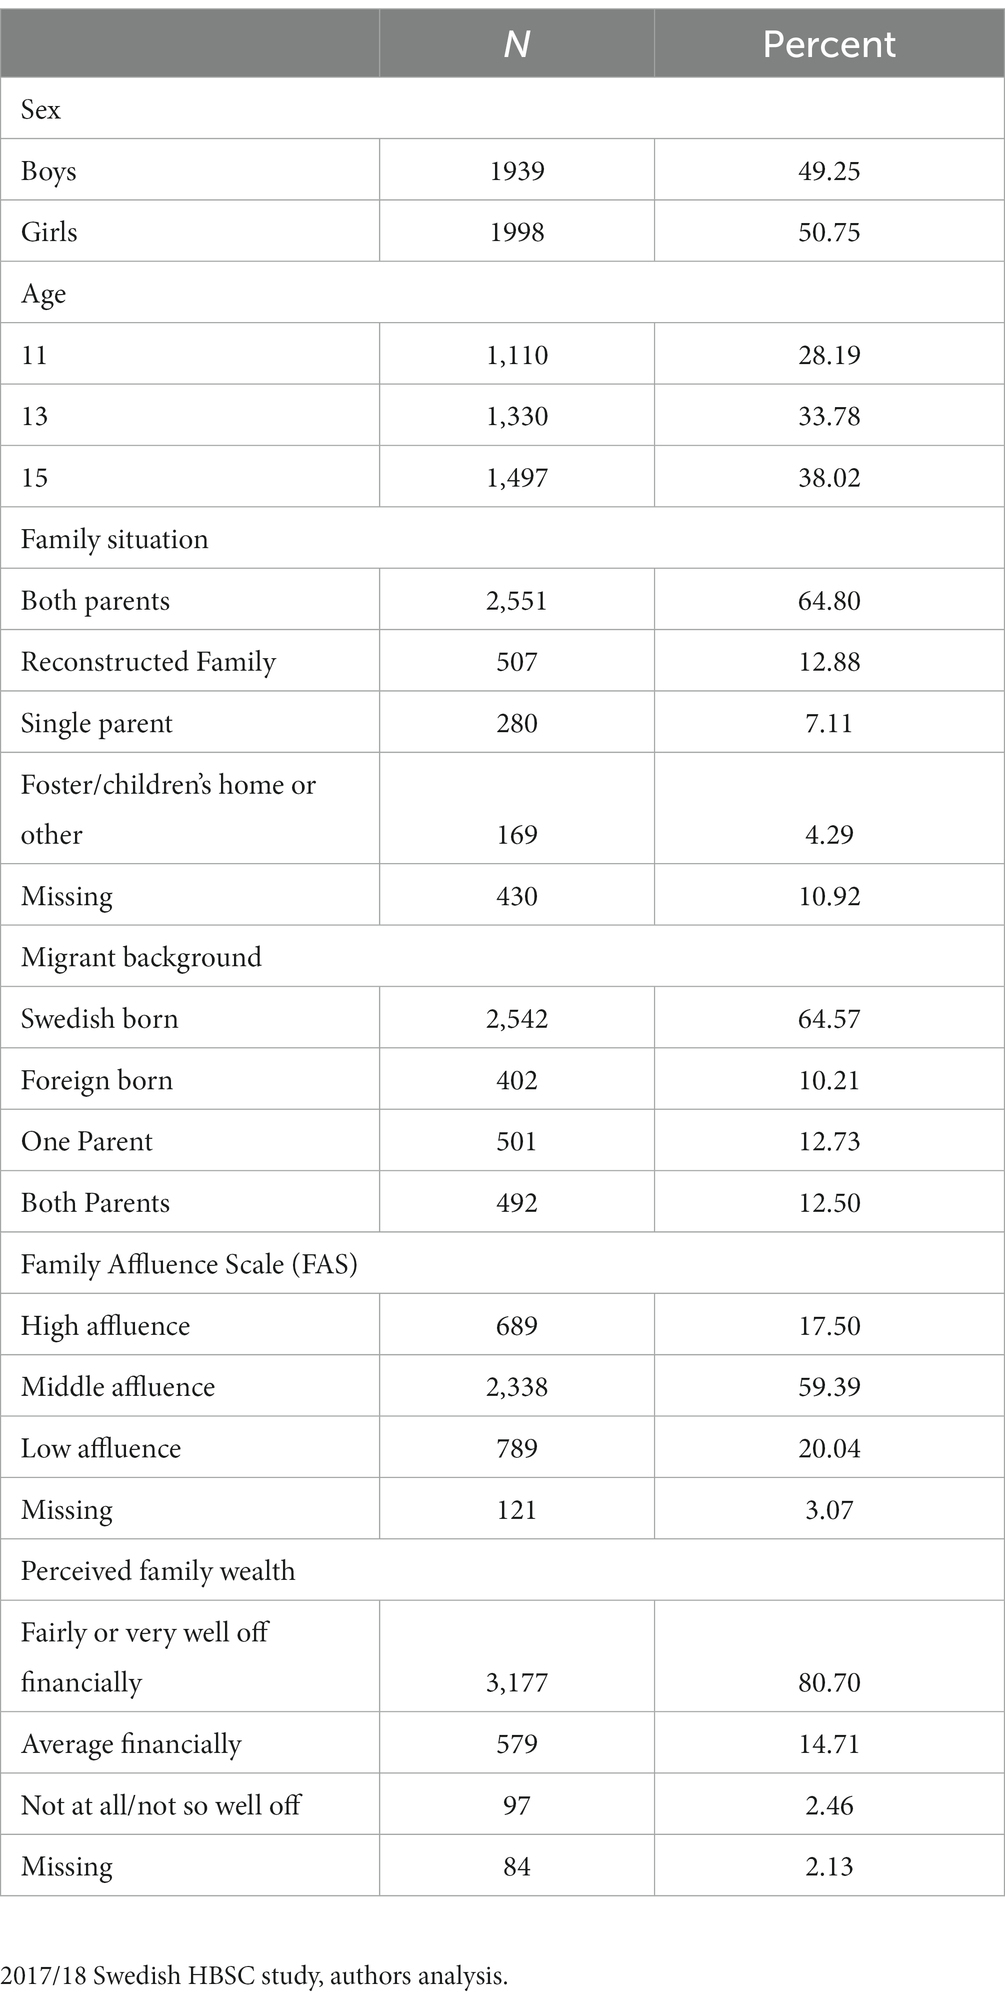
Table 1. Socioeconomic and demographic characteristics of the sample.
Model testing and selection
Analyzes for the total dataset indicated that there were better fitting models for identifying distinct clusters by sex and age separately (Full results not shown). Hence, model testing was conducted separately by sex and age, with sequential analysis of nested (constrained and unconstrained) models for measurement invariance (MI). Model fit indices are presented for sex and age separately (Supplementary Table S1). All participants were assigned to the cluster in which they had the highest probability of membership, which were well-identified, interpretable, and conceptually meaningful (29).
Comparison of the clusters by sex
We identified four distinct clusters based on prominent health-related behaviors (HLBs): Cluster 1 - “Mixed EBH, PA, and low AC,” Cluster 2 - “Healthy lifestyle behaviors,” Cluster 3 - “Unhealthy lifestyle behaviors,” and Cluster 4 - “Breakfast, low AC, and TU.” When considering cluster membership probabilities by sex, girls had a higher proportion (27.9%) in the healthy lifestyle behaviors cluster compared to boys (21.5%). Conversely, boys were more represented in the other three clusters: mixed EBH, PA, and low AC (31% boys vs. 28.4% girls), unhealthy lifestyle behaviors (12.9% boys vs. 9.9% girls), and breakfast, low AC, and TU (34.7% boys vs. 33.8% girls).
Figures 1 2 presents the item-response probabilities, indicating the likelihood for boys’ respective girls to engage in fifteen HLBs. These probabilities are determined by the underlying patterns of responses, which in turn define each cluster.
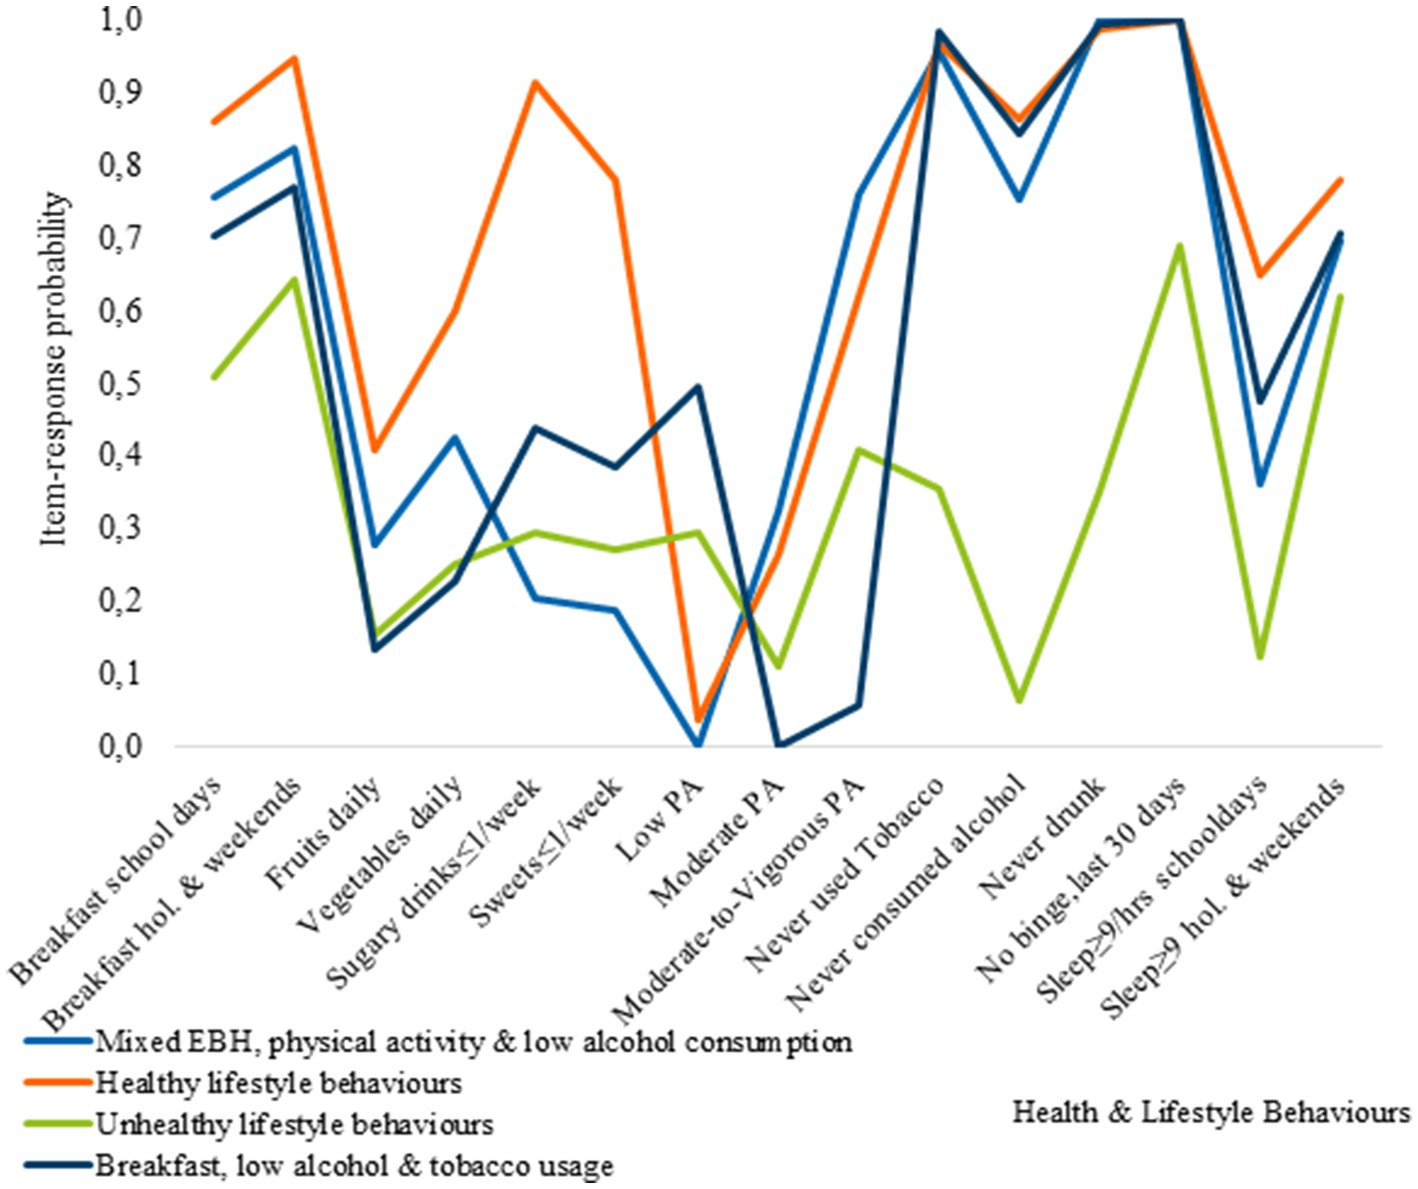
Figure 1. Item-response probabilities across each of the clusters for boys.
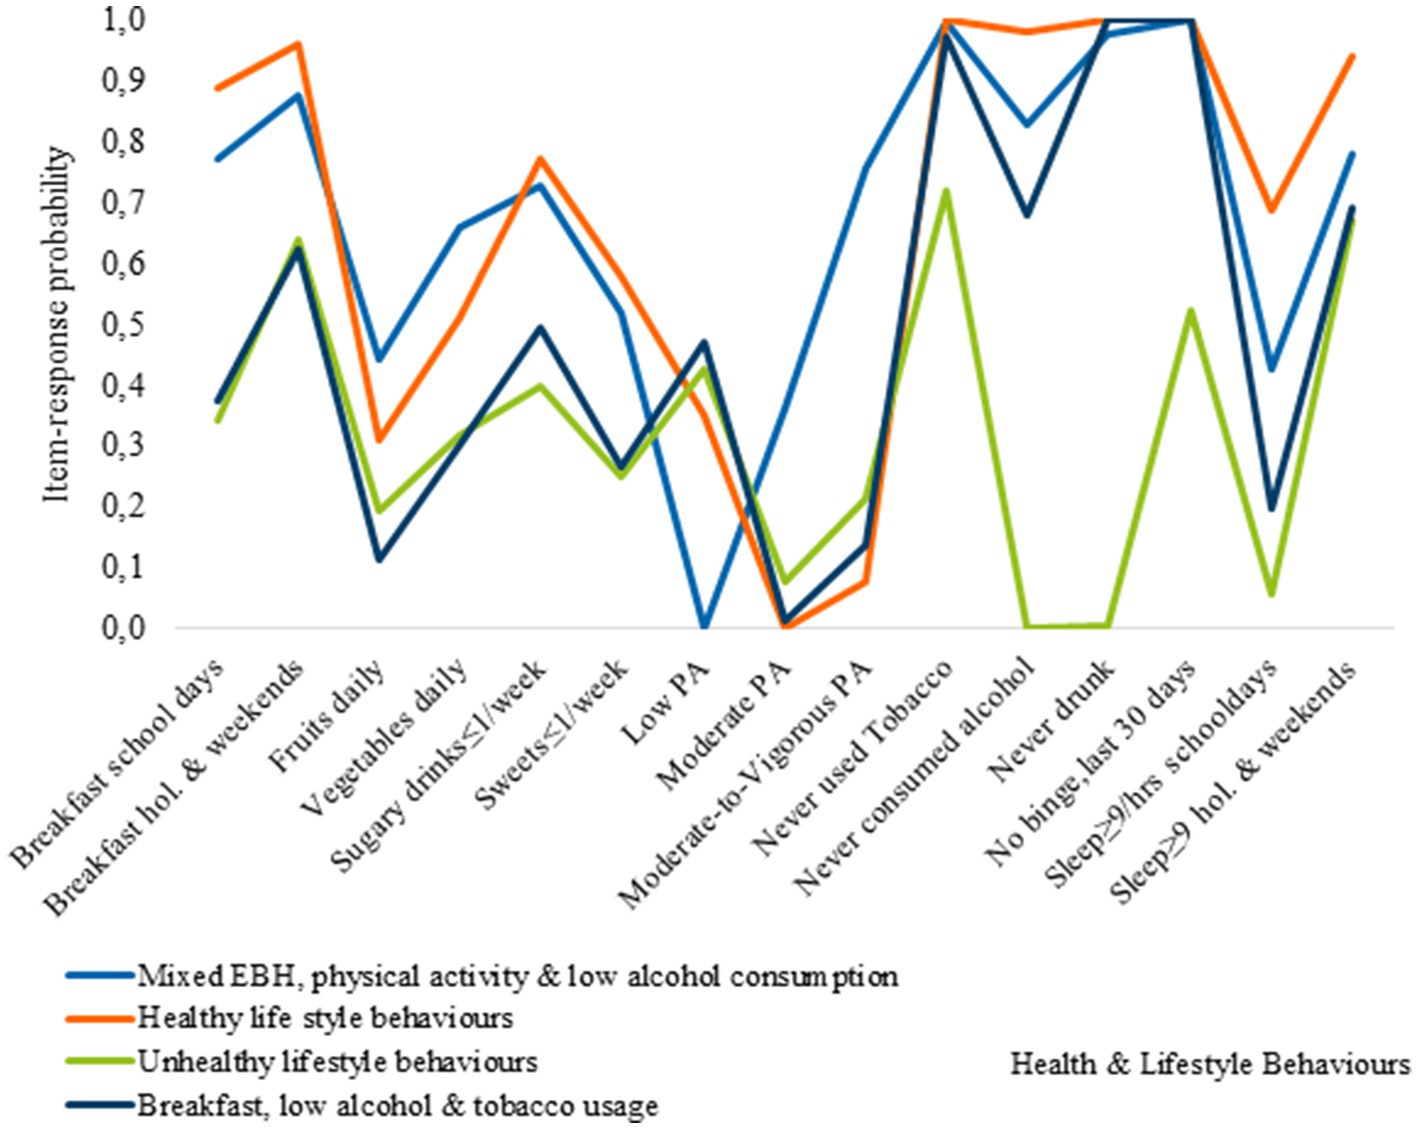
Figure 2. Item-response probabilities across each of the clusters for girls.
Cluster 1, represents the Mixed EBH, PA, and low AC cluster, and was characterized by adolescents with relatively healthy behaviors. They have a high probability of eating breakfast, consuming moderate amounts of vegetables, and meeting sleep recommendations on non-school days. In contrast, members of this cluster are less likely to consume sugary soft drinks, sweets, alcohol, or use tobacco. However, they engage less in PA at school but participate more in vigorous PA during their leisure time. Additionally, cluster members have a low probability of consuming fruits on a daily basis and meeting sleep recommendations on school days. Regarding breakfast consumption, boys and girls in the cluster exhibit similar healthy behaviors, although there are some sex-based differences. Girls have a higher probability than boys of consuming fruits and vegetables daily and a lower probability of consuming sugary soft drinks and sweets. Cluster 2, represents the healthy lifestyle behaviors cluster. Adolescents in this cluster had a higher likelihood of engaging in positive behaviors, such as consistent breakfast consumption, moderate levels of PA, and low rates of tobacco and alcohol use. Most of them also met sleep recommendations. There were sex-related differences in their behaviors. Boys had higher daily consumption of fruits and vegetables, as well as higher engagement in vigorous PA. In contrast, girls exhibited lower participation in vigorous physical activity (VPA) and a significant portion, approximately 35%, reported engagement in low levels of physical activity. Cluster 3, represents the unhealthy lifestyle behaviors cluster, where the majority of adolescents were more likely to engage in negative HLBs. There were some exceptions, such as a relatively high probability of eating breakfast on school days and weekends, meeting sleep recommendations on non-school days as well as, lower rates of binge drinking among boys, and tobacco use among girls.
Cluster 4, the breakfast, low AC, and TU cluster, was characterized by unhealthy eating behaviors and low PA levels, with notable sex differences in breakfast consumption. Boys had higher rates of breakfast consumption compared to girls on both school days and non-school days, although the difference was reduced on non-school days.
Comparison of the clusters by age
The LCA age-stratified models revealed three clusters based on prominent item-response probabilities: Cluster 1 - “Unhealthy lifestyle behaviors,” Cluster 2 - “Moderately healthy lifestyle behaviors,” and Cluster 3 - “Healthy lifestyle behaviors.” Among 11-year-olds, the proportions in each cluster showed a gradient: 21% in the unhealthy cluster, 35.2% in the moderately healthy cluster, and 43.8% in the healthy cluster. For 13-year-olds, the distribution was 29.4% unhealthy, 16.2% moderately healthy, and 54.4% healthy. Among 15-year-olds, 22% were in the unhealthy cluster, while the majority (43%) were moderately healthy, and approximately 35% were healthy.
Figures 35 show the item-response probabilities categorized by age. Cluster 1, representing the healthy lifestyle behaviors cluster, showed a high level of engagement in positive behaviors, such as consuming fruits and vegetables daily, and eating breakfast. The consumption of sugary drinks remained consistent across age groups, while the likelihood of eating sweets once a week or less decreased with age. Notable differences were observed between 11-year-olds and older age groups in terms of meeting sleep recommendations on school days and alcohol consumption. Older adolescents had a lower likelihood of meeting sleep recommendations, and 15-year-olds were most likely to have consumed alcohol compared to younger age groups.
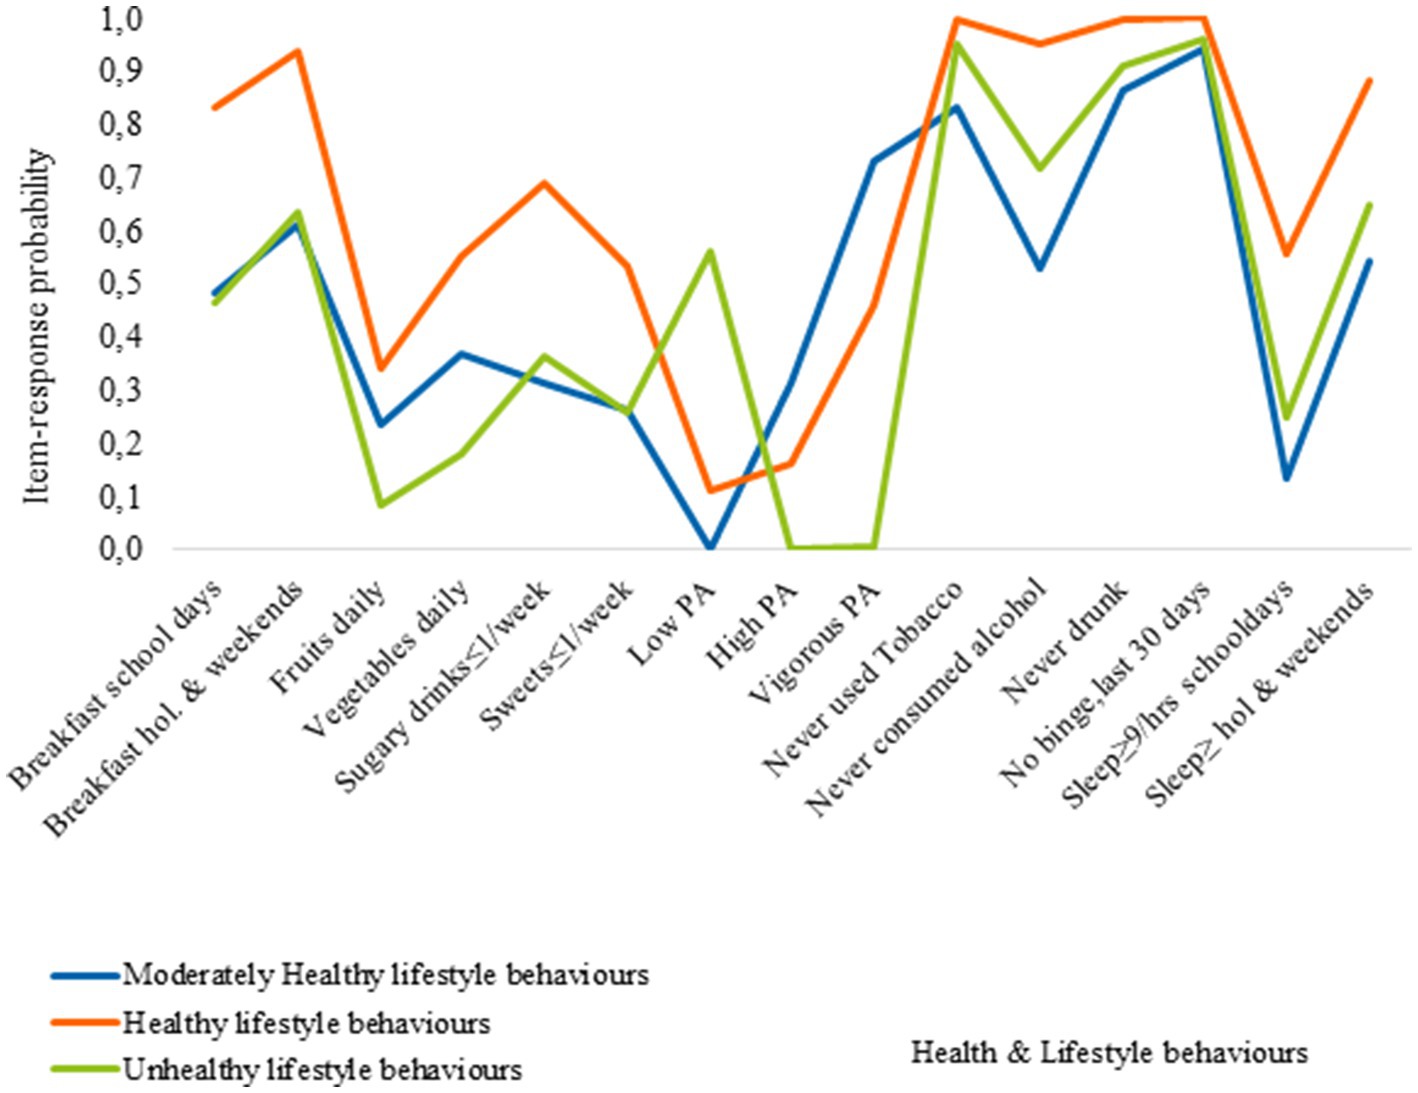
Figure 3. Item-response probabilities across each of the clusters for 11 year olds.
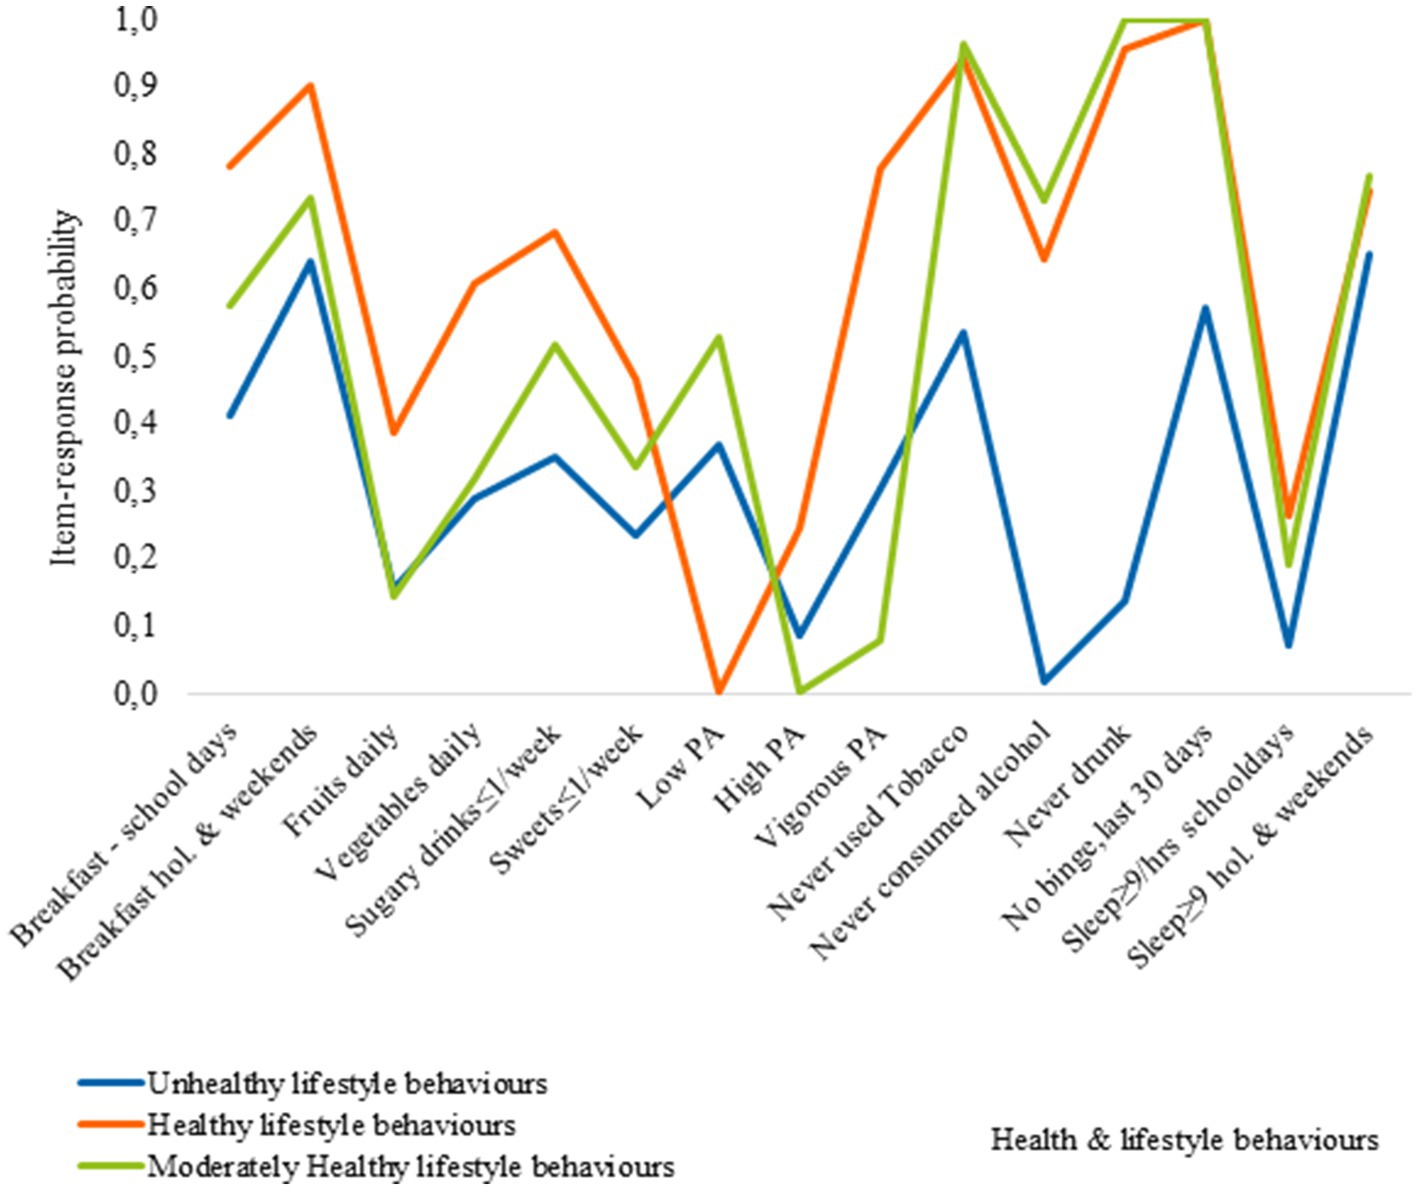
Figure 4. Item-response probabilities across each of the clusters for 13 year olds.
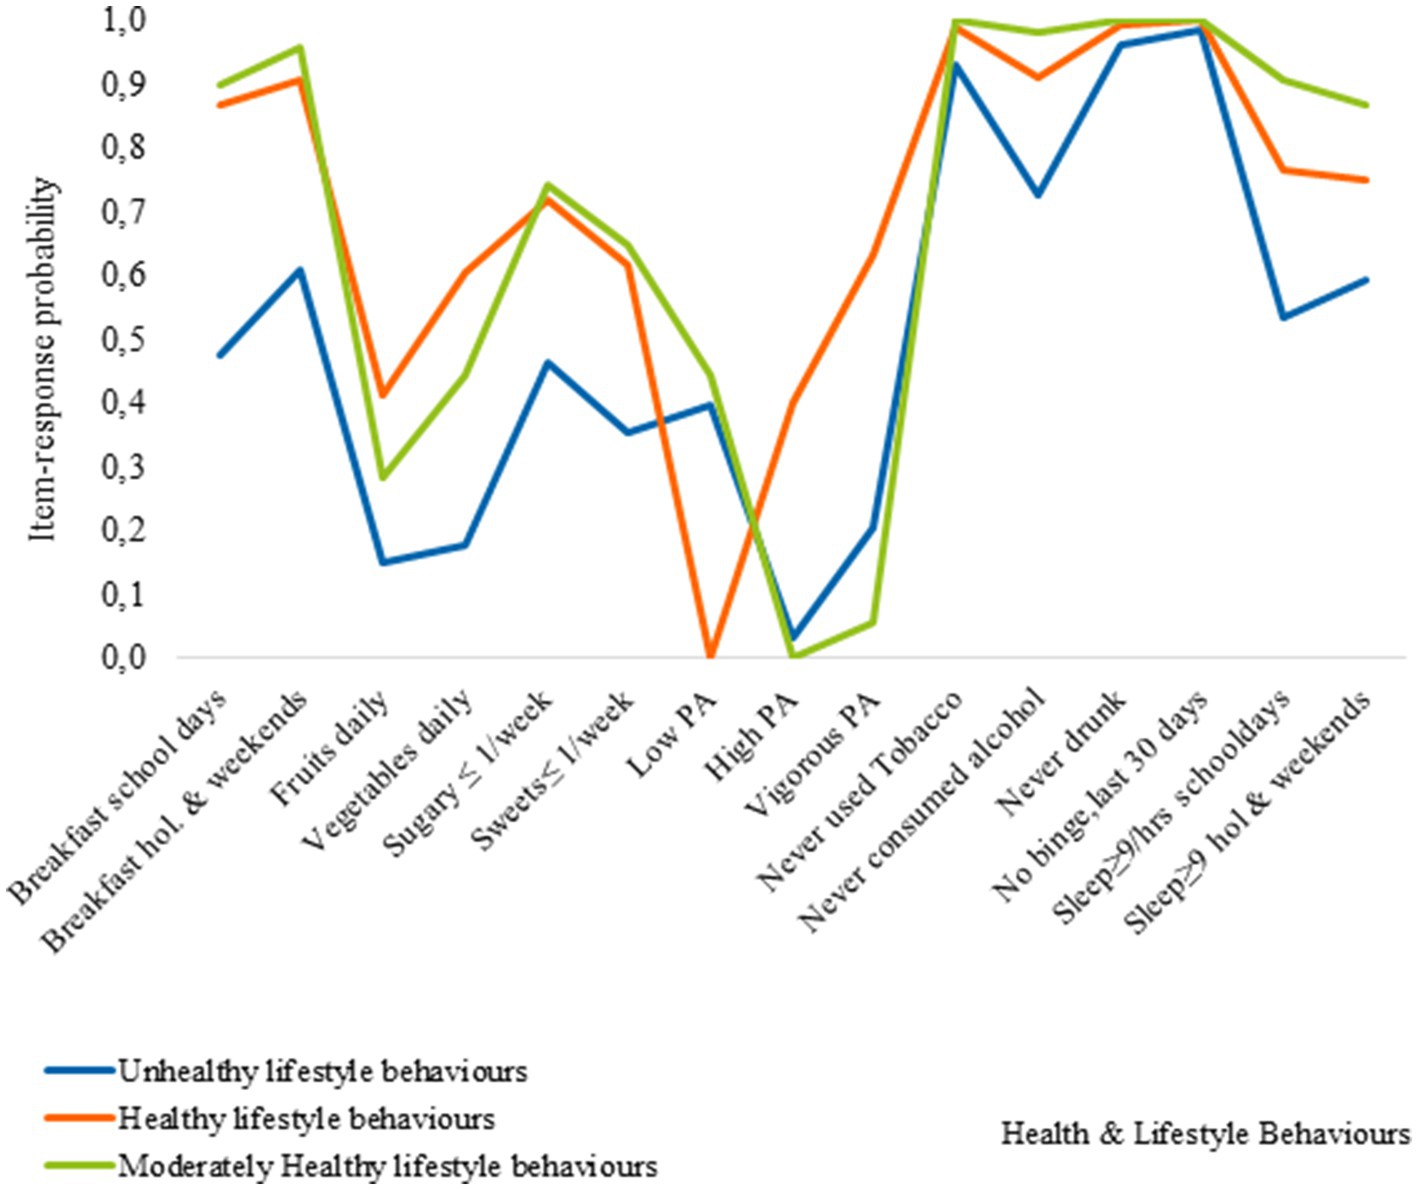
Figure 5. Item-response probabilities across each of the clusters for 15 year olds.
Cluster 2, represents the moderately healthy lifestyle behaviors cluster. Adolescents in this cluster had a high likelihood of consuming breakfast, with age differences observed in breakfast consumption patterns. They had lower rates of fruit and vegetable consumption and engagement in physical activity compared to the healthy lifestyle behaviors cluster. Additionally, the likelihood of meeting sleep recommendations on school days decreased with age, with 11-year-olds showing the highest rates compared to 13 and 15-year-olds.
Cluster 3, known as the unhealthy behaviors cluster, is characterized by poor EBH and low levels of PA among adolescents of all ages. However, 15-year-olds within this cluster exhibit the highest likelihood of engaging in multiple negative HLBs. Compared to other clusters, adolescents classified Cluster 3 has lower probabilities for healthy engagement across the five HLBs examined. For example, 11-year-olds in this cluster are less likely to eat breakfast on weekends compared to those in the healthy lifestyles cluster. Similar patterns are observed for other HLBs, with 13-year-olds more likely to engage in healthy behaviors, including breakfast consumption on weekends and meeting sleep recommendations on non-school days. Among 15-year-olds, a higher probability of engaging in positive HLBs is observed, such as breakfast consumption on weekends, low tobacco use, and meeting sleep recommendations on non-school days, along with a higher engagement in physical activity.
Socioeconomic and demographic correlates of cluster membership
Figures 6 7 present the results of the sex and age-stratified multinomial regression models (full results shown in Supplementary Table S1, S3), these assessed the socioeconomic and demographic correlates associated with cluster membership. Compared to the healthy lifestyle behaviors cluster, common risk factors across the other three sex-specific health clusters included age, being Swedish born, family situation, medium family affluence and low perceived family wealth. These associations varied by sex and across the HLB clusters.
For boys, only age and having medium family affluence was associated with classification in the Mixed EBH, physical activity and low alcohol consumption cluster. On the other hand, 15-year-old girls had a three times greater risk of being classified in the unhealthy behaviors cluster compared to boys of the same age. Furthermore, associations with socioeconomic circumstances were stronger for girls than boys. In particular, girls with medium family affluence and low perceived family wealth were most likely to be classified in the unhealthy lifestyle behaviors cluster. Similar risk factors were associated with classification in the Breakfast, low alcohol and tobacco usage cluster, but these effects were less pronounced. However, it is worth noting that girls in this cluster were more likely to come from single-parent households and to be foreign-born (Figure 6).
In the assessment of the association between cluster membership and the socioeconomic factors which may explain this relationship by age, 11-year-olds and membership in the healthy behaviors cluster were the reference categories. As such, we find that among 13-year-olds and 15-year-olds, girls and adolescents from households with average perceived family wealth had a higher risk of being classified in the moderate and unhealthy behavior clusters. While the factors related to moderate behaviors were less clear. The key socioeconomic and demographic indicators that were associated with classification in the unhealthy behavior clusters was related to migrant status and family structure. Among 13-year-olds, being Swedish born, residing in reconstructed families and single-parent household was associated with a higher risk of being classified in the unhealthy cluster. There was a similarly high risk of classification in unhealthy behavior cluster among 15-year-olds, who were foreign-born or who has two migrant parents, among those residing in reconstructed families and single-parent households 15-year-olds from had a higher risk of being classified in the unhealthy behaviors cluster. However, unlike the other clusters and age groups, 15-year-olds who were foreign-born, had low family affluence, or had two migrant parents were also more likely to be classified in the unhealthy behavior cluster (Figure 7).
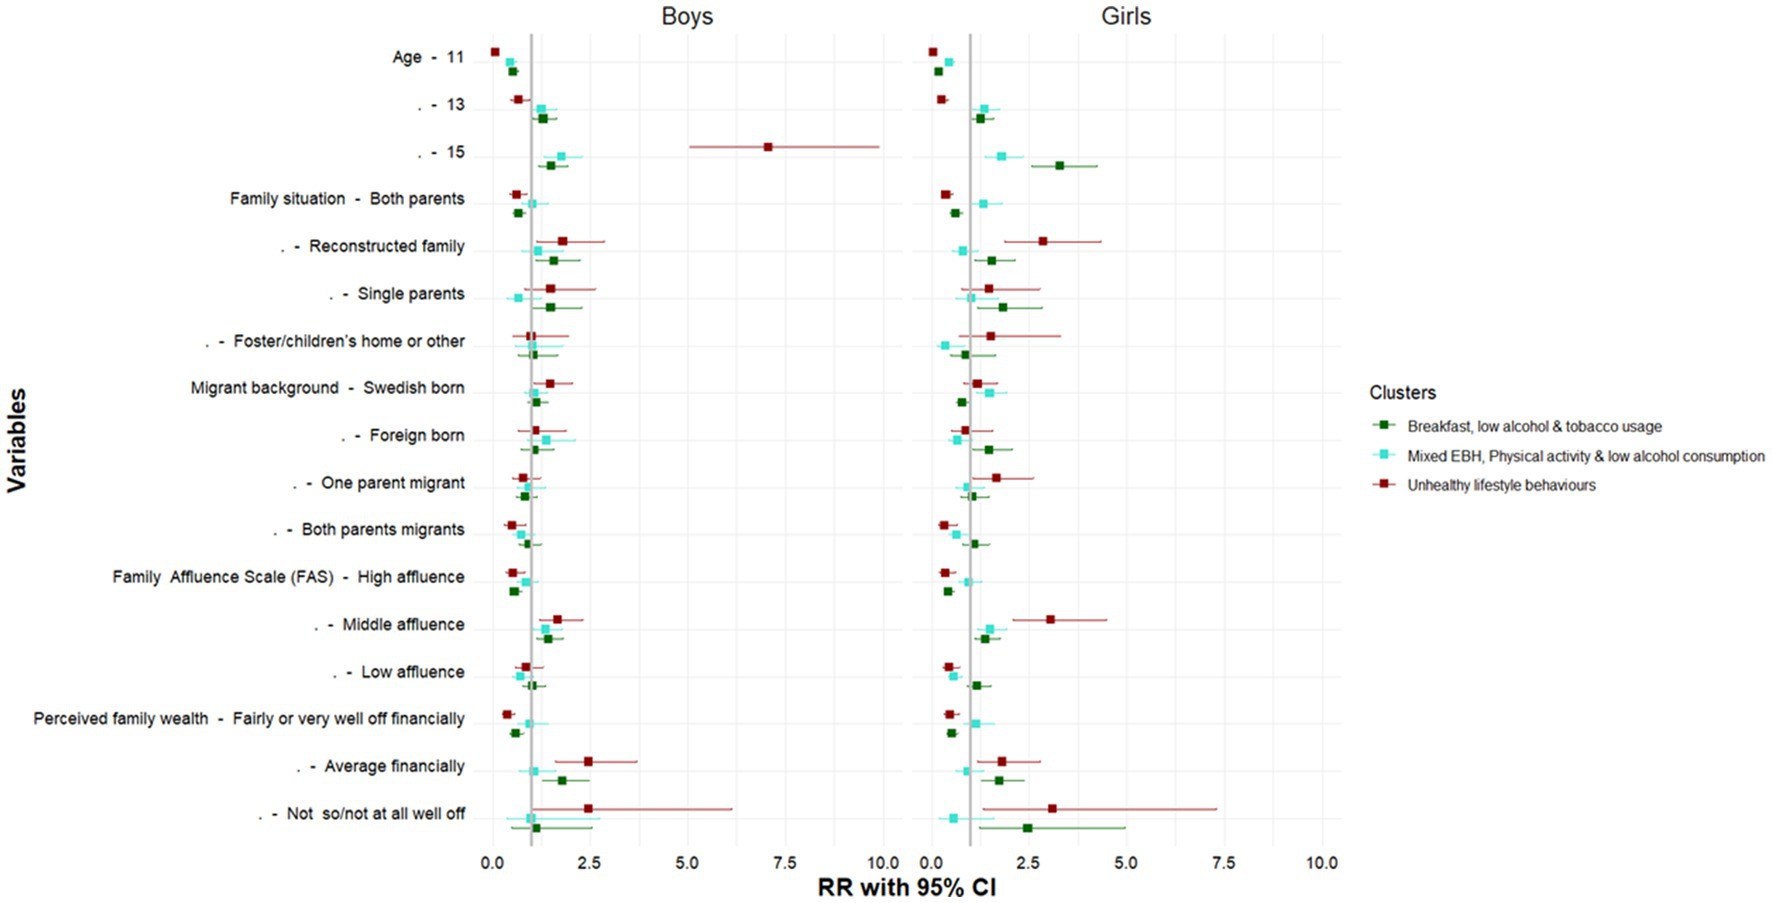
Figure 6. Socioeconomic and demographic correlates of each cluster by sex. Authors analysis, 2017/18 Swedish HBSC study; Exponentiated coefficients, significance *p < 0.05, **p < 0.01, ***p < 0.001; The reference cluster in the multinomial logistic regression model is the healthy behaviors clusters and the first category of each indicator.
Discussion
To our knowledge, this is the first study to utilize a large nationally representative sample of adolescents, to examine multiple HLBs in the Swedish context. We showed that HLBs clustered by sex and age. Four distinct behavioral patterns were identified in the sex-stratified LCA models, while the age-stratified models pointed to three distinct clusters. Our examination of measurement invariance - aimed at assessing whether the measures of health behaviors were consistently interpreted across various groups- indicated that despite differences by age and sex, the adolescents interpreted the questions in a similar way. This finding ensures the validity and reliability of the assessment. Our study results echo the findings from earlier studies (20, 22, 23, 25, 43–45), which suggests that the frequency, intensity and overall HLB patterns are not the same for all groups (Figure 7).
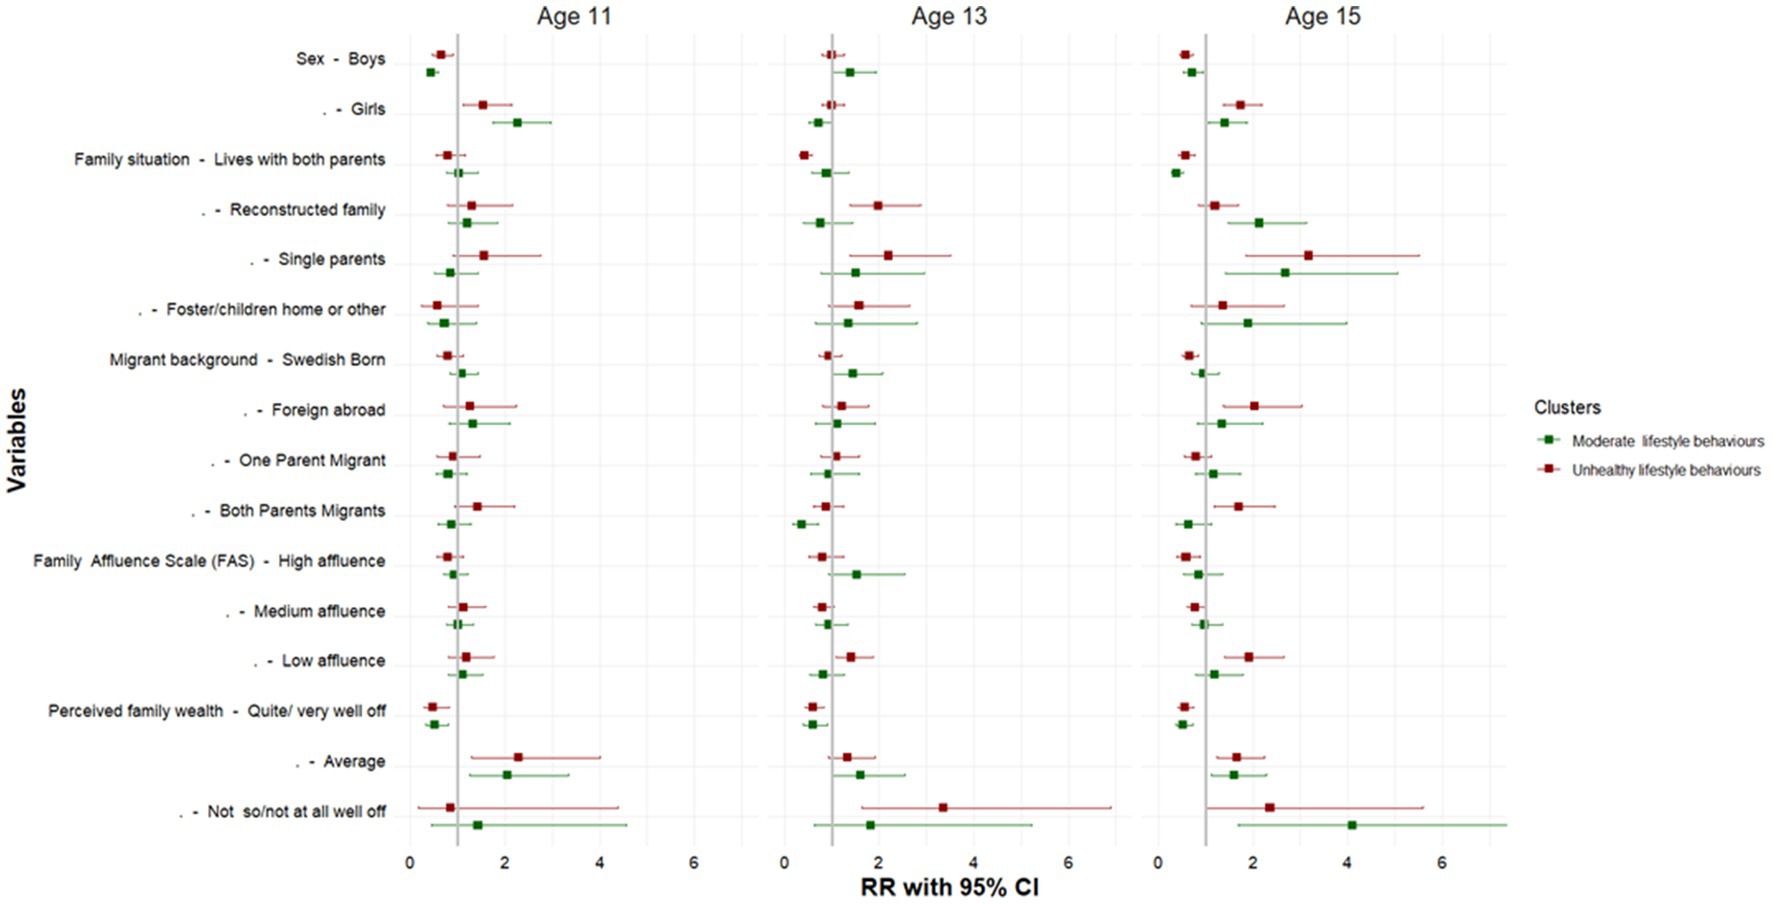
Figure 7. Socioeconomic and demographic correlates of each LCA by age. Authors analysis, 2017/18 Swedish HBSC study; Exponentiated coefficients, significance * p < 0.05, **p < 0.01, ***p < 0.001; The reference cluster in the multinomial logistic regression model is the healthy behaviors clusters and the first category of each indicator.
Our analysis suggests that significant differences exist in health behaviors, given that boys were overrepresented in every HLB cluster except the healthy behaviors cluster. This finding is consistent with that of earlier studies (22, 43, 44). In particular, we found that, compared to girls, boys were more likely to meet breakfast recommendations but were less likely to meet other dietary requirements such as the intake of fruits, vegetables and the consumption of sugar sweetened beverages and sweets. However, our results differed from at least one study, which found that it was more common for girls to be classified in clusters engaging in poor dietary behaviours compared to boys (23). On the other hand, consistent with prior studies (23, 25, 43), our results showed that boys consistently reported greater engagement in PA, and that it was more common for them to use tobacco and drink alcohol. These results are consistent with other studies. For instance, a recent study by Miranda et al. (46) found that adolescent girls were most likely to be classified in HLB clusters characterized by a high degree of physical inactivity and sedentary behaviors. SHP also varied by sex and across all the clusters.
Furthermore, we discovered that the patterning of HLBs could be attributed to age, revealing a distinct gradient. Specifically, when comparing 11-year-olds and 15-year-olds, a clear distinction in health behaviors emerged. It was observed that the majority of 11-year-olds were classified within the healthy behaviors cluster. However, a higher percentage of 13-year-olds exhibited a slightly higher risk of being classified in the unhealthy behaviors cluster,in contrast to 15-year-olds. Such a finding would be more in line with the existing literature. For instance, a systematic review conducted by Leech et al. (43), which included 18 individual studies investigating the clustering of multiple health behaviors, reported significant age gradients in health behaviors, which suggested that older children/adolescents tend to exhibit clusters with less healthy behaviors. Despite, the slight deviation, our results are in line with increasing evidence which suggests that health behaviors formed in childhood and adolescence tracks into later life (8–12, 46).
With regard to the second objective of this study, which aimed to examine how the identified clusters relate to the socioeconomic and demographic characteristics of adolescents and their parents, we found that age, sex, family situation, migrant status, and the socioeconomic status of families were consistent predictors of cluster membership. We further observed a negative association between socioeconomic circumstances and cluster membership classification, with adolescents from more disadvantaged backgrounds being more likely to be classified in the unhealthy behaviors cluster (45, 46). However, the strength of the association found between socioeconomic status and cluster membership, varied with the measure of SES used. For example, FAS which is an absolute measure of SES was more weakly associated with cluster membership when compared to perceived family wealth, which is a relative measure of wealth.
Our study results also indicated some similarities in the factors associated with cluster membership for boys and girls. We however found stronger associations between the socioeconomic and demographic indicators and unhealthy behaviors for boys. These findings align with at least one previous study (47). The significance of these findings is underscored by previous research demonstrating the influence of socioeconomic and demographic factors on HLBs. In particular, prior studies have shown for example, that unhealthy behaviors coupled with poor socioeconomic circumstances increases the risk of morbidity and mortality (3, 16, 22, 24, 43).
Strengths and limitations
This study has some limitations. First, the key measures used in the analyzes were based on self-reported measures with different reference periods, and they may therefore be subject to recall bias. Secondly, there are several limitations associated with the use of LCA models. LCA models employ multiple fit indices that depend on specific assumptions about the underlying statistical model. However, there is a lack of universally agreed-upon standards for their interpretation and application. Although the use of multiple indices enables a more comprehensive evaluation of the models, it is important to consider their limitations.
Furthermore, comparing the results of LCA models across studies can be challenging. This is due to variations in the identified clusters, which are determined by specific sets of items and the operationalization of those items. The number of items used in the models also varies across studies, further complicating the comparison of results (22, 24, 25, 43, 44).
Another limitation is the fact that the HBSC study aims to facilitate research on the overall health and well-being of adolescents (32). Consequently, the survey does not provide an in-depth analysis of specific nutritional intake. The questionnaire collected limited information on the frequency of intake, specifically regarding fruits, vegetables, sugar-sweetened beverages, and sweets. However, it did not capture data on the amount or portion sizes of these consumed items. Despite this limitation, the instrument is widely used and considered a valid measure of the dietary patterns of adolescents (31, 32, 48–50).
Notwithstanding these limitations, a strength of the current study was the inclusion of self-reported data obtained from children and adolescents participating in the HBSC study. This enabled the study to gather their unique perspectives and experiences regarding living conditions and health behaviors. Notwithstanding these limitations, a strength of the current study was the inclusion of self-reported data obtained from children and adolescents participating in the HBSC study. This enabled the study to gather their unique perspectives and experiences regarding living conditions and health behaviors.
An advantage of using LCA is the possibility to examine the inter/intra-item relationships between multiple health behaviors simultaneously, and to assess numerous combinations of unobserved behavior patterns before reducing the data into smaller clusters (51). This current analyzes therefore contributes to our understanding of the interlinkage between various health behaviors while allowing for assessments of the differences in health behaviors by factors such as age and sex. Moreover, the use of LCA contributes to the growing scientific literature suggesting that health behaviors are not randomly distributed, but rather cluster within individuals and across similar socioeconomic and demographic characteristics (19, 24, 25, 28).
Conclusion
This study identifies distinct clusters based on sex and age and demonstrates that these clusters correlate with the socioeconomic and demographic characteristics of both adolescents and their parents. Many health-focused policy initiatives and programs tend to narrowly target specific lifestyle behaviors like physical activity or eating habits. However, our findings emphasize the importance of implementing more effective and targeted interventions that prioritize overall behavioral change among vulnerable groups and at-risk adolescents. Future research should investigate the effectiveness of employing a multi-behavioral change approach in prevention strategies.
Data availability statement
The data analyzed in this study is subject to the following licenses/restrictions: Requests to access these datasets should be directed to Application and enquiries for data use should be sent to c2tvbGJhcm5zLmhhbHNvdmFub3JAZm9sa2hhbHNvbXluZGlnaGV0ZW4uc2U=.
Ethics statement
The studies involving human participants were reviewed and approved by The Public Health Agency of Sweden and Statistics Sweden SCB - The national statistics office of Sweden. Informed consent to participate in this study was provided by the participants’ legal guardian/next of kin.
Author contributions
KJ: conceptualization and formal analysis. KJ and NA: methodology. KJ, PL, MC, and NA: writing–review and editing. All authors have read and agreed to the published version of the manuscript.
Acknowledgments
We thank the investigators and staff of the Beijing Genomics Institute (BGI) and Shanghai LUMING Biotechnology CO., LCD for technical support.
Conflict of interest
The authors declare that the research was conducted in the absence of any commercial or financial relationships that could be construed as a potential conflict of interest.
Publisher’s note
All claims expressed in this article are solely those of the authors and do not necessarily represent those of their affiliated organizations, or those of the publisher, the editors and the reviewers. Any product that may be evaluated in this article, or claim that may be made by its manufacturer, is not guaranteed or endorsed by the publisher.
Supplementary material
The Supplementary material for this article can be found online at: https://www.frontiersin.org/articles/10.3389/fpubh.2023.1178353/full#supplementary-material
References
1. Flodmark, C-E. Prevention models of childhood obesity in Sweden. Obes Facts. (2018) 11:257–62. doi: 10.1159/000482009
2. Neovius, M, Sundström, J, and Rasmussen, F. Combined effects of overweight and smoking in late adolescence on subsequent mortality: nationwide cohort study. BMJ. (2009) 338:b496. doi: 10.1136/bmj.b496
3. Lindberg, L, Danielsson, P, Persson, M, Marcus, C, and Hagman, E. Association of childhood obesity with risk of early all-cause and cause-specific mortality: a Swedish prospective cohort study. PLoS Med. (2020) 17:e1003078. doi: 10.1371/journal.pmed.1003078
4. Alfonsi, V, Scarpelli, S, D’Atri, A, Stella, G, and De Gennaro, L. Later school start time: the impact of sleep on academic performance and health in the adolescent population. Int J Environ Res Public Health. (2020) 17:2574. doi: 10.3390/ijerph17072574
5. Vist, GE, Grimsrud, TK, Valen, H, Becher, R, Brinchmann, BC, Elvsaas, I, et al. Are the health risks of moist oral snuff (snus) underestimated? Tidsskr Nor Laegeforen. (2020) 140:746. doi: 10.4045/tidsskr.19.0746
6. Sweden TPHAo. Overweight and obesity among school children 11–15-year-old continues to increase 2020. (2020). Available at: https://www.folkhalsomyndigheten.se/publicerat-material/publikationsarkiv/o/overweight-and-obesity-among-school-children-1115-year-old-continues-to-increase/.
7. Folkhälsomyndigheten och Livsmedelsverket. Förslag till åtgärder för ett stärkt, långsiktigt arbete för att främja hälsa relaterad till matvanor och fysisk aktivitet. Stockholm och Uppsala: Folkhälsomyndigheten och Livsmedelsverket (2017).
8. Winpenny, EM, van Sluijs, EM, White, M, Klepp, K-I, Wold, B, and Lien, N. Changes in diet through adolescence and early adulthood: longitudinal trajectories and association with key life transitions. Int J Behav Nutr Phys Act. (2018) 15:1–9. doi: 10.1186/s12966-018-0719-8
9. Taverno Ross, SE, Larson, N, Graham, DJ, and Neumark-Sztainer, D. Longitudinal changes in physical activity and sedentary behavior from adolescence to adulthood: comparing U.S.-born and foreign-born populations. J Phys Act Health. (2014) 11:519–27. doi: 10.1123/jpah.2011-0359
10. Aira, T, Vasankari, T, Heinonen, OJ, Korpelainen, R, Kotkajuuri, J, Parkkari, J, et al. Physical activity from adolescence to young adulthood: patterns of change, and their associations with activity domains and sedentary time. Int J Behav Nutr Phys Act. (2021) 18:1–11. doi: 10.1186/s12966-021-01130-x
11. Lien, N, Lytle, LA, and Klepp, K-I. Stability in consumption of fruit, vegetables, and sugary foods in a cohort from age 14 to age 21. Prev Med. (2001) 33:217–26. doi: 10.1006/pmed.2001.0874
12. Reitsma, MB, Flor, LS, Mullany, EC, Gupta, V, Hay, SI, and Gakidou, E. Spatial, temporal, and demographic patterns in prevalence of smoking tobacco use and initiation among young people in 204 countries and territories, 1990–2019. Lancet Public Health. (2021) 6:e472–81. doi: 10.1016/S2468-2667(21)00102-X
13. Hedin, G, Norell-Clarke, A, Hagell, P, Tønnesen, H, Westergren, A, and Garmy, P. Insomnia in relation to academic performance, self-reported health, physical activity, and substance use among adolescents. Int J Environ Res Public Health. (2020) 17:6433. doi: 10.3390/ijerph17176433
14. Raffetti, E, Donato, F, Forsell, Y, and Galanti, MR. Longitudinal association between tobacco use and the onset of depressive symptoms among Swedish adolescents: the Kupol cohort study. Eur Child Adolesc Psychiatry. (2019) 28:695–704. doi: 10.1007/s00787-018-1237-6
15. Tjora, T, Skogen, JC, and Sivertsen, B. Establishing the association between snus use and mental health problems: a study of Norwegian college and university students. Nicotine Tob Res. (2022) 25:135–42. doi: 10.1093/ntr/ntac208
16. Murray, CJ, Aravkin, AY, Zheng, P, Abbafati, C, Abbas, KM, Abbasi-Kangevari, M, et al. Global burden of 87 risk factors in 204 countries and territories, 1990–2019: a systematic analysis for the global burden of disease study 2019. Lancet. (2020) 396:1223–49. doi: 10.1016/S0140-6736(20)30752-2
17. World Health Organization. Global action plan for the prevention and control of noncommunicable diseases 2013–2020. Geneva: World Health Organization (2013).
18. Andersson, E, Welin, K, and Carlsson, K. Kostnader för fetma i Sverige idag och år 2030. IHE Rapport (2018).
19. Prochaska, JO. Multiple health behavior research represents the future of preventive medicine. Prev Med. (2008) 46:281–5. doi: 10.1016/j.ypmed.2008.01.015
20. Ahmad, K, Keramat, SA, Ormsby, GM, Kabir, E, and Khanam, R. Clustering of lifestyle and health Behaviours in Australian children and their relationship with obesity, self-rated health and quality of life. BMC Public Health. (2022) 23:847. doi: 10.1186/s12889-023-15724-6
21. Poortinga, W. The prevalence and clustering of four major lifestyle risk factors in an English adult population. Prev Med. (2007) 44:124–8. doi: 10.1016/j.ypmed.2006.10.006
22. D'Souza, NJ, Kuswara, K, Zheng, M, Leech, R, Downing, KL, Lioret, S, et al. A systematic review of lifestyle patterns and their association with adiposity in children aged 5–12 years. Obes Rev. (2020) 21:e13029. doi: 10.1111/obr.13029
23. Nolan, A, and Smyth, E. Clusters of health behaviours among young adults in Ireland. Research Series (2020).
24. Parker, KE, Salmon, J, Costigan, SA, Villanueva, K, Brown, HL, and Timperio, A. Activity-related behavior typologies in youth: a systematic review. Int J Behav Nutr Phys Act. (2019) 16:1–13. doi: 10.1186/s12966-019-0804-7
25. Miranda, VPN, Coimbra, DR, Bastos, RR, Miranda Júnior, MV, and Amorim, PRS. Use of latent class analysis as a method of assessing the physical activity level, sedentary behavior and nutritional habit in the adolescents’ lifestyle: a scoping review. PLoS One. (2021) 16:e0256069. doi: 10.1371/journal.pone.0256069
26. Degerlund Maldi, K, San Sebastian, M, Gustafsson, PE, and Jonsson, F. Widespread and widely widening? Examining absolute socioeconomic health inequalities in northern Sweden across twelve health indicators. Int J Equity Health. (2019) 18:1–12. doi: 10.1186/s12939-019-1100-5
27. Lundberg, O. The next step towards more equity in health in Sweden: how can we close the gap in a generation? Scand J Public Health. (2018) 46:19–27. doi: 10.1177/1403494818765702
28. Prochaska, JJ, Spring, B, and Nigg, CR. Multiple health behavior change research: an introduction and overview. Prev Med. (2008) 46:181–8. doi: 10.1016/j.ypmed.2008.02.001
29. Russell Jonsson, K, Taylor-Robinson, DC, Schultz Straatmann, V, Melis, G, and Adjei, NK. Health behaviors and subsequent mental health problems during the COVID-19 pandemic: a longitudinal analysis of adults in the UK. Front Public Health. (2023) 10:10. doi: 10.3389/fpubh.2022.1064677
30. Currie, C, Nic Gabhainn, S, and Godeau, E. The health behaviour in school-aged children: WHO collaborative cross-national (HBSC) study: origins, concept, history and development 1982–2008. Int J Public Health. (2009) 54:131–9. doi: 10.1007/s00038-009-5404-x
31. Nardone, P, Pierannunzio, D, Ciardullo, S, Lazzeri, G, Cappello, N, Spinelli, A, et al. Dietary habits among Italian adolescents and their relation to socio-demographic characteristics. Ann Ist Super Sanità. (2020) 56:504–13. doi: 10.4415/ANN_20_04_15
32. Inchley, J, Currie, D, Cosma, A, and Samdal, O. Health behaviour in school-aged children (HBSC) study protocol: Background, methodology and mandatory items for the 2017/18 survey. St Andrews: CAHRU (2018).
33. Hagström, C. Nu är det fredagsmys! Chips och gemenskap när vardag blir helg. Budkavlen. (2012) 91:9–25. doi: 10.37447/bk.129783
34. World Health Organization. Global recommendations on physical activity for health. Geneva: World Health Organization (2010).
36. Inchley, J, Currie, D, Vieno, A, Torsheim, T, Ferreira-Borges, C, Weber, MM, et al. Adolescent alcohol-related behaviours: Trends and inequalities in the WHO European region, 2002–2014: Observations from the health behaviour in school-aged children (HBSC) WHO collaborative cross-national study: World Health Organization. Regional Office for Europe (2018).
37. Hirshkowitz, M, Whiton, K, Albert, SM, Alessi, C, Bruni, O, DonCarlos, L, et al. National Sleep Foundation’s updated sleep duration recommendations: final report. Sleep Health. (2015) 1:233–43. doi: 10.1016/j.sleh.2015.10.004
38. Gariepy, G, Danna, S, Gobiņa, I, Rasmussen, M, Gaspar de Matos, M, Tynjälä, J, et al. How are adolescents sleeping? Adolescent sleep patterns and sociodemographic differences in 24 European and north American countries. J Adolesc Health. (2020) 66:S81–8. doi: 10.1016/j.jadohealth.2020.03.013
39. Corell, M, Chen, Y, Friberg, P, Petzold, M, and Löfstedt, P. Does the family affluence scale reflect actual parental earned income, level of education and occupational status? A validation study using register data in Sweden. BMC Public Health. (2021) 21:1–11. doi: 10.1186/s12889-021-11968-2
40. Lanza, ST, Dziak, JJ, Huang, L, Wagner, A, and Collins, LM. Proc LCA & Proc LTA users’ guide (version 1.3. 2). University Park: The Methodology Center, Penn State. (2015).
41. Akaike, H Factor analysis and AIC. Selected papers of hirotugu akaike. Berlin: Springer, 371–386. (1987).
42. Raftery, AE. Bayesian model selection in social research. Sociol Methodol. (1995) 25:111. doi: 10.2307/271063
43. Leech, RM, McNaughton, SA, and Timperio, A. The clustering of diet, physical activity and sedentary behavior in children and adolescents: a review. Int J Behav Nutr Phys Act. (2014) 11:4–9. doi: 10.1186/1479-5868-11-4
44. Cabanas-Sánchez, V, Martínez-Gómez, D, Izquierdo-Gómez, R, Segura-Jiménez, V, Castro-Piñero, J, and Veiga, OL. Association between clustering of lifestyle behaviors and health-related physical fitness in youth: the UP&DOWN study. J Pediatr. (2018) 199:e1:41–48.e1. doi: 10.1016/j.jpeds.2018.03.075
45. Paulsson Do, U, Edlund, B, Stenhammar, C, and Westerling, R. Vulnerability to unhealthy behaviours across different age groups in Swedish adolescents: a cross-sectional study. Health Psychol Behav Med. (2014) 2:296–313. doi: 10.1080/21642850.2014.892429
46. Lioret, S, Campbell, KJ, McNaughton, SA, Cameron, AJ, Salmon, J, Abbott, G, et al. Lifestyle patterns begin in early childhood, persist and are socioeconomically patterned, confirming the importance of early life interventions. Nutrients. (2020) 12:724. doi: 10.3390/nu12030724
47. Carlerby, H, Englund, E, Viitasara, E, Knutsson, A, and Gådin, KG. Risk behaviour, parental background, and wealth: a cluster analysis among Swedish boys and girls in the HBSC study. Scand J Public Health. (2012) 40:368–76. doi: 10.1177/1403494812449926
48. Vereecken, CA, and Maes, L. A Belgian study on the reliability and relative validity of the health behaviour in school-aged children food-frequency questionnaire. Public Health Nutr. (2003) 6:581–8. doi: 10.1079/PHN2003466
49. Vereecken, CA, Rossi, S, Giacchi, MV, and Maes, L. Comparison of a short food-frequency questionnaire and derived indices with a seven-day diet record in Belgian and Italian children. Int J Public Health. (2008) 53:297–305. doi: 10.1007/s00038-008-7101-6
50. Fismen, A-S, Smith, ORF, Torsheim, T, Rasmussen, M, Pedersen Pagh, T, Augustine, L, et al. Trends in food habits and their relation to socioeconomic status among Nordic adolescents 2001/2002-2009/2010. PLoS One. (2016) 11:e0148541. doi: 10.1371/journal.pone.0148541
Keywords: health behaviors, lifestyle, alcohol, diet, physical activity, smoking, sleep, children and adolescents
Citation: Jonsson KR, Corell M, Löfstedt P and Adjei NK (2023) The clustering of multiple health and lifestyle behaviors among Swedish adolescents: a person-oriented analysis. Front. Public Health. 11:1178353. doi: 10.3389/fpubh.2023.1178353
Edited by:
Victor Adekanmbi, University of Texas Medical Branch at Galveston, United StatesReviewed by:
Samuel Honório, Polytechnic Institute of Castelo Branco, PortugalMaria Gacek, University School of Physical Education in Krakow, Poland
Copyright © 2023 Jonsson, Corell, Löfstedt and Adjei. This is an open-access article distributed under the terms of the Creative Commons Attribution License (CC BY). The use, distribution or reproduction in other forums is permitted, provided the original author(s) and the copyright owner(s) are credited and that the original publication in this journal is cited, in accordance with accepted academic practice. No use, distribution or reproduction is permitted which does not comply with these terms.
*Correspondence: Nicholas Kofi Adjei, YWRqZWlAdW5pLWJyZW1lbi5kZQ==