 Qiqi Wang
 Chuchuan Wan
 Maozhen Li
 Xiaoyu Xi
- The Research Center of National Drug Policy & Ecosystem, China Pharmaceutical University, Nanjing, China
Objective: The study aims to develop a mapping algorithm from the Pediatric Quality of Life Inventory™ 4. 0 (Peds QL 4.0) onto Child Health Utility 9D (CHU-9D) based on the cross-sectional data of functional dyspepsia (FD) children and adolescents in China.
Methods: A sample of 2,152 patients with FD completed both the CHU-9D and Peds QL 4.0 instruments. A total of six regression models were used to develop the mapping algorithm, including ordinary least squares regression (OLS), the generalized linear regression model (GLM), MM-estimator model (MM), Tobit regression (Tobit) and Beta regression (Beta) for direct mapping, and multinomial logistic regression (MLOGIT) for response mapping. Peds QL 4.0 total score, Peds QL 4.0 dimension scores, Peds QL 4.0 item scores, gender, and age were used as independent variables according to the Spearman correlation coefficient. The ranking of indicators, including the mean absolute error (MAE), root mean squared error (RMSE), adjusted R2, and consistent correlation coefficient (CCC), was used to assess the predictive ability of the models.
Results: The Tobit model with selected Peds QL 4.0 item scores, gender and age as the independent variable predicted the most accurate. The best-performing models for other possible combinations of variables were also shown.
Conclusion: The mapping algorithm helps to transform Peds QL 4.0 data into health utility value. It is valuable for conducting health technology evaluations within clinical studies that have only collected Peds QL 4.0 data.
Introduction
Functional dyspepsia (FD) is a clinical syndrome occurring in the gastroduodenal region. FD is a common pediatric disorder with a prevalence of ~3% in China (1) and ~3 to 7.6% in other countries (2, 3). Children and adolescents with FD are often associated with symptoms such as postprandial fullness, early satiation, anorexia, belching, nausea, vomiting, upper abdominal gaseous distension, pain, burning sensation, and acid regurgitation (1, 4).
Previous studies have shown that FD leads to lower health-related quality of life (HRQoL) in children and adolescents, with significant negative effects on their lives (3, 5), causing sleep disturbances, psychological distress, frequent absence from school, and less social interaction (6–8). Thus, accurate measuring and monitoring of the HRQoL of patients are valuable for understanding the harm caused by FD and managing the disease. Meanwhile, it promotes the development of health technology assessment. As a key indicator for measuring HRQoL, health utility value (HUV) can adequately reflect individual preferences and has been widely used. HUVs can be obtained by direct or indirect measurement. Indirect measures are more commonly used because of their simplicity and ease of use. Currently, the main scales that indirectly measure the quality of life and HUVs in children or adolescents include the Child Health Utility 9D (CHU-9D), EuroQoL five-dimension youth version three-level (EQ-5D-Y-3L), short-form six-dimension (SF-6D), and Health Utilities Index (HUI) (9, 10). However, Pediatric Quality of Life InventoryTM 4.0 (Peds QL 4.0) is often used in clinical studies of FD (11–13). It cannot directly measure HUVs (14) as a non-preference-based scale. To make full use of existing research data and obtain HUVs of FD patients, constructing a mapping algorithm from Peds QL 4.0 to preference-based scale is necessary. The CHU-9D, a multi-attribute utility scale for children and adolescents, is used worldwide (9, 11) and has been demonstrated by previous studies to have good psychometric properties in the Chinese population (15). Unlike other preference-based scales that apply to children and adolescents, CHU-9D was originally developed for young people (16). In addition, both the Peds QL 4.0 and CHU-9D had items to investigate the physical and psychosocial health of children and adolescents. For instance, the CHU-9D sad and sleep dimensions were captured in Peds QL 4.0 emotional functional dimension, and the pain and tired dimensions were captured in physical functioning dimension. The conceptual overlap makes it meaningful to develop a mapping algorithm between Peds QL 4.0 and CHU-9D.
Up to now, mapping has been regarded as the “second-best solution” for measuring HUVs. ISPOR has issued relevant guidance to guide researchers to use this method (17, 18). A large number of studies have shown that the mapping algorithm between Peds QL 4.0 and preference-based scale can be developed to obtain the HUV (19–24). However, no such study has been conducted for developing a mapping algorithm between Peds QL 4.0 and CHU-9D in Chinese FD children and adolescents. Thus, this study was to develop an algorithm based on Chinese FD patients. In addition, the mapping algorithm enables researchers to calculate HUVs using available clinical data, which facilitates the development of health technology evaluations.
Methods
From March to May 2020, FD outpatients were recruited from several hospitals in Zhejiang province through convenient sampling. Meanwhile, we collected data related to the HRQoL of participants by CHU-9D and Peds QL 4.0. All participants voluntarily participated and signed informed consent. This study was approved by the Ethics Committee of China Pharmaceutical University.
Sample
Inclusion criteria were as follows: (1) informed and voluntary; (2) age 6 to 17 years [the CHU-9D is suitable for children and adolescents aged 7–17 years. Studies have shown that it is also suitable for children aged 6–7 years (25)]; and (3) diagnosed with FD according to the Rome IV criteria (26). The exclusion criteria were as follows: (1) non-Chinese; (2) mental patients, unconsciousness, unable to describe their own situation.
Data collection
Trained investigators went to hospitals to present the study to FD patients and their guardians and asked them about their willingness to participate. For patients who want to take part, investigators will provide them with an informed consent form and a questionnaire. After signing the forms in a quiet environment, they completed questionnaires in full view of investigators. The questionnaire includes two HRQoL tools. In addition, to avoid ranking bias, participants decided the order of filling by flipping a coin. Considering that younger patients may have difficulty in understanding the scale, the children younger than 7 years old completed the questionnaires with their guardians, while other participants completed on their own. For the basic information part of the questionnaire, the guardian should assist the participants to complete it. After the questionnaire was completed, the investigator would check the questionnaire and upload the data after the respondents confirmed the questions. After that, the auditor would review it again. For the questionnaire with obvious problems, the auditor would return the questionnaire.
Questionnaire
The literature and experts' opinions were drawn upon (11, 13, 14, 27, 28). The questionnaire was divided into two parts as follows: basic information and health status. According to the results of the pilot survey in hospitals, we modified the questionnaire and formed the final version. Its rationality, readability, and comprehensibility were affirmed by experts and supported by the results of pilot research.
There were two parts to the questionnaires. Part 1 collected sociodemographic information, including age, gender, parents' education level, and family income. Part 2 collected some health status indicators reported by patients through CHU-9D and Peds QL 4.0.
Child health utility 9D
Child Health Utility 9D (CHU-9D) was a universal scale developed for children and adolescents by Professor Katherine Stevens from the University of Sheffield. It was used to obtain children's and adolescents' HUVs of subjects and had been widely used at present. The translation process of the Chinese version of the CHU-9D questionnaire was designed based on the recommendations of the ISPOR Task Force (29). In 2013, a pilot study was conducted in Jiangsu province, China. Its results supported the feasibility and construct validity of the Chinese version of CHU-9D for measuring and valuing the HRQoL of Chinese young people (15). The CHU-9D consisted of nine dimensions that are “worried,” “sad,” “pain,” “tired,” “annoyed,” “schoolwork/homework,” “sleep,” “daily routine,” and “activities,” each dimension had five levels, a total of 59 = 1,953,125 possible health states were defined. The CHU-9D was originally developed for children aged 7–11 years (16), but subsequent studies have shown that it can also be used for children aged 6 years and adolescents aged 11–17 years (25, 30). In this study, the CHU-9D utility scores were calculated using the China value set (27).
Peds QL 4.0
Pediatric Quality of Life Inventory™ 4.0 (Peds QL 4.0) was developed under the lead of Professor Varni et al. (14) and was officially released in 1999. Peds QL 4.0 was introduced in China in 2004. Yi-Yun et al. developed the Chinese version of Peds QL 4.0 based on the standard procedure of cross-cultural adaptation (translation–back translation–cultural adaptation–pre-test) to (31–33). This version was proved that it was applicable to Chinese children (14, 33–35). The self-report versions of the Peds QL 4.0 for young children (aged 5–7 years), children (aged 8–12 years), and teenagers (aged 13–18 years) and parent-report versions of the Peds QL 4.0 for young children (aged 5–7 years) were used in the study. Peds QL 4.0 contains four dimensions as follows: physical functioning (PF), emotional functioning (EF), social functioning (SF), and school functioning (ScF). There were 23 items, and the recall period was 1 month. PF contained eight items, while EF, SF, and ScF each contained five items. Items were scored on a five-point Likert scale as follows: 0 indicates “never a problem,” 1 indicates “almost never a problem,” 2 indicates “sometimes a problem,” 3 indicates “often a problem,” and 4 indicates “almost always a problem.” Items were, then, transformed into a score ranging from 0 to 100 (where 0 = 100, 1 = 75, 2 = 50, 3 = 25, and 4 = 0). The dimension score was the average score of the items contained in the dimension, and the total score was the average score of all items responded.
Data analysis
Descriptive statistics
Descriptive statistics [mean and standard deviation (SD) for continuous variables and frequency and percentage for categorical variables] were used for the sample characteristics. The distributions of the CHU-9D utility score and Peds QL 4.0 score were shown through Shapiro–Wilk test and figures.
Correlation test
Mapping of the scale requires some conceptual overlap between the initial scale and the target scale (36, 37). Spearman's rank correlations (ρ) were used in this study to test the conceptual overlap strength between CHU-9D and Peds QL 4.0. Conceptual overlap was characterized by the content similarity between HRQoL result measurements. If two scales lack conceptual overlap, the mapping relationship would not be established. In addition, we tested the correlation among the variables included in the study to ensure the low collinearity among the variables included in the mapping model. The strength of correlation could be divided into four levels (very weak = 0–0.19; weak = 0.20–0.39; moderate = 0.40–0.59; strong = 0.60–0.79; and very strong = 0.80–1.00) (38, 39).
Mapping model
Mapping consists of two broad approaches, such as direct mapping and response mapping. We used six regression models for developing a simpler and more accurate mapping algorithm, based on guidelines and previous research (17), including ordinary least squares regression (OLS), general linear regression model (GLM), MM-estimator model (MM), Tobit regression model (Tobit), Beta regression model (Beta) for direct mapping, and multinomial logistic regression (MLOGIT) for response mapping.
Ordinary least squares regression (OLS) uses linear functions to construct the relationship between independent variables and dependent variables. Due to its simplicity, OLS is widely used in direct mapping studies (38, 40). However, OLS performs poorly in predicting poor or full health, and the predicted values may be outside of the reasonable range (41–43). GLM (link “logit”), a flexible form of OLS, allows the outcome variables to have non-normal error distributions (44, 45). MM can better identify outliers, thus MM is less affected by outliers and has less deviation from the fitted residuals (23, 46). When using the traditional linear regression model, the predicted value is often out of the range of the dependent variable. In view of the fact that the CHU-9D scores are deleted at the upper and lower limits, OLS and GLM tend to produce systematic bias. We also used the Tobit model and Beta model. As a censored model, the Tobit model can be used to predict the continuous but limited or truncated dependent variables, but it is more sensitive to heteroscedasticity and non-normal distribution (47, 48). The Beta model solves this problem by assuming that the value of the dependent variable is between 0 and 1, and the model is also suitable for cases with heteroscedasticity or non-normal distribution of the data (49, 50). In response mapping, we used the MLOGIT model to obtain the probability of a specific level of CHU-9D in each dimension and then calculated the utility value of CHU-9D using the expected utility value method (50).
Variables
We chose the CHU-9D total score and scores of each dimension of CHU-9D as the dependent variable for direct and response mapping, and Peds QL 4.0 total score, Peds QL 4.0 dimension scores, and Peds QL 4.0 item scores were used as independent variables for regression to generate mapping algorithm. In addition, to ensure the accuracy of the mapping algorithm, age and gender were included as independent variables according to the correlation between variables. Finally, six combination models of independent variables were developed, as presented in Table 1.
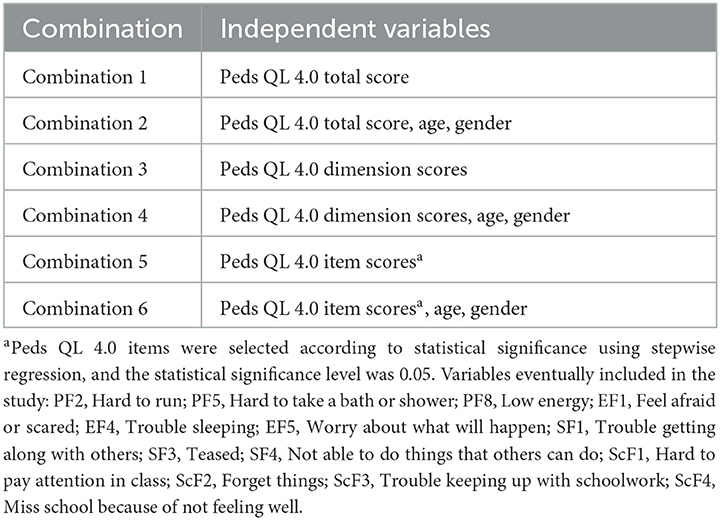
Table 1. Combinations of variables.
Validation and comparison of mapping algorithms
The 10-fold cross-validation method was used to predict model performance. In this method, the original sample was divided into 10 subsamples of roughly equal size. In total. One of the 10 subsamples was taken as the validation sample, and the remaining subsamples were taken as the training samples for regression (23, 45).
The mean of the HUVs predicted (mean P), root mean square error (RMSE), mean absolute error (MAE), adjusted R2 (adj R2), and concordance correlation coefficient (CCC) was recorded and averaged for each combination. The mapping algorithm with the best comprehensive ranking was the optimal mapping algorithm in different combinations of variables (18, 45).
All statistical analyses were performed by stata15, programs R and Microsoft® Excel 2016.
Result
Participant characteristics
A total of 2,152 eligible FD patients were enrolled in this study (Table 2), of whom 1,155 patients had their guardians complete the questionnaire on their behalf. Their mean age (SD) was 7.23 (1.47) years, the mean utility score of CHU-9D (SD) was 0.88 (0.10), and the mean score of Peds QL 4.0 (SD) was 61.52 (5.63). Participants' CHU-9D utility score and Peds QL 4.0 total score were skewed (Figure 1).
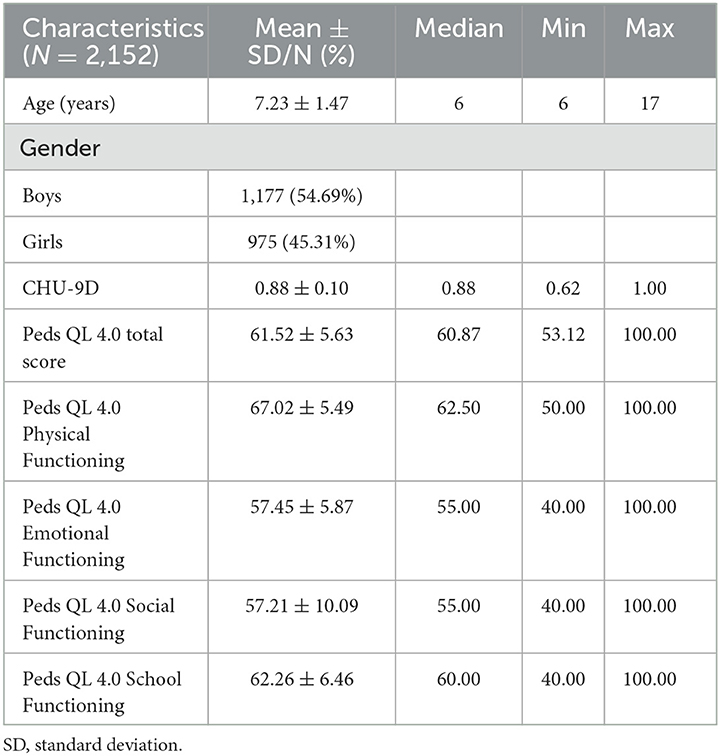
Table 2. Participant characteristics.
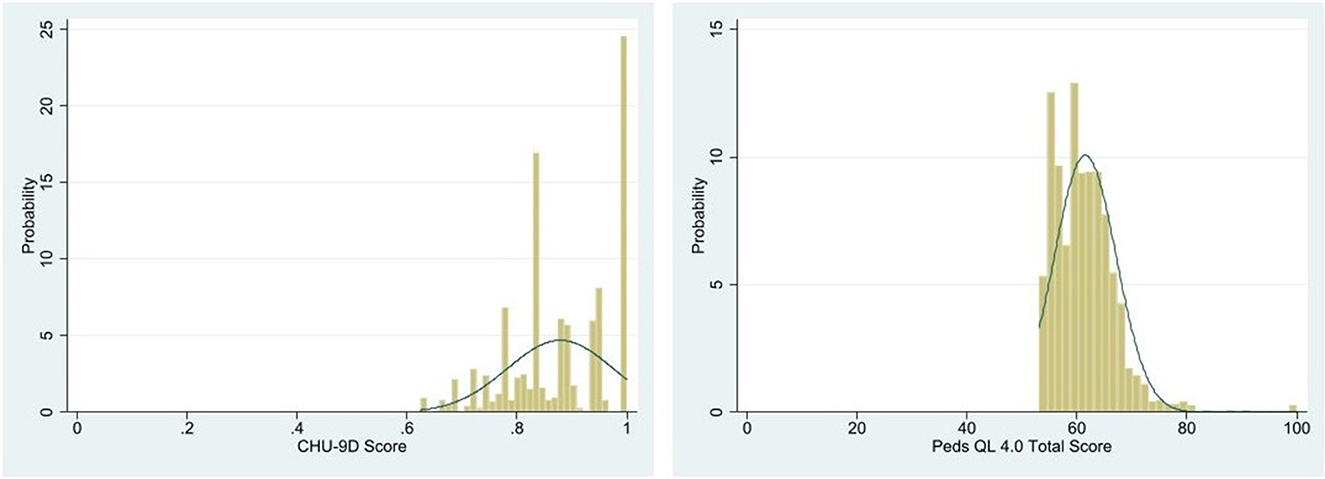
Figure 1. Distributions of CHU-9D utility score and Peds QL 4.0 total score.
Correlation test results
Correlations between CHU-9D utility score, Peds QL 4.0 total score, Peds QL 4.0 dimension scores, Peds QL 4.0 item scores, age, and gender are presented in Appendix 1. There was a strong positive correlation between the CHU-9D utility score and Peds QL 4.0 total score (ρ = 0.6836, p < 0.001), as well as the Peds QL 4.0 dimension scores and the CHU-9D utility score, among which the SF dimension had the highest correlation (ρ = 0.6399, p < 0.001) and the PF dimension had the lowest correlation (ρ = 0.3146, p < 0.001).
Performance of mapping algorithms
The results of mapping algorithm performance based on six regression techniques are presented in Table 3.
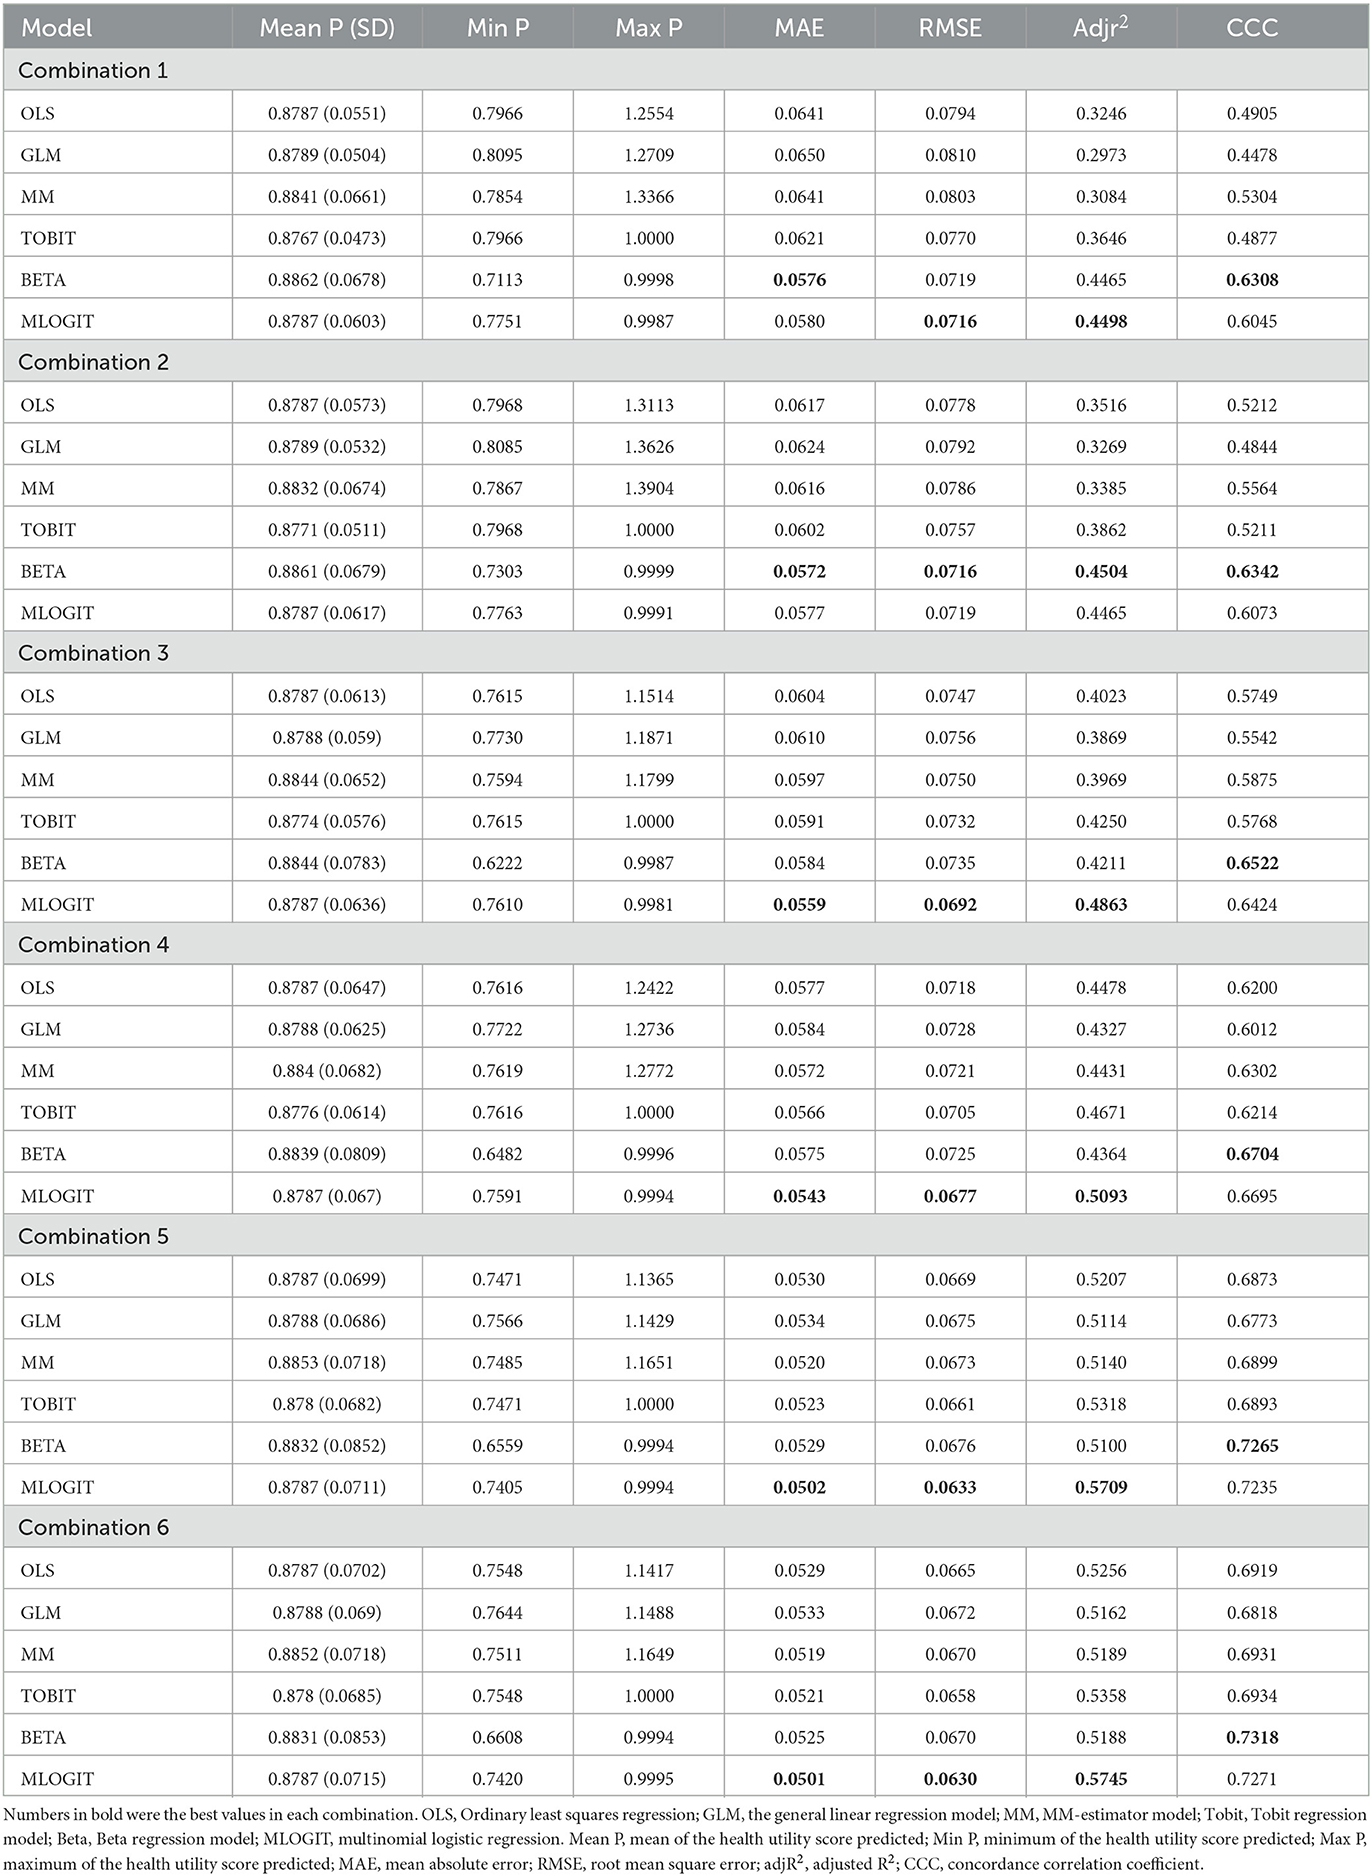
Table 3. Goodness-of-fit results from the full estimation sample (N = 2,152).
For model combinations based on the full estimation sample, the mean P ranged from 0.8767 (Tobit of Combination 1) to 0.8862 (Beta of Combination 1), with the OLS of Combination 3 having the closest predicted score (0.8784) to the mean score. In Combination 1, Beta had the lowest MAE (0.0576), while MLOGIT performed better in RMSE (0.0716) and adj R2 (0.4498). In Combination 2, Beta performed better than other models. In Combinations 3 to 6, MLOGIT had the lowest comprehensive ranking and better performance than other models. The Beta had the best CCC in all combinations. Among all combinations, MLOGIT in Combination 6 had the best MAE (0.0501), RMSE (0.0630), and adj R2 (0.5745), and the Beta model had the best CCC (0.7319). In summary, the performance based on Peds QL 4.0 item scores (Combinations 5 and 6) was better than other combinations. MLOGIT had better performance in the validation index, with the best MAE, RMSE, and adj R2, followed by the Beta model and Tobit model, and the difference between MLOGIT and Beta was very small.
Validation
The results showed that MLOGIT had the best performance. However, the absence of some dimension levels may lead to abnormal or biased fitting results of MLOGIT. Moreover, there was a small difference between MLOGIT and the second-best model in each index. Thus, we preliminarily concluded that choosing the second-best model would be more helpful to obtain accurate results. MLOGIT was not validated in this study.
Table 4 summarizes the validation results of the model through the 10-fold cross-validation method. In all combinations, Beta and Tobit performed better on the validation index. In Combinations 1 to 2, Beta had the lowest ranking and better performance than other models. In Combination 3, MAE and CCC of Beta were superior to Tobit, while RMSE and adj R2 of Tobit were superior. The comprehensive ranking of the two models was consistent. Considering that RMSE was more sensitive to potential outliers, more weight could be given to MAE in this case (51). Therefore, we concluded that Beta was better in this combination. In Combinations 4 to 6, the Tobit had the lowest comprehensive ranking and better performance than other models. Of all the combinations, Tobit had the best MAE (0.0559), RMSE (0.0685), and adj R2 (0.4973) in Combination 5, and Beta had the best CCC (0.7278) in Combination 6.
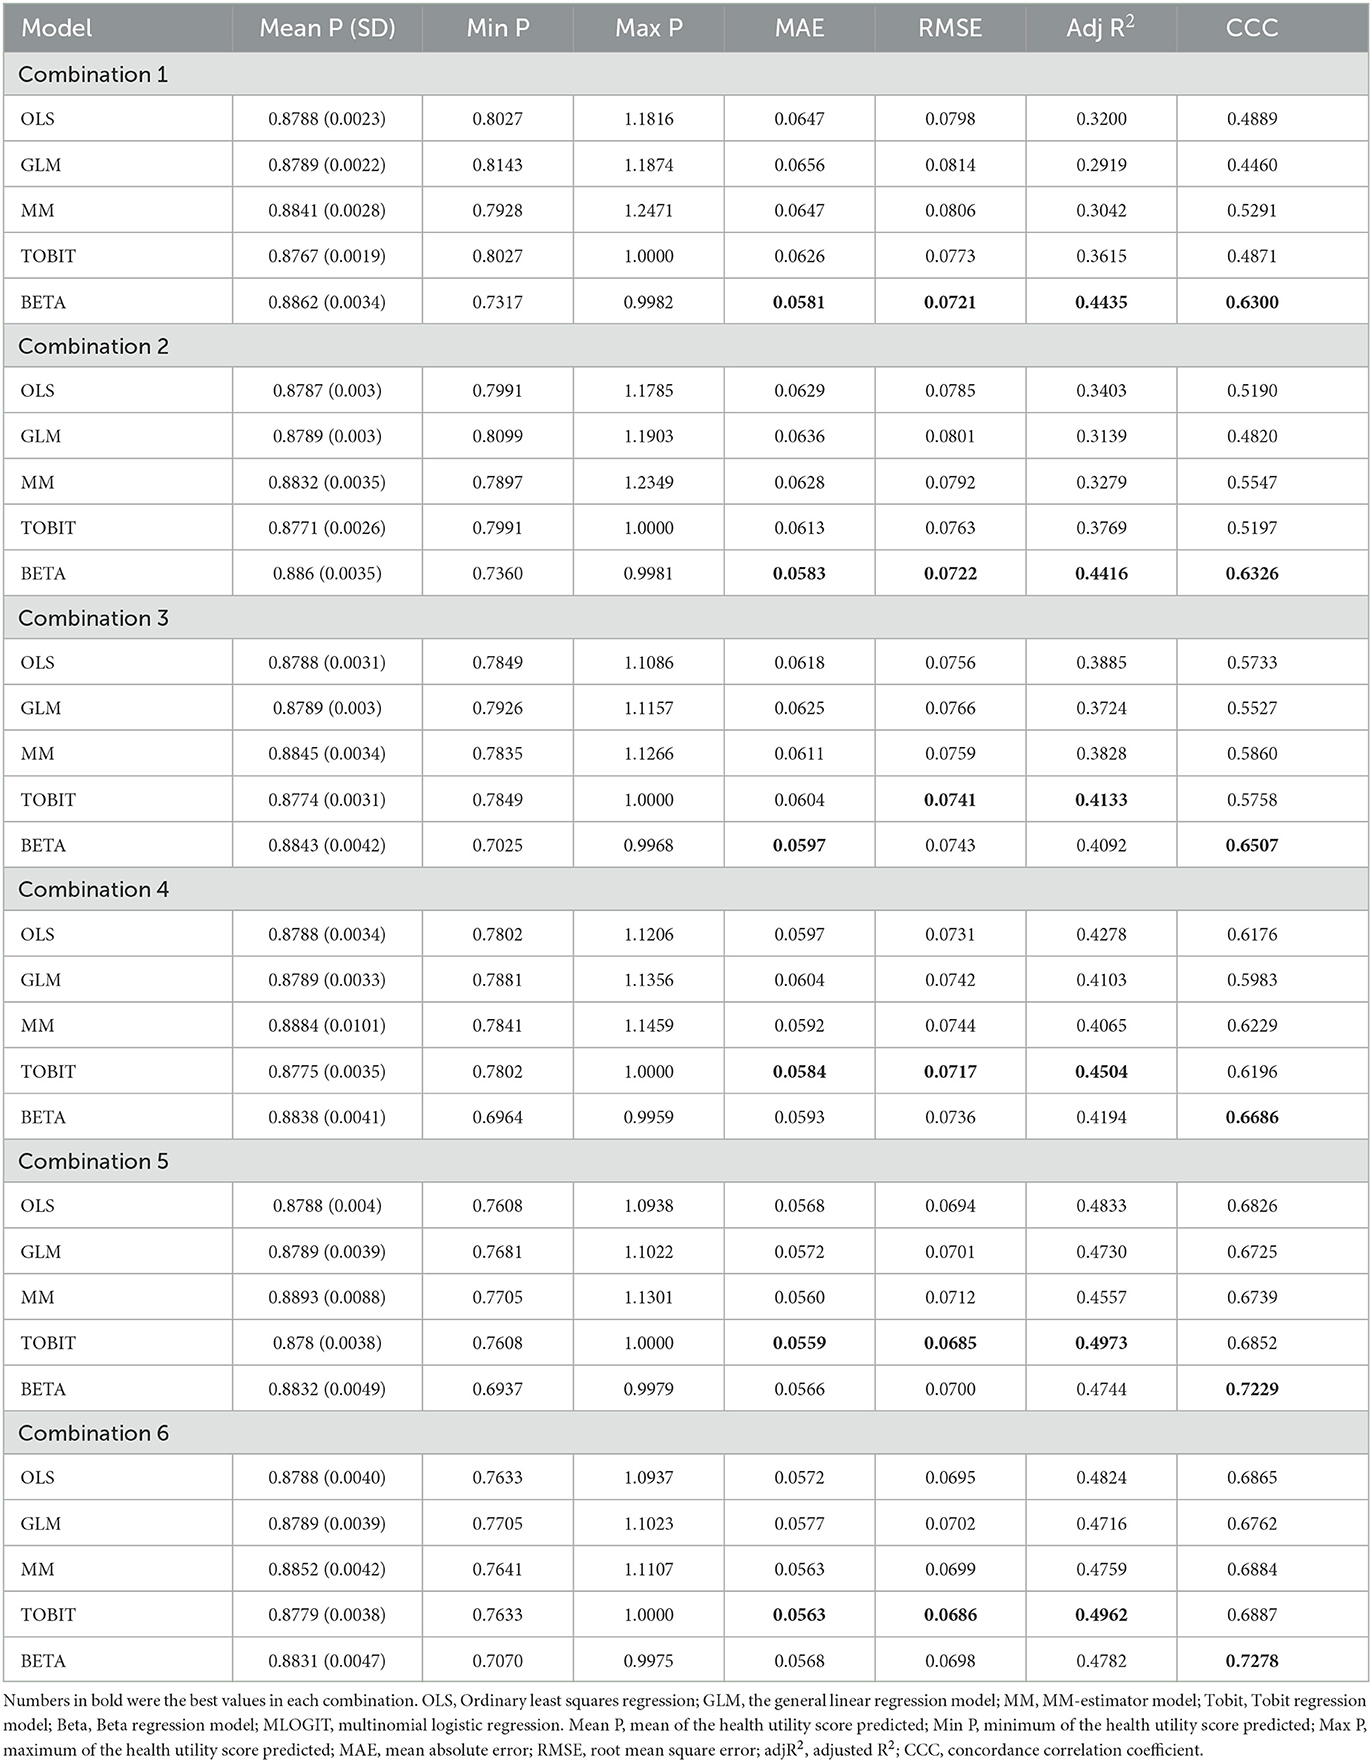
Table 4. Goodness-of-fit results from the 10-fold cross-validation.
Best-performing mapping algorithm
According to the comprehensive ranking of the four indexes, the Tobit with Peds QL 4.0 item scores, gender, and age as independent variables (Combination 6) was the best model to predict the CHU-9D utility score. However, the Peds QL 4.0 item scores were difficult to obtain in reality. Hence, we provided the parameters of the optimal mapping algorithm for the CHU-9D utility score of different combinations (Table 5) and the consistency between the predicted CHU-9D utility score and the observed CHU-9D utility score (Figure 2). The Pearson correlation coefficients were 0.6836, 0.6788, 0.6845, 0.7092, 0.7455, and 0.7476 for Combinations 1 to 6, respectively. They indicated a high correlation between the observed CHU-9D utility scores and predicted CHU-9D utility scores. On the basis of these results, we suggest that researchers choose different variable combinations and corresponding mapping algorithms depending on the available data.
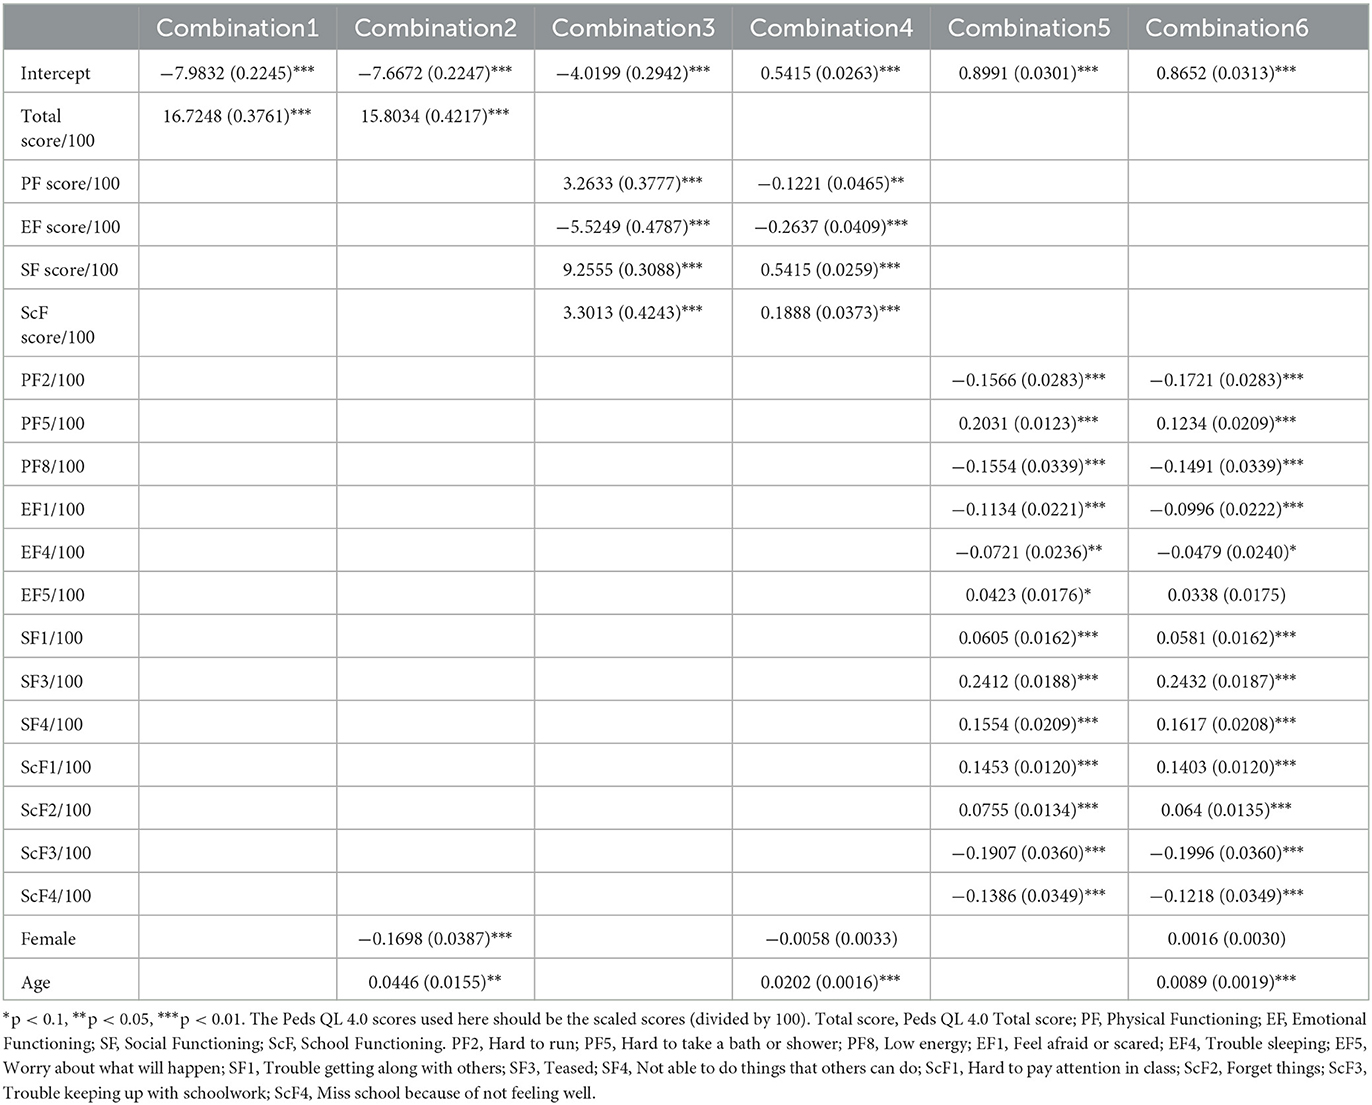
Table 5. Regression outputs of the mapping model.

Figure 2. The observed and predicted CHU-9D utility score.
Mapping algorithm
Based on the conclusions from the section best-performing mapping algorithm, the mapping algorithm formula can be shown as follows:
Combination 1–3: Beta Model.
Combination 4–6: Tobit Model.
[Xi is the independent variable, such as total Score, gender, and age. βi is the coefficient (parameters are presented in Table 4)].
Discussion
Up to now, three types of research have constructed mapping algorithms from Peds QL 4.0 to CHU-9D based on children and adolescents (19–22), but none of them are based on the Chinese population. Considering the differences and uniqueness of populations in different countries, this study is the first to construct a mapping algorithm from Peds QL 4.0 to CHU-9D based on Chinese children and adolescent FD patients. This mapping algorithm is able to get HUVs by converting the non-preference-based Peds QL 4.0 into preference-based CHU-9D scores. It can improve both the efficiency of available clinical data and help decision makers to compare and evaluate relevant interventions, facilitating the development of pharmacoeconomic evaluation.
In accordance with guidance (17), we used six regression models to develop mapping algorithms from Peds QL 4.0 to CHU-9D, including OLS, GLM, MM, Tobit, Beta, and MLOGIT, among which Tobit performed best, followed by Beta. Some studies indicated that indirect mapping could improve the fitting of models compared with direct mapping using linear models (52). In this study, although the sample size was large and the MLOGIT performance was good, we still believed that Tobit or Beta was better. This was mainly due to the lack of dimension level of CHU-9D, which leads to the concentration in some health states. This may lead to an offset in the final result of MLOGIT. In addition, we also found that it could easily lead to fitting abnormalities in MLOGIT fitting process. Therefore, our final results did not use the MLOGIT due to the fact that it requires more comprehensive health state data to prove its accuracy. Furthermore, previous studies had shown that MM was superior to MLOGIT, which was different from our results (19).
In the existing mapping research of Peds QL 4.0, the Peds QL 4.0 total score, the Peds QL 4.0 dimension scores, and the Peds QL 4.0 item scores were often used as independent variables (19–21, 24), as well as some demographic indicators such as age and gender. We screened the independent variables according to the correlation between the variables (see Appendix 1). Some variables that were highly correlated with CHU-9D utility score were directly included as independent variables, for instance, Peds QL 4.0 total score (0.6836), SF (0.6399), and ScF (0.5066). To improve the prediction ability of the model as much as possible, we also screened the variables with low correlation according to the independent variables included in previous studies, such as trying to include gender as an independent variable. In addition, we tried to use the Peds QL 4.0 item scores as independent variables. Due to the large number of Peds QL 4.0 item scores, in order to avoid excessive complexity of the model, we used the stepwise regression method to select Peds QL 4.0 item scores that had a significant correlation with CHU-9D utility value. Finally, the Peds QL 4.0 total score, Peds QL 4.0 dimension scores, Peds QL 4.0 item scores, gender, and age were used as independent variables. We found that when age and gender were used as independent variables, the 10-fold cross-validation and the fitting of the full estimation sample showed different results. In the full estimation sample, the inclusion of age and gender improved the performance of the model. However, in the 10-fold cross-validation, only the model performance of the combination of independent variables based on the Peds QL 4.0 dimension scores was improved. The result was similar to Tosin's research (20). Considering the obvious influence of gender and age on the population HUVs, we propose that it is necessary to include age and gender in the construction of the mapping algorithm, but more research is needed to prove the difference.
This study evaluated the prediction performance of different models in different combinations based on full samples and ranked the model performance based on MAE, RMSE, adj R2, and CCC using the 10-fold cross-validation method. Similar to several other studies, almost all the estimators overestimated the lower bound of the CHU-9D utility score and overpredicted the upper bound of 1 (21, 22). Although overprediction is a difficult problem, some studies have shown that it can be dealt with by truncating or setting the value of the dependent variable between 0 and 1 to the boundary value, such as Tobit model and Beta model (24, 53, 54). Overall, the predictive performance of the Beta model and Tobit model was consistent with the MAE range (0.0408–0.1270) and RMSE range (0.0594–0.1619) observed in the CHU-9D mapping study (19–23).
There are also some limitations in the study. First, although the sample size was large, the sample source was limited to Zhejiang province, which was difficult to represent the level of China. Second, we used the 10-fold cross-validation method to verify the mapping algorithm, but no external validation was performed due to the lack of available data. Third, in the process of data sampling and collection, many samples are concentrated in the lower age group (average age = 7.23), and nearly half of the questionnaires were filled by guardians, which may be related to the factors that children in the lower age group are more likely to receive attention and seek medical treatment in time. However, guardians could hard to understand the real feelings of young people, which may cause agency bias. Fourth, there were some missing CHU-9D dimension levels in the study sample, which may lead to the limited prediction range of the mapping algorithm and the deviation of indirect mapping results (17). Therefore, the model based on indirect mapping was not recommended in the study, and better data were needed to verify in future.
Conclusion
The research first developed a mapping algorithm from Peds QL 4.0 to CHU-9D based on Chinese children and adolescents. We also constructed different mapping algorithms for different combinations of variables, and of all algorithms, the Tobit model with Peds QL 4.0 item scores, gender, and age as the independent variables was the most accurate. However, researchers can reasonably choose mapping algorithms for different combinations of variables based on available data to conduct other studies such as pharmacoeconomic evaluations and provide references for relevant policymakers in China.
Data availability statement
The raw data supporting the conclusions of this article will be made available by the authors, without undue reservation.
Author contributions
QW, CW, and XX made their contributions to the conception and design of the study. QW, YH, and CW made their contributions to the acquisition and analysis of the data. ML and YH made their contributions to the interpretation of data. QW made contributions to the drafting of the study. QW, ML, and XX made their contributions to the revision of the study. All authors of this study has approved the submitted version and has agreed both to be personally accountable for the author's own contributions and ensure that questions related to the accuracy or integrity of any part of the study.
Acknowledgments
We sincerely express our gratitude to all FD patients and their guardians who participated in the study. Without their help, this study would not have been carried out successfully. In addition, we thank the experts and professionals for their suggestions and guidance during the study.
Conflict of interest
The authors declare that the research was conducted in the absence of any commercial or financial relationships that could be construed as a potential conflict of interest.
Publisher's note
All claims expressed in this article are solely those of the authors and do not necessarily represent those of their affiliated organizations, or those of the publisher, the editors and the reviewers. Any product that may be evaluated in this article, or claim that may be made by its manufacturer, is not guaranteed or endorsed by the publisher.
Supplementary material
The Supplementary Material for this article can be found online at: https://www.frontiersin.org/articles/10.3389/fpubh.2023.1166760/full#supplementary-material
References
1. Wei Z, Yang X, Xing X, Dong L, Wang J, Qin B. Risk factors associated with functional dyspepsia in Chinese children: a cross-sectional study. BMC Gastroenterol. (2021) 21:218. doi: 10.1186/s12876-021-01800-x
2. Korterink JJ, Diederen K, Benninga MA, Tabbers MM. Epidemiology of pediatric functional abdominal pain disorders: a meta-analysis. PLoS ONE. (2015) 10:e0126982. doi: 10.1371/journal.pone.0126982
3. Robin SG, Keller C, Zwiener R, Hyman PE, Nurko S, Saps M, et al. Prevalence of pediatric functional gastrointestinal disorders utilizing the rome IV criteria. J Pediatr. (2018) 195:134–9. doi: 10.1016/j.jpeds.2017.12.012
4. The Subspecialty Group of Gastroenterology tSoP, Chinese Medical Association; the Subspecialty Group of Gastroenterology, China Association of Traditional Chinese Medicine Children′s Health and Drug Research Professional Committee; the Editorial Board, Chinese Journal of Pediatrics. Expert consensus on diagnosis and treatment of functional dyspepsia in Chinese children (2022). Chin J Pediatrics. (2022) 60:751–5. doi: 10.3760/cma.j.cn112140-20220417-00339
5. Brook RA, Kleinman NL, Choung RS, Melkonian AK, Smeeding JE, Talley NJ. Functional dyspepsia impacts absenteeism and direct and indirect costs. Clin Gastroenterol Hepatol. (2010) 8:498–503. doi: 10.1016/j.cgh.2010.03.003
6. Rippel SW, Acra S, Correa H, Vaezi M, Di Lorenzo C, Walker LS. Pediatric patients with dyspepsia have chronic symptoms, anxiety, and lower quality of life as adolescents and adults. Gastroenterology. (2012) 142:754–61. doi: 10.1053/j.gastro.2011.12.043
7. Shelby GD, Shirkey KC, Sherman AL, Beck JE, Haman K, Shears AR, et al. Functional abdominal pain in childhood and long-term vulnerability to anxiety disorders. Pediatrics. (2013) 132:475–82. doi: 10.1542/peds.2012-2191
8. Colombo JM, Deacy AD, Schurman JV, Friesen CA. Heartburn in children and adolescents in the presence of functional dyspepsia and/or irritable bowel syndrome correlates with the presence of sleep disturbances, anxiety, and depression. Medicine. (2021) 100:e25426. doi: 10.1097/MD.0000000000025426
9. Chen G, Ratcliffe J. A review of the development and application of generic multi-attribute utility instruments for paediatric populations. Pharmacoeconomics. (2015) 33:1013–28. doi: 10.1007/s40273-015-0286-7
10. Anle S, Shunguo Z, Nan L, Bin W. Agreement of EQ-5D-Y between children with hematological malignancies and their caregivers on quality of life. Chin J Pharmacoepidemiol. (2021) 30:415–20. doi: 10.19960/j.cnki.issn1005-0698.2021.06.011
11. Devanarayana NM, Rajindrajith S, Benninga MA. Quality of life and health care consultation in 13 to 18 year olds with abdominal pain predominant functional gastrointestinal diseases. BMC Gastroenterol. (2014) 14:150. doi: 10.1186/1471-230X-14-150
12. Lewis ML, Palsson OS, Whitehead WE, van Tilburg MAL. Prevalence of functional gastrointestinal disorders in children and adolescents. J Pediatrics. (2016) 177:39–43. doi: 10.1016/j.jpeds.2016.04.008
13. Ranasinghe N, Devanarayana NM, Rajindrajith S, Perera MS, Nishanthinie S, Warnakulasuriya T, et al. Functional gastrointestinal diseases and psychological maladjustment, personality traits and quality of life. BMC Gastroenterol. (2018) 18:33. doi: 10.1186/s12876-018-0760-8
14. Varni JW, Seid M, Knight TS, Uzark K, Szer IS. The PedsQL 4. 0 Generic core scales: sensitivity, responsiveness, and impact on clinical decision-making. J Behav Med. (2002) 25:175–93. doi: 10.1023/A:1014836921812
15. Xu F, Chen G, Stevens K, Zhou H, Qi S, Wang Z, et al. Measuring and valuing health-related quality of life among children and adolescents in mainland China–a pilot study. PLoS ONE. (2014) 9:e89222. doi: 10.1371/journal.pone.0089222
16. Stevens K. Developing a descriptive system for a new preference-based measure of health-related quality of life for children. Qual Life Res. (2009) 18:1105–13. doi: 10.1007/s11136-009-9524-9
17. Wailoo AJ, Hernandez-Alava M, Manca A, Mejia A, Ray J, Crawford B, et al. Mapping to estimate health-state utility from non-preference-based outcome measures: an ISPOR good practices for outcomes research task force report. Value Health. (2017) 20:18–27. doi: 10.1016/j.jval.2016.11.006
18. Longworth L, Rowen D. Mapping to obtain EQ-5D utility values for use in NICE health technology assessments. Value Health. (2013) 16:202–10. doi: 10.1016/j.jval.2012.10.010
19. Mpundu-Kaambwa C, Chen G, Russo R, Stevens K, Petersen KD, Ratcliffe J. Mapping CHU9D Utility Scores from the PedsQL(TM) 4. 0 SF-15. Pharmaco Econ. (2017) 35:453–67. doi: 10.1007/s40273-016-0476-y
20. Lambe T, Frew E, Ives NJ, Woolley RL, Cummins C, Brettell EA, et al. Mapping the paediatric quality of life inventory (PedsQL™) generic core scales onto the child health utility index-9 dimension (CHU-9D) score for economic evaluation in children. Pharmacoeconomics. (2018) 36:451–65. doi: 10.1007/s40273-017-0600-7
21. Sweeney R, Chen G, Gold L, Mensah F, Wake M. Mapping PedsQL(TM) scores onto CHU9D utility scores: estimation, validation and a comparison of alternative instrument versions. Qual Life Res. (2020) 29:639–52. doi: 10.1007/s11136-019-02357-9
22. Kelly CB, Soley-Bori M, Lingam R, Forman J, Cecil L, Newham J, et al. Mapping PedsQL™ scores to CHU9D utility weights for children with chronic conditions in a multi-ethnic and deprived metropolitan population. Qual Life Res. (2023) 23:1–15. doi: 10.1007/s11136-023-03359-4
23. Robinson T, Oluboyede Y. Estimating CHU-9D utility scores from the WAItE: a mapping algorithm for economic evaluation. Value Health. (2019) 22:239–46. doi: 10.1016/j.jval.2018.09.2839
24. Shafie AA, Chhabra IK, Wong JHY, Mohammed NS. Mapping PedsQL™ Generic Core Scales to EQ-5D-3L utility scores in transfusion-dependent thalassemia patients. Eur J Health Econ. (2021) 22:735–47. doi: 10.1007/s10198-021-01287-z
25. Canaway AG, Frew EJ. Measuring preference-based quality of life in children aged 6-7 years: a comparison of the performance of the CHU-9D and EQ-5D-Y–the WAVES pilot study. Qual Life Res. (2013) 22:173–83. doi: 10.1007/s11136-012-0119-5
26. Rasquin A, Di Lorenzo C, Forbes D, Guiraldes E, Hyams JS, Staiano A, et al. Childhood functional gastrointestinal disorders: child/adolescent. Gastroenterology. (2006) 130:1527–37. doi: 10.1053/j.gastro.2005.08.063
27. Chen G, Xu F, Huynh E, Wang Z, Stevens K, Ratcliffe J. Scoring the Child Health Utility 9D instrument: estimation of a Chinese child and adolescent-specific tariff. Qual Life Res. (2019) 28:163–76. doi: 10.1007/s11136-018-2032-z
28. Pei W, Yue S, Zhi-Hao Y, Ruo-Yu Z, Bin W, Nan L. Testing measurement properties of two EQ-5D youth versions and KIDSCREEN-10 in China. Eur J Health Econ. (2021) 22:1083–93. doi: 10.1007/s10198-021-01307-y
29. Wild D, Grove A, Martin M, Eremenco S, McElroy S, Verjee-Lorenz A, et al. Principles of good practice for the translation and cultural adaptation process for patient-reported outcomes (PRO) measures: report of the ispor task force for translation and cultural adaptation. Value Health. (2005) 8:94–104. doi: 10.1111/j.1524-4733.2005.04054.x
30. Ratcliffe J, Couzner L, Flynn T, Sawyer M, Stevens K, Brazier J, et al. Valuing Child Health Utility 9D health states with a young adolescent sample: a feasibility study to compare best-worst scaling discrete-choice experiment, standard gamble and time trade-off methods. Appl Health Econ Health Policy. (2011) 9:15–27. doi: 10.2165/11536960-000000000-00000
31. Guillemin F, Bombardier C, Beaton D. Cross-cultural adaptation of health-related quality of life measures: literature review and proposed guidelines. J Clin Epidemiol. (1993) 46:1417–32. doi: 10.1016/0895-4356(93)90142-N
32. Acquadro C, Conway K, Hareendran A, Aaronson N. Literature review of methods to translate health-related quality of life questionnaires for use in multinational clinical trials. Value Health. (2008) 11:509–21. doi: 10.1111/j.1524-4733.2007.00292.x
33. Yi-Yun L, Qi T, Yuan T, Jin J, Yu-Deng L, Ding-Qun H. Reliability and validity for chinese version of pediatric quality of life inventory PedsQL4. 0. J Sun Yat-sen Univ. (2008) 328:31.
34. Wu HH Li H, Gao Q. Psychometric properties of the Chinese version of the pediatric quality of life inventory 4. 0 Generic core scales among children with short stature. Health Qual Life Outcomes. (2013) 11:87. doi: 10.1186/1477-7525-11-87
35. Hao Y, Tian Q, Lu Y, Chai Y, Rao S. Psychometric properties of the chinese version of the pediatric quality of life inventory 4. Int J Quality Life Aspects Treatment Rehab. (2010) 19:1229–33. doi: 10.1007/s11136-010-9672-y
36. Petrou S, Rivero-Arias O, Dakin H, Longworth L, Oppe M, Froud R, et al. The MAPS reporting statement for studies mapping onto generic preference-based outcome measures: explanation and elaboration. Pharmacoeconomics. (2015) 33:993–1011. doi: 10.1007/s40273-015-0312-9
37. Round J, Hawton A. Statistical alchemy: conceptual validity and mapping to generate health state utility values. PharmacoEconomics. (2017) 1:233–9. doi: 10.1007/s41669-017-0027-2
38. Vilsbøll AW, Kragh N, Hahn-Pedersen J, Jensen CE. Mapping dermatology life quality index (DLQI) scores to EQ-5D utility scores using data of patients with atopic dermatitis from the national health and wellness study. Qual Life Res. (2020) 29:2529–39. doi: 10.1007/s11136-020-02499-1
39. The British Medical Journal. Correlation and Regression. (2018). Available online at: https://www.bmj.com/about-bmj/resources-readers/publications/statistics-square-one/11-correlation-and-regression (accessed February 2,2023).
40. Brazier JE, Yang Y, Tsuchiya A, Rowen DL, A. review of studies mapping (or cross walking) non-preference based measures of health to generic preference-based measures. Eur J Health Econ. (2010) 11:215–25. doi: 10.1007/s10198-009-0168-z
41. Hernández Alava M, Wailoo AJ, Ara R. Tails from the peak district: adjusted limited dependent variable mixture models of EQ-5D questionnaire health state utility values. Value Health. (2012) 15:550–61. doi: 10.1016/j.jval.2011.12.014
42. Longworth L, Yang Y, Young T, Mulhern B, Hernández Alava M, Mukuria C, et al. Use of generic and condition-specific measures of health-related quality of life in NICE decision-making: a systematic review, statistical modelling and survey. Health Technol Assessm. (2014) 18:1–224. doi: 10.3310/hta18090
43. Yang F, Wong CKH, Luo N, Piercy J, Moon R, Jackson J. Mapping the kidney disease quality of life 36-item short form survey (KDQOL-36) to the EQ-5D-3L and the EQ-5D-5L in patients undergoing dialysis. Eur J Health Econ. (2019) 20:1195–206. doi: 10.1007/s10198-019-01088-5
44. Lamu AN, Olsen JA. Testing alternative regression models to predict utilities: mapping the QLQ-C30 onto the EQ-5D-5L and the SF-6D. Qual Life Res. (2018) 27:2823–39. doi: 10.1007/s11136-018-1981-6
45. Xu RH, Dong D, Luo N, Wong EL, Yang R, Liu J, et al. Mapping the Haem-A-QoL to the EQ-5D-5L in patients with hemophilia. Qual Life Res. (2022) 31:1533–44. doi: 10.1007/s11136-021-03051-5
46. Verardi V, Croux C. Robust regression in stata. Stata J. (2008) 9:439–53. doi: 10.1177/1536867X0900900306
47. Hawton A, Green C, Telford C, Zajicek J, Wright D. Using the Multiple Sclerosis Impact Scale to estimate health state utility values: mapping from the MSIS-29, version 2, to the EQ-5D and the SF-6D. Value Health. (2012) 15:1084–91. doi: 10.1016/j.jval.2012.07.007
48. Sullivan PW, Ghushchyan V. Mapping the EQ-5D index from the SF-12: US general population preferences in a nationally representative sample. Med Decis Making. (2006) 26:401–9. doi: 10.1177/0272989X06290496
49. Basu A, Manca A. Regression estimators for generic health-related quality of life and quality-adjusted life years. Med Decis Making. (2012) 32:56–69. doi: 10.1177/0272989X11416988
50. Hunger M, Döring A, Holle R. Longitudinal beta regression models for analyzing health-related quality of life scores over time. BMC Med Res Methodol. (2012) 12:144. doi: 10.1186/1471-2288-12-144
51. Shcherbakov M, Brebels A, Shcherbakova NL, Tyukov A, Janovsky TA, Kamaev VA, et al. A survey of forecast error measures. World Appl Sci J. (2013) 24:171–6. doi: 10.5829/idosi.wasj.2013.24.itmies.80032
52. Hernández Alava M, Wailoo A, Wolfe F, Michaud K, A. comparison of direct and indirect methods for the estimation of health utilities from clinical outcomes. Med Decis Making. (2014) 34:919–30. doi: 10.1177/0272989X13500720
53. Liu T, Li S, Wang M, Sun Q, Chen G. Mapping the Chinese version of the EORTC QLQ-BR53 onto the EQ-5D-5L and SF-6D utility scores. Patient. (2020) 13:537–55. doi: 10.1007/s40271-020-00422-x
Keywords: mapping, CHU-9D, Peds QL 4.0, health utility value, functional dyspepsia
Citation: Wang Q, Wan C, Li M, Huang Y and Xi X (2023) Mapping the Peds QLTM 4.0 onto CHU-9D: a cross-sectional study in functional dyspepsia population from China. Front. Public Health 11:1166760. doi: 10.3389/fpubh.2023.1166760
Received: 15 February 2023; Accepted: 30 March 2023;
Published: 31 May 2023.
Edited by:
Pei Wang, Fudan University, ChinaReviewed by:
Arlette Setiawan, Padjadjaran University, IndonesiaXin Li, Nanjing Medical University, China
Shunping Li, Shandong University, China
Copyright © 2023 Wang, Wan, Li, Huang and Xi. This is an open-access article distributed under the terms of the Creative Commons Attribution License (CC BY). The use, distribution or reproduction in other forums is permitted, provided the original author(s) and the copyright owner(s) are credited and that the original publication in this journal is cited, in accordance with accepted academic practice. No use, distribution or reproduction is permitted which does not comply with these terms.
*Correspondence: Xiaoyu Xi, eGl4eUBjcHUuZWR1LmNu
†These authors have contributed equally to this work and share first authorship