 Chaibo Jose Armando1*
 Joacim Rocklöv1,2
 Mohsin Sidat3
 Yesim Tozan4Alberto Francisco Mavume5Aditi Bunker6,7
 Maquins Odhiambo Sewes1,7
- 1Department of Public Health and Clinical Medicine, Sustainable Health Section, Umeå University, Umeå, Sweden
- 2Heidelberg Institute of Global Health and Interdisciplinary Centre for Scientific Computing, Heidelberg University, Heidelberg, Germany
- 3Faculty of Medicine, Eduardo Mondlane University, Maputo, Mozambique
- 4School of Global Public Health, New York University, New York, NY, United States
- 5Faculty of Science, Eduardo Mondlane University, Maputo, Mozambique
- 6Center for Climate, Health, and the Global Environment, Harvard T.H. Chan School of Public Health, Boston, MA, United States
- 7Heidelberg Institute of Global Health, University of Heidelberg, Heidelberg, Germany
Background: Temperature, precipitation, relative humidity (RH), and Normalized Different Vegetation Index (NDVI), influence malaria transmission dynamics. However, an understanding of interactions between socioeconomic indicators, environmental factors and malaria incidence can help design interventions to alleviate the high burden of malaria infections on vulnerable populations. Our study thus aimed to investigate the socioeconomic and climatological factors influencing spatial and temporal variability of malaria infections in Mozambique.
Methods: We used monthly malaria cases from 2016 to 2018 at the district level. We developed an hierarchical spatial–temporal model in a Bayesian framework. Monthly malaria cases were assumed to follow a negative binomial distribution. We used integrated nested Laplace approximation (INLA) in R for Bayesian inference and distributed lag nonlinear modeling (DLNM) framework to explore exposure-response relationships between climate variables and risk of malaria infection in Mozambique, while adjusting for socioeconomic factors.
Results: A total of 19,948,295 malaria cases were reported between 2016 and 2018 in Mozambique. Malaria risk increased with higher monthly mean temperatures between 20 and 29°C, at mean temperature of 25°C, the risk of malaria was 3.45 times higher (RR 3.45 [95%CI: 2.37–5.03]). Malaria risk was greatest for NDVI above 0.22. The risk of malaria was 1.34 times higher (1.34 [1.01–1.79]) at monthly RH of 55%. Malaria risk reduced by 26.1%, for total monthly precipitation of 480 mm (0.739 [95%CI: 0.61–0.90]) at lag 2 months, while for lower total monthly precipitation of 10 mm, the risk of malaria was 1.87 times higher (1.87 [1.30–2.69]). After adjusting for climate variables, having lower level of education significantly increased malaria risk (1.034 [1.014–1.054]) and having electricity (0.979 [0.967–0.992]) and sharing toilet facilities (0.957 [0.924–0.991]) significantly reduced malaria risk.
Conclusion: Our current study identified lag patterns and association between climate variables and malaria incidence in Mozambique. Extremes in climate variables were associated with an increased risk of malaria transmission, peaks in transmission were varied. Our findings provide insights for designing early warning, prevention, and control strategies to minimize seasonal malaria surges and associated infections in Mozambique a region where Malaria causes substantial burden from illness and deaths.
1. Introduction
Malaria is a critical public health problem in sub-Saharan Africa causing significant morbidity and mortality (1), especially among children under 5 years (2, 3), pregnant women (4, 5), HIV infected individuals (6), low socioeconomic households (5, 7–13), households without access to Insecticide-treated nets (ITNs) (14) and non-compliant users of ITNs (5). Mozambique has high rates of under-five malaria mortality (7, 15) and is the fourth out of six countries that accounted for more than half of all malaria cases and deaths worldwide in 2019, corresponding to 4% of the global burden of cases and deaths (1). The country had the second highest prevalence of malaria in Eastern and Southern Africa, estimated at 17.2% in 2019 (1). Malaria is endemic in Mozambique, and the entire population is at risk (16, 17). In 2020, Malaria was estimated to account for approximately 26% of all outpatient consultations with over 11 million cases diagnosed in public health facilities and communities (18). Frequent natural disasters have likely contributed to increases in malaria transmission in recent years (19).
Malaria cases are rising in Mozambique and regional differences exist. For example, Gaza province, Maputo province, and Maputo City have reported reductions in cases, in contrast to increases in Manica, Cabo Delgado, Zambezia, and Nampula provinces. The national malaria incidence was estimated at 368 cases per 1,000 population in 2020 (18). Malaria prevalence in rural areas was double relative to urban areas (20). The 2018 Malaria Indicator Survey (MIS) showed considerable variation in average malaria prevalence among children under 5 years at the provincial and country wide levels at 1–57, and 39%, respectively (21). Several factors affect malaria transmission dynamics, from climatic conditions to social-economic factors (8, 22, 23). Climatic factors such as temperature and precipitation affect the life cycle and breeding of mosquito vectors that transmit malaria (22). The predominant malaria vector species are Anopheles gambiae and Anopheles funestus in Mozambique—accounting for 90% of all malarial infections (7). Malaria transmission varies significantly depending on the natural environment, climatic conditions, locally dominant malaria vector species, and structural vulnerability factors including behavioral, social, economic conditions and malaria control interventions (24).
Preventive measures including ITNs, prophylactic antimalarial drugs and indoor residual spraying (IRS) are used in Mozambique to curb malaria infections. Mozambique’s 2017–2021 National Malaria Strategic Plan aims to provide at least 85% of the population with adequate protection against malaria which includes provision of testing to all suspected cases, treatment to all confirmed cases according to existing national malaria treatment guidelines (21). Targets have been set for malaria elimination in areas of low and very low transmission through appropriate interventions (25).
Mozambique is geographically prone to natural disasters and highly vulnerable to climate change. Increased frequency and intensity of extreme weather events over the past 60 years has increased population susceptibility to malaria infection (26). The coolest months fall between June to August, and the dry season occurs between May to October (27, 28). The warmest and wettest months range from December to February, when malaria transmission is the highest (29, 30). Precipitation anomalies occur on different spatial and temporal scales with varying intensity and frequency, providing suitable breeding sites for malaria vectors. Temperature affects the development of anopheles mosquitoes and their biting rates (22). Precipitation and temperature variation over the country are affected by weather patterns at the South Indian Convergence Zone (31), Intertropical Convergence Zone (30, 31), subtropical high-pressure systems, and semi-permanent anticyclones, namely the Mascarene High and St. Helena tropical cyclones (27, 32–34), El-Niño-Southern-Oscillation (ENSO), and Indian Ocean Dipole (IOD) among others (35–37). These factors are associated with above or below normal precipitation or temperatures and affect malaria morbidity through effects on transmission dynamics (29, 30, 38–41).
Our current study investigated factors influencing the spatial and temporal variation in malaria transmission in Mozambique by leveraging socioeconomic, climatic and land use data. We sought to identify malaria vulnerability indicators, and the lag times between climate events and the highest risk of malaria transmission to inform development of a malaria early warning system in Mozambique.
2. Materials and methods
2.1. Setting
Mozambique is positioned at longitudes 30.12° and 40.51° East and latitudes 10.27° and 26.52° South (Figure 1) covering an area of 783,000 km2 of which 4,500 km2 is designated as a maritime area with a coastline stretching 2,700 km (26).
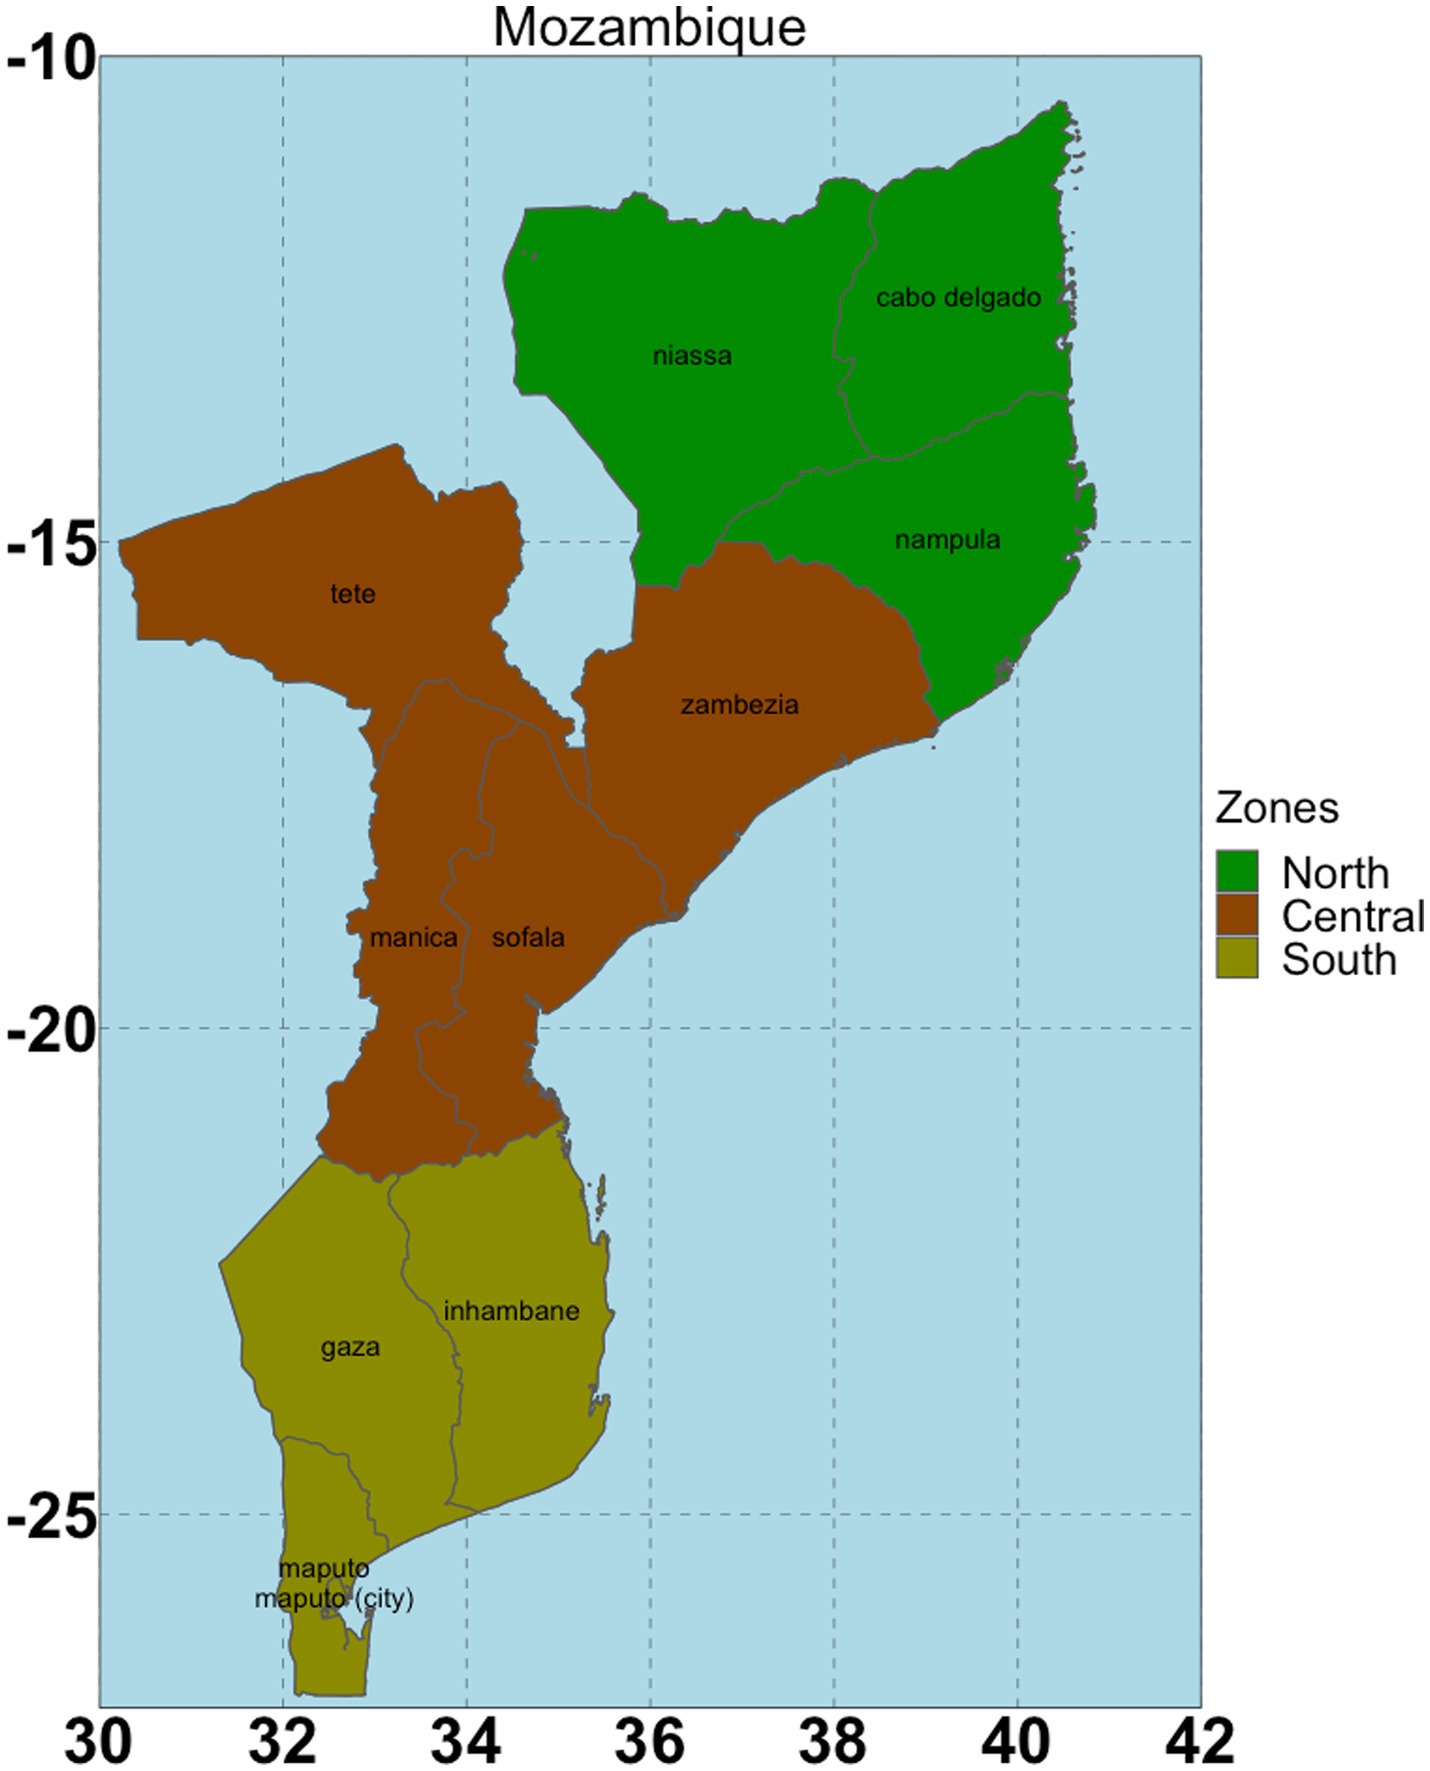
Figure 1. The study area with three geopolitical zones (North, Central and South).
Mozambique has a population of approximately 30 million people, with <60% living in coastal areas including lowlands with sandy beaches, estuaries, and mangroves (26). The AR6 Intergovernmental panel on climate change (IPCC), in its report assessed that climate change will adversely affect the health of people in coastal regions (42), owing to their dependence on local resources such as rain-fed farming and fishing.
2.2. Data and model
We used data on weekly malaria cases from the Mozambique Ministry of Health disease surveillance system (43), between 2016 and 2018. Weekly malaria incidence data were first aggregated to monthly temporal resolution for 159 districts, and then combined. Socio-economic data were extracted from the 2015 DHS and 2018 MIS- both nationally representative population-based household surveys (20). Variables from the MIS and DHS surveys with known association to malaria transmission were included considering their availability and the extent of missing values.
We included the following variables from DHS: wealth index derived from household asset ownership, number of children under five, type of residence, ITN use and ownership, indoor residual spraying, type of toilet facilities, radio, mobile and television ownership, housing conditions, number of sleeping rooms, sharing of toilet with other households, number of households sharing toilet, number of mosquito bed nets, mother’s education level, doctor to population ratio, and number of health facilities per population. DHS and MIS variables were aggregated from individual to district level by computing proportions of selected variable level (Supplementary Table S5).
We retrieved daily climate data including precipitation, minimum and maximum temperature ( and ), relative humidity (RH), and Normalized Different Vegetation Index (NDVI) from NCEP-reanalysis II (44) with a spatial resolution of 0.25° × 0.25° (45) from 2016 to 2018, and aggregated to monthly temporal resolution. Means were computed for , , RH, and NDVI, and cumulative totals for precipitation. We used gridded population data from WorldPop (46) as the denominator in computation of malaria incidence rates.
Each climate variable was included as a non-linear term in the model. We computed crossbasis functions following the distributed lag non-linear methodology developed by Gasparrini et al. (47). This is a flexible approach that allows simultaneous modeling of the lag and exposure-response relationships of the variables. The cross-basis for the lag and nonlinear dimensions were modeled using natural cubic splines with equally spaced knots. We considered lags up to 6 months (48). Centering values were chosen through graphical analysis of exposure response relationship, and risk comparisons are based on these reference values. The chosen reference values for , NDVI, RH and Precipitation were 18°C, 0.2, 70% and 120 mm, respectively.
Using a Bayesian disease mapping approach, we accounted for spatial dependence among neighboring districts in Mozambique. The Bayesian model consisted of three components; the data model (distribution of data given the parameters), the process model (underlying spatial patterns), and the parameter model (prior specification of the model parameters) (49, 50). We assumed—in the data model—that malaria cases followed a negative binomial distribution, used to account for overdispersion in data (48).
We implemented the spatio-temporal extension of the spatial Besag-York-Mollie (BYM) model for the spatial process, which is the Conditional Auto-Regressive (CAR) convolution model with two random effects, one spatially structured and one unstructured random effect (51, 52).
2.3. Model selection
The DHS variables were included one at a time in the base model, controlling for spatial and temporal covariance. The significant variables based on the 95% credible interval were then included in a joint multivariate model. Backward elimination was used to select the DHS variables that were included in the final model.
Selected DHS variables were combined with environmental crossbasis terms as the final model specification (Equation 1). Relative risks (RR) were predicted for different values of climate variables.
where represents the malaria cases; the intercept; the spatially-structured random effect (for smoothing among adjacent areas), the set of neighboring districts, and the number of neighboring districts for a specific district i; the unstructured random effect component, which was modeled using as a Gaussian process and which allowed for extra heterogeneity in malaria case counts due to unobserved (and spatially unstructured) risk factors; the temporally structured effect of the month, was modeled dynamically using a random walk of order 1 (RW1) to capture the seasonal patterns; is the crossbasis function of climatic variable t and its lag dimension with vardf and lagdf degrees of freedom, respectively, controlling for the kth socio-demographic covariate, with coefficient
A Bayesian approach is attractive for modeling complex longitudinal count data but requires specification of the prior distributions for all the random elements of the model. In the case of hierarchical models, this involves choosing priors for the regression coefficients and the hyperparameters. Two classes of prior distributions, informative and non-informative, are typically used in Bayesian modeling. While informative prior distributions are used when substantial information on the model parameters is available from previous studies, non-informative prior distributions facilitate Bayesian inference when little is known about the parameters beyond the data included in the analysis (53). In this analysis, we used default prior specifications in INLA.
We used Integrated Nested Laplace Approximation (INLA) in R for Bayesian inference (50). INLA is a deterministic algorithm for Bayesian inference and designed for latent Gaussian models and spatial models. Bayesian estimation using the INLA methodology takes much less time than standard Bayesian computations methods using Markov Chain Monte Carlo Methods (MCMC) (54, 55).
3. Results
3.1. Malaria cases and environmental variables
A total of 19,948,295 malaria cases were reported in Mozambique between 2016 and 2018. The reported malaria incidence rates were 189.3, 259.2, and 252.2 per 1,000 population in the years 2016, 2017, and 2018, respectively. The mean malaria caseload across the country was 554,119 per year over this period. The year 2018 had the highest national average of 614,083 cases per year, as shown in Table 1.
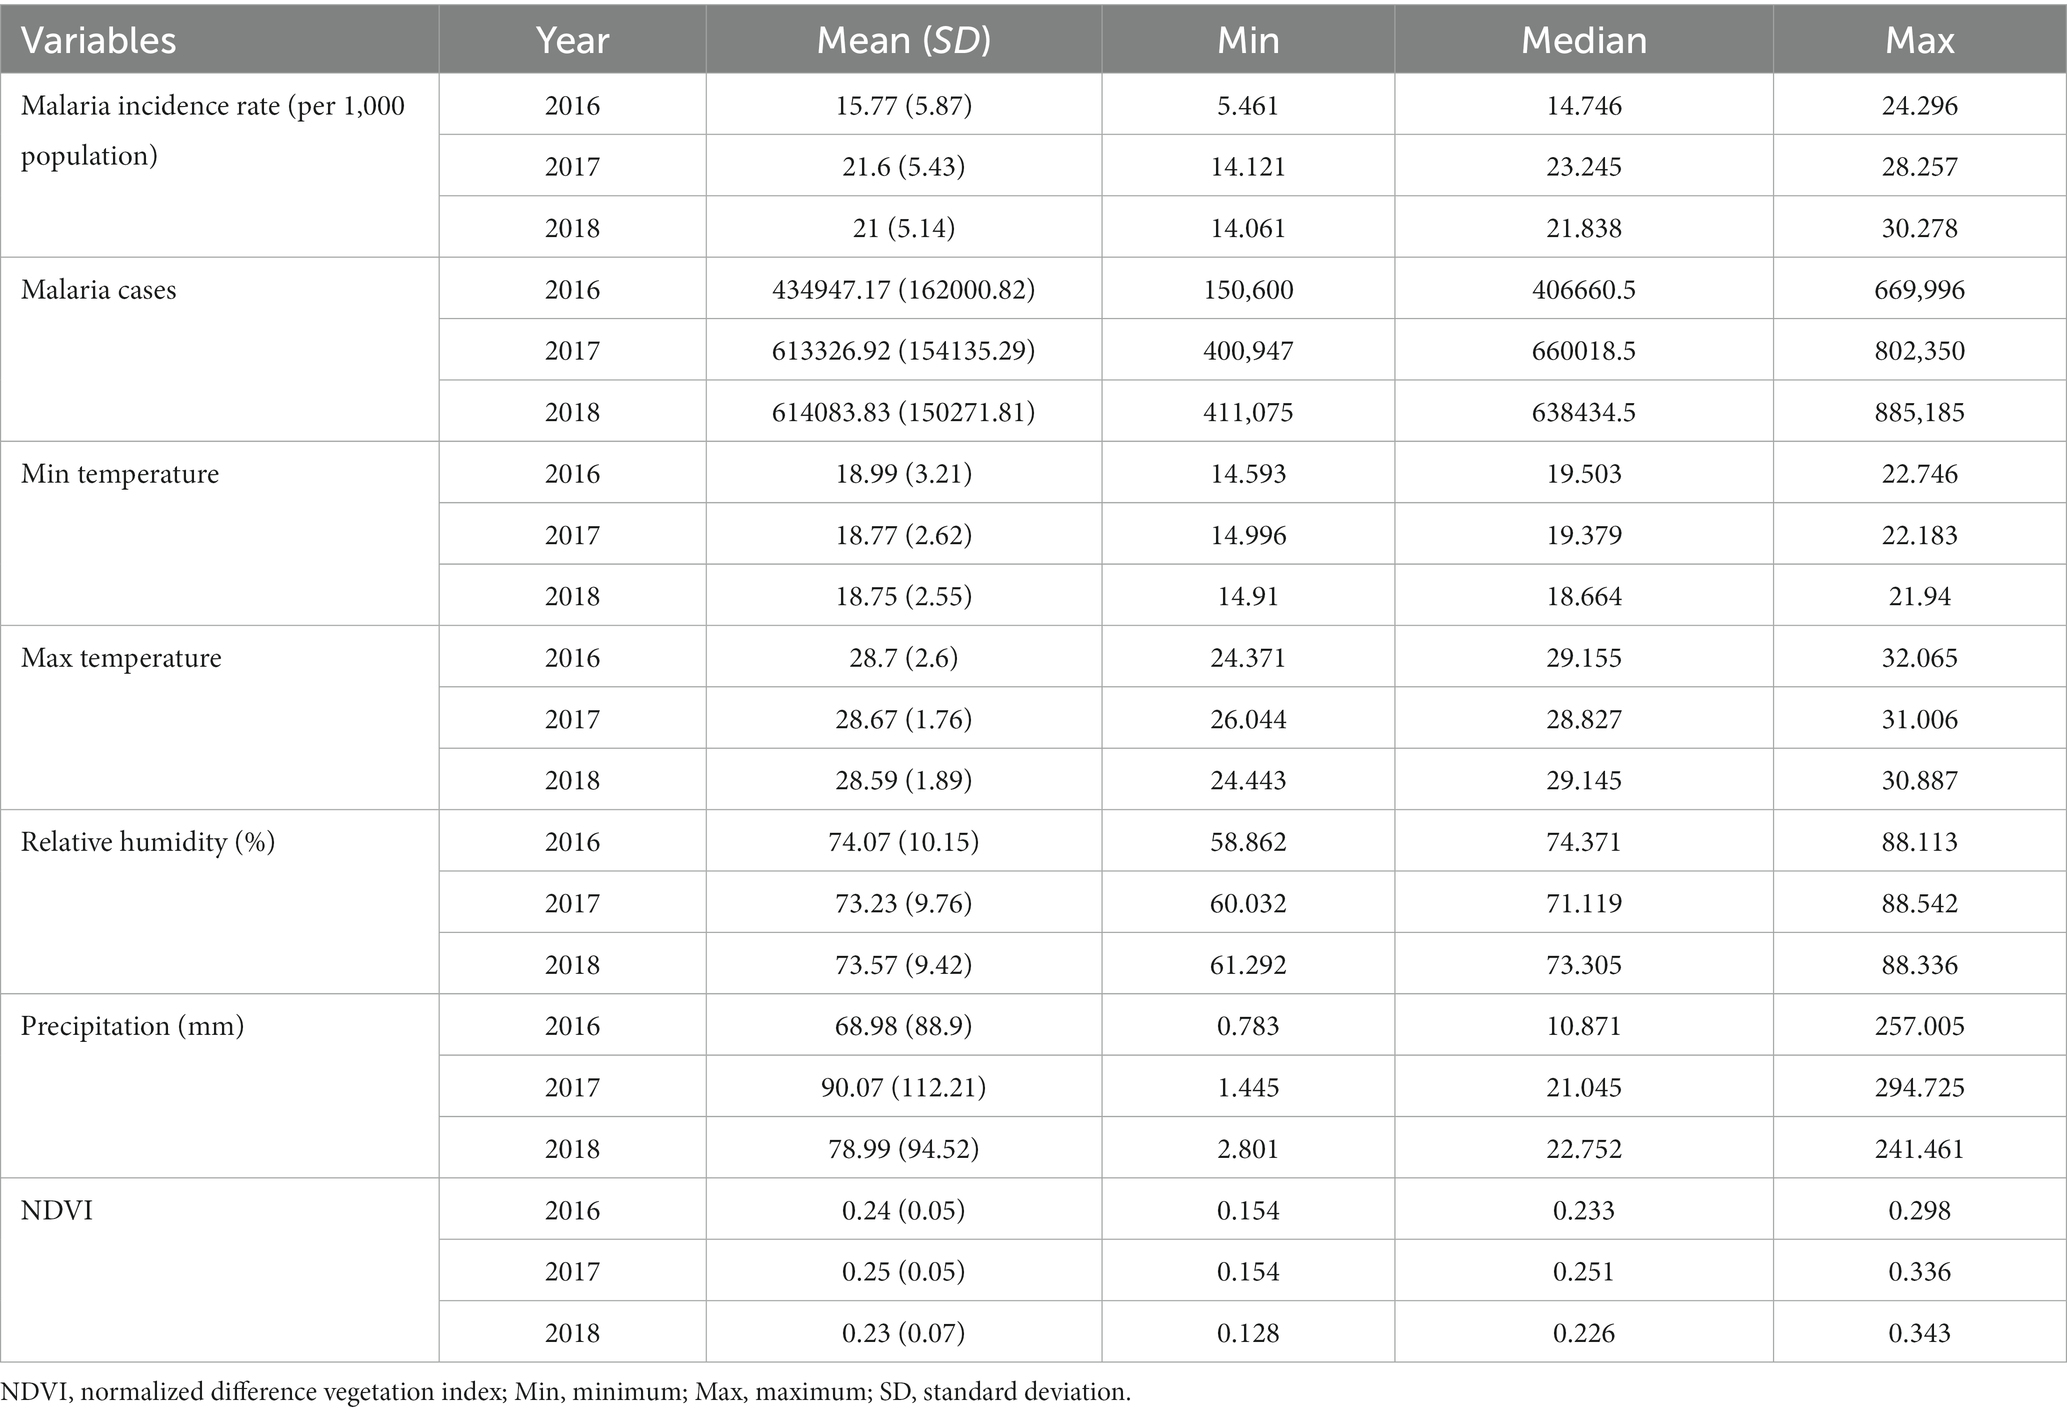
Table 1. Summary of (annual monthly) malaria cases and environmental variables, Mozambique, 2016–2018.
Over the study period, temperature varied slightly in the study area with a mean maximum temperature of 29°C and a mean minimum temperature of 19°C. The mean annual precipitation across the country were 827, 1,080, and 952 mm in the years 2016, 2017, and 2018, respectively (Supplementary Table S1). The mean monthly concentration of green vegetation varied less across the years ranging from 0.23 to 0.25, with the highest mean monthly NDVI of 0.25 recorded in 2017 (Table 1).
During the study period between 2016 and 2018, annual mean maximum and minimum temperatures varied from 24.3 to 32°C, and 14.5 to 22.7°C, respectively (Supplementary Table S1), while the annual monthly mean average temperature ranged between 19.5 and 26.8°C (Supplementary Table S1). The annual average temperature steadily decreased from coastal areas into the inland. The coldest temperatures were observed in Manica and Niassa provinces (Figure 2), probably due to the prevailing winds of the western areas bringing cold air mass from the orographic areas during the warm half-year from November to April. The warmest temperatures were observed from December to March across the country with a peak in December (Supplementary Figures S2, S5–S7), while the coldest temperatures were recorded between June and July (Supplementary Figures S2, S5–S7).
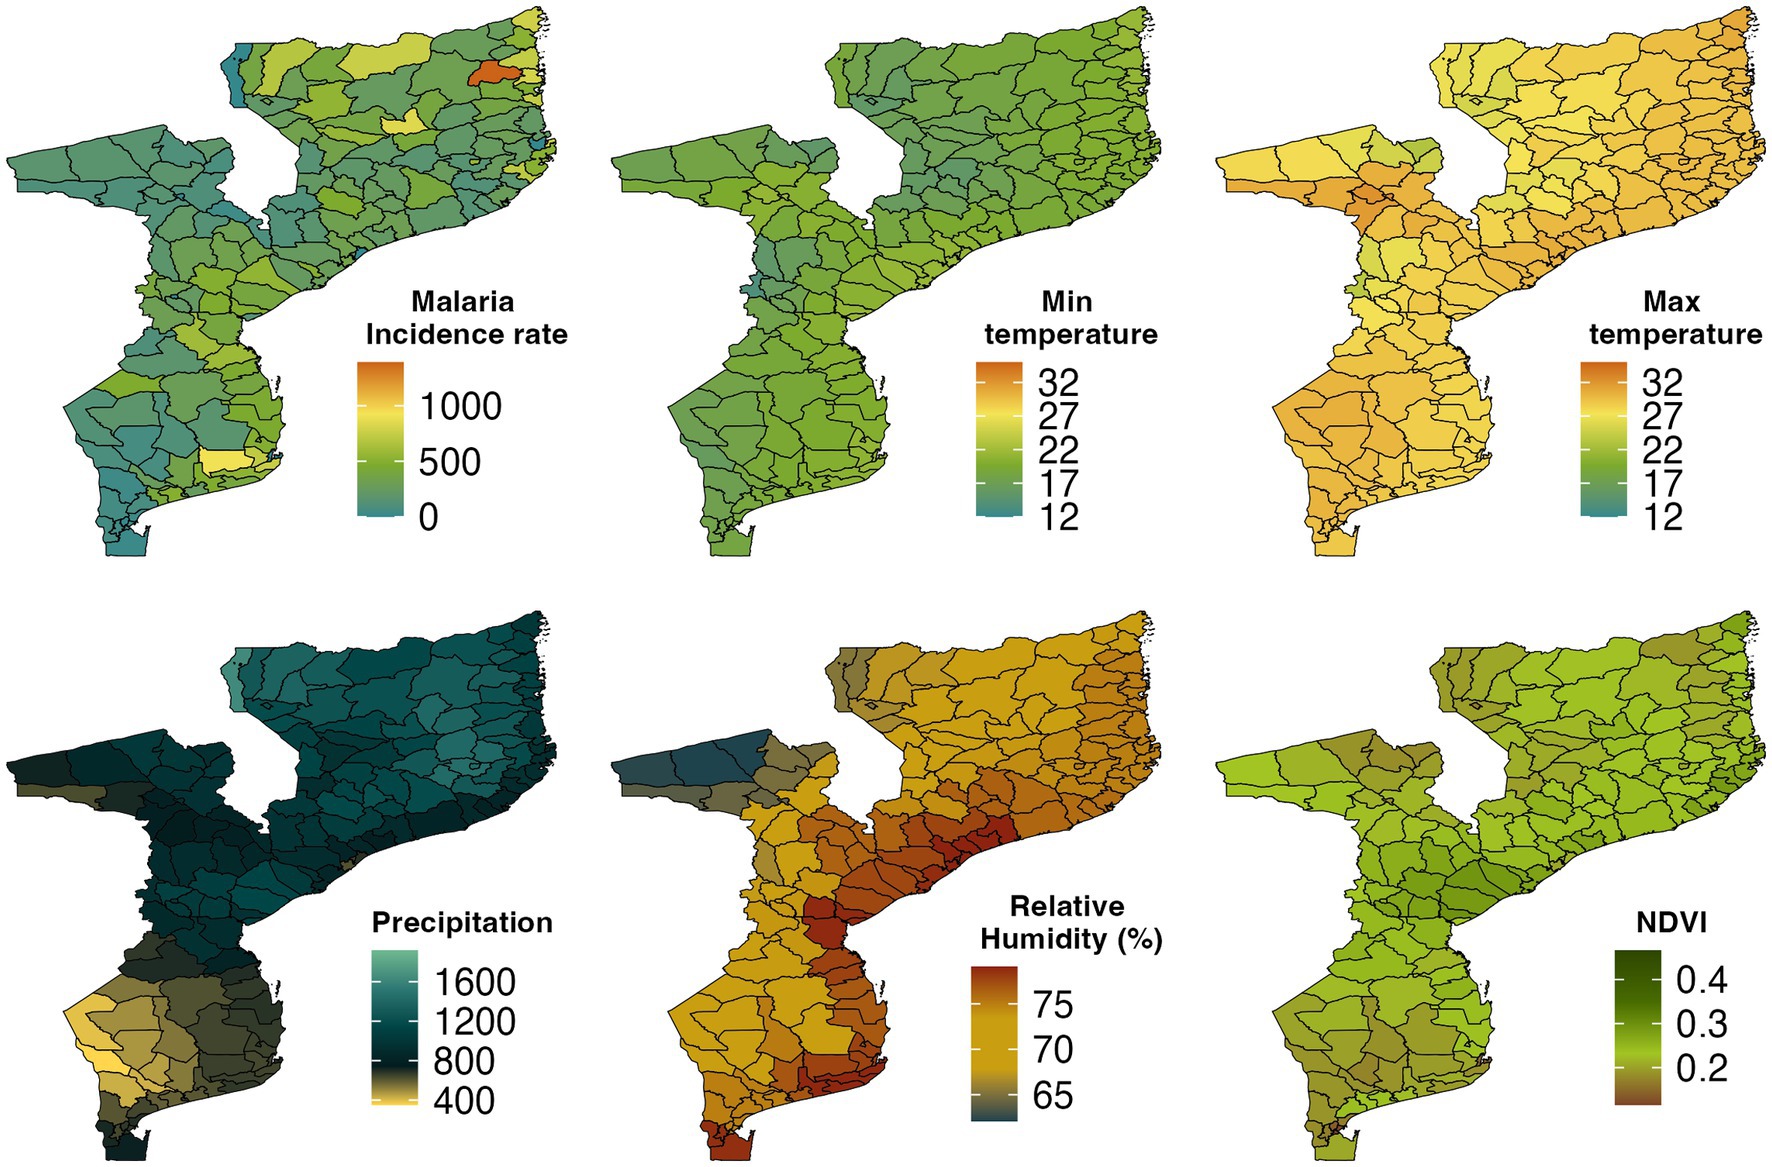
Figure 2. Spatial distribution of malaria incidence rate per 1,000 population, Minimum temperature, Maximum temperature, Precipitation, Relative humidity, and Normalized difference vegetation index (NDVI) by district in Mozambique, 2016–2018.
As shown in Figure 2, the southern part of Mozambique received lower precipitation from 2016 to 2018 while the central and northern parts of the country averaged a higher annual precipitation. The monthly spatial climatology of precipitation over Mozambique in 2018 showed that the highest amount of precipitation was recorded in January followed by February (Supplementary Figure S10). The driest months were June, July, and August during which the entire country received less than 50 mm precipitation.
The monthly mean NDVI ranged from 0.13 to 0.34 between 2016 and 2018 (Supplementary Table S1). In Figure 2, we observed that Central province and some parts of Inhambane, Gaza, and Nampula provinces had the highest NDVI, while the southern and northern parts of the country had the lowest NDVI. Manica and Sofala provinces were the greenest areas followed by Zambezia, Inhambane, and Tete provinces whereas the least green areas were Cabo Delgado, Niassa, Gaza, Maputo City, and Maputo provinces. The southwest corner of the country had an NDVI less than 0.2 between June and August and in the northeast part of the study area between September and October.
We also examined RH over Mozambique (Figure 2). In the southern, central, and northern parts of the country, RH was above 74% in 2018, while in Niassa, Tete, Manica, and Gaza provinces, it was below 74%. Figure 2 shows that RH decreased from coastal areas to the inland. The monthly mean RH during the period from December to April was over 80% in most areas over the country (Supplementary Figure S8).
3.2. Descriptive summaries for DHS socio-economic indicators
The description of the household-level DHS indicators, which were aggregated to district level for the analysis, are given in Supplementary Table S6. About 78.0% of the households were located in rural areas within the districts. The mean proportion of households characterized as poor was 46.2% with some districts registering as high as 96.4% of households as poor. About 20.8 and 35.6% of the households had electricity and radio, respectively. However, mobile phone ownership was high at 62%. The average proportion of households reporting no education was low at 26.8%, though some districts reported as high as 92.3%. In terms of malaria control, 89.4% of the households reported having mosquito nets, although the proportion of dwellings sprayed in the last 12 months was low at 14.1%, with few children reported to be sleeping under ITNs at only 2%.
3.3. Model results
3.3.1. Temperature
Figure 3A displays the overall relationship between mean monthly temperature and malaria risk in Mozambique. We observed an elevated risk for temperatures values between 20 and 29°C compared to the reference of 18°C; for example, at temperature value of 25°C malaria risk was 3.45 times higher (RR 3.45 [95% CI: 2.37–5.03]) compared to the reference. At higher mean temperatures, malaria risk plummeted, and temperature even became protective; for example, at 30°C, malaria infection risk reduced by up to 52% (RR 0.48 [95% CI: 0.26–0.89]). We also observed an increasing relative risk of malaria for temperatures below the reference value. Figure 3B shows the contour plot depicting the lag-response relationship between mean temperature and relative risk of malaria. For temperature between 21 and 26°C, the relative risk of malaria was higher at shorter lags of 1–3 months. At a monthly mean temperature of 26°C, malaria risk was 12.2% higher at a lag of 1 month (RR 1.12 [95% CI: 1.03–1.22]). The protective effect of higher temperatures occurred at much shorter lags.
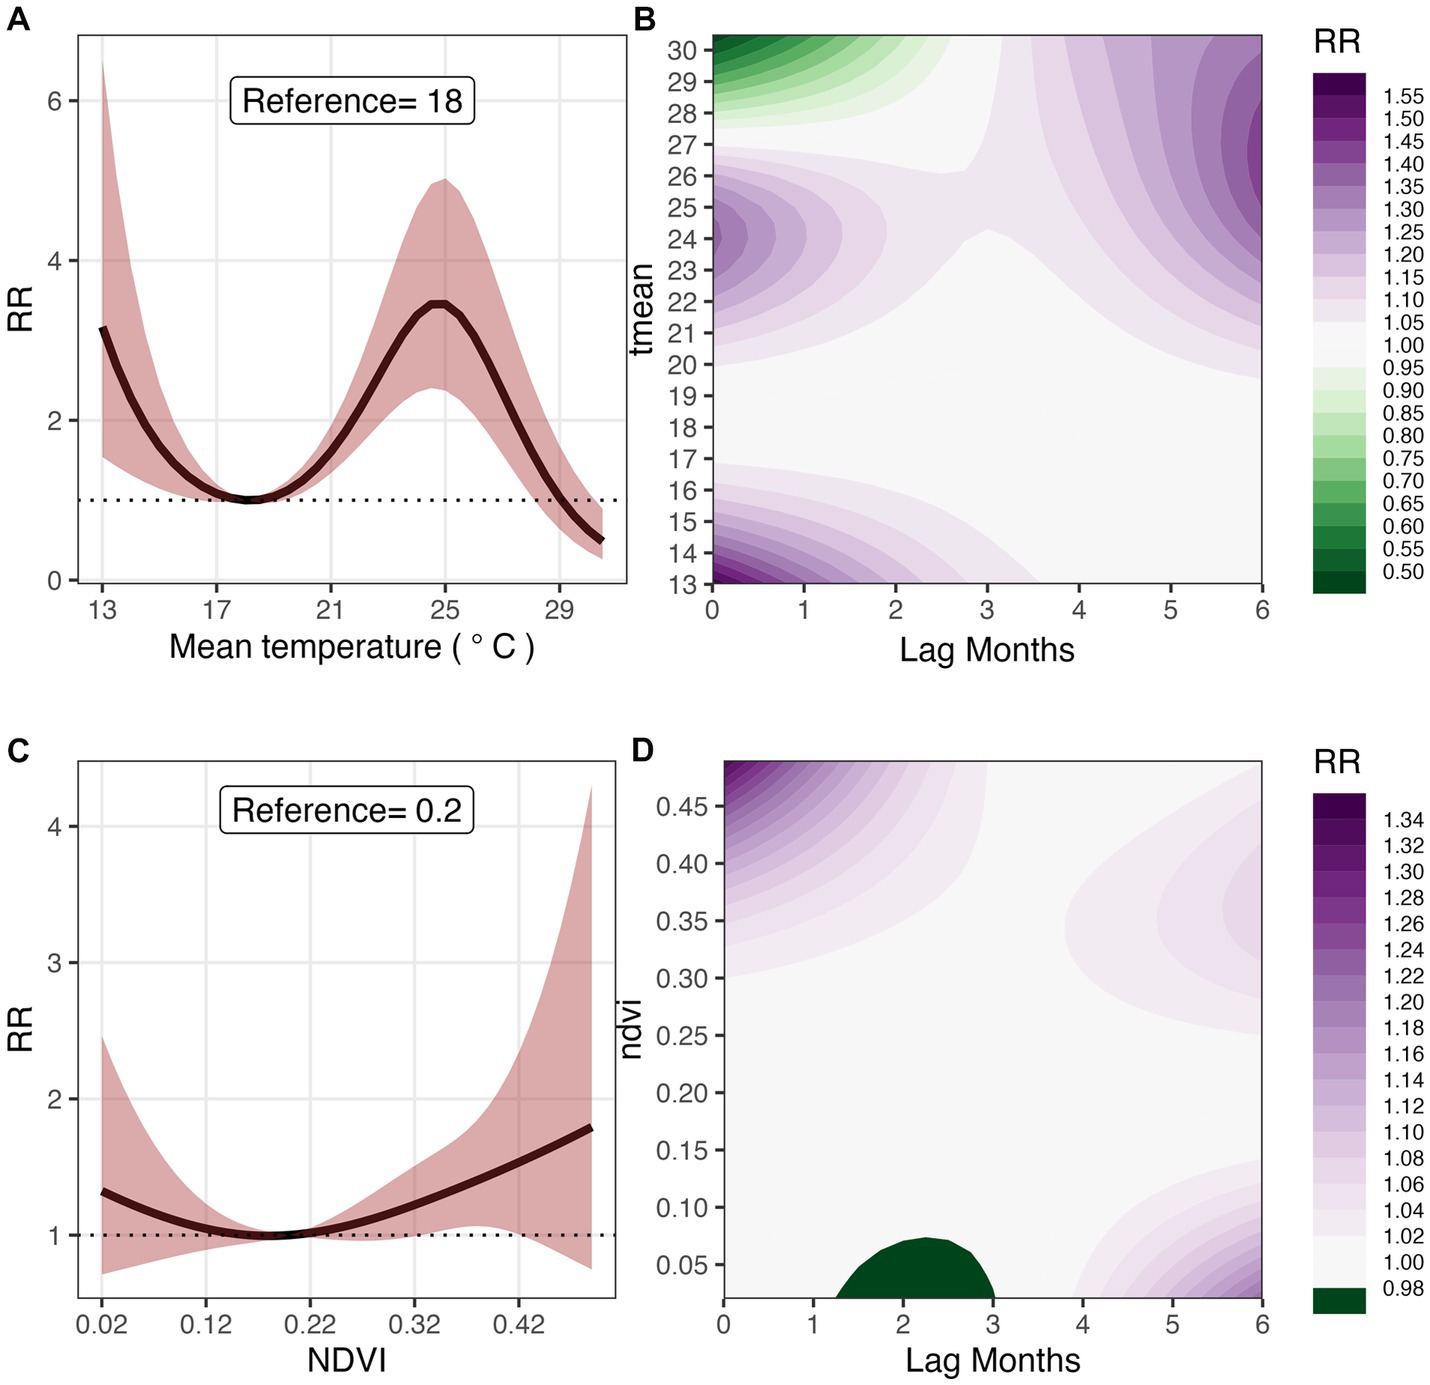
Figure 3. Overall effect and 3D Contour plots of T mean (A,B), and NDVI (C,D) on malaria risk at lags 0–6 months in Mozambique, 2016–2018. The reference values for T mean and NDVI, are 18°C and 0.2 respectively.
3.3.2. Normalized difference vegetation index (NDVI)
Figure 3C shows the exposure-response relationship between NDVI and malaria risk. Compared to the reference value of 0.2, malaria risk was significantly higher for NDVI above 0.22. Specifically, at a monthly mean NDVI of 0.34, malaria risk was 28.0% higher (RR 1.28 [95% CI: 1.02–1.60]), and at 0.42, it was 53.5% higher (RR 1.53 [95% CI: 1.01–2.34]). Figure 3D shows the lag-response relationship between NDVI and malaria risk. At NDVI above 0.3, we observed significantly shorter lag patterns; for example, at NVDI of 0.49, malaria risk was the highest (19.9%) at one-month lag (RR 1.199 [95% CI: 1.02–1.41]). A significantly higher risk is observed at a lag of 5 months for an NDVI of 0.32 (RR 1.04 [95% CI: 1.00–1.08]).
3.3.3. Relative humidity
In Figure 4A, the exposure-response relationship between RH and malaria risk is shown. In comparison to the reference value of 70.0% for RH, malaria risk was the highest (34.3%) at 55% (RR 1.34 [95% CI: 1.01–1.79]). For RH greater than the reference value, we observed a decrease in risk though the association was not statistically significant. Figure 4B shows the contour 3D plot of exposure-lag response surface for RH and malaria risk. For RH between 50.0 and 60.0%, we observed much shorter lags but at lower RH, we saw much longer lags; for example, malaria risk increased by 30.1% at an RH of 38%, (RR 1.301 [95%CI: 1.08–1.55]) at a lag of 6 months. Higher RH was found to be significantly protective at shorter lags; for example, at an RH of 90%, malaria risk was decreased by 8.4%, (RR 0.916 [95% CI: 0.84–0.99]) at a lag of 1 month.
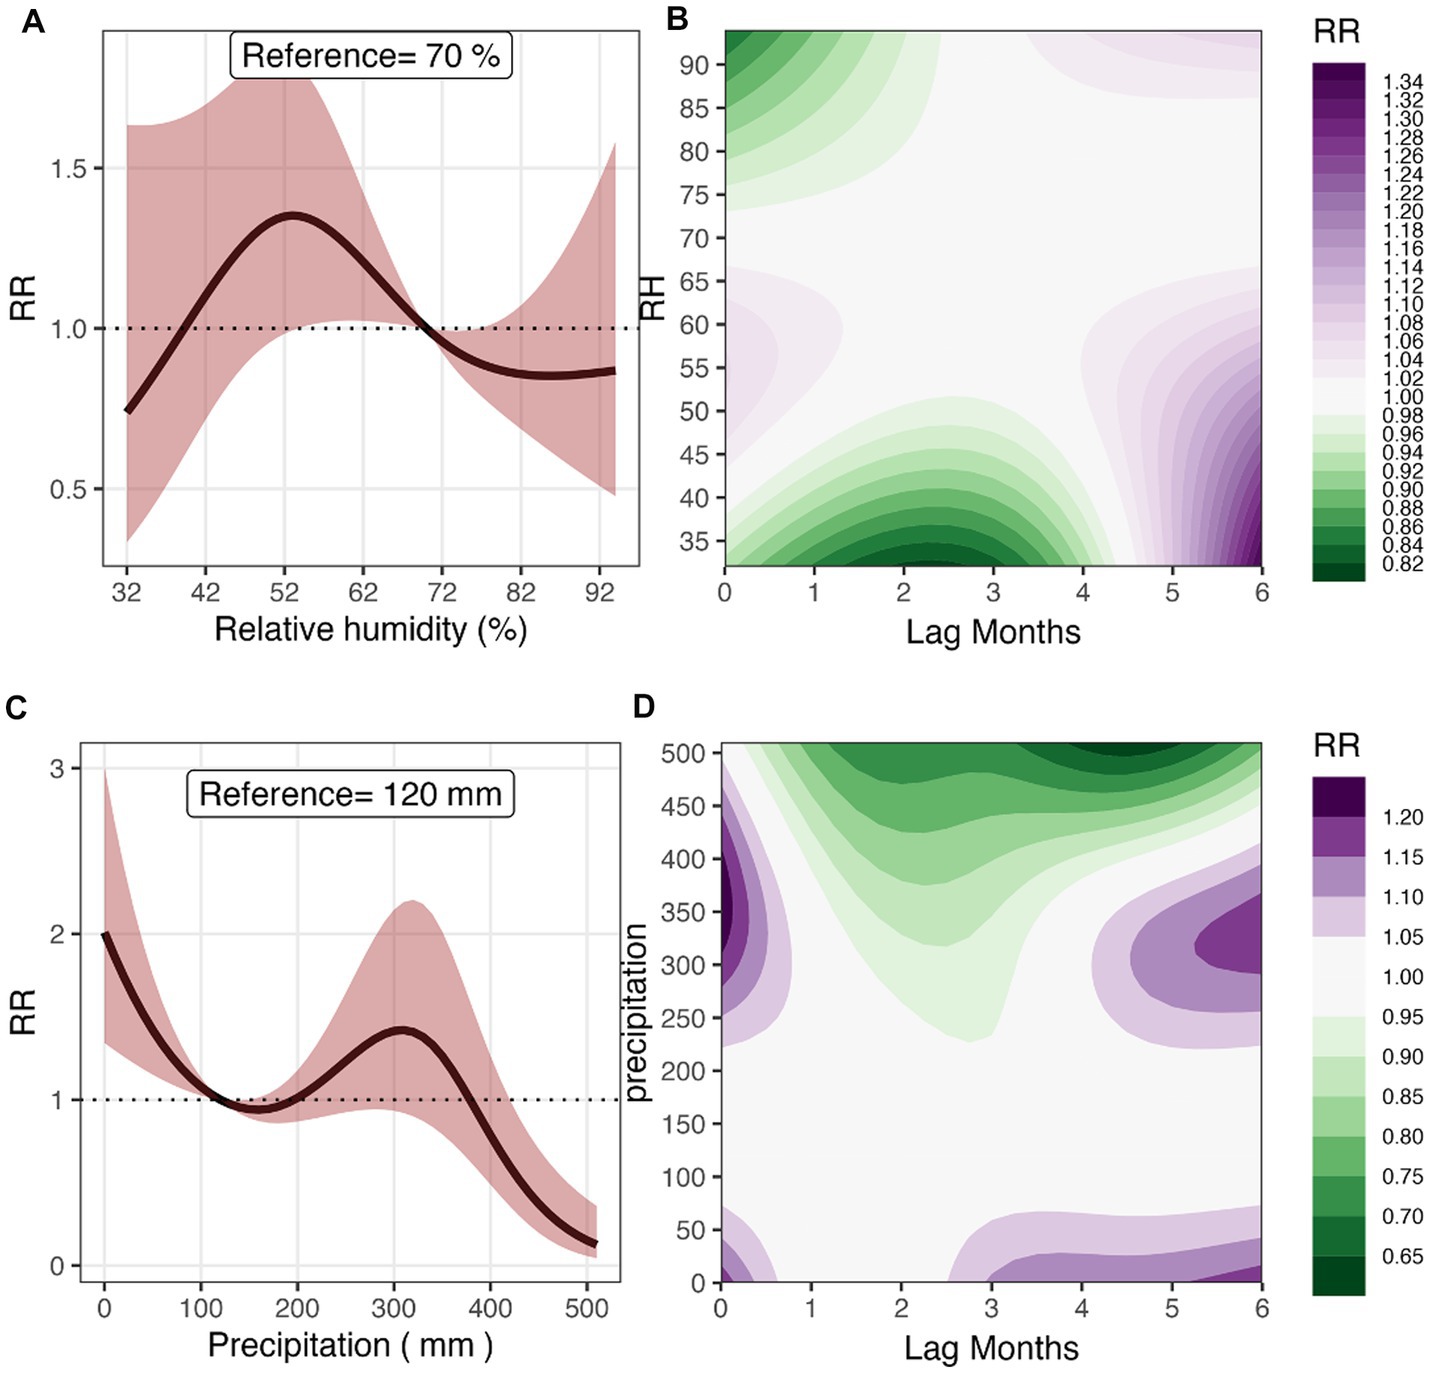
Figure 4. Overall effect and 3D Contour plots of relative humidity (A,B), and precipitation (C,D) on malaria risk at lag times 0–6 months in Mozambique, 2016–2018. The reference values for RH and Precipitation are 70% and 120 mm, respectively.
3.3.4. Precipitation
Figure 4C shows the relationship between cumulative precipitation and malaria risk. The risk was significantly higher at precipitation less than 100 mm in reference to the relative risk at a monthly total precipitation of 120 mm. For example, at a monthly total precipitation of 10 mm, there was an 87% increase in risk compared to the reference rainfall (RR 1.87 [95% CI: 1.30–2.69]). The risk increased at higher precipitation levels from 100 mm to 300 mm and then plummeted but not significantly. At precipitation levels of 400 mm and above, we observed a significant protective effect on malaria risk; for example, at a precipitation level of 490 mm, malaria risk reduced by 81.8% (RR 0.18 [95% CI: 0.07–0.45]). Figure 4D shows the exposure-lag response surface of monthly total precipitation and malaria risk at lags 0–6 months. We observed a shorter lag of 1 month for a high monthly total precipitation between 300 and 400 mm, and both shorter and longer lags over 3 months for lower total precipitation levels. For example, at a lag of 5 months, a total precipitation of 340 mm resulted in a 12.4% increase in malaria risk (RR 1.12 [95% CI: 1.01–1.25]) while at 50 mm of precipitation, the risk increased by 5.9% after 3 months (RR 1.06 [95% CI: 1.00–1.12]). The protective effect of a higher precipitation was also observed at much shorter lags, for example at a precipitation of 480 mm, malaria risk reduced by 26.1% (RR 0.739 [95% CI: 0.61–0.90]) at a lag of 2 months.
3.4. Socio-demographic factors
Table 2 shows the influence of socio-economic factors on malaria risk after controlling for the environmental factors. The districts with high proportion of households with electricity had significantly lower risk of malaria. Specifically, malaria risk decreased by 2.1% for every unit increase in the proportion of households with electricity (RR 0.979 [95% CI: 0.97–0.99]). Similarly, malaria risk was lower in districts with low proportions of individuals who share a toilet facility (RR 0.957 [95% CI: 0.924–0.991]). Malaria risk increased by 3.4% for every unit increase in the proportion of uneducated population (RR 1.034 [95% CI: 1.014–1.054]).
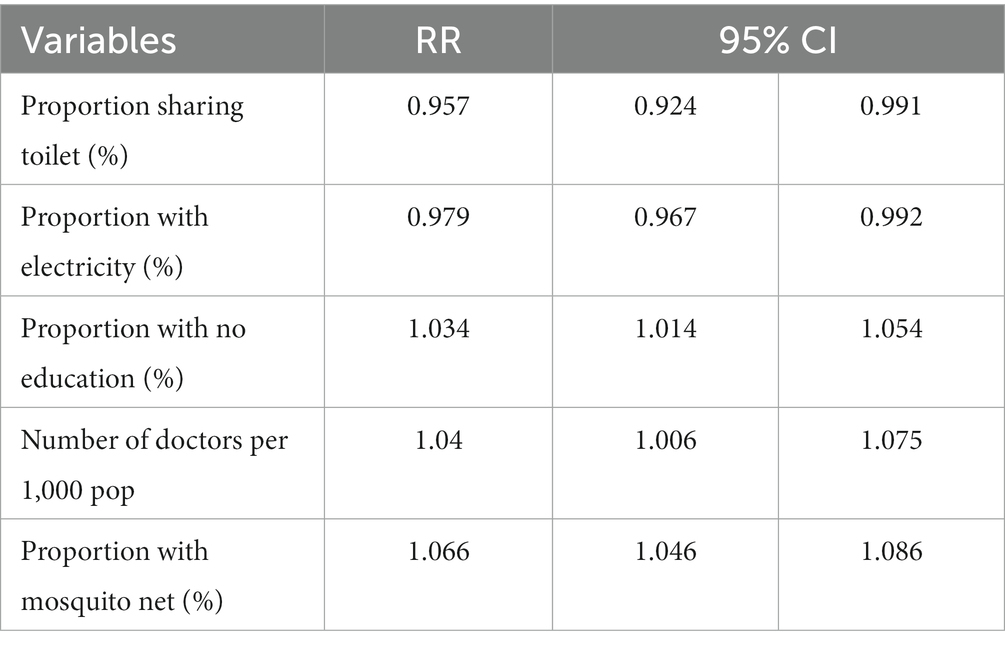
Table 2. The relative risks of malaria infections in relation to household socio-economic indicators and doctor to population ratio.
4. Discussion
In summary, in this study we identified temperatures of between 25 and 29°C to be associated with high malaria risk with shorter lagged associations of 1 month. Higher NDVI values above 0.2 were also associated with elevated risk of malaria with lags ranging from 1 to 5 months. The optimal relative humidity (RH) range for malaria risk was 50–60%, with shorter lags for lower RH and longer lags for RH within the optimal range. Lower monthly rainfall totals were associated with higher risks of malaria at lags of one to 3 months compared to wetter conditions associated with lowers risks with much shorter lags. We also showed that low educational level was associated with high risk of malaria, while owning a radio significantly lowered malaria risk.
We combined INLA Bayesian modeling and distributed lag nonlinear modeling approaches to explore the non-linear lagged exposure-response relationships between climate variables and risk of malaria infection in Mozambique controlling for socio-demographic factors and spatial–temporal covariance. The flexible DLNM approach allowed us to capture both the nonlinear exposure-response functions and their lag dimensions in assessing the relationship between climate variables and malaria incidence (56, 57). The INLA Bayesian approach has previously been used to investigate the association between malaria and climatic variables in other settings (50, 58–61).
From our findings, mean temperature was positively associated with malaria incidence, which is consistent with study done in Vietnam (62), China (63), and Thailand (64). At temperatures value above 20°C, malaria risk is higher at lags 4 to 6 months. At temperatures between 27 and 30°C, the risk is lower at shorter lags of 0–2 months. In Western Kenya, temperatures above 28°C were observed to be positively associated with malaria risk after 2 months (22). In Swaziland, malaria transmission risk increased when temperature was above 25°C with the effect pronounced at a 2-month lag (61). The association between temperature and the incubation period of malaria parasites and malaria transmission are well-known (65). High temperatures increase the biting rate of malaria vectors and expand malaria transmission geographically and temporally (66). The optimal temperature for malaria transmission ranges between 20.9 and 34.2°C (65–70), consistent with findings of this study which identified a range of 20–29°C. This temperature range favors parasite development and vector survival, resulting in increased malaria risk.
NDVI reflects the amount and the vigor of vegetation coverage over a certain area. Changes in the spatial distribution of NDVI can be primarily explained by geographical and climatic factors, such as precipitation. In areas with low precipitation, where water is a limiting factor for vegetation growth, seasonal NDVI is closely linked to precipitation. Overall, NDVI was found to be positively associated with malaria morbidity in our study. Similar observations were made in studies in Ivory Coast (71), Nigeria (72), and Uganda (56). Our findings showed that at an NVDI value of 0.49, malaria risk was higher after 1 month. In contrast, in Western Kenya (22), NDVI above 0.4 was found to be negatively associated with malaria.
Study done in Cameroon (73) found that RH is the most important climatic variable that determines the number of malaria cases. Other study showed a strong and significant effect of RH during the pre-transmission season on malaria burden in India and also indicates that RH is a critical factor in the spread of malaria (74). Our findings showed higher RH to be negatively associated with malaria morbidity, which is consistent with previous studies done in Korea (75), Indonesia (76). At RH values between 50 and 60%, the risk of malaria was higher at lags of 5–6 months and lower at lags of 1–4 months. Study conducted in China found that for RH values between 68.57 and 80.57 the risk of malaria was higher at lags of 1–5 months (77). In Iran, RH was also found to be the most important climatic driver of malaria infections (78). RH influences mosquito survival as insects are highly susceptible to desiccation. An increase in RH may be associated with heavy precipitation when temperatures are increasing, since moisture evaporating from the land surface in warm conditions is prevented from escaping by the arrival of clouds. Near the land surface, high RH leads to an increase in mosquito survival and host-seeking behavior. These factors are associated with variation in RH and are linked to malaria morbidity within an optimum RH range of approximately 60–80% (38). Our results are within the optimum RH range to malaria transmission.
The results from this study showed that malaria transmission was significantly associated with precipitation over the study area at a one-month lag. Malaria risk was negatively associated with precipitation above 300 mm which could be associated with flooding which destroys the mosquito habitat. In South-West China, precipitation value of 26 mm found to be positively associated with malaria infection after 2–4 months (77). While for a study done in Brazil, Guyana and Venezuela showed that malaria infection decreased by 1.6% per 1 cm increase in 6 months lagged precipitation (79). In Indonesia, a 1 mm increase in precipitation was associated with a 0.08% increase of malaria infection at lag of 3 months (76). Precipitation provides suitable habitats for mosquito breeding and is thus considered to be a dominant factor in driving malaria transmission (38). Unsurprisingly, studies conducted in Senegal (80), Ethiopia (81), Paraguay and Argentina (82), and Equador (83) showed that precipitation was the major determinant of malaria transmission. This may be explained by geographical and topographic conditions of an area. In addition, heavy precipitation or storms may destroy the breeding grounds of mosquitoes and interfere with the development of mosquito eggs or larvae (84).
Our findings showed that there was a significant decrease in malaria infection in households with electricity, which is consistent with other studies (85). Some studies suggested that households who share a toilet have a greater risk of malaria (86, 87). We found that less educated individuals were more vulnerable to malaria infection, which is consistent with earlier studies (5, 12, 13). Interventions and prevention measures plays a crucial role in the management and control of malaria infections. We only assessed ITNs and indoor residual spraying on the risk of malaria as these were the only control/prevention measures in the DHS and MIS datasets used in this study. However we know that malaria infections can be managed by the use of antimalarial drugs and prevented through the use of protective measures against mosquito bites (88), e.g., use of repellants and treated mosquito nets (89–91).
Treatment of malaria with an effective antimalarial in endemic settings is one of the key strategies of malaria control and prevention (92, 93). Artemisinin-based combination therapy (ACT) has been the recommended by the World Health Organization for the treatment of uncomplicated malaria in Mozambique since 2006, with artemether-lumefantrine (AL) and amodiaquine–artesunate (AS-AQ) as the first option (94, 95). In Mozambique, antimalarial drugs such as artemether-lumefantrine (AL) were observed to have therapeutic efficacy of 97.9% (95% CI 95.6–99.2%) to malaria infection, while for amodiaquine-artesunate (AS-AQ) were observed to have therapeutic efficacy of 99.6% (95% CI 97.9–100%) to malaria infection (94). In Tanzania, AL were observed to have therapeutic efficacy of 98% which is the WHO recommended threshold and remain well tolerated in the country (96). The therapeutic efficacy of AL in Ethiopia was 98.6% (95% CI 92.3–100) for malaria infection, which suggests the continuation of AL as the first-line antimalarial drug for the treatment of uncomplicated plasmodium falciparum malaria in Ethiopia (97). Abacassamo et al. assessed the clinical efficacy and parasitological response of Plasmodium falciparum to antimalarial drugs, he found that the therapeutic efficacy of 91.6% of amodiaquine (AQ) was better than that of 82.7% of sulphadoxine–pyrimethamine (SP) and 47.1% of chloroquine (CQ) to malaria infection (98). The therapeutic efficacy of AL and CQ in Ethiopia was 100% (95% CI 96–100) and 98%(95%CI: 95–100) for malaria infection, respectively, (99). Assessment of antimalarial therapeutic efficacy is needed to guide policies and practices (100, 101). The development of an effective malaria vaccine is, therefore, essential for mitigating malaria infections on vulnerable population. Currently, more than 2.3 million doses of malaria vaccine have been administered in three Sub-Sahara countries namely Ghana, Kenya and Malawi (102) though the efficacy is only at 39% (102).
The lagged association between environmental covariates and malaria incidence could aid in the development of a malaria early warning system to guide planning and control of malaria transmission. For example, precipitation and sea surface temperature monitoring has been used in issuing malaria early warnings in Botswana with great success in reducing malaria incidence (103). Similarly, a study in South Africa showed that seasonal climate forecasts could be used in a malaria early warning system with high prediction skill providing lead times of up to 16 weeks for planning (104).
In this study we showed that suitable temperatures of 21–26°C provided leads time of 1–3 months, higher rainfalls also provided shorter leads time of 1 month, but longer lead times for drier conditions of up to 6 months. Both Higher NDVI and relative humidity values also provided shorter lead time of 1 month. Combining all these lagged climatic covariates into an early warning system could provide lead times of 1–3 months for planning. Seasonal climate forecasts can potentially be utilized with this model to provide early warnings for malaria in Mozambique.
The major strength of this study is the combination of INLA Bayesian framework and DLNM framework to estimate the unbiased lag-exposure response functions between climatic factors and malaria risk by robustly adjusting for spatial–temporal covariance and socio-economic indicators. However, the study also had some limitations with the included socio-economic data. We only included the 2018 survey that covers the analysis period (2016–2018), assuming the values were similar in the previous years which may not be true. In addition, the aggregation of individual DHS covariates over large spatial units (the districts) may have masked the association between socio-economic indicators and malaria risk. Thus, interpretation should be made considering these limitations.
5. Conclusion
This study indicates that climate and socioeconomic variables influence the incidence and distribution of malaria in Mozambique. Temperature precipitation, NDVI, and RH play a role in influencing malaria cases at specific lag periods. The results of the study support the need to identify malaria vulnerability indicators to further support malaria control and efforts including combining climate variables, environmental conditions, regional spatial stratification, socioeconomic factors, public health interventions related to malaria transmission, and also reinforces the applicability of the use of climate services for risk mapping of malaria in areas where climate data is not routinely available. Achieving the targeted reductions in malaria infections in Mozambique will require a multidisciplinary effort, innovative approaches for malaria prevention and sustained political commitment at national, province, and district levels, as well as continued investment in malaria control and elimination efforts.
Vulnerability mapping should be carried out to identify areas with high malaria risk using climate variables. Climate variables such as temperature, NDVI, RH and precipitation should be used in identifying vulnerable areas. The identified lagged patterns can be used in the development of a climate-based early warning systems to strengthen malaria prevention in Mozambique. More research is needed to identify how to incorporate the identified vulnerability indicators and lagged associations into a malaria early warning system in Mozambique and assessing the forecast accuracies.
This study has relevance for achieving the Sustainable Development Goals (SDGs): (i) Ensuring healthy lives and wellbeing for all; on strengthening capacity for response to health risks (ii) Improving education, awareness-raising and human and institutional capacity on climate adaptation, impact reduction. Achieving the SDGs will require focusing on the poorest and most vulnerable populations as those are the most affected by malaria, ensuring no one is left behind. Ending malaria by 2030 requires a reference like the one presented here for planning, monitoring, and evaluation of malaria control efforts.
Data availability statement
The data analyzed in this study is subject to the following licenses/restrictions: The malaria datasets analyzed during the current study are available from the corresponding author on reasonable request. Requests to access these datasets should be directed to CA, cjarmando.jose@gmail.com.
Ethics statement
The study was based on secondary registries of surveillance data and no personal data was used, and thus no ethical approval was required.
Author contributions
CA and MSe wrote the manuscript. CA, JR, MSe, YT, AM, and AB conceived, designed the study, reviewed, and revised the manuscript. CA, MSi, MSe, JR, and AM contributed to data collection and statistical analysis. All authors contributed to writing the article and approved the submitted version.
Funding
This research was supported by the Swedish International Development Agency (SIDA).
Acknowledgments
CA is appreciative of the PhD scholarship by the Swedish International Development Agency (SIDA). All authors thank their respective institutions for supporting the research.
Conflict of interest
The authors declare that the research was conducted in the absence of any commercial or financial relationships that could be construed as a potential conflict of interest.
Publisher’s note
All claims expressed in this article are solely those of the authors and do not necessarily represent those of their affiliated organizations, or those of the publisher, the editors and the reviewers. Any product that may be evaluated in this article, or claim that may be made by its manufacturer, is not guaranteed or endorsed by the publisher.
Supplementary material
The Supplementary material for this article can be found online at: https://www.frontiersin.org/articles/10.3389/fpubh.2023.1162535/full#supplementary-material
SUPPLEMENTARY FIGURE S1 | Mean and Standard deviation of Random Spatial effect Mozambique by year 2016–2018.
SUPPLEMENTARY FIGURE S2 | Monthly seasonal patterns of (A) normalized different vegetation index, (B) relative humidity, (C) mean temperature, (D) malaria cases and (E) precipitation from 2016–2018.
SUPPLEMENTARY FIGURE S3 | Scatter plot of malaria cases with (A) normalized different vegetation index, (B) relative humidity, (C) mean temperature and (D) precipitation.
SUPPLEMENTARY FIGURE S4 | Seasonal Map of malaria cases by district in Mozambique 2018.
SUPPLEMENTARY FIGURE S5 | Seasonal Map of minimum temperature by district in Mozambique 2018.
SUPPLEMENTARY FIGURE S6 | Seasonal Map of mean temperature by district in Mozambique 2018.
SUPPLEMENTARY FIGURE S7 | Seasonal Map of maximum temperature by district in Mozambique 2018.
SUPPLEMENTARY FIGURE S8 | Seasonal Map of Relative Humidity by district in Mozambique 2018.
SUPPLEMENTARY FIGURE S9 | Seasonal Map of Normalized different vegetation index (NDVI) by district in Mozambique 2018.
SUPPLEMENTARY FIGURE S10 | Seasonal Map of precipitation by district in Mozambique 2018.
Abbreviations
DHS, Demography Health Survey; INLA, Integrated nested Laplace approximation; NDVI, Normalized Different Vegetation Index; DLNM, Distributed lag nonlinear modeling; RH, Relative humidity; ITNs, Insecticide-treated nets; ENSO, El-Niño-Southern-Oscillation; IOD, Indian Ocean Dipole; IPCC, Climate change; MIS, Malaria Indicator Survey.
References
1. World Health Organization. World malaria report 2020: 20 years of global progress and challenges. (2020) 299.
2. Tusting, LS, Willey, B, Lucas, H, Thompson, J, Kafy, HT, Smith, R, et al. Socioeconomic development as an intervention against malaria: a systematic review and meta-analysis. Lancet. (2013) 382:963–72. doi: 10.1016/S0140-6736(13)60851-X
3. Tusting, LS, Ippolito, MM, Willey, BA, Kleinschmidt, I, Dorsey, G, Gosling, RD, et al. The evidence for improving housing to reduce malaria: a systematic review and meta-analysis. Malar J. (2015) 14:209. doi: 10.1186/s12936-015-0724-1
4. Al Khaja, KA, and Sequeira, RP. Drug treatment and prevention of malaria in pregnancy: a critical review of the guidelines. Malar J. (2021) 20:1–13. doi: 10.1186/s12936-020-03565-2
5. Balami, AD, Said, SM, Zulkefli, NAM, Norsa’adah, B, and Audu, B. Improving malaria preventive practices and pregnancy outcomes through a health education intervention: a randomized controlled trial. Malar J. (2021) 20:55. doi: 10.1186/s12936-021-03586-5
6. Naing, C, Sandhu, NK, and Wai, VN. The effect of malaria and HIV co-infection on anemia: a meta-analysis. Medicine. (2016) 95:e3205. doi: 10.1097/MD.0000000000003205
7. Scott, J, Kanyangarara, M, Nhama, A, Macete, E, Moss, WJ, Saute, F, et al. Factors associated with use of insecticide-treated net for malaria prevention in Manica District, Mozambique: a community-based cross-sectional survey. Malar J. (2021) 20:1–9. doi: 10.1186/s12936-021-03738-7
8. Degarege, A, Fennie, K, Degarege, D, Chennupati, S, and Madhivanan, P. Improving socioeconomic status may reduce the burden of malaria in sub Saharan Africa: a systematic review and meta-analysis. PLoS One. (2019) 14:e0211205. doi: 10.1371/journal.pone.0211205
9. Sharma, RK, Rajvanshi, H, Bharti, PK, Nisar, S, Jayswar, H, Mishra, AK, et al. Socio-economic determinants of malaria in tribal dominated Mandla district enrolled in malaria elimination demonstration project in Madhya Pradesh. Malar J. (2021) 20:1–13. doi: 10.1186/s12936-020-03540-x
10. Taylor, C, Namaste, SML, Lowell, J, Useem, J, and Yé, Y. Estimating the fraction of severe malaria among malaria-positive children: analysis of household surveys in 19 malaria-endemic countries in Africa. Am J Trop Med Hyg. (2021) 104:1375–82. doi: 10.4269/ajtmh.20-1351
11. Emina, JBO, Doctor, HV, and Yé, Y. Profiling malaria infection among under-five children in the Democratic Republic of Congo. PLoS One. (2021) 16:e0250550. doi: 10.1371/journal.pone.0250550
12. Nzabakiriraho, JD, and Gayawan, E. Geostatistical modeling of malaria prevalence among under-five children in Rwanda. BMC Public Health. (2021) 21:369. doi: 10.1186/s12889-021-10305-x
13. Carrasco-Escobar, G, Fornace, K, and Benmarhnia, T. Mapping socioeconomic inequalities in malaria in sub-Sahara African countries. Sci Rep. (2021) 11:1–8. doi: 10.1038/s41598-021-94601-x
14. Bennett, A, Bisanzio, D, Yukich, JO, Mappin, B, Fergus, CA, Lynch, M, et al. Population coverage of artemisinin-based combination treatment in children younger than 5 years with fever and plasmodium falciparum infection in Africa, 2003–2015: a modelling study using data from national surveys. Lancet Glob Health. (2017) 5:e418–27. doi: 10.1016/S2214-109X(17)30076-1
15. Liu, L, Oza, S, Hogan, D, Chu, Y, Perin, J, Zhu, J, et al. Global, regional, and national causes of under-5 mortality in 2000–15: an updated systematic analysis with implications for the sustainable development goals. Lancet. (2016) 388:3027–35. doi: 10.1016/S0140-6736(16)31593-8
16. Arroz, JA. Increase in cases of malaria in Mozambique, 2014: epidemic or new endemic pattern? Rev Saude Publica. (2016) 50:5. doi: 10.1590/S1518-8787.2016050006105
17. Mabunda, S, Casimiro, S, Quinto, L, and Alonso, P. A country-wide malaria survey in Mozambique. I. Plasmodium falciparum infection in children in different epidemiological settings. Malar J. (2008) 7:216. doi: 10.1186/1475-2875-7-216
18. 2022, U.S.P.s.M.I.M.M.O.P.F. U.S. President’s malaria initiative Mozambique malaria operational plan FY 2022. (2022). Available at: www.pmi.gov.
19. Mugabe, VA, Gudo, ES, Inlamea, OF, Kitron, U, and Ribeiro, GS. Natural disasters, population displacement and health emergencies: multiple public health threats in Mozambique. BMJ Glob Health. (2021) 6:e006778. doi: 10.1136/bmjgh-2021-006778
20. DHS. Survey search. (2015). Available at: http://dhsprogram.com/What-We-Do/survey-search.cfm.
22. Sewe, MO, Ahlm, C, and Rocklöv, J. Remotely sensed environmental conditions and malaria mortality in three malaria endemic regions in western Kenya. PLoS One. (2016) 11:e0154204. doi: 10.1371/journal.pone.0154204
23. Tusting, LS, Bottomley, C, Gibson, H, Kleinschmidt, I, Tatem, AJ, Lindsay, SW, et al. Housing improvements and malaria risk in sub-Saharan Africa: a multi-country analysis of Survey data. PLoS Med. (2017) 14:e1002234. doi: 10.1371/journal.pmed.1002234
24. Bertozzi-Villa, A, Bever, CA, Koenker, H, Weiss, DJ, Vargas-Ruiz, C, Nandi, AK, et al. Maps and metrics of insecticide-treated net access, use, and nets-per-capita in Africa from 2000-2020. Nat Commun. (2021) 12:1–12. doi: 10.1038/s41467-021-23707-7
25. Health, N.I.o. Mozambique Malaria Indicator Survey. (2018). Rockville, Maryland, EUA: INS and ICF.
26. INGC, Study on the impact of climate change on disaster risk in Mozambique: synthesis report, in National Institute for disaster management, synthesis report. (2009). Maputo - Mozambique: INGC - National Institute for Risk Management.
27. Armando, CJ, Yu, Z, Mavume, AF, Ongoma, V, and Nyongesa, AM. Formation and track of tropical cyclones Eline (2000) and Bonita (1996). Meteorog Atmos Phys. (2021) 133:1691–706. doi: 10.1007/s00703-021-00835-9
28. Mavume, AF, Banze, BE, Macie, OA, and Queface, AJ. Analysis of climate change projections for Mozambique under the representative concentration pathways. Atmos. (2021) 12:588. doi: 10.3390/atmos12050588
29. Ferrão, JL, Mendes, JM, and Painho, M. Modelling the influence of climate on malaria occurrence in Chimoio municipality, Mozambique. Parasites Vectors. (2017) 10:1–12. doi: 10.1186/s13071-017-2205-6
30. Harp, RD, Colborn, JM, Candrinho, B, Colborn, KL, Zhang, L, and Karnauskas, KB. Interannual climate variability and malaria in Mozambique. GeoHealth. (2021) 5:e2020GH000322. doi: 10.1029/2020GH000322
31. Manhique, AJ, Guirrugo, IA, Nhantumbo, BJ, and Mavume, AF. Seasonal to interannual variability of vertical wind shear and its relationship with tropical cyclogenesis in the Mozambique channel. Atmos. (2021) 12:739. doi: 10.3390/atmos12060739
32. Lim Kam Sian, KTC, Wang, J, Ayugi, BO, Nooni, IK, and Ongoma, V. Multi-decadal variability and future changes in precipitation over southern Africa. Atmos. (2021) 12:742. doi: 10.3390/atmos12060742
33. Bousquet, O, Barruol, G, Cordier, E, Barthe, C, Bielli, S, Calmer, R, et al. Impact of tropical cyclones on inhabited areas of the SWIO Basin at present and future horizons. Part 1: overview and observing component of the research project RENOVRISK-CYCLONE. Atmos. (2021) 12:544. doi: 10.3390/atmos12050544
34. Morake, D, Blamey, R, and Reason, C. Long-lived mesoscale convective systems over eastern South Africa. J Clim. (2021) 34:1–66. doi: 10.1175/JCLI-D-20-0851.1
35. Kurniadi, A, Weller, E, Min, SK, and Seong, MG. Independent ENSO and IOD impacts on rainfall extremes over Indonesia. Int J Climatol. (2021) 41:3640–56. doi: 10.1002/joc.7040
36. Power, K, Axelsson, J, Wangdi, N, and Zhang, Q. Regional and local impacts of the ENSO and IOD events of 2015 and 2016 on the Indian summer monsoon—a Bhutan case study. Atmos. (2021) 12:954. doi: 10.3390/atmos12080954
37. Xulu, NG, Chikoore, H, Bopape, MJM, and Nethengwe, NS. Climatology of the mascarene high and its influence on weather and climate over southern Africa. Climate. (2020) 8:86. doi: 10.3390/cli8070086
38. Nissan, H, Ukawuba, I, and Thomson, M. Climate-proofing a malaria eradication strategy. Malar J. (2021) 20:1–16. doi: 10.1186/s12936-021-03718-x
39. Ikeda, T, Behera, SK, Morioka, Y, Minakawa, N, Hashizume, M, Tsuzuki, A, et al. Seasonally lagged effects of climatic factors on malaria incidence in South Africa. Sci Rep. (2017) 7:1–9. doi: 10.1038/s41598-017-02680-6
40. Wickremasinghe, R, Wickremasinghe, A, and Fernando, S. Climate change and malaria a complex relationship. UN Chron. (2012) 47:21–5. doi: 10.18356/2374a00e-en
41. Thomson, MC, Ukawuba, I, Hershey, CL, Bennett, A, Ceccato, P, Lyon, B, et al. Using rainfall and temperature data in the evaluation of national malaria control programs in Africa. Am J Trop Med Hyg. (2017) 97:32–45. doi: 10.4269/ajtmh.16-0696
42. IPCC. Summary for policymakers In: V Masson-Delmotte, P Zhai, A Pirani, SL Connors, C Péan, and S Berger, et al., editors. Climate change 2021: The physical science basis. Contribution of working group I to the sixth assessment report of the intergovernmental panel on climate change (2021) 2021:In Press.
43. MISAU, Ministry of Health (Mozambique). (2022). Maputo-Mozambique. Available at: https://www.misau.gov.mz/.
44. II, N.-R. NCEP - reanalysis II National Centers for Environmental Prediction (2022) Available at: https://iridl.ldeo.columbia.edu/SOURCES/.NOAA/.NCEP/.CPC/.FEWS/.Africa/.DAILY/.ARC2/.daily/index.html?Set-Language=en.
45. NCEP. NCEP-reanalysis II. (2022) Available at: https://psl.noaa.gov/data/gridded/help.html#FTP.
46. Tatem, AJ. WorldPop, open data for spatial demography. Sci Data. (2017) 4:1–4. doi: 10.1038/sdata.2017.4
47. Gasparrini, A, Armstrong, B, and Kenward, MG. Distributed lag non-linear models. Stat Med. (2010) 29:2224–34. doi: 10.1002/sim.3940
48. Lowe, R, Lee, SA, O'Reilly, KM, Brady, OJ, Bastos, L, Carrasco-Escobar, G, et al. Combined effects of hydrometeorological hazards and urbanisation on dengue risk in Brazil: a spatiotemporal modelling study. Lancet Planet Health. (2021) 5:e209–19. doi: 10.1016/S2542-5196(20)30292-8
49. Lesaffre, E, and Lawson, AB. Bayesian biostatistics John Wiley & Sons (2012) United Kingdom (UK). doi: 10.1002/9781119942412
50. Semakula, M, Niragire, FI, and Faes, C. Bayesian spatio-temporal modeling of malaria risk in Rwanda. PLoS One. (2020) 15:e0238504. doi: 10.1371/journal.pone.0238504
51. Besag, J, York, J, and Mollié, A. Bayesian image restoration, with two applications in spatial statistics. Ann Inst Stat Math. (1991) 43:1–20. doi: 10.1007/BF00116466
52. Besag, J, and Green, PJ. Spatial statistics and Bayesian computation. J R Stat Soc B. (1993) 55:25–37.
53. Sørbye, SH, and Rue, H. Fractional Gaussian noise: prior specification and model comparison. Environmetrics. (2018) 29:e2457. doi: 10.1002/env.2457
54. Carroll, R, Lawson, AB, Faes, C, Kirby, RS, Aregay, M, and Watjou, K. Comparing INLA and OpenBUGS for hierarchical Poisson modeling in disease mapping. Spat Spat Temp Epidemiol. (2015) 14–15:45–54. doi: 10.1016/j.sste.2015.08.001
55. Riebler, A, Sørbye, SH, Simpson, D, and Rue, H. An intuitive Bayesian spatial model for disease mapping that accounts for scaling. Stat Methods Med Res. (2016) 25:1145–65. doi: 10.1177/0962280216660421
56. Okiring, J, Routledge, I, Epstein, A, Namuganga, JF, Kamya, EV, Obeng-Amoako, GO, et al. Associations between environmental covariates and temporal changes in malaria incidence in high transmission settings of Uganda: a distributed lag nonlinear analysis. BMC Public Health. (2021) 21:1–11. doi: 10.1186/s12889-021-11949-5
57. Emeto, TI, Adegboye, OA, Rumi, RA, Khan, MUI, Adegboye, M, Khan, WA, et al. Disparities in risks of malaria associated with climatic variability among women, children and elderly in the Chittagong Hill tracts of Bangladesh. Int J Environ Res Public Health. (2020) 17:9469. doi: 10.3390/ijerph17249469
58. Moraga, P, Dean, C, Inoue, J, Morawiecki, P, Noureen, SR, and Wang, F. Bayesian spatial modelling of geostatistical data using INLA and SPDE methods: a case study predicting malaria risk in Mozambique. Spat Spat Temp Epidemiol. (2021) 39:100440. doi: 10.1016/j.sste.2021.100440
59. Jaya, I, Andriyana, Y, and Tantular, B. Spatial prediction of malaria risk with application to Bandung City, Indonesia. IAENG Int J Appl Math. (2021) 51:1–8.
60. Gunda, R, Chimbari, MJ, Shamu, S, Sartorius, B, and Mukaratirwa, S. Malaria incidence trends and their association with climatic variables in rural Gwanda, Zimbabwe, 2005–2015. Malar J. (2017) 16:1–13. doi: 10.1186/s12936-017-2036-0
61. Chuang, T-W, Soble, A, Ntshalintshali, N, Mkhonta, N, Seyama, E, Mthethwa, S, et al. Assessment of climate-driven variations in malaria incidence in Swaziland: toward malaria elimination. Malar J. (2017) 16:1–10. doi: 10.1186/s12936-017-1874-0
62. Phung, D, Nguyen, HX, Nguyen, HLT, Luong, AM, do, CM, Tran, QD, et al. The effects of socioecological factors on variation of communicable diseases: a multiple-disease study at the national scale of Vietnam. PLoS One. (2018) 13:e0193246. doi: 10.1371/journal.pone.0193246
63. Wang, Z, Liu, Y, Li, Y, Wang, G, Lourenço, J, Kraemer, M, et al. The relationship between rising temperatures and malaria incidence in Hainan, China, from 1984 to 2010: a longitudinal cohort study. Lancet Planet Health. (2022) 6:e350–8. doi: 10.1016/S2542-5196(22)00039-0
64. Ninphanomchai, S, Chansang, C, Hii, Y, Rocklöv, J, and Kittayapong, P. Predictiveness of disease risk in a global outreach tourist setting in Thailand using meteorological data and vector-borne disease incidences. Int J Environ Res Public Health. (2014) 11:10694–709. doi: 10.3390/ijerph111010694
65. Donkor, E, Kelly, M, Eliason, C, Amotoh, C, Gray, DJ, Clements, ACA, et al. A Bayesian spatio-temporal analysis of malaria in the Greater Accra region of Ghana from 2015 to 2019. Int J Environ Res Public Health. (2021) 18:6080. doi: 10.3390/ijerph18116080
66. Fischer, L, Gültekin, N, Kaelin, MB, Fehr, J, and Schlagenhauf, P. Rising temperature and its impact on receptivity to malaria transmission in Europe: a systematic review. Travel Med Infect Dis. (2020) 36:101815. doi: 10.1016/j.tmaid.2020.101815
67. Agusto, FB. Optimal control and temperature variations of malaria transmission dynamics. Complexity. (2020) 2020:1–32. doi: 10.1155/2020/5056432
68. Mordecai, EA, Paaijmans, KP, Johnson, LR, Balzer, C, Ben-Horin, T, de Moor, E, et al. Optimal temperature for malaria transmission is dramatically lower than previously predicted. Ecol Lett. (2013) 16:22–30. doi: 10.1111/ele.12015
69. Mordecai, EA, Ryan, SJ, Caldwell, JM, Shah, MM, and LaBeaud, AD. Climate change could shift disease burden from malaria to arboviruses in Africa. Lancet Planet Health. (2020) 4:e416–23. doi: 10.1016/S2542-5196(20)30178-9
70. Colón-González, FJ, Sewe, MO, Tompkins, AM, Sjödin, H, Casallas, A, Rocklöv, J, et al. Projecting the risk of mosquito-borne diseases in a warmer and more populated world: a multi-model, multi-scenario intercomparison modelling study. Lancet Planet Health. (2021) 5:e404–14. doi: 10.1016/S2542-5196(21)00132-7
71. M’Bra, RK, Kone, B, Soro, DP, N’krumah, RTAS, Soro, N, Ndione, JA, et al. Impact of climate variability on the transmission risk of malaria in northern Côte d'Ivoire. PLoS One. (2018) 13:e0182304. doi: 10.1371/journal.pone.0182304
72. Adigun, AB, Gajere, EN, Oresanya, O, and Vounatsou, P. Malaria risk in Nigeria: Bayesian geostatistical modelling of 2010 malaria indicator survey data. Malar J. (2015) 14:156. doi: 10.1186/s12936-015-0683-6
73. Nyasa, RB, Awatboh, F, Kwenti, TE, Titanji, VPK, and Ayamba, NLM. The effect of climatic factors on the number of malaria cases in an inland and a coastal setting from 2011 to 2017 in the equatorial rain forest of Cameroon. BMC Infect Dis. (2022) 22:1–11. doi: 10.1186/s12879-022-07445-9
74. Santos-Vega, M, Martinez, PP, Vaishnav, KG, Kohli, V, Desai, V, Bouma, MJ, et al. The neglected role of relative humidity in the interannual variability of urban malaria in Indian cities. Nat Commun. (2022) 13:1–9. doi: 10.1038/s41467-022-28145-7
75. Kim, Y-M, Park, J-W, and Cheong, H-K. Estimated effect of climatic variables on the transmission of plasmodium vivax malaria in the Republic of Korea. Environ Health Perspect. (2012) 120:1314–9. doi: 10.1289/ehp.1104577
76. Rejeki, DSS, Nurhayati, N, Aji, B, Murhandarwati, EEH, and Kusnanto, H. A time series analysis: weather factors, human migration and malaria cases in endemic area of Purworejo, Indonesia, 2005–2014. Iran J Public Health. (2018) 47:499–509.
77. Zhao, X, Chen, F, Feng, Z, Li, X, and Zhou, XH. The temporal lagged association between meteorological factors and malaria in 30 counties in south-West China: a multilevel distributed lag non-linear analysis. Malar J. (2014) 13:1–12. doi: 10.1186/1475-2875-13-57
78. Babaie, J, Barati, M, Azizi, M, Ephtekhari, A, and Sadat, SJ. A systematic evidence review of the effect of climate change on malaria in Iran. J Parasit Dis. (2018) 42:331–40. doi: 10.1007/s12639-018-1017-8
79. Wangdi, K, Wetzler, E, Cox, H, Marchesini, P, Villegas, L, and Canavati, S. Spatial patterns and climate drivers of malaria in three border areas of Brazil, Venezuela and Guyana, 2016–2018. Sci Rep. (2022) 12:10995. doi: 10.1038/s41598-022-14012-4
80. Fall, P, Diouf, I, Deme, A, and Sene, D. Assessment of climate-driven variations in malaria transmission in Senegal using the VECTRI model. Atmos. (2022) 13:418. doi: 10.3390/atmos13030418
81. Dabaro, D, Birhanu, Z, Negash, A, Hawaria, D, and Yewhalaw, D. Effects of rainfall, temperature and topography on malaria incidence in elimination targeted district of Ethiopia. Malar J. (2021) 20:1–10. doi: 10.1186/s12936-021-03641-1
82. Burgos, JJ, de Casas, SIC, Carcavallo, RU, and Martinez, A. Malaria and global climate change in Argentina. Entomolo Vectors. (1994) 1:123.
83. Cedeño, JEM. Rainfall and flooding in the Guayas river basin and its effects on the incidence of malaria 1982–1985. Disasters. (1986) 10:107–11. doi: 10.1111/j.1467-7717.1986.tb00575.x
84. Tiu, L.A., Wahid, W.E., Andriani, W.Y., Mirnawati,, and Tosepu, R. Literature review: impact of temperature and rainfall on incident malaria. in IOP Conference Series: Earth and Environmental Science. (2021) 755:012084. IOP Publishing. doi: 10.1088/1755-1315/755/1/012084
85. Roberts, D, and Matthews, G. Risk factors of malaria in children under the age of five years old in Uganda. Malar J. (2016) 15:1–11. doi: 10.1186/s12936-016-1290-x
86. Tasciotti, L. Use of electricity and malaria occurrence: is there a link? The case of Malawi. Energy Policy. (2017) 101:310–6. doi: 10.1016/j.enpol.2016.10.028
87. Sarkar, R, Kessler, A, Mawkhlieng, B, Sullivan, SA, Wilson, ML, Carlton, JM, et al. Household and individual level risk factors associated with declining malaria incidence in Meghalaya, India: implications for malaria elimination in low-endemic settings. Malar J. (2021) 20:1–14. doi: 10.1186/s12936-021-03982-x
88. World Health Organization. Q&A on the malaria vaccine implementation programme (MVIP). Geneva: World Health Organisation (2019).
89. Wetzler, EA, Park, C, Arroz, JAH, Chande, M, Mussambala, F, and Candrinho, B. Impact of mass distribution of insecticide-treated nets in Mozambique, 2012 to 2025: estimates of child lives saved using the lives saved tool. PLoS Global Public Health. (2022) 2:e0000248. doi: 10.1371/journal.pgph.0000248
90. de Sousa Pinto, L, Arroz, JAH, Martins, MRO, Hartz, Z, Negrao, N, Muchanga, V, et al. Malaria prevention knowledge, attitudes, and practices in Zambezia Province, Mozambique. Malar J. (2021) 20:1–10. doi: 10.1186/s12936-021-03825-9
91. Moon, TD, Hayes, CB, Blevins, M, Lopez, ML, Green, AF, González-Calvo, L, et al. Factors associated with the use of mosquito bed nets: results from two cross-sectional household surveys in Zambézia Province, Mozambique. Malar J. (2016) 15:1–10. doi: 10.1186/s12936-016-1250-5
92. Noedl, H, Se, Y, Schaecher, K, Smith, BL, Socheat, D, Fukuda, MM, et al. Evidence of artemisinin-resistant malaria in western Cambodia. N Engl J Med. (2008) 359:2619–20. doi: 10.1056/NEJMc0805011
93. Girma, M, Umeta, B, Hasen, G, and Suleman, S. Quality of antimalarial drugs in East Africa: a systematic review. Infect Drug Resist. (2022) 15:6085–92. doi: 10.2147/IDR.S373059
94. Nhama, A, Nhamússua, L, Macete, E, Bassat, Q, Salvador, C, Enosse, S, et al. In vivo efficacy and safety of artemether–lumefantrine and amodiaquine–artesunate for uncomplicated plasmodium falciparum malaria in Mozambique, 2018. Malar J. (2021) 20:1–12. doi: 10.1186/s12936-021-03922-9
95. Salomão, CA, Sacarlal, J, Chilundo, B, and Gudo, ES. Prescription practices for malaria in Mozambique: poor adherence to the national protocols for malaria treatment in 22 public health facilities. Malar J. (2015) 14:1–8. doi: 10.1186/s12936-015-0996-5
96. Ishengoma, DS, Mandara, CI, Francis, F, Talundzic, E, Lucchi, NW, Ngasala, B, et al. Efficacy and safety of artemether-lumefantrine for the treatment of uncomplicated malaria and prevalence of Pfk13 and Pfmdr1 polymorphisms after a decade of using artemisinin-based combination therapy in mainland Tanzania. Malar J. (2019) 18:1–13. doi: 10.1186/s12936-019-2730-1
97. Gubae, K, Mohammed, H, Sime, H, Hailgiorgis, H, Mare, AK, Gidey, B, et al. Safety and therapeutic efficacy of artemether-lumefantrine in the treatment of uncomplicated plasmodium falciparum malaria at Shecha health Centre, Arba Minch, Ethiopia. Malar J. (2023) 22:1–10. doi: 10.1186/s12936-022-04436-8
98. Abacassamo, F, Enosse, S, Aponte, JJ, Gomez-Olive, FX, Quinto, L, Mabunda, S, et al. Efficacy of chloroquine, amodiaquine, sulphadoxine–pyrimethamine and combination therapy with artesunate in Mozambican children with non-complicated malaria. Tropical Med Int Health. (2004) 9:200–8. doi: 10.1046/j.1365-3156.2003.01182.x
99. Assefa, A, Mohammed, H, Anand, A, Abera, A, Sime, H, Minta, AA, et al. Therapeutic efficacies of artemether-lumefantrine and dihydroartemisinin-piperaquine for the treatment of uncomplicated plasmodium falciparum and chloroquine and dihydroartemisinin-piperaquine for uncomplicated plasmodium vivax infection in Ethiopia. Malar J. (2022) 21:359. doi: 10.1186/s12936-022-04350-z
100. White, NJ. The assessment of antimalarial drug efficacy in vivo. Trends Parasitol. (2022) 38:660–72. doi: 10.1016/j.pt.2022.05.008
101. Egwu, CO, Aloke, C, Chukwu, J, Nwankwo, JC, Irem, C, Nwagu, KE, et al. Assessment of the antimalarial treatment failure in Ebonyi state, Southeast Nigeria. J Xenobiot. (2023) 13:16–26. doi: 10.3390/jox13010003
102. Centers for Disease Control and Prevention Malaria vaccine recommended for broader use by WHO: “Best thing since bed nets”. (2023). Center for disease control and prevention (CDC): CDC. Available at: https://www.cdc.gov/
103. Thomson, MC, Mason, SJ, Phindela, T, and Connor, SJ. Use of rainfall and sea surface temperature monitoring for malaria early warning in Botswana. Am J Trop Med Hyg. (2005) 73:214–21. doi: 10.4269/ajtmh.2005.73.214
Keywords: malaria vulnerability, DHS, Mozambique, INLA, Bayesian, climate variability, spatio-temporal, DLNM
Citation: Armando CJ, Rocklöv J, Sidat M, Tozan Y, Mavume AF, Bunker A and Sewes MO (2023) Climate variability, socio-economic conditions and vulnerability to malaria infections in Mozambique 2016–2018: a spatial temporal analysis. Front. Public Health. 11:1162535. doi: 10.3389/fpubh.2023.1162535
Edited by:
Manuela Berto Pucca, Federal University of Roraima, BrazilReviewed by:
Lisele Brasileiro, University of the State of Amazonas, BrazilSewbert Rodrigues Jati, Fundação de Medicina Tropical Doutor Heitor Vieira Dourado (FMT-HVD), Brazil
Jianhai Yin, National Institute of Parasitic Diseases, China
Copyright © 2023 Armando, Rocklöv, Sidat, Tozan, Mavume, Bunker and Sewes. This is an open-access article distributed under the terms of the Creative Commons Attribution License (CC BY). The use, distribution or reproduction in other forums is permitted, provided the original author(s) and the copyright owner(s) are credited and that the original publication in this journal is cited, in accordance with accepted academic practice. No use, distribution or reproduction is permitted which does not comply with these terms.
*Correspondence: Chaibo Jose Armando, Y2phcm1hbmRvLmpvc2VAZ21haWwuY29t
†These authors have contributed equally to this work