 Shuangyan Liu1
 Yun Liu
 Kuai Yu
 Meibian Zhang
- 1School of Public Health, Tongji Medical College, Huazhong University of Science and Technology, Wuhan, Hubei, China
- 2Institute of Occupational Health and Radiation Protection, Zhejiang Provincial Center for Disease Control and Prevention, Hangzhou, Zhejiang, China
- 3Ningbo Center for Disease Control and Prevention, Ningbo, Zhejiang, China
- 4Chinese Center for Disease Control and Prevention, Beijing, China
- 5School of Public Health, Hangzhou Normal University, Hangzhou, Zhejiang, China
Background: Noise energy has been well-established to increase the risk of occupational noise-induced hearing loss (NIHL). However, the role of noise temporal structure (expressed by kurtosis) or its combination with energy metrics (e.g., kurtosis-adjusted cumulative noise exposure, adj-CNE) in occupational NIHL was still unclear.
Methods: A cross-sectional survey of 867 Chinese workers, including 678 metal manufacturing workers and 189 workers exposed to Gaussian noise, was conducted. Noise energy metrics, including LAeq,8h and CNE, kurtosis (β), and adj-CNE were used to quantify noise exposure levels. Noise-induced permanent threshold shift at frequencies 3, 4, and 6 kHz (NIPTS346) and the prevalence of high-frequency NIHL (HFNIHL%) were calculated for each participant. The dose–response relationship between kurtosis or adj-CNE and occupational NIHL was observed.
Results: Among 867 workers, different types of work had specific and independent noise energy and kurtosis values (p > 0.05). HFNIHL% increased with an increase in exposure duration (ED), LAeq,8h, CNE, or kurtosis (p < 0.01), and there were strong linear relationships between HFNIHL% and ED (coefficient of determination [R2] = 0.963), CNE (R2 = 0.976), or kurtosis (R2 = 0.938, when CNE < 100 dB(A)∙year). The “V” shape notching extent in NIPTS became deeper with increasing kurtosis when CNE < 100 dB(A)∙year and reached the notching bottom at the frequency of 4 or 6 kHz. The workers exposed to complex noise (β ≥ 10) had a higher risk of NIHL than those exposed to Gaussian noise (β < 10) at the frequencies of 3, 4, 6, and 8 kHz (OR > 2, p < 0.01). Moreover, HFNIHL% increased with adj-CNE (p < 0.001). There were strong linear relationships between NIHL and adj-CNE or CNE when β ≥ 10 (R2adj-CNE > R2CNE). After CNE was adjusted by kurtosis, average differences in NIPTS346 or HFNIHL% between the complex and Gaussian noise group were significantly reduced (p < 0.05).
Conclusion: Kurtosis was a key factor influencing occupational NIHL among metal manufacturing workers, and its combination with energy metrics could assess the risk of NIHL more effectively than CNE alone.
Introduction
Noise-induced hearing loss (NIHL) caused by accumulated noise exposure, second only to senile deafness in terms of the incidence (1), is one of the major types of sensorineural hearing loss. Worldwide, approximately 5% of the population suffers from NIHL (2). It was estimated that approximately 600 million workers were exposed to harmful noise levels (3), and about 16% of disabling hearing loss in adults could be directly attributed to occupational noise exposure (4). As a major occupational health risk, NIHL has been a global public health problem (5, 6). In the US, NIHL is the most common occupational disease (7). In China, occupational NIHL is the second major occupational disease (8). The prevalence of NIHL (NIHL%) in the transportation and manufacturing industries is between 18 and 67% in low/middle-income countries (9, 10).
The current widely-accepted model of NIHL (ISO-1999, 2013) was established and implemented based on the equal-energy hypothesis (EEH), which assumes that the damage to the auditory system caused by noise exposure is proportional to the duration of exposure multiplied by the noise intensity. That is to say it is independent of the risk of hearing loss and noise’s temporal characteristics. However, in real occupational environments, complex non-Gaussian noise with impulsive components is ubiquitous, and it is composed of a transient high-energy impulsive noise superimposed on stationary (Gaussian) background noise (11). Animal experiments and epidemiological studies suggested that the EEH was not appropriate for the risk assessment of complex noise, and that it might underestimate the effect of occupational complex noise on the risk of NIHL (12–15). Lempert et al. observed the accuracy of ISO-1999 in the risk assessment of NIHL using previous data. They found that ISO-1999 closely predicted neither the distribution of hearing threshold levels nor the database of the National Institute for Occupational Safety and Health, indicating that lower estimates of the risk of NIHL were found using ISO-1999 (16). Despite having the same equivalent sound levels, the damage to the auditory system caused by complex noise was more serious than that caused by Gaussian noise (17). These findings suggest that the role of noise temporal structure in NIHL caused by complex noise should be addressed.
Kurtosis (β), which indirectly reflects the temporal structure of noise exposure, was proposed by Erdreich (18). Kurtosis is the ratio of the fourth-order central moment to the squared second-order central moment of a distribution. It is a statistical metric that simplifies some time-domain variables of noise (e.g., pulse peak value, duration, and inter-pulse distribution) that affect hearing, and is easy to calculate. Animal studies initially showed that besides noise energy, noise kurtosis plays an important role in NIHL development (19, 20). Subsequently, some scholars began to apply kurtosis-adjusted noise energy to assess occupational NIHL among workers. The dose–response relationship between the NIHL% and kurtosis-adjusted cumulative noise exposure (adj-CNE) among workers exposed to complex noise and the validity of adj-CNE have been found in some industries, such as the steel manufacturing, metal fabrication, furniture, automobile, and general equipment manufacturing industries (14, 15, 21, 22). However, these findings on the role of the adj-CNE metric in occupational NIHL need to be validated in a broader range of specific industries.
Herein, a cross-sectional study was designed to validate the role of kurtosis and adj-CNE in occupational NIHL among metal manufacturing workers. These workers exposed to complex noise were selected as subjects, and workers exposed to Gaussian noise from the paper-making and textile industries served as controls. Whether the dose–response relationship between adj-CNE and NIHL was closer to that of Gaussian noise served as a criterion to judge the effectiveness of adj-CNE.
Materials and methods
Subjects
A total of 867 Chinese workers, including 678 metal manufacturing workers and 189 workers exposed to Gaussian noise from the paper-making and textile industries in Zhejiang Province of East China, were continuously selected during 2017 and 2018 for the cross-sectional survey. The inclusion criteria for the subjects were presented in Supplementary Table S1.
Questionnaire survey
According to the needs of the investigation, a uniform questionnaire was designed for each subject. The collected data were shown in Supplementary Table S2. Subjects were interviewed to complete questionnaires by trained investigators and were asked to sign an informed consent form. The study was approved by the ethics committee of the Zhejiang Center for Disease Control and Prevention, China (ZJCDC-T-043-R). All methods were performed following relevant guidelines and regulations.
Noise waveform recording and analysis
The noise exposure data for subjects for the entire shift duration were collected using a digital noise dosimeter (ASV5910-R, Hangzhou Aihua Instrument Co., Ltd.), which can operate continuously at a sampling rate of 48 kHz. The digital noise dosimeter was equipped with a 1/4-inch microphone with a 10–20 kHz frequency response range and a 40–141 dB(A) measurement range. An equivalent continuous A-weighted noise exposure level normalized to an 8-h working day (LAeq,8h) can be measured using the noise dosimeter, which was attached to the participants’ clothing at the shoulder by clips, with the microphone pointing up. After recording noise exposure data, the data were transmitted from the recorder to a computer for subsequent analysis. The noise dosimeter was calibrated using a sound level calibrator (Hangzhou Aihua Instrument, AWA6221B) before and after each sampling cycle. MATLAB software (Natick, MA) calculated the sampling kurtosis by analyzing the shift-long noise. The equation for calculating kurtosis is shown in Formula (1).
is the ith value, is the sample mean, and β is noise kurtosis. Theoretically, the kurtosis value of Gaussian noise is 3 (β = 3) and that of complex non-Gaussian noise is greater than 3. A 40-s window is acceptable for kurtosis measurement based on previous animal data using a similar 48 kHz sampling rate (20, 23). The mean kurtosis calculated in a 40-s window was used as the kurtosis value of the entire shift time. In this study, a mean kurtosis of 10 was used as the boundary value between Gaussian and complex noise (12, 19, 24). Noise with a mean β < 10 was defined as continuous Gaussian noise, and that with a mean β ≥ 10 was defined as complex noise. The greater the kurtosis, the higher the impulsiveness of the complex noise (25).
A comprehensive noise exposure metric (i.e., cumulative noise exposure, CNE), including LAeq,8h and the ED, was used to quantify noise energy for each subject according to Formula (2) (14). By incorporating time-domain variables into the evaluation of complex noise environments and unifying CNE calculations for epidemiological data, including both Gaussian and complex noise, the adj-CNE was calculated according to Formula (3) (14).
T is the ED in years. LAeq,8h is measured in dB(A). The units of CNE and adj-CNE are both dB(A)∙year. When Gaussian noise has a kurtosis of β = 3, the term [] becomes equal to 10. Thus, for Gaussian noise, the adj-CNE equals the unadjusted CNE. Equation (3) shows that when LAeq,8h is fixed, the adj-CNE will be larger for complex noise (β ≥ 10) than for Gaussian noise (β < 10).
Hearing testing and hearing loss diagnosis
Pure-tone audiometry was performed for each participant in a sound-insulation room by experienced audiologists. The test was conducted on the left and right ears at 0.5, 1.0, 2.0, 3.0, 4.0, 6.0, and 8.0 kHz. All subjects were required to be outside their daily noise environment for at least 16 h before the test. Because the worker population in this study was rigorously screened, the pure-tone hearing threshold levels (HTLs) were adjusted according to sex and age by following Annex A, Table A.3, of ISO 1999:2013. In this study, high-frequency NIHL (HFNIHL) was diagnosed as one or more adjusted HTLs, in either ear, at 3, 4, or 6 kHz equal to or higher than 30 dB based on an extensive body of prior research (14, 15, 21, 22, 26, 27). The analysis focused on the noise-sensitive frequency range of 3, 4, and 6 kHz because the noise-induced hearing loss from continuous noise occurs predominantly in this range initially (28). The noise-induced permanent threshold shift at 3.0, 4.0, and 6.0 kHz (NIPTS346) was calculated according to the Annex A of ISO 1999:2013.
Statistical analysis
Continuous variables with normal distribution were expressed as mean ± standard deviation (SD), and categorical variables were presented as percentages. The correlations between kurtosis and LAeq,8h or CNE were described using a scatter diagram and correlation coefficient (r). Considering the effects of work types on kurtosis and LAeq,8h, the partial correlation coefficient between kurtosis and LAeq,8h was calculated after adjusting for work types. The cut-off points for ED (1, 5, 10, 15), CNE (80, 100, 110, 120) and kurtosis (10, 50, 100, 200) were determined based on our previous studies (21, 22). The dose–response relationship between different noise exposure metrics (e.g., LAeq,8h, ED, CNE, kurtosis, and adj-CNE) and the prevalence of HFNIHL (HFNIHL%) was observed by the Cochran-Armitage trend chi-squared test.
The linear and nonlinear relationships between exposure metrics (e.g., ED, CNE, and kurtosis) and HFNIHL% were evaluated using the regression equation, including linear, logarithmic, inverse, quadratic, cubic, composite, power, sigmoid curve, growth, and exponential models. The cut-off value for age was determined based on the receiver operating characteristic (ROC) curve. Subjects were divided into two groups, with an age of 33 years set as the cut-off value. Logistic regression analysis was used to evaluate the role of kurtosis in NIHL% at each frequency, and the effect was presented as odds ratios (OR) with 95% confidence intervals (CI). The differences in NIPTS346 and HFNIHL% between complex noise exposure workers and Gaussian noise exposure workers before and after CNE adjustment by kurtosis were evaluated using paired sample t-test. CNE was further divided into eight subgroups based on the cut-off points of 90, 95, 100, 105, 110, 115, and 120 as shown in our previous studies (21, 22, 27). Herein, the dose–response relationship of Gaussian noise served as a baseline to determine whether adj-CNE could effectively assess NIHL. When p < 0.05, the difference was considered statistically significant.
Results
Noise exposure characteristics and NIHL among manufacturing workers
Table 1 shows the general information, ED, noise energy, and kurtosis among 867 manufacturing workers. Overall, the average age and ED were 35.61 ± 9.45 years and 6.88 ± 6.82 years, with 59.52% of males. The majority of workers were exposed to high noise levels (> 85 dB(A)) and complex noise (β ≥ 10). Among the 678 metal manufacturing workers, the mean LAeq,8h, CNE, kurtosis, and NIPTS346 were 88.02 ± 5.24 dB(A), 93.00 ± 6.71 dB(A)∙year, 40.91 ± 51.22, and 26.60 ± 15.62 dB HL, respectively, with 40.41% of HFNIHL. In detail, forging, grinding, or polishing workers had the highest NIPTS346 (37.23 ± 14.95 dB HL) and the highest HFNIHL% (80.65%). Figure 1 illustrates a positive correlation between LAeq,8h and CNE (rL-C = 0.87, p < 0.001), while no significant correlation between kurtosis and LAeq,8h (rL-K = 0.06, p > 0.05) was found.
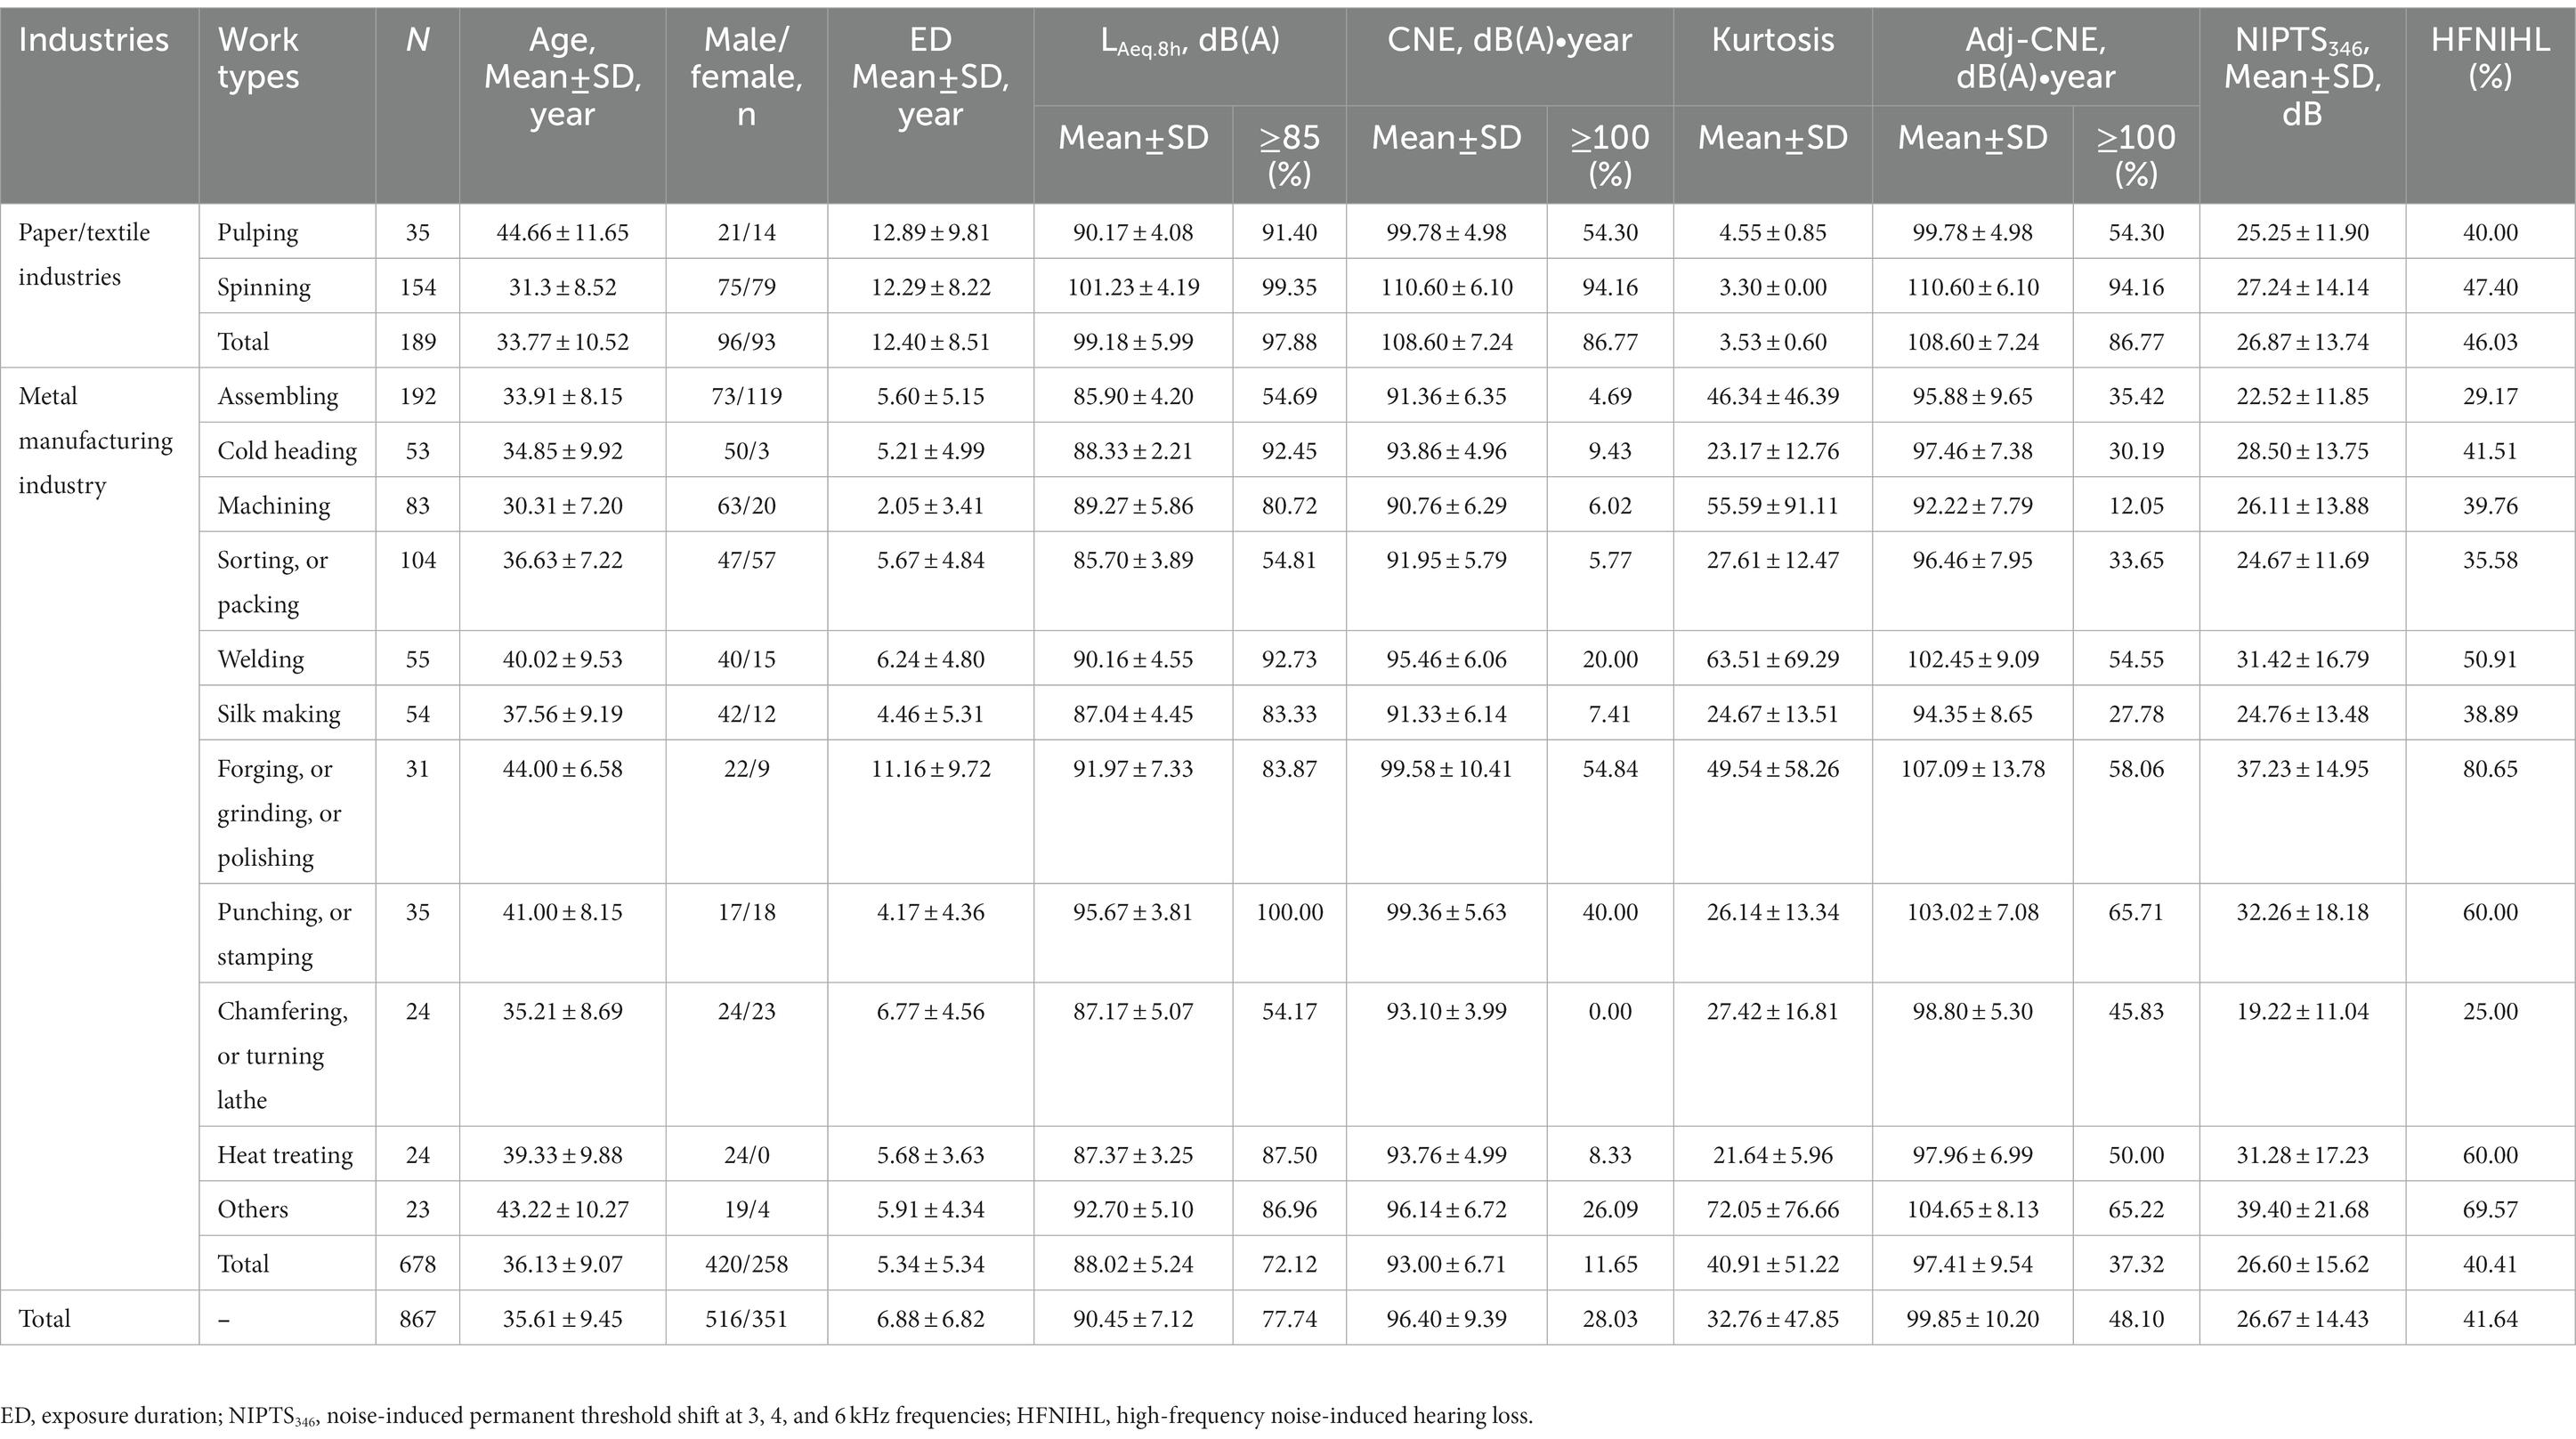
Table 1. General information, noise exposure, NIPTS346 and HFNIHL% for workers from typical work types.
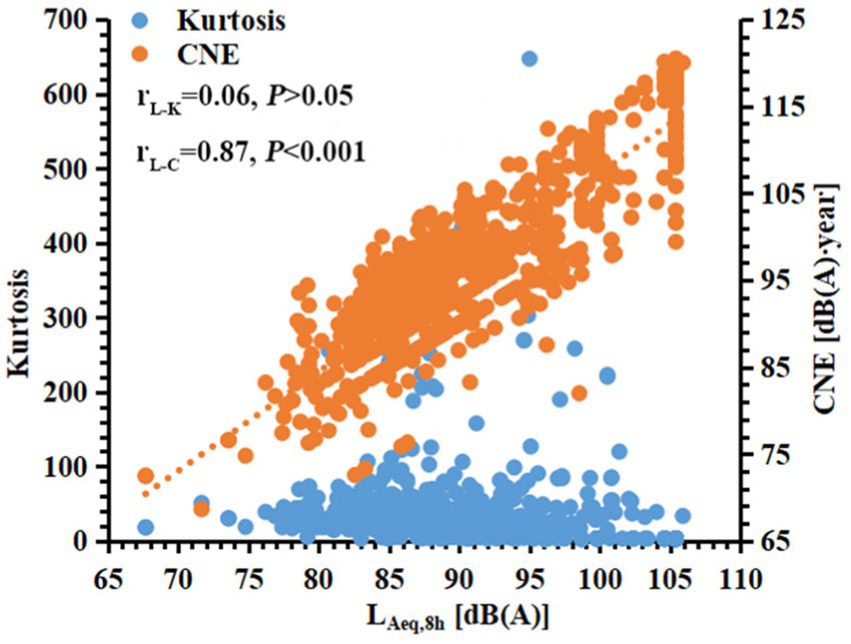
Figure 1. The correlation between kurtosis or CNE and LAeq,8h. rL-K is the partial correlation coefficient between LAeq,8h and kurtosis; rL-C is the linear correlation coefficient between LAeq,8h and CNE.
The role of noise energy and kurtosis in the risk of occupational NIHL
Trend chi-squared test results showed (Table 2) the relationship between HFNIHL% (or NIPTS346) and noise energy metrics (ED, LAeq,8h, and CNE) and kurtosis metric. The mean NIPTS346 and HFNIHL% increased with increasing ED, LAeq,8h, and CNE (p < 0.001). NIPTS346 and HFNIHL% in the complex noise exposure group (β ≥ 10) were much higher than those in the Gaussian noise exposure group (β < 10), and the group with β ≥ 200 had the highest NIPTS346 (40.71 ± 26.87 dB HL) and HFNIHL% (57.14%). HFNIHL% increased with an increase in kurtosis value when CNE < 100 dB(A)∙year (p < 0.01). Moreover, Figures 2A–C show a strong linear relationship between HFNIHL% and ED, CNE, or kurtosis; the linear regression equations were: HFNIHL% = 0.095 ED + 0.179 (coefficient of determination [R2] = 0.963, p < 0.01), HFNIHL% = 0.208 CNE - 0.087 (R2 = 0.976, p < 0.01), and HFNIHL% = 0.084 β + 0.147 (R2 = 0.938, p < 0.01, when CNE < 100 dB(A)∙year), respectively. The order of R2 was: R2CNE > R2ED > R2kurtosis. The results of nonlinear regression analyses showed that quadratic regressions for ED or CNE and sigmoid curve regression for kurtosis show a better fit than the other nonlinear models (Supplementary Table S3). The quadratic regression equations for ED and CNE were: HFNIHL% = 0.263 + 0.022 ED + 0.012 ED2 (R2’ED = 0.985, p < 0.05), HFNIHL% = 0.048 + 0.092 CNE + 0.019 CNE2 (R2’CNE = 0.988, p < 0.05), respectively. The sigmoid curve regression equation for kurtosis was: HFNIHL% = exp. (−0.426–1.202/β) (R2’kurtosis = 0.968, p < 0.05, when CNE < 100 dB(A)∙year). The order of R2’ was: R2’CNE > R2’ED > R2’kurtosis.
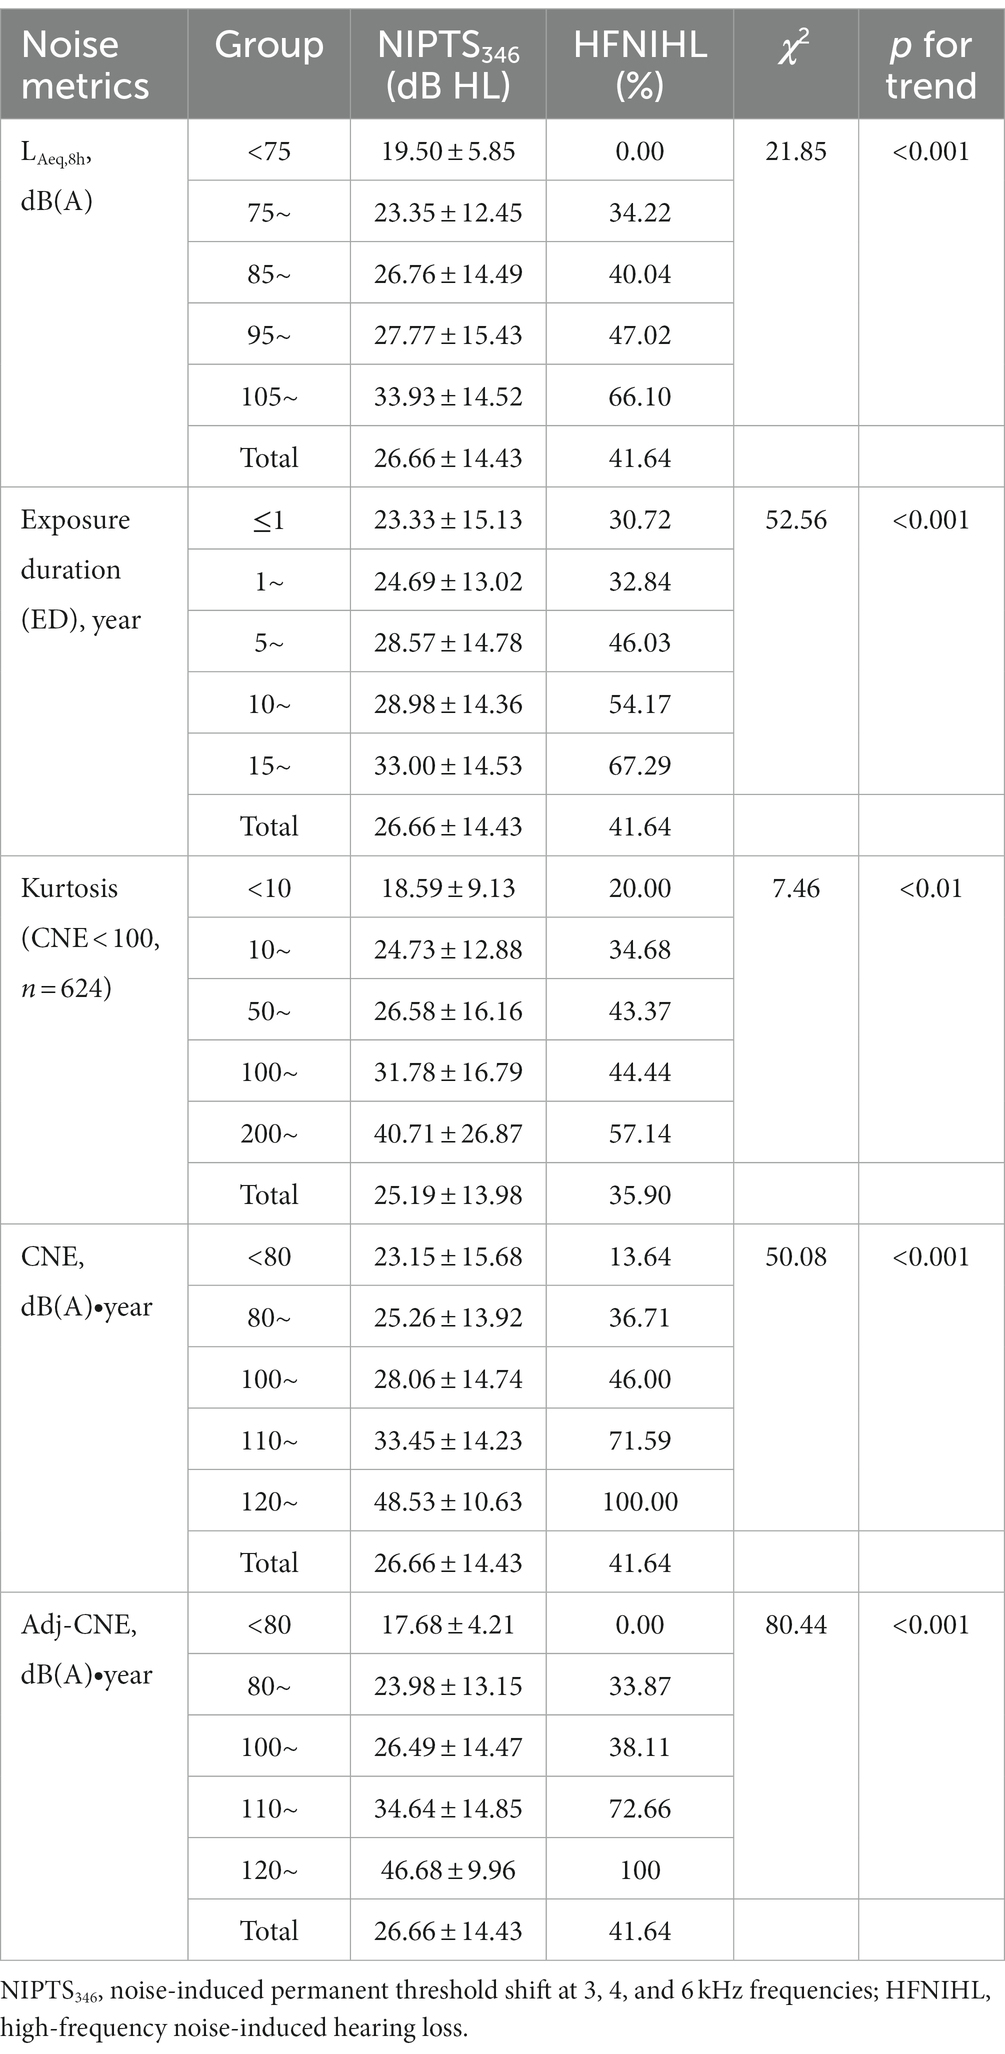
Table 2. Relationship between prevalence of HFNIHL and noise exposure characteristics using the trend chi-squared test.
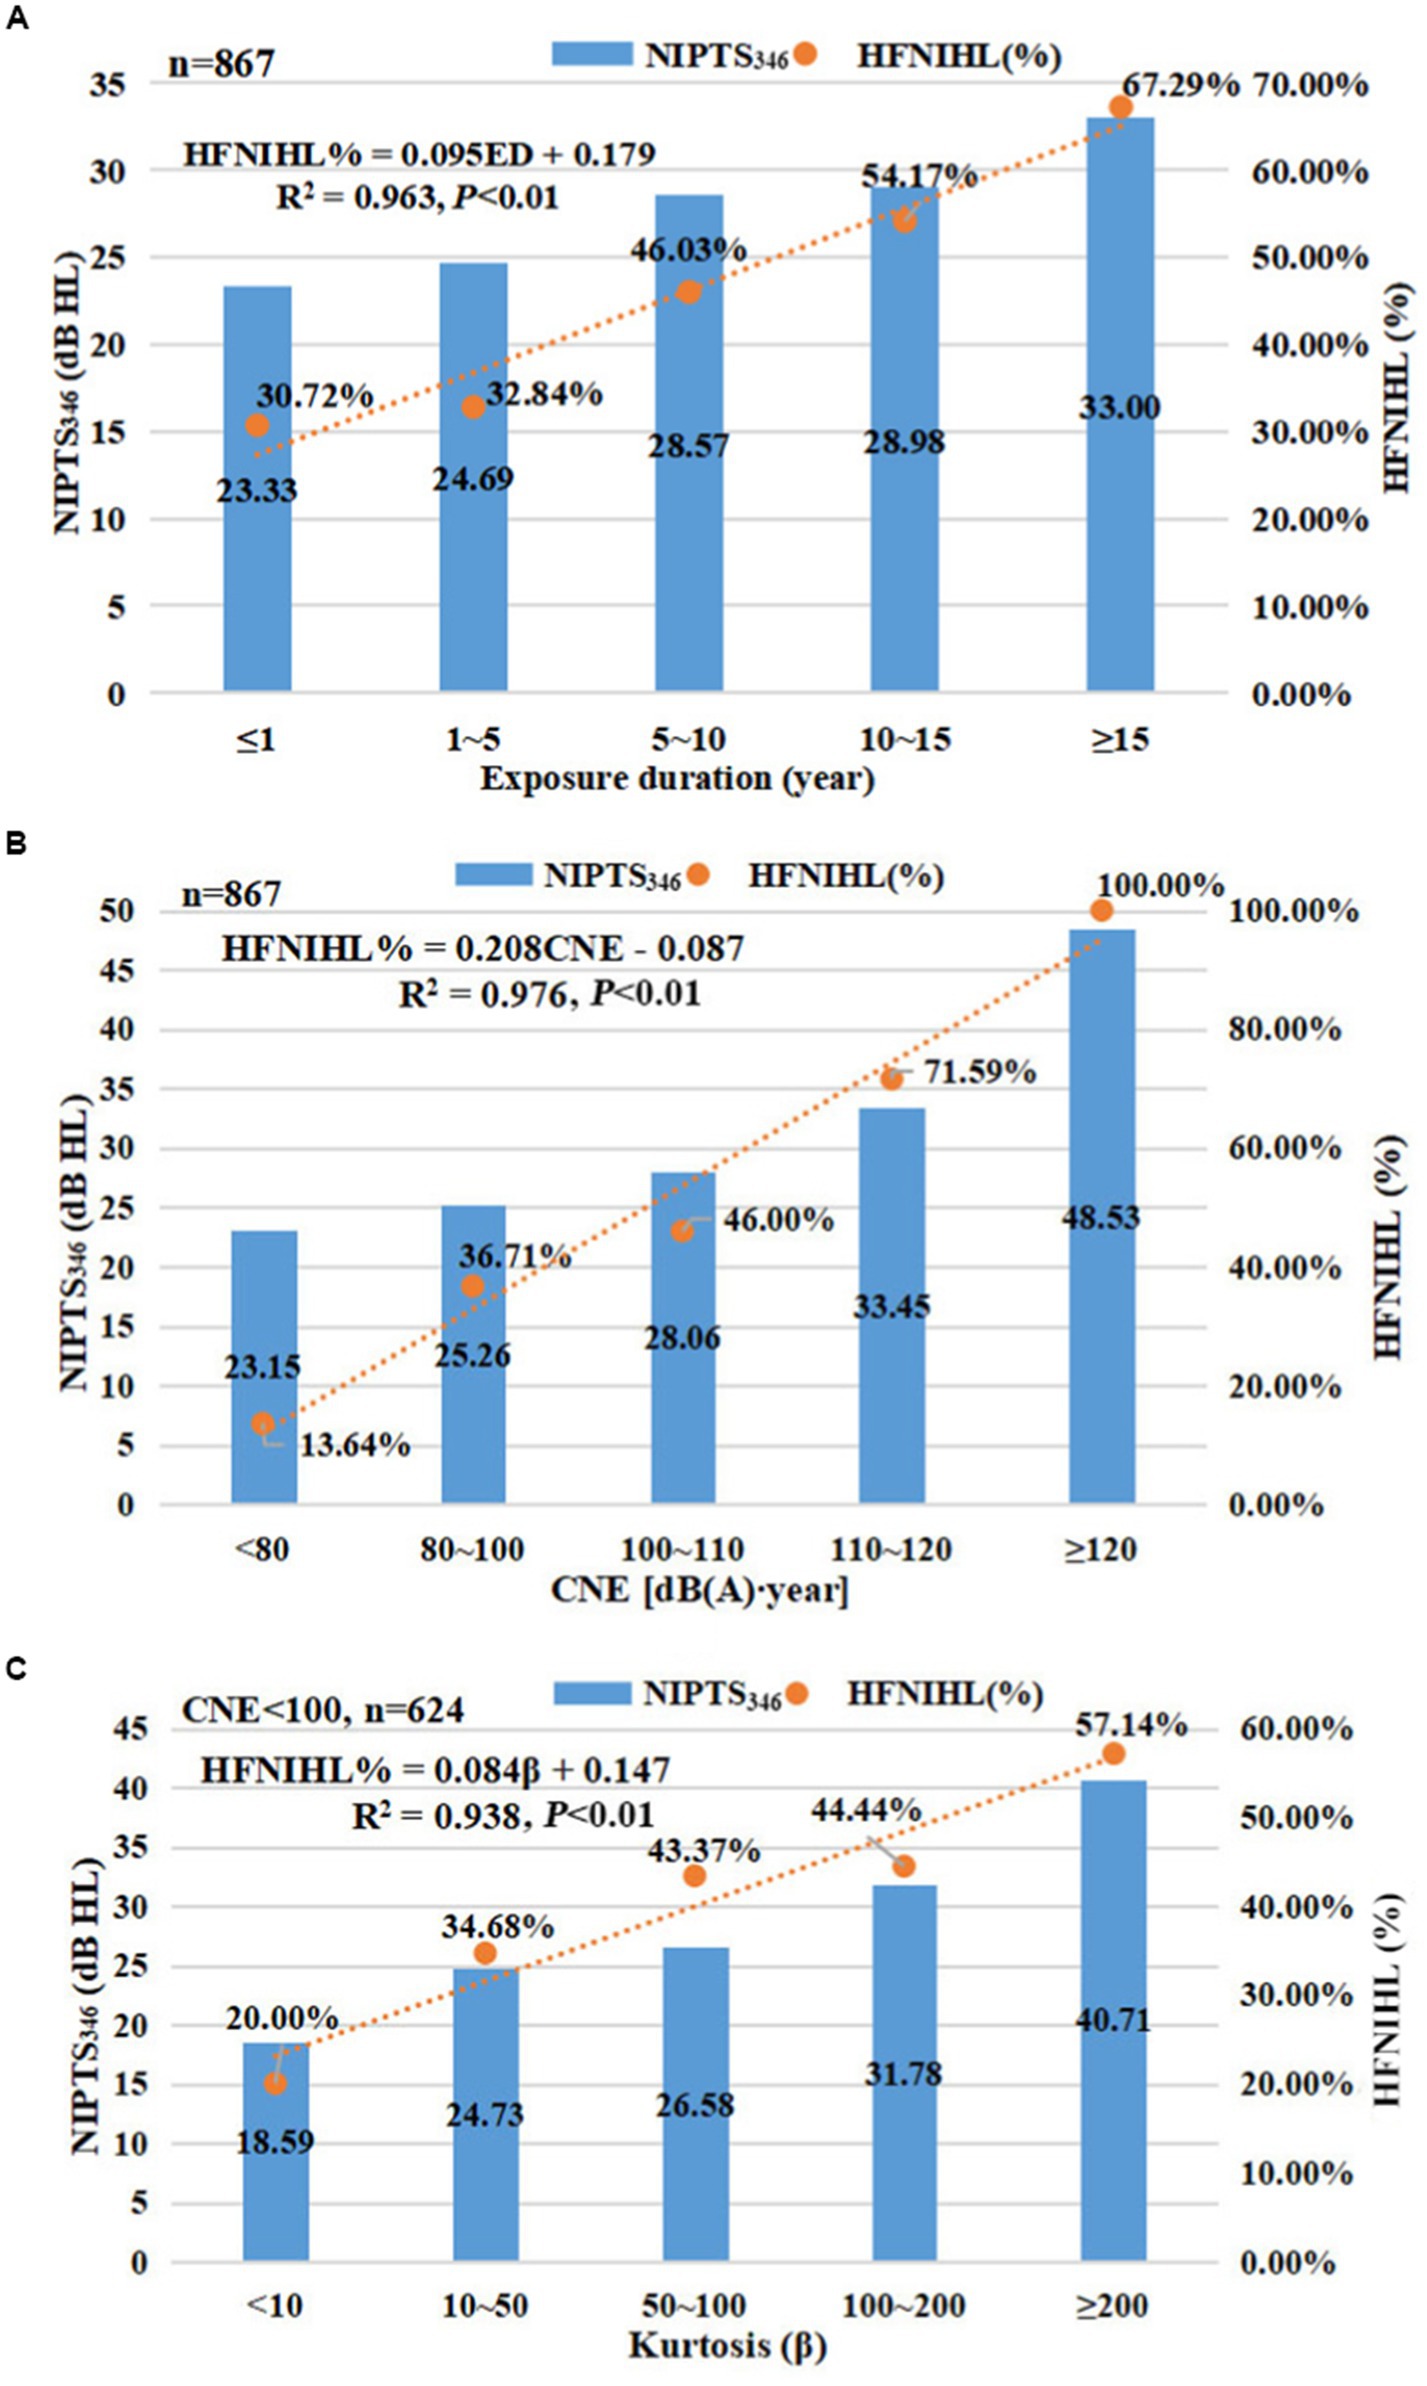
Figure 2. The linear relationship between ED, CNE, or kurtosis and HFNIHL%. (A) There was a strong linear relationship between ED and HFNIHL%, and the linear regression equations was: HFNIHL% = 0.095 ED + 0.179 (R2 = 0.963); (B) There was a strong linear relationship between CNE and HFNIHL%, and the linear regression equations was: HFNIHL% = 0.208 CNE + 0.087 (R2 = 0.976); (C) There was a strong linear relationship between kurtosis and HFNIHL% when CNE < 100 dB(A).year, and the linear regression equations was: HFNIHL% = 0.084 β + 0.147 (R2 = 0.938). ED: exposure duration; NIPTS346: noise-induced permanent threshold shift at 3, 4, and 6 kHz frequencies; HFNIHL: high-frequency noise-induced hearing loss.
Figure 3A demonstrates that the mean NIPTS among 624 manufacturing workers with CNE < 100 dB(A)∙year gradually increased with frequencies from 0.5 kHz to 4 or 6 kHz, and gradually recovered at 8 kHz. The mean NIPTS curves exhibited a typical “V” shape notch across different frequencies. The notching extent became deeper with increasing kurtosis value and reached the notching bottom at the frequency of 4 or 6 kHz. Furthermore, Figures 3B–E show the notching phenomenon in NITPS stratified by age and sex among workers with CNE < 100 dB(A)∙year. The notching extent became deeper with the increase of kurtosis value and reached the notching bottom at the frequency of 4 or 6 kHz among workers in different age groups or male workers (Figures 3B–D). The phenomenon among female workers was not evident (Figure 3E).
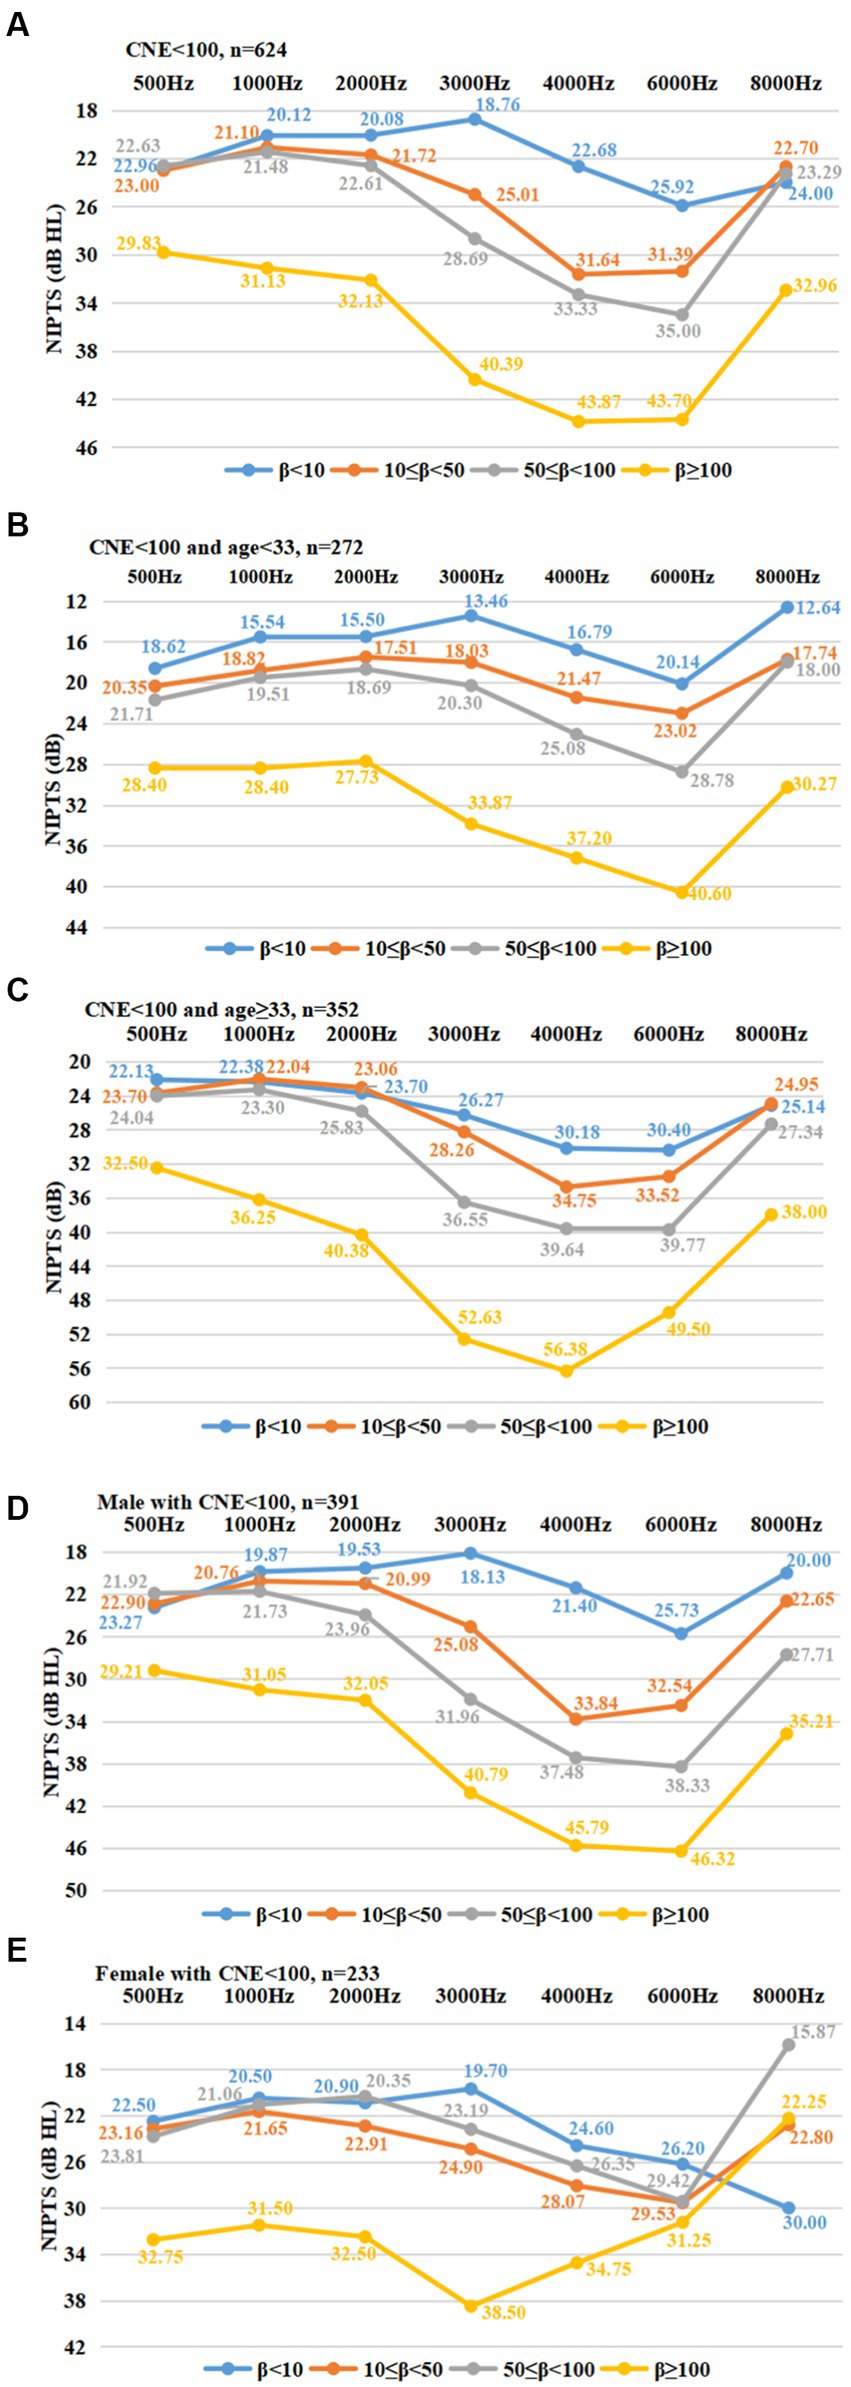
Figure 3. The notch at the high frequencies in NIPTS associated with kurtosis. (A): A “V” shape notching phenomenon in NIPTS among workers with CNE < 100 dB(A)∙year. The notching extent became deeper with increasing kurtosis value, and reached the notching bottom at the frequency of 4 or 6 kHz; (B): A “V” shape notching phenomenon in NIPTS among workers with CNE < 100 dB(A)∙year and age < 33 years. The notching extent became deeper with increasing kurtosis value, and reached the notching bottom at the frequency of 6 kHz; (C): A “V” shape notching phenomenon in NIPTS among workers with CNE < 100 dB(A)∙year and age ≥ 33 years. The notching extent became deeper with increasing kurtosis value, and reached the notching bottom at the frequency of 4 or 6 kHz; (D): A “V” shape notching phenomenon in NIPTS among male workers with CNE < 100 dB(A)∙year. The notching extent became deeper with increasing kurtosis value, and reached the notching bottom at the frequency of 4 or 6 kHz; (E): There was no the “V” shape notching phenomenon in NIPTS among female workers with CNE < 100 dB(A)∙year. NIPTS: noise-induced permanent threshold shift at each frequency.
In Table 3, the role of kurtosis in NIHL% at each frequency was evaluated using logistic regression analysis. The results demonstrated that with adjustment for age, sex, and CNE, there was a significant difference in the risk of NIHL between workers exposed to complex noise (β ≥ 10) and Gaussian noise (β < 10) at frequencies of 3, 4, 6, and 8 kHz (p < 0.05). The workers exposed to complex noise had a higher risk of NIHL than those exposed to Gaussian noise (OR > 2, p < 0.05). No significant differences were found in the NIHL% between complex noise exposure workers and Gaussian noise exposure workers at 0.5, 1, and 2 kHz (p > 0.05).
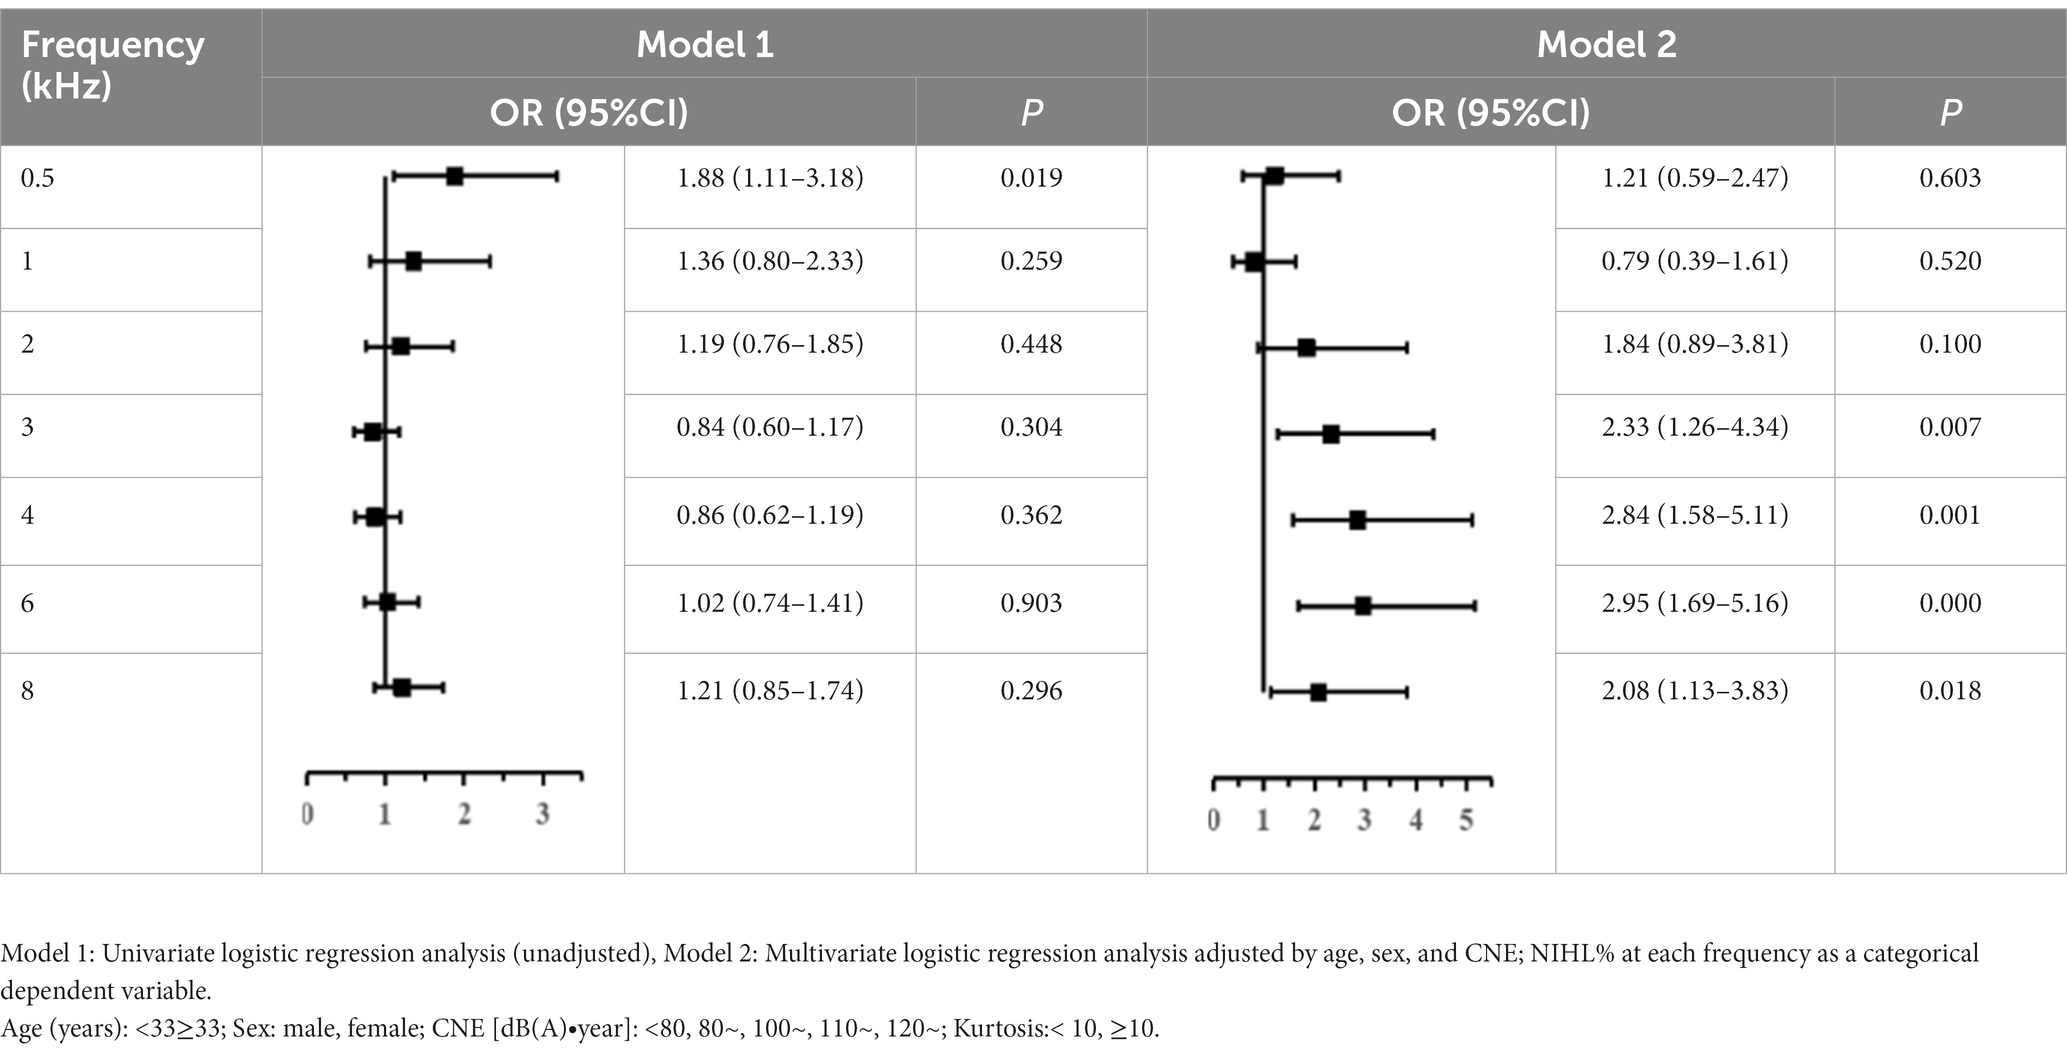
Table 3. The role of kurtosis in NIHL% at each frequency using logistic regression analysis.
The effectiveness of adj-CNE in evaluating occupational NIHL
Table 1 shows that the mean adj-CNE among 867 manufacturing workers was 99.85 ± 10.20 dB(A)∙year. Table 2 shows that the mean NIPTS346 level and HFNIHL% were the highest in the group with adj-CNE greater than 120 dB(A)∙year (48.53 ± 10.63 dB HL). The group with adj-CNE less than 80 dB(A)∙year had the lowest NIPTS346 (23.15 ± 15.68 dB HL) and HFNIHL% (13.67%), and HFNIHL% increased with increasing adj-CNE (p < 0.001). Figure 4 illustrates a strong linear relationship between NIHL and CNE or adj-CNE when β ≥ 10. The two linear regression equations between NIPTS346 and CNE or adj-CNE were: NIPTS346 = 10.638 CNE + 7.202 (R2 = 0.922), and NIPTS346 = 7.313 adj-CNE + 9.135 (R2 = 0.973), respectively (Figure 4A). The two linear regression equations between HFNIHL% and CNE or adj-CNE were: HFNIHL% = 0.235 CNE-0.068 (R2 = 0.946), and HFNIHL% = 0.241 adj-CNE-0.215 (R2 = 0.979), respectively (Figure 4B). The R2 was increased after CNE was adjusted with kurtosis using NIPTS346 or HFNIHL% as the targeted effect. Table 4 demonstrates the calculated differences in NIPTS346 and HFNIHL% among Gaussian and complex noise-exposed workers before and after CNE adjustment by kurtosis. When mean NIPTS346 and HENIHL% were evaluated using unadjusted CNE, significant differences between the complex and Gaussian noise groups were observed (p < 0.05). However, after CNE was adjusted by kurtosis, these differences were diminished significantly (p < 0.05), i.e., the average difference in NIPTS346 decreased to 5.8 dB HL from 11.44 dB HL, and the average difference in HFNIHL% declined to 12.89% from 25.39% (p < 0.05).
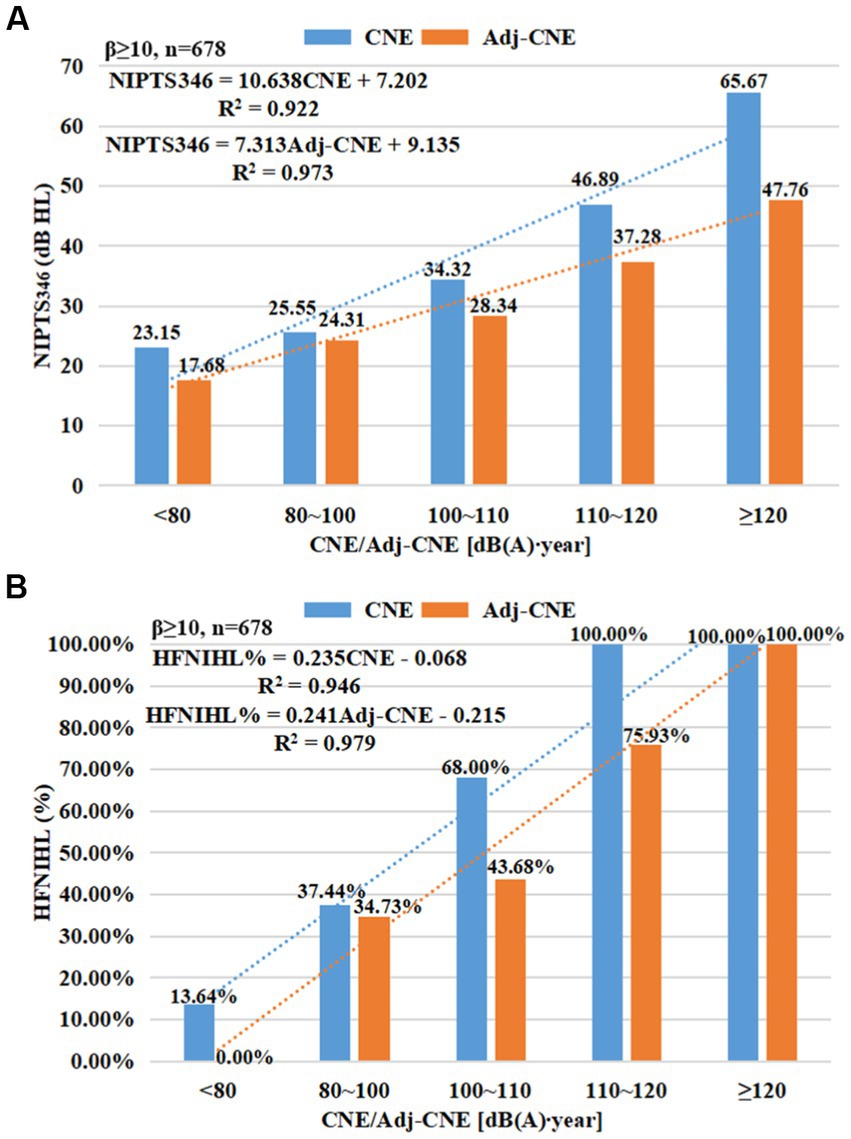
Figure 4. The linear relationships between NIHL and CNE before and after adjustment by kurtosis. (A): an increase of R2 from 0.922 to 0.973 after CNE adjusted with kurtosis using NIPTS346 as targeted effect; (B): an increase of R2 from 0.946 to 0.979 after CNE adjusted with kurtosis using HFNIHL% as targeted effect.

Table 4. Differences in NIHL between complex noise and Gaussian noise before and after adjustment by kurtosis.
Discussion
This study focused on the role of noise kurtosis (an indirect indicator for noise’s temporal structure) and adj-CNE in occupational NIHL among metal manufacturing workers. The results showed that the effect of noise temporal structure on occupational NIHL associated with complex noise should not be ignored in the metal manufacturing industry. After complex noise’s CNE was adjusted by kurtosis, its dose–response relationship with NIHL was closer to that of Gaussian noise. It indicates that as an auxiliary metric, kurtosis combined with noise energy metrics is a new indicator that could effectively evaluate the risk of occupational NIHL.
Each type of work in the metal manufacturing industry had a specific noise exposure level (e.g., LAeq,8h, CNE), kurtosis value, and NIHL%. High levels of LAeq,8h [88.02 ± 5.24 dB(A)] and noise’s temporal complexity (40.91 ± 51.22), with relatively high NIPTS346 (26.67 ± 14.43 dB HL) and HFNIHL% (40.41%) were found in metal manufacturing industries, which were consistent with previous studies (14, 24, 26). These studies reported that 62.53% of automotive manufacturing workers in China were exposed to noise levels that exceeded 85 dB(A), with HFNIHL% of 28.82, and 65.6% of metal manufacturing workers in China had HFNIHL, with a higher LAeq,8h level (95.25 ± 3 dB(A)). One systematic review on occupational workers from the oil field, electrolytic aluminum, and automobile industries found that the NIHL% in China was 21.3%, with HFNIHL of 30.2% and LAeq,8h level of 98.4 ± 7.2 dB(A) (29). Another showed that 23,261 workers from manufacturing and mining industries, including forging, riveting, stamping, casting, drilling, molding, finishing, pressing, assembling, welding, grinding, smashing, steel rolling, wood sawing, and machine testing, were exposed to 88.7 ± 6.9 dB(A) noise levels, with a higher kurtosis value of 40.3 ± 79.5 and HFNIHL% of 34.2% (30).
HFNIHL% increased with increasing ED, LAeq,8h, CNE, or kurtosis. Strong linear and nonlinear relationships between HFNIHL% and ED, CNE, or kurtosis (when CNE < 100 dB(A)∙year) were observed, and the order of their R2 was: R2CNE > R2ED > R2kurtosis. A study on 2,333 manufacturing workers from 34 industries in China showed that HFNIHL% increased with increasing kurtosis values and LAeq,8h, and the R2 values of linear regression equations between kurtosis or LAeq,8h and HFNIHL% were 0.911(when CNE < 100 dB(A)∙year) and 0.988, respectively (19). These studies indicate that noise energy metrics contributed the most to NIHL, followed by kurtosis. Furthermore, Figure 1 shows no correlation between kurtosis and LAeq,8h, which suggests that noise energy and temporal structure were independent factors and might be combined into one index. In this study, the effect of kurtosis on mean NIPTS across different frequencies was further explored among metal manufacturing workers at not very high noise energy levels (e.g., CNE < 100 dB(A)∙year). The typical ‘V’ shape notching extent in mean NIPTS became deeper with an increase in kurtosis value; It reached the notching bottom at the frequency of 4 or 6 kHz among workers in different age groups or male workers, which may be explained by the pathways that greater NIPTS and outer hair cell damage were observed at 4 kHz octave band of noise than those at 0.5 kHz octave band of noise among chinchilla (31), who has a similar auditory system to humans (32). The possible reason for the ‘V’ shape notching only in males may be that the male workers suffered more significant HFNIHL% caused by complex noise than females (33), and they were more likely exposed to complex noise environments such as punching, stamping, metalworking, woodworking, and nail gunning (34). Besides, one study of 1,404 Chinese manufacturing workers reported similar findings that the V- or U-shaped notch phenotypes of NIPTS broadens and deepens with increasing kurtosis, even widened to 1–8 kHz when β > 100 (27). Notably, the kurtosis-associated notch initially occurred at high frequencies and reached the notching bottom at 4 or 6 kHz, with the notch range of 3–8 kHz when β < 10, indicating that noise exposure led to greater hearing loss at high frequencies. A highly complex temporal structure aggravated the development of NIHL at high frequencies. Another study of 1962 Chinese manufacturing workers (CNE < 100 dB(A)∙year) found that the average NIPTS increased gradually with frequencies from 0.5 kHz to 4 kHz and gradually decreased at 8 kHz, and the notching extent in NIPTS at the high frequencies 3, 4, and 6 kHz became deeper with kurtosis and reached the notching bottom at 4 kHz (19). These results supported the present study.
Moreover, logistic regression analysis suggested that after adjusting for age, sex, and CNE, kurtosis greater than 10 led to a higher risk for NIHL than that less than 10 since the OR value was greater than 2 at the frequency of 3, 4, 6, or 8 kHz, which suggested that complex noise was more harmful to the auditory system than Gaussian noise; There was an independent effect of kurtosis on NIHL development after controlling for CNE and age. These results agreed with previous studies (15, 17, 24, 27). For example, Zhao et al. found that workers exposed to complex noise had a higher risk of NIHL than those exposed to Gaussian noise (OR = 1.806) (24). A meta-analysis of 71, 865 Chinese manufacturing workers suggested that complex noise contributed to greater HFNIHL% than Gaussian noise (OR = 1.95) (29). Shi et al. also reported that workers exposed to complex noise were at a higher risk of HFNIHL than Gaussian noise-exposed workers (OR = 2.20) (30). A number of animal experiments observed that using only noise energy metrics for assessing NIHL caused by complex noise may underestimate the extent of hearing trauma (20, 23, 35, 36). Several human investigations confirmed these animal test results (13–15, 37). Moreover, the kurtosis-associated risks of NIHL at high frequencies of 3, 4, 6, and 8 kHz were in line with the findings that greater hearing loss (75 dB) caused by noise exposure alone was observed at high frequencies than that at lower frequencies (40 dB) (38). These findings indicate that CNE, as a comprehensive metric comprising LAeq,8h and exposure duration, was a major but not a unique determinant for NIHL. The effect of noise temporal structure on NIHL should not be ignored.
Considering the contribution of energy and kurtosis to NIHL, some correction methods, in which kurtosis was used to adjust noise energy, have been developed, such as the adjustment method against exposure duration of noise and the correction method against LAeq,8h (14, 39). This study used the correction method that uses kurtosis to adjust exposure duration. The adj-CNE was a new index for quantifying complex noise exposure. The forging, grinding, or polishing workers with the highest adj-CNE level (when β ≥ 10) had the highest NIPTS346 and HFNIHL%. NIPTS346 and HFNIHL% increased with increasing adj-CNE, and a better dose–response relationship for complex noise exposure was observed between adj-CNE and HFNIHL% or NIPTS346 than between CNE and HFNIHL% or NIPTS346. Table 4 illustrates that the average difference in NIPTS346 or HFNIHL% between complex noise and Gaussian noise for adj-CNE was significantly reduced as compared with CNE, indicating that the dose–response relationship between adj-CNE and NIHL associated with complex noise became close to the dose–response relationship of Gaussian noise (served as a baseline). These findings were supported by previous studies (14, 15, 21, 22). A study among 341 steel and textile manufacturing workers found that adj-CNE improved the correlation with NIHL and provided a single metric for dose–response effects across different types of noise (15). Zhao et al. recruited 195 workers from a textile manufacturing plant and a metal fabrication facility in China. They found that the two dose–response lines between the NIHL% and adj-CNE for complex noise almost overlapped with those for Gaussian noise (14). A study on 2,898 manufacturing workers from Zhejiang Province, China, indicated that after CNE was adjusted by kurtosis, the difference in average HFNIHL% between complex and Gaussian noise was significantly reduced from 7.40 to 1.28%, and the two regression curves nearly overlapped (21). The 3,102 Chinese manufacturing workers also supported this point (22). These results suggest that adj-CNE, a comprehensive metric combining noise energy and temporal structure, can assess the risk of occupational NIHL across different types of noise more effectively than CNE alone.
Two limitations merit consideration in this study. One limitation is that the typical ‘V’ shape notching phenomenon among female workers was not found. The reason may be that the number of females (n = 233) among the enrolled 867 manufacturing workers was too small. Another is that we judged the effectiveness of adj-CNE using only the dose–response relationship between adj-CNE and NIPTS346 or HFNIHL%. It is necessary to develop multiple methods to confirm the role of adj-CNE in epidemiological investigations with larger sample sizes.
Conclusion
Besides noise energy, noise kurtosis was a key factor influencing occupational NIHL among metal manufacturing workers. After complex noise’s CNE was adjusted by kurtosis, its dose–response relationship with NIHL was closer to that of Gaussian noise, indicating that adj-CNE could assess the risk of NIHL more effectively than CNE alone. More epidemiological investigations with a wide range of specific manufacturing industries are needed to confirm the validity of the adj-CNE metric for assessing NIHL.
Data availability statement
The raw data supporting the conclusions of this article will be made available by the authors, without undue reservation.
Ethics statement
The studies involving human participants were reviewed and approved by the Ethics Committee of the Zhejiang Center for Disease Control and Prevention, China (ZJCDC-T-043-R). The patients/participants provided their written informed consent to participate in this study.
Author contributions
SYL conducted the statistical analysis and wrote the manuscript. SL oversaw data analysis and interpretation. JRX, YL, and PYQ checked data and the results of analysis. JRX and YQC carried out the experiment. MBZ was responsible for data collection and the final manuscript. MZ was responsible for data collection and the final manuscript. All authors approved the final manuscript.
Funding
This work was supported by the Pre-research project on occupational health standards (20210102); the National Institutes of Health, National Institute on Deafness and Other Communication Disorders, United States (1R01DC015990); and the Fundamental Research Funds for the Central University (YCJJ202201031).
Acknowledgments
The authors thank all the participants and institutions for contributing to this study.
Conflict of interest
The authors declare that the research was conducted in the absence of any commercial or financial relationships that could be construed as a potential conflict of interest.
Publisher’s note
All claims expressed in this article are solely those of the authors and do not necessarily represent those of their affiliated organizations, or those of the publisher, the editors and the reviewers. Any product that may be evaluated in this article, or claim that may be made by its manufacturer, is not guaranteed or endorsed by the publisher.
Supplementary material
The Supplementary material for this article can be found online at: https://www.frontiersin.org/articles/10.3389/fpubh.2023.1159348/full#supplementary-material
References
1. Wan, L, Wang, B, Zhang, J, Zhu, B, and Pu, Y. Associations of genetic variation in glyceraldehyde 3-phosphate dehydrogenase gene with noise-induced hearing loss in a Chinese population: a case-control study. Int J Environ Res Public Health. (2020) 17:2899. doi: 10.3390/ijerph17082899
2. Sha, SH, and Schacht, J. Emerging therapeutic interventions against noise-induced hearing loss. Expert Opin Investig Drugs. (2017) 26:85–96. doi: 10.1080/13543784.2017.1269171
3. Soltanzadeh, A, Ebrahimi, H, Fallahi, M, Kamalinia, M, Ghassemi, S, and Golmohammadi, R. Noise induced hearing loss in Iran: (1997-2012): systematic review article. Iran J Public Health. (2014) 43:1605–15.
4. Beyan, AC, Demiral, Y, Cimrin, AH, and Ergor, A. Call centers and noise-induced hearing loss. Noise Health. (2016) 18:113–6. doi: 10.4103/1463-1741.178512
5. Basner, M, Babisch, W, Davis, A, Brink, M, Clark, C, Janssen, S, et al. Auditory and non-auditory effects of noise on health. Lancet. (2014) 383:1325–32. doi: 10.1016/s0140-6736(13)61613-x
6. Le, TN, Straatman, LV, Lea, J, and Westerberg, B. Current insights in noise-induced hearing loss: a literature review of the underlying mechanism, pathophysiology, asymmetry, and management options. J Otolaryngol Head Neck Surg. (2017) 46:41. doi: 10.1186/s40463-017-0219-x
7. Mathias Duarte, AS, Guimarães, AC, de Carvalho, GM, Pinheiro, LA, Yen Ng, RT, Sampaio, MH, et al. Audiogram comparison of workers from five professional categories. Biomed Res Int. (2015) 2015:201494:1–5. doi: 10.1155/2015/201494
8. Zhang, S, Ding, E, Yin, H, Zhang, H, and Zhu, B. Research and discussion on the relationships between noise-induced hearing loss and Atp2b2 gene polymorphism. Int J Genomics. (2019) 2019:5048943. doi: 10.1155/2019/5048943
9. Fuente, A, and Hickson, L. Noise-induced hearing loss in Asia. Int J Audiol. (2011) 50:S3–S10. doi: 10.3109/14992027.2010.540584
10. Nandi, SS, and Dhatrak, SV. Occupational noise-induced hearing loss in India. Indian J Occup Environ Med. (2008) 12:53–6. doi: 10.4103/0019-5278.43260
11. Clark, WW, Bohne, BA, and Boettcher, FA. Effect of periodic rest on hearing loss and Cochlear damage following exposure to noise. J Acoust Soc Am. (1987) 82:1253–64. doi: 10.1121/1.395261
12. Davis, RI, Qiu, W, and Hamernik, RP. Role of the kurtosis statistic in evaluating complex noise exposures for the protection of hearing. Ear Hear. (2009) 30:628–4. doi: 10.1097/AUD.0b013e3181b527a8
13. Davis, RI, Qiu, W, Heyer, NJ, Qiuling Yang, MS, Li, N, Zhao, Y, et al. The use of the kurtosis metric in the evaluation of occupational hearing loss in Workers in China: implications for hearing risk assessment. Noise Health. (2012) 14:330–2. doi: 10.4103/1463-1741.104903
14. Zhao, YM, Qiu, W, Zeng, L, Chen, SS, Cheng, XR, Davis, RI, et al. Application of the kurtosis statistic to the evaluation of the risk of hearing loss in workers exposed to high-level complex noise. Ear Hear. (2010) 31:527–2. doi: 10.1097/AUD.0b013e3181d94e68
15. Xie, HW, Qiu, W, Heyer, NJ, Zhang, MB, Zhang, P, Zhao, YM, et al. The use of the kurtosis-adjusted cumulative noise exposure metric in evaluating the hearing loss risk for complex noise. Ear Hear. (2016) 37:312–3. doi: 10.1097/aud.0000000000000251
16. Lempert, B. Iso estimates of noise-induced hearing impairment. J Acoust Soc Am. (2019) 145:3640–6. doi: 10.1121/1.5111862
17. Zhao, Y, Tian, Y, Zhang, M, Li, J, and Qiu, W. Development of an automatic classifier for the prediction of hearing impairment from industrial noise exposure. J Acoust Soc Am. (2019) 145:2388–00. doi: 10.1121/1.5096643
18. Erdreich, J. A distribution based definition of impulse noise. J Acoust Soc Am. (1986) 79:990–8. doi: 10.1121/1.393698
19. Zhang, M, Xie, H, Zhou, J, Sun, X, Hu, W, Zou, H, et al. New metrics needed in the evaluation of hearing Hazard associated with industrial noise exposure. Ear Hear. (2020) 42:290–11. doi: 10.1097/aud.0000000000000942
20. Qiu, W, Hamernik, RP, and Davis, RI. The value of a kurtosis metric in estimating the Hazard to hearing of complex industrial noise exposures. J Acoust Soc Am. (2013) 133:2856–66. doi: 10.1121/1.4799813
21. Zhang, M, Gao, X, Qiu, W, Sun, X, and Hu, W. The role of the kurtosis metric in evaluating the risk of occupational hearing loss associated with complex noise - Zhejiang Province, China, 2010-2019. China CDC Wkly. (2021) 3:378–2. doi: 10.46234/ccdcw2021.103
22. Zhang, M, Qiu, W, Xie, H, Xu, X, Shi, Z, Gao, X, et al. Applying kurtosis as an indirect metric of noise temporal structure in the assessment of hearing loss associated with occupational complex noise exposure. Ear Hear. (2021) 42:1782–96. doi: 10.1097/aud.0000000000001068
23. Hamernik, RP, Qiu, W, and Davis, B. Hearing loss from interrupted, intermittent, and time varying non-Gaussian noise exposure: the applicability of the equal energy hypothesis. J Acoust Soc Am. (2007) 122:2245–54. doi: 10.1121/1.2775160
24. Zhao, T, Wang, Y, Li, Z, Xu, X, Lei, S, Huang, L, et al. Associations of noise kurtosis, genetic variations in Nox3 and lifestyle factors with noise-induced hearing loss. Environ Health. (2020) 19:13. doi: 10.1186/s12940-020-0566-3
25. Pourbakht, A, and Yamasoba, T. Cochlear damage caused by continuous and intermittent noise exposure. Hear Res. (2003) 178:70–8. doi: 10.1016/s0378-5955(03)00039-x
26. Chen, Y, Zhang, M, Qiu, W, Sun, X, Wang, X, Dong, Y, et al. Prevalence and determinants of noise-induced hearing loss among Workers in the Automotive Industry in China: a pilot study. J Occup Health. (2019) 61:387–7. doi: 10.1002/1348-9585.12066
27. Xin, J, Shi, Z, Qian, P, Liu, S, Hao, Y, Gao, X, et al. Effectiveness of kurtosis-adjusted cumulative noise exposure in assessing occupational hearing loss associated with complex noise. Ear Hear. (2023) Publish Ahead of Print. doi: 10.1097/aud.0000000000001327
28. Lie, A, Skogstad, M, Johannessen, HA, Tynes, T, Mehlum, IS, Nordby, KC, et al. Occupational noise exposure and hearing: a systematic review. Int Arch Occup Environ Health. (2016) 89:351–2. doi: 10.1007/s00420-015-1083-5
29. Zhou, J, Shi, Z, Zhou, L, Hu, Y, and Zhang, M. Occupational noise-induced hearing loss in China: a systematic review and Meta-analysis. BMJ Open. (2020) 10:e039576. doi: 10.1136/bmjopen-2020-039576
30. Shi, Z, Zhou, J, Huang, Y, Hu, Y, Zhou, L, Shao, Y, et al. Occupational hearing loss associated with non-Gaussian noise: a systematic review and Meta-analysis. Ear Hear. (2021) 42:1472–84. doi: 10.1097/aud.0000000000001060
31. Harding, GW, and Bohne, BA. Relation of focal hair-cell lesions to noise-exposure parameters from a 4- or a 0.5-Khz octave band of noise. Hear Res. (2009) 254:54–63. doi: 10.1016/j.heares.2009.04.011
32. Trevino, M, Lobarinas, E, Maulden, AC, and Heinz, MG. The Chinchilla animal model for hearing science and noise-induced hearing loss. J Acoust Soc Am. (2019) 146:3710–32. doi: 10.1121/1.5132950
33. Zhou, L, Ruan, X, Wang, T, Xie, H, Hu, Y, Shi, Z, et al. Epidemiological characteristics of hearing loss associated with noise temporal structure among manufacturing workers. Front Integr Neurosci. (2022) 16:978213. doi: 10.3389/fnint.2022.978213
34. Zhang, M, Gao, X, Murphy, WJ, Kardous, CA, Sun, X, Hu, W, et al. Estimation of occupational noise-induced hearing loss using kurtosis-adjusted noise exposure levels. Ear Hear. (2022) 43:1881–92. doi: 10.1097/aud.0000000000001223
35. Hamernik, RP, Qiu, W, and Davis, B. The effects of the amplitude distribution of equal energy exposures on noise-induced hearing loss: the kurtosis metric. J Acoust Soc Am. (2003) 114:386–5. doi: 10.1121/1.1582446
36. Qiu, W, Hamernik, RP, and Davis, B. The kurtosis metric as an adjunct to energy in the prediction of trauma from continuous, Nongaussian noise exposures. J Acoust Soc Am. (2006) 120:3901–6. doi: 10.1121/1.2372455
37. Fuente, A, Qiu, W, Zhang, M, Xie, H, Kardous, CA, Campo, P, et al. Use of the kurtosis statistic in an evaluation of the effects of noise and solvent exposures on the hearing thresholds of workers: an exploratory study. J Acoust Soc Am. (2018) 143:1704–10. doi: 10.1121/1.5028368
38. Dobie, RA. Medical-legal evaluation of hearing loss. 3rd ed. Hong Kong: Plural Publishing (2015).
Keywords: occupational health, occupational noise, hearing loss, kurtosis, cumulative noise exposure
Citation: Liu S, Zou H, Lei S, Xin J, Qian P, Liu Y, Chen Y, Yu K and Zhang M (2023) The role of kurtosis and kurtosis-adjusted energy metric in occupational noise-induced hearing loss among metal manufacturing workers. Front. Public Health. 11:1159348. doi: 10.3389/fpubh.2023.1159348
Edited by:
Shanfa Yu, Henan Medical College, ChinaReviewed by:
Yuke Tien Fong, Singapore General Hospital, SingaporePerng-Jy Tsai, National Cheng Kung University, Taiwan
Copyright © 2023 Liu, Zou, Lei, Xin, Qian, Liu, Chen, Yu and Zhang. This is an open-access article distributed under the terms of the Creative Commons Attribution License (CC BY). The use, distribution or reproduction in other forums is permitted, provided the original author(s) and the copyright owner(s) are credited and that the original publication in this journal is cited, in accordance with accepted academic practice. No use, distribution or reproduction is permitted which does not comply with these terms.
*Correspondence: Meibian Zhang, emhhbmdtYkBuaW9ocC5jaGluYWNkYy5jbg==; Kuai Yu, eXVrdWFpNTIwMEAxNjMuY29t