 Yu Ding1
 Peng Wang
 Lei Huang
94% of researchers rate our articles as excellent or good
Learn more about the work of our research integrity team to safeguard the quality of each article we publish.
Find out more
ORIGINAL RESEARCH article
Front. Public Health, 17 August 2023
Sec. Environmental Health and Exposome
Volume 11 - 2023 | https://doi.org/10.3389/fpubh.2023.1153021
This article is part of the Research TopicAdaptive Planning of Built Environment Under Public Health and Environmental RisksView all 6 articles
Introduction: Residential segregation have become a common phenomenon in China recently. Socioeconomically disadvantaged residents were more likely to live in communities with higher PM2.5 concentrations and poorer built environment, which may ultimately lead to a higher health risk, further exacerbating health inequalities. However, the reasons for health inequalities under residential segregation remain unclear.
Methods: This study quantified the built environment, air pollution, mortality rate and housing price at 1 km × 1 km grid scale. Moderating effect model, mediating effect model, moderated mediating effect model were used to progressively clarify the relationship between the four.
Results: Results show that, in terms of spatial distribution, the central area has high housing price with good built environment, low PM2.5 concentration and low mortality rate. While the suburban area has low housing price, poor built environment, high PM2.5 concentration and high mortality rate. Additionally, built environment can not only reduce health risks through moderating effect, but also affect health through the mediating effect of PM2.5. There is heterogeneity in moderating effect of built environment in different locations. Housing prices can moderate the effect of built environment on health. This study would offer important reference for urban planning to mitigate the effect of built environment inequalities on health inequalities in China.
Air pollution poses a significant threat to public health. Ninety percent of the world’s population resides in areas where air quality exceeds World Health Organization (WHO) standards (1). PM2.5 is a key pollutant among numerous hazy air pollutants that negatively affect human health, as it can deposit hazardous substances such as sulfates and heavy metals in the airways and respiratory tracts of humans (2). Every year, millions of people die prematurely due to exposure to ambient PM2.5. In China, a study based on monitored concentrations and an integrated exposure response model estimated that 740,140 [95% confidence interval (CI): 646,538–839,968] premature fatalities in 2020were attributable to PM2.5 (3). Therefore, mitigating the impact of air pollution on human health has become a critical public health issue (4).
Built environment, which is defined as human-made physical environment surroundings and conditions, has been deemed a decisive factor in the health of city dwellers (5). Recent studies have demonstrated that built environments can mitigate the adverse health effects of air pollution. It has proved that built environment in Nanjing moderated the relationship between air pollution and non-accident mortality (6). Specifically, SHDI and water area can mitigate the effect of PM2.5 on all-cause mortality (6). Additionally, it has been estimated that the aggregate impact of vegetation on PM2.5 in the UK is about 1% (7). The quantity and spatial allocation of green space play a crucial role in urban PM2.5 management (8). More than that, it has been confirmed that the built environment can directly affect the concentration of air pollutants in urban areas. For example, high density buildings may hinder the dispersion of air pollutants, resulting in the accumulation of pollutants (9). Increased impervious surface increases temperatures, which may contribute to the formation of air pollutants (10).
In addition, studies that accounted for built environments, air pollution, and health risks revealed intriguing spatial differences. Areas with high housing prices are mainly concentrated around major urban green space can effectively reduce particulate pollution, realize the ecological benefits of high-density urban areas, and improve human health in areas where housing price is high (8). In contrast, industrial toxic pollutants are frequently concentrated and accumulated in low-income communities with less expensive housing, further increasing the health burden in these communities, which already suffer from multiple deprivations (2). Notably, housing prices may also play a role in the relationship between the three, and may be one of the variables that can explain disparities in health in the context of residential segregation.
Health, built environment, air pollution, and housing prices are interdependent and cannot be separated. To mitigate the health risk of urban residents, it is urgent to understand the mechanism of influence of the four factors. However, current researches on built environment and health focus primarily on identifying influencing factors, exploring influencing pathways, and comparing influencing effects. Majority of studies only considered the relationship between indicators of built environment and air pollution or built environment and specific diseases. Few studies consider the relationship between the three in depth. Lack of research examines the characteristics of built environment and its environs, such as the location distribution, pollutant concentration, and economic value.
To fill that gap, this study began by examining the relationship among built environment, PM2.5 and mortality rate in order to progressively clarify the relationship between the four in various areas. Then, taking into account housing price, relationship between the four was investigated further. The subsequent efforts were made: the study examined (i) the moderating effect of built environment on the relationship between air pollution and mortality rate (ii) the mediating effect of air pollution between built environment and mortality rate, and (iii) the moderating effect of housing price on the air pollution-mediated relationship between built environment and mortality rate.
The capital of Jiangsu province in China, Nanjing (31°14′ N–32°37′ N, 118°22′ E–119°14′ E), is one of the main regional central cities with a high population density and well-developed industry (11). The majority of the petrochemical businesses in Nanjing are located within the city. There are many petrochemical enterprises in Nanjing, mainly distributed around the urban area., Additionally, the enclosed terrain encircled by mountains on three sides and water on one side contributes to the accumulation of air pollutants in the urban area. PM2.5 has been identified as a key factor in reducing air pollution in the Yangtze River Delta, where Nanjing is situated (12).
Nanjing is the “ancient capital of six dynasties.” The history of urban development over a millennium has had a profoundly impact on the spatial differentiation pattern of Nanjing. South of the city center, the majority od, residential areas and subdivisions are situated along the Qinhuai River. Through the spatial pattern of urban functions was consistently reinforced as a result of the construction of capital cities during multiple dynasties (13). This century, residents of working class remained concentrated in the southern part of the inner city (14). Consequently, education, health care, commerce and other public services are centralized in the city center. Nanjing consists of five urban areas (Qinhuai, Xuanwu, Gulou, Jianye, Yuhuatai), five suburban areas (Qixia, Pukou, Jiangning, Gaochun, Liuhe). As the overall study area, Nanjing City was divided into 1 km × 1 km grids for the investigation (Figure 1).
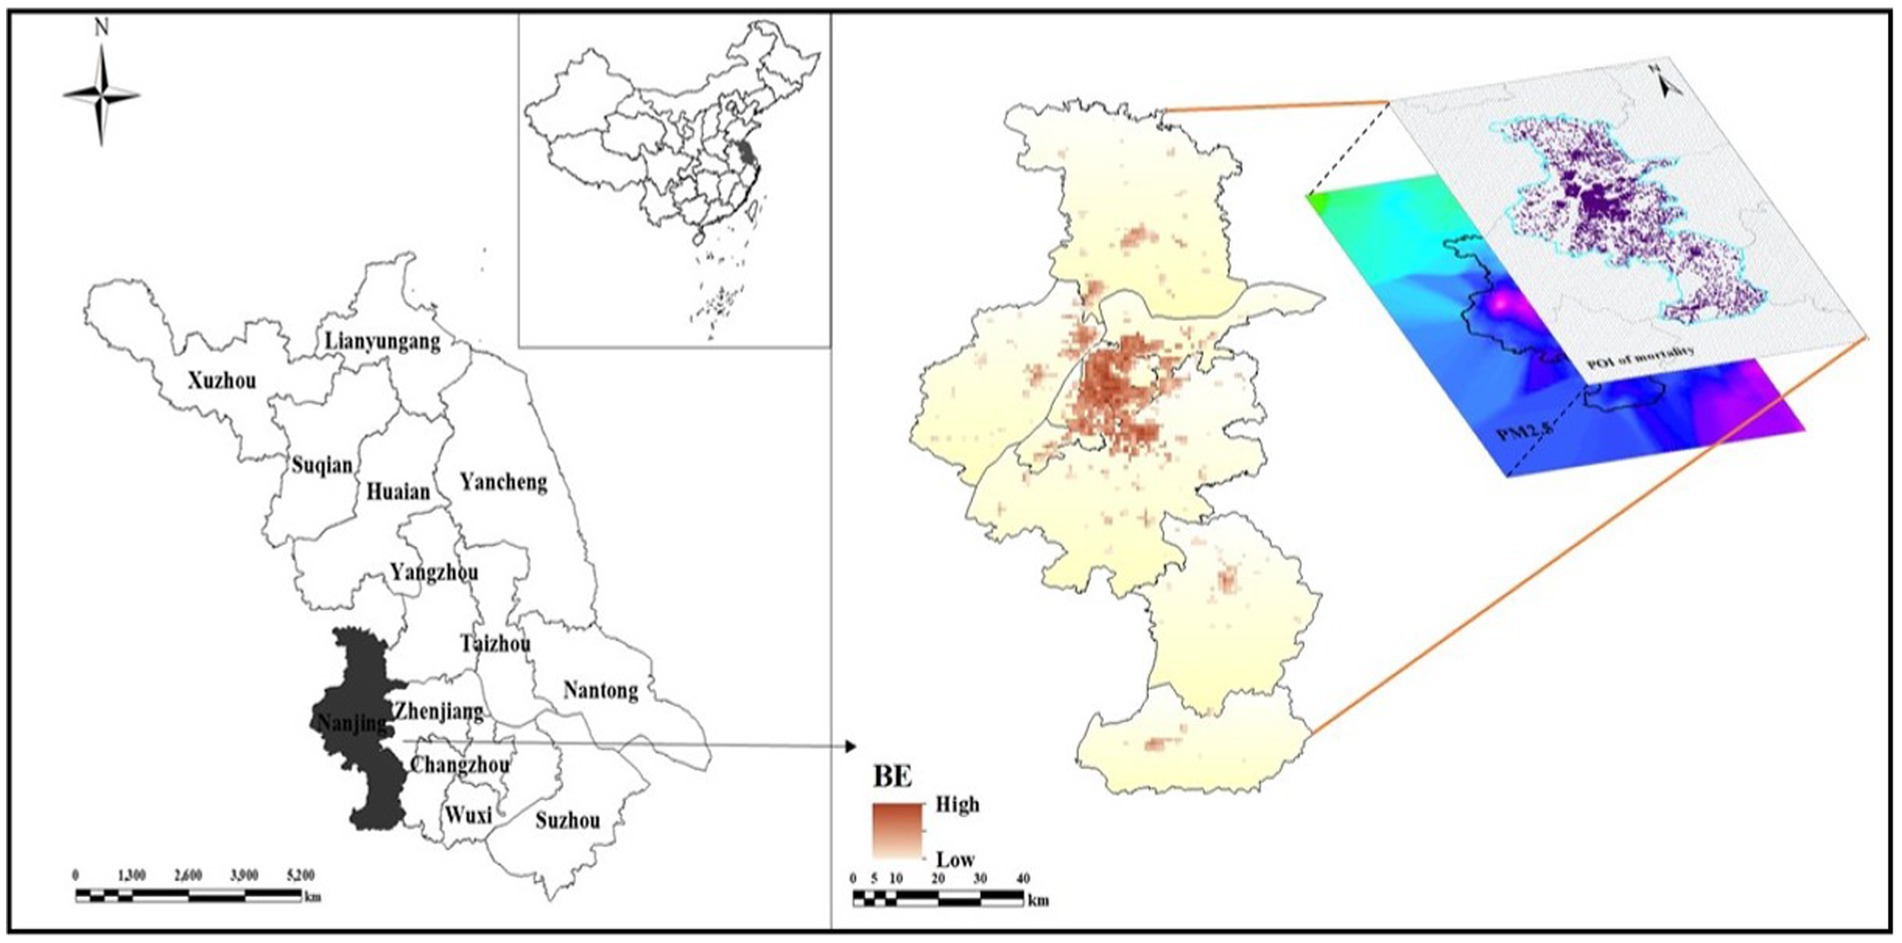
Figure 1. Location of the study area.
In this study, we utilized road data, building information, the Normalized Difference Vegetation Index (NDVI), point of interest (POI), land use and land cover data, air pollution (PM2.5), population density, mortality data and the 2020 housing price. Road data from OpenStreetMap road data was used to compute road crossing and road density at a grid scale. The building dataset was got from BIGEMAP map platform,1 which included information on footprints, building space coordinates and the number of stories in a structure. Point of interest (POI) data from BIGEMAP was acquired in order to assess the diversity of POI and the quantity of grid facilities. NDVI was used to measure surface greenness in this study. Based on the land cover data from Resource and Environment Science and Date Center, the study computed the proportion of water body, construction land and forestland within the grid. Figure 2 depicts the framework of the study.
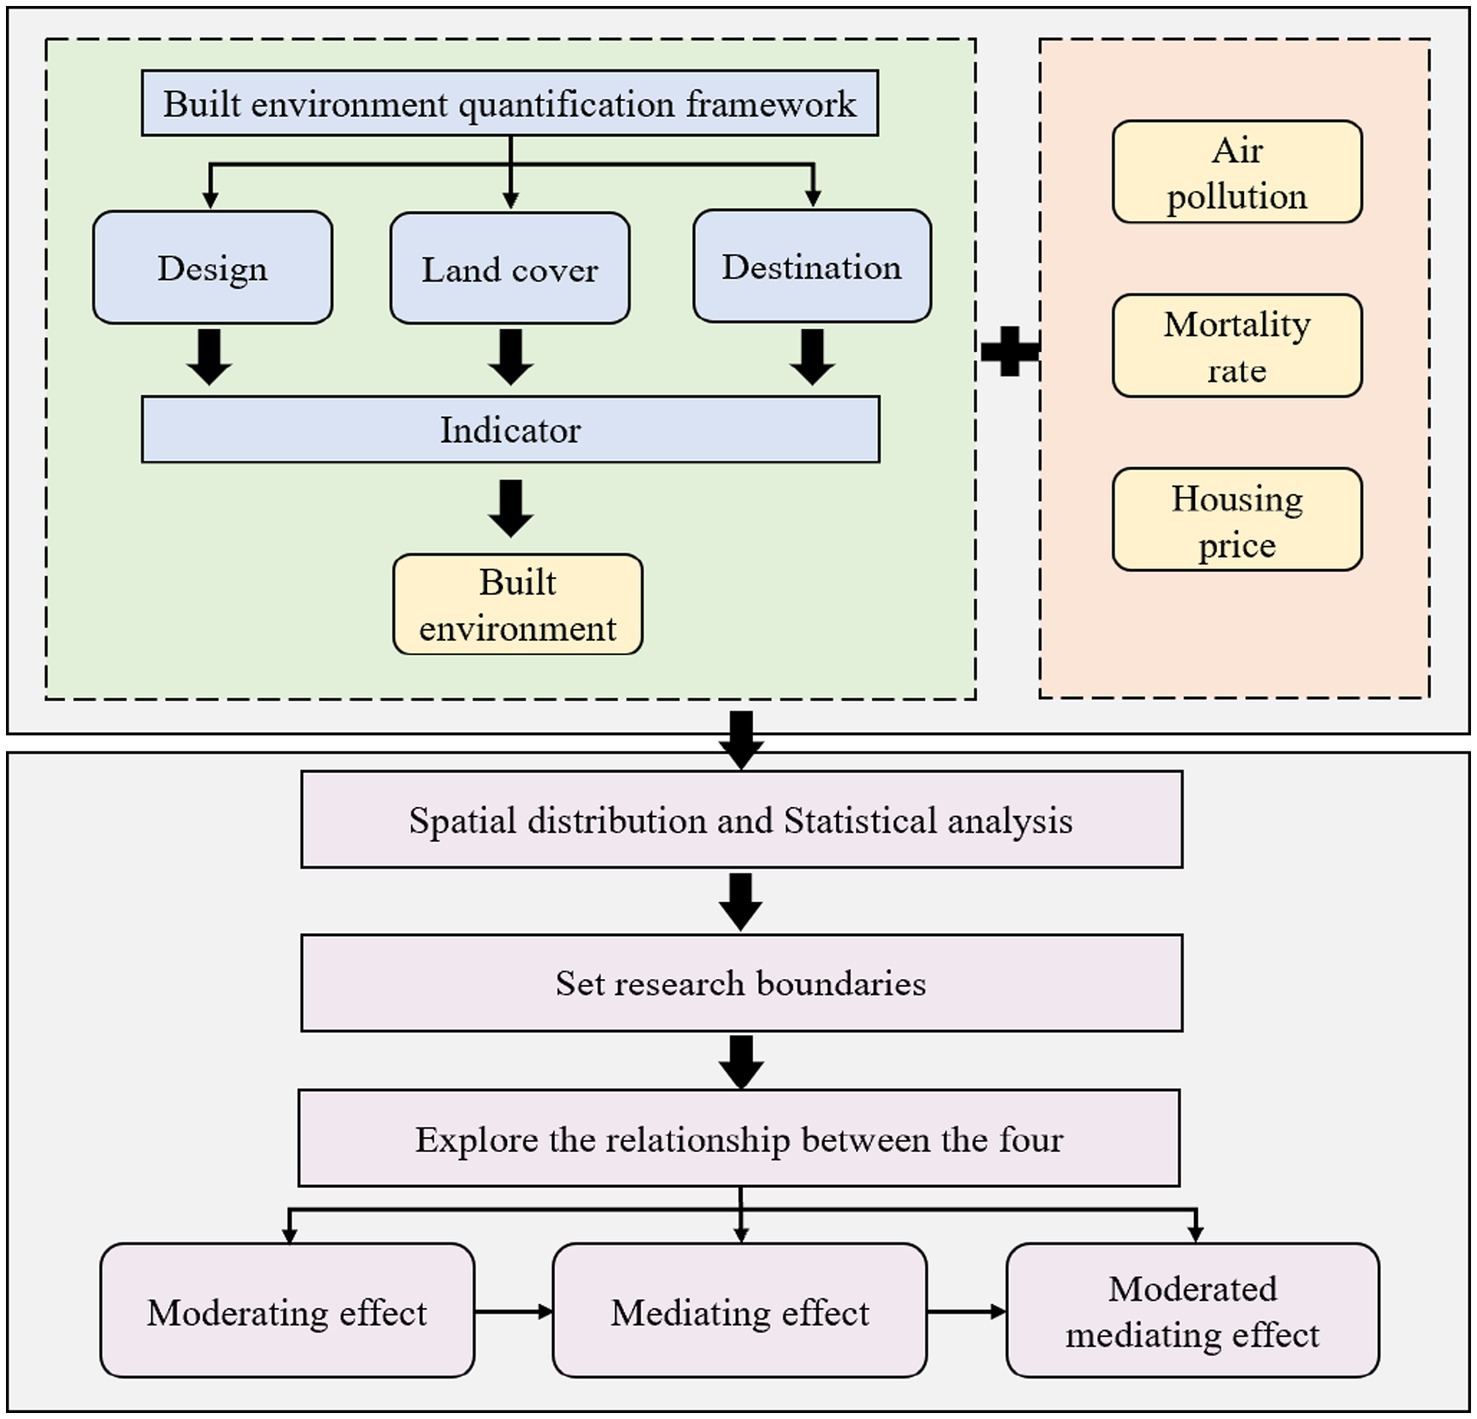
Figure 2. Framework of the study.
This study developed a framework for assessing the built environment (Table 1) including design, destination, and land cover dimensions (15). Shannon’s Diversity Index (SHDI) was used to quantify the degree of land use diversity. Hill Numbers equation was used to calculate the diversity of POI (16).
where D is diversity, n indicates the number of the types, is proportion of the category occupied by type i, and q = 2 (according to Gini-Simpson Concentration index).
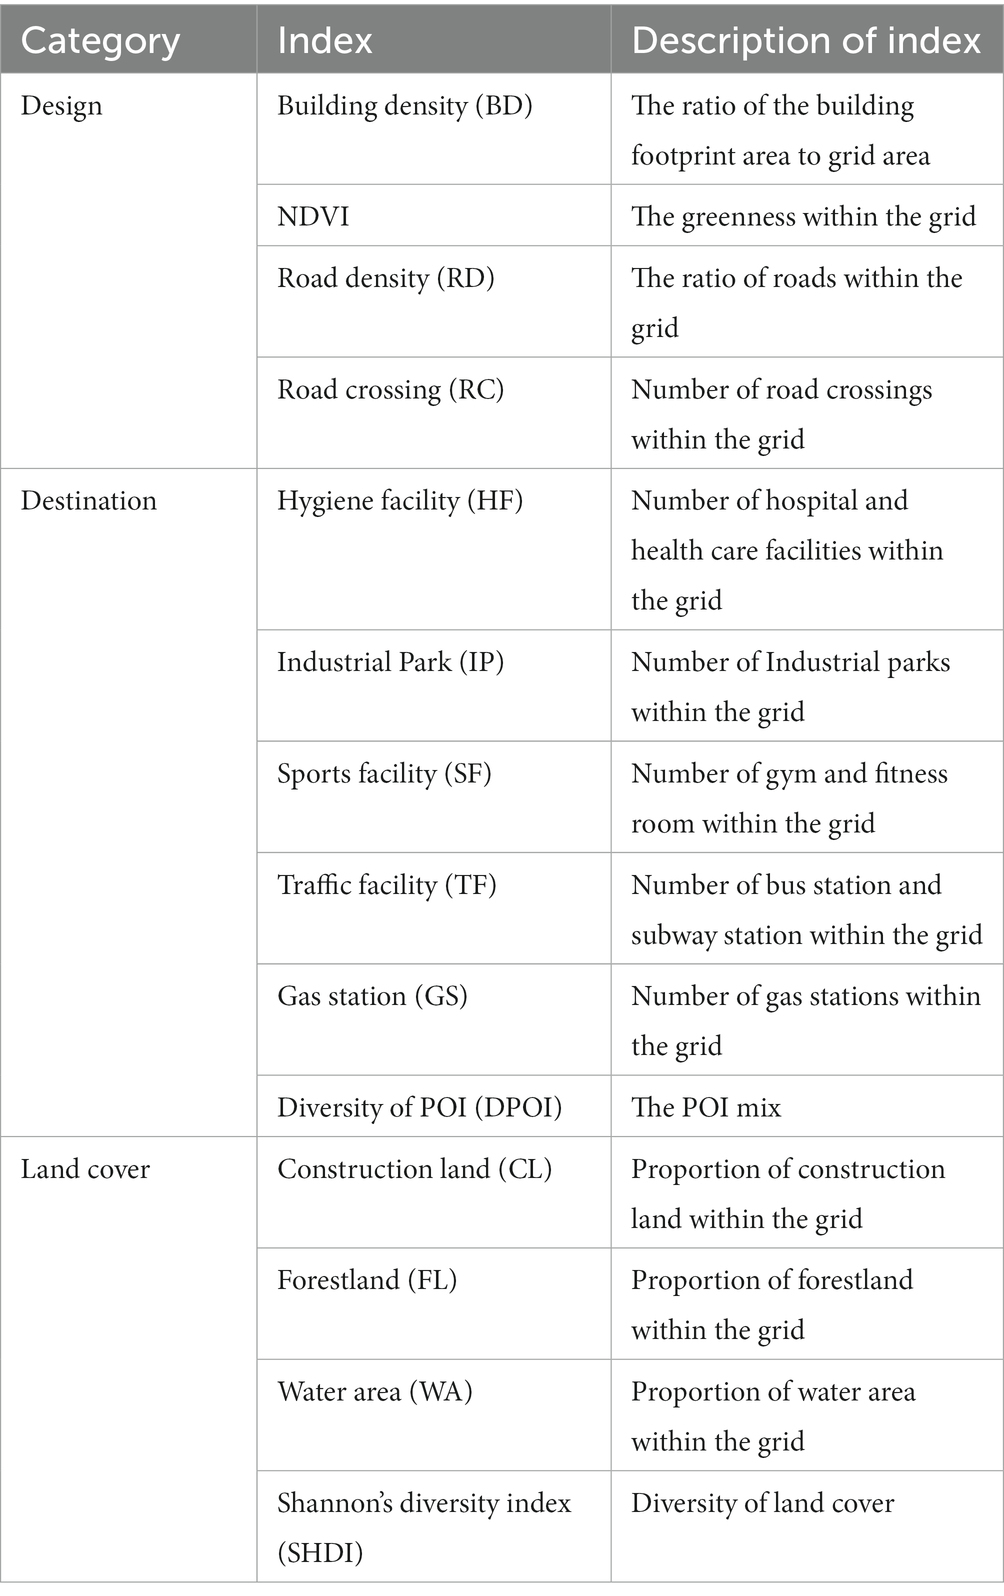
Table 1. Description of 15 indexes of the built environment.
According to high-resolution spatiotemporal model and data from previous researches (14, 17), this study calculated the annual PM2.5 at 1 km × 1 km grid scale in Nanjing.
Housing prices of the residential communities were obtained from Lian Jia,2 an online housing platform that provides real estate and rental services in China. Then, the BIGEMAP was used to calibrate the obtained location information from the residential community.
This study collects the mortality data of non-accidental causes (A00-R99) in 2020 from the Jiangsu Provincial Center for Disease Prevention and Control (18, 19), which is classified by the International Statistical Classification of Disease and Related Health Problems, 10th Revision.3
Compared to using medical data such as morbidity and hospital admissions (20, 21) to depict the average health outcome of an area, the POI data of mortality used in this study can more accurately characterize the personal health status at 1 km × 1 km grid scale. Previous studies have used grid mortality data (22, 23) to represent health outcomes and examine the health burden due to ambient pollution.
Before statistical analysis, the sample with a negative mortality rate and unreachable housing price was eliminated from this study. Secondly, correlation analysis is used to explore the relationships between the air pollution, built environment, housing price and mortality rate. Thirdly, based on the correlation test, regression models were used to determine positive and negative indexes by examining the relationships between built environment indicators and mortality rate. The correlation between two variables, x and y, can be measured using Pearson’s correlation coefficient. The calculation for the coefficient r is as follows:
Then, three models depicted in Figure 3 were run in PROCESS, an add-on for SPSS software, to explore the relationship between the four factors. Before modeling, the variables were normalized and set to zero. The purpose of Model 1 was to examine the moderating effect of built environment on PM2.5 and mortality rate. A significant interaction between the independent variable and the moderator confirmed the moderating effect. Model 2 was designed to investigate the mediating effect of PM2.5 on built environment and mortality rate. On this basis, Model 3 examined the moderating effect of housing price further.
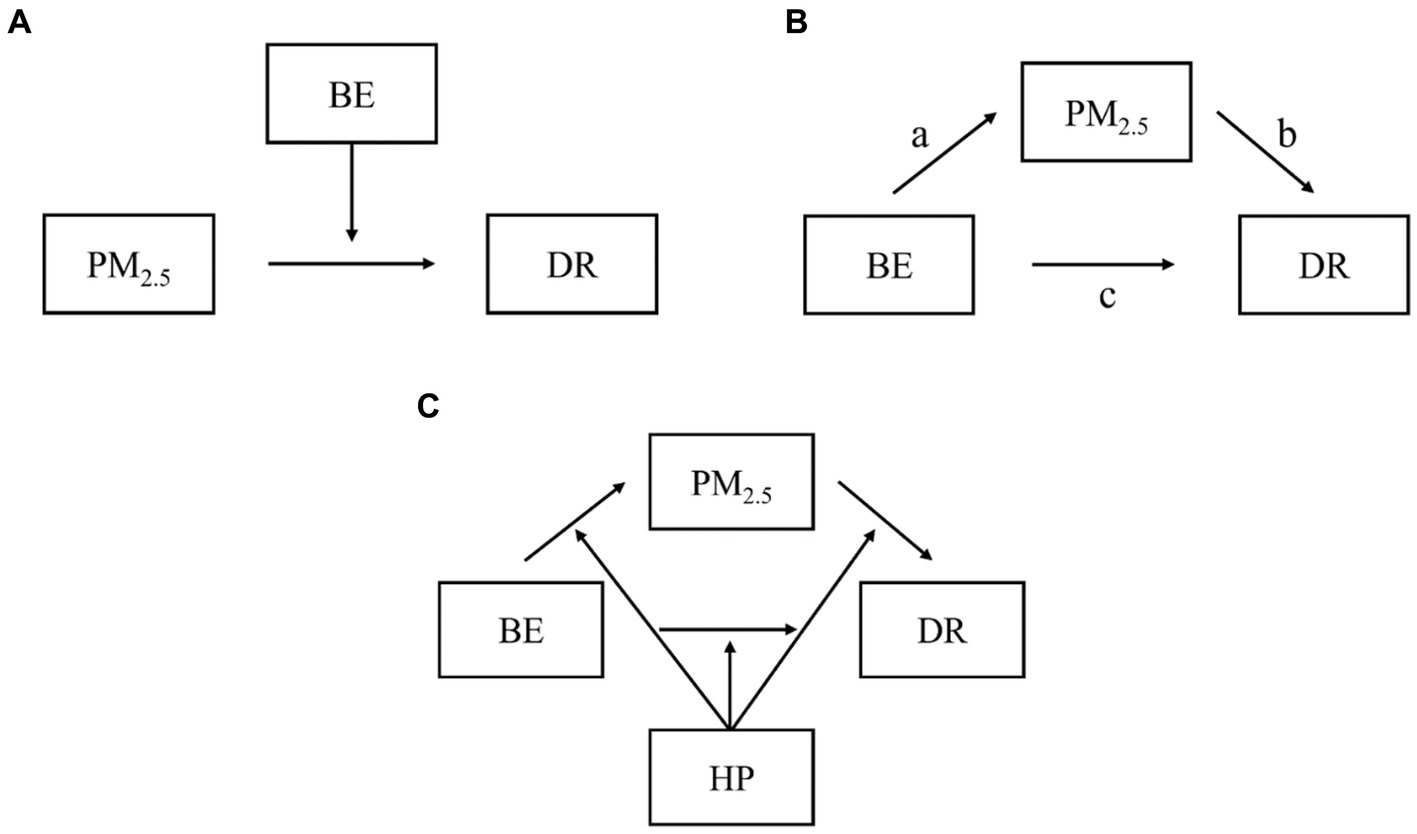
Figure 3. (A) Model 1. (B) Model 2. (C) Model 3.
To make the data comparable and eliminate the influence of dimension, the indicators of built environment were standardized (24). Based on the results of regression model, the indicators were then divided into positive and negative indexes. The following equations were used to standardize positive and negative indexes:
where = standardized value; = value of indicator j; = maximum value of indictor j; and = minimum value of indicator j.
Indicator weights can be divided into objective and subjective weights. The entropy method utilized in this study is an objective method of weighting that is capable of reflect the utility value of the indicators. It has greater credibility and precision than the subjective weighting procedure.
The proportion of the grid index value relative to all indexes was calculated using the following equation:
where = the proportion of the index value of grid i in the index of item j; m = the total number of grids.
The entropy was calculated using the following equation:
where = the information entropy value of index j.
The indexes were weighted using the following equations:
where = the information utility value of index j; = the weighting of index j.
The value of built environment was computed using the following equation. A greater built environment value indicates that the built environment is more advantageous to human health.
Figure 4 depicts the results for correlation analysis between built environment indicators and the mortality rate were shown in Figure 4, while Table 2 displays detailed results of regression analysis. Specific relationships between elements of built environment and health are as follows: road density, road crossing, building density, and diversity of POI all have a negative correlation with mortality rate. In contrast, NDVI and SHDI have a positive correlation with mortality rate. Based on the results of regression analysis, road density, building density and NDVI are negative indices of mortality rate, while the road crossing and diversity of POI are positive indices.
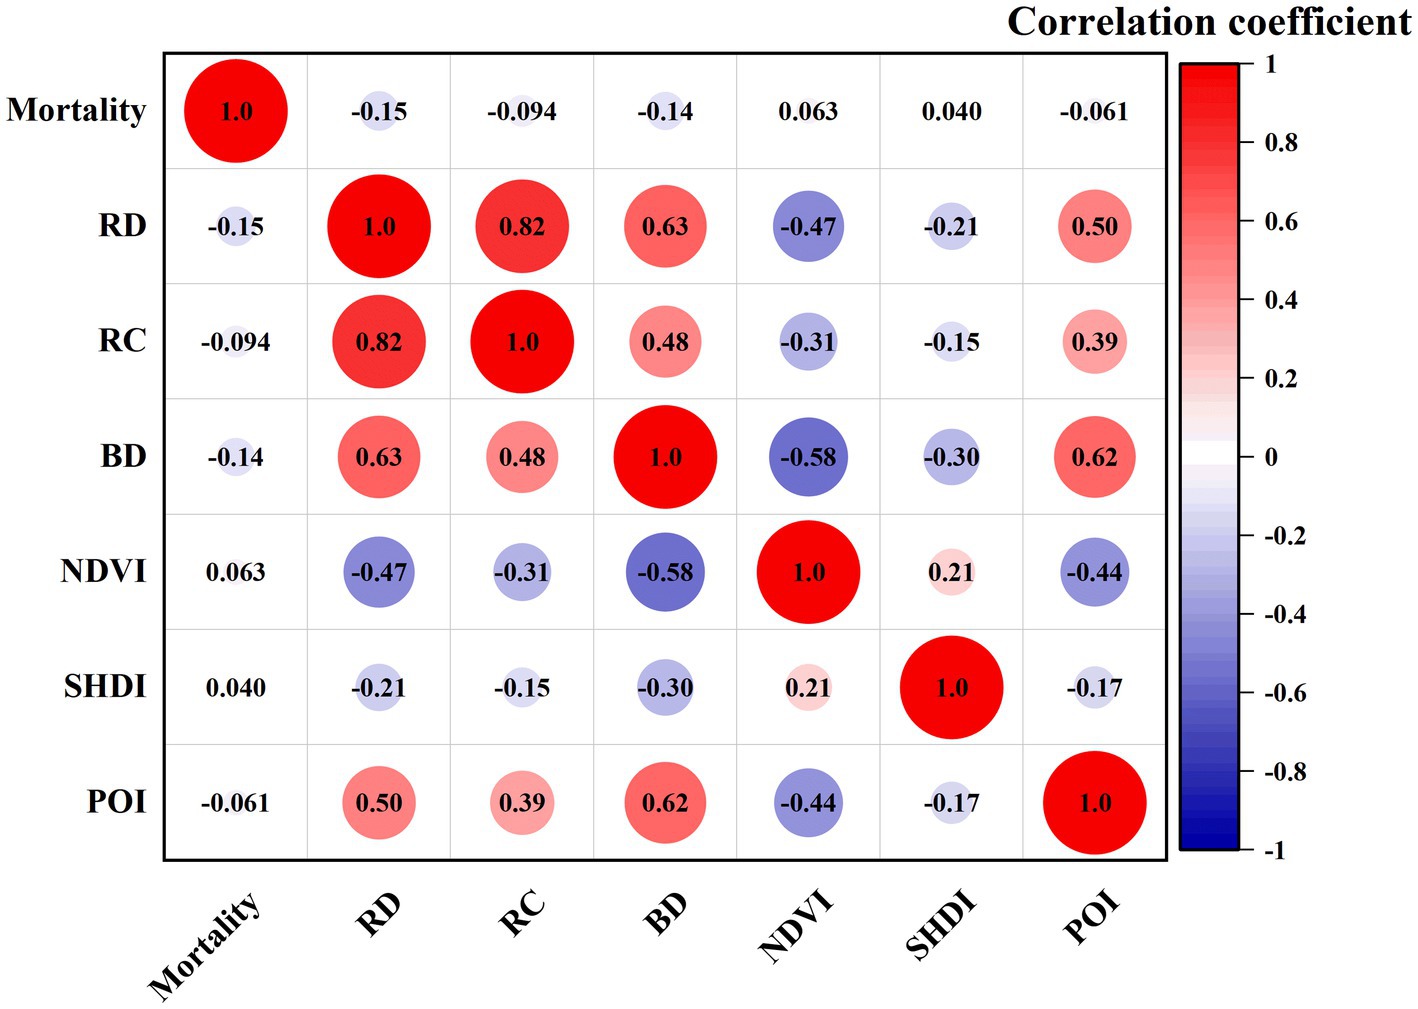
Figure 4. Correlation coefficient among indexes and mortality rate.
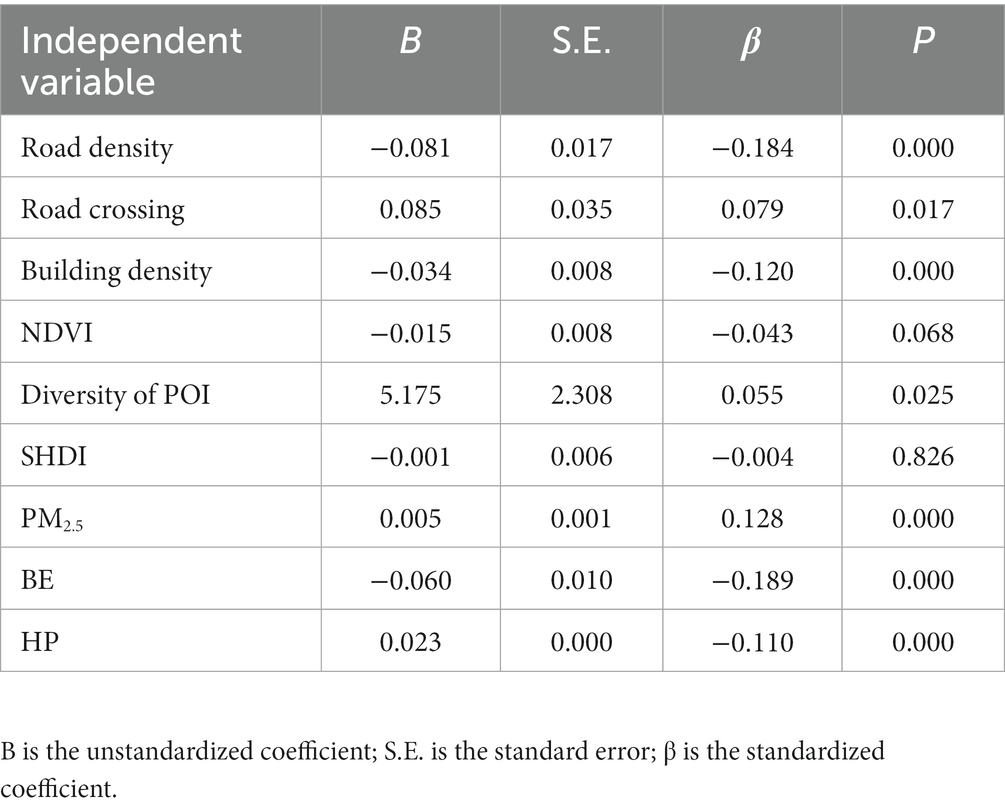
Table 2. Results of regression models.
The results for correlation analysis were shown in Figure 5, and the regression analysis results were presented in Table 2. There were statistically positive associations between PM2.5 and mortality rate. Built environment and housing price exhibited negative and significant correlations with mortality rate and PM2.5.
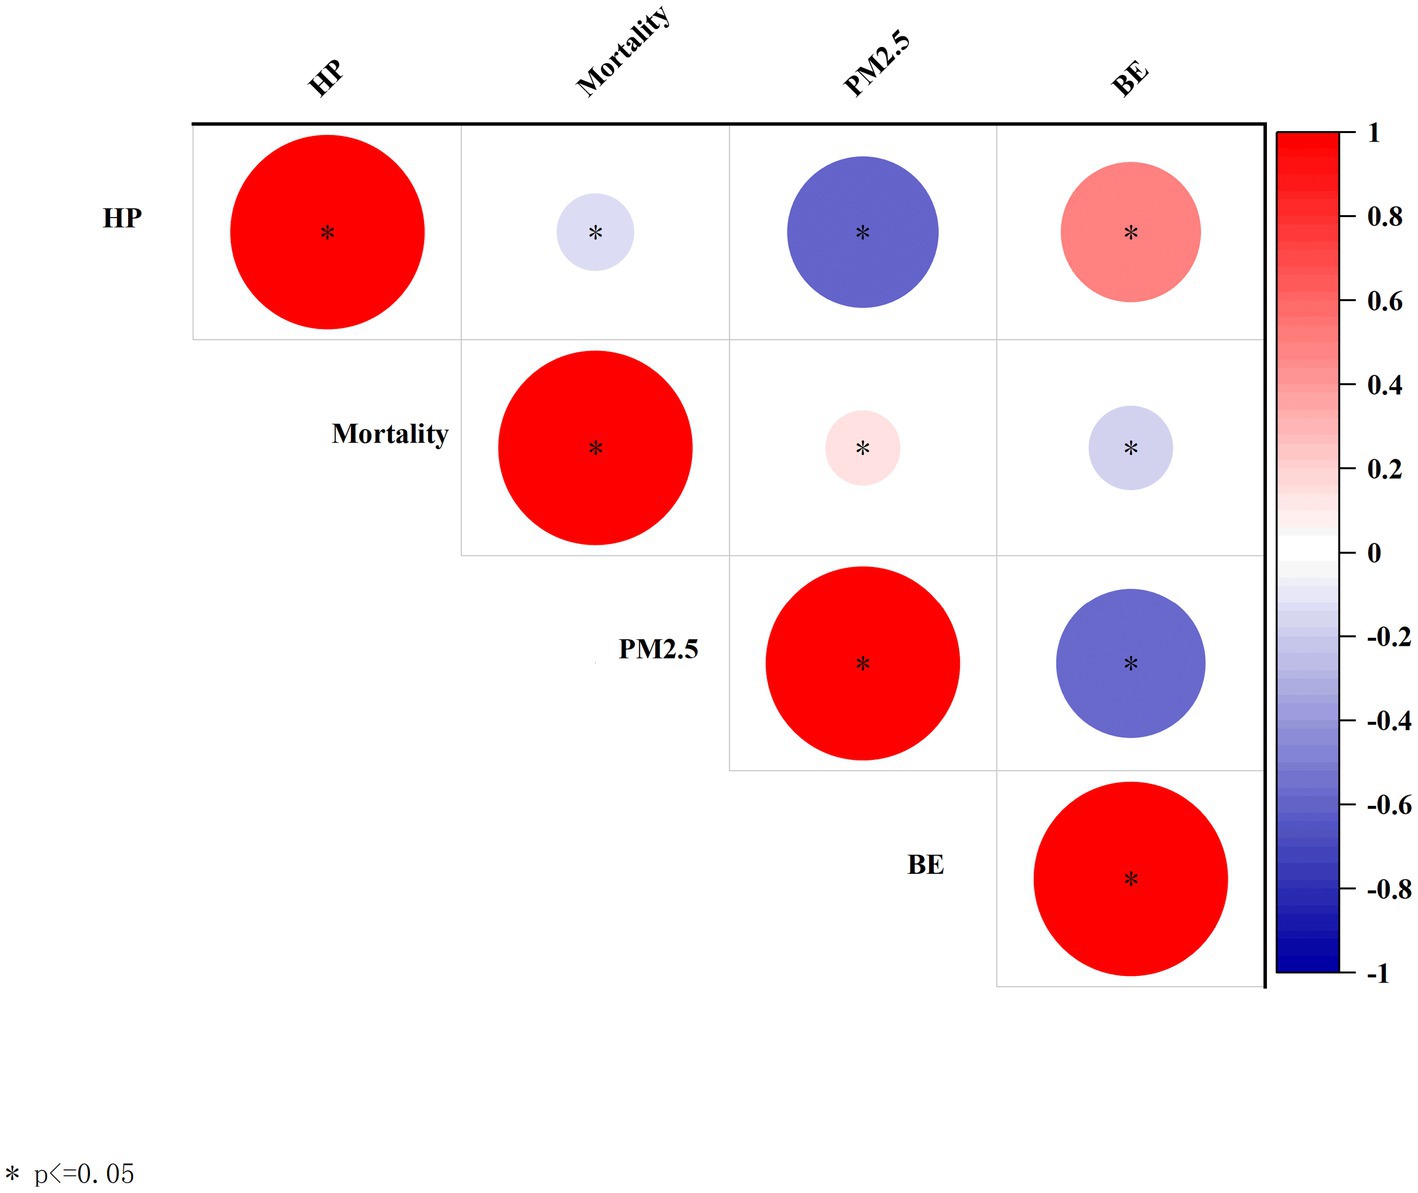
Figure 5. Correlation coefficient among HP, BE, PM2.5, and mortality rate.
Figure 6 depicts the spatial patterns of air pollution, built environment elements, housing price and mortality rate. All of them are discovered to have a high level of agglomeration. The central region is more urbanized, with dense structures, roads, and an abundance of public service facilities, but the NDVI is lower. In close proximity to the city center, the total level of built environment and housing price are higher while the mortality rate is lower. The center of the study area had comparatively low PM2.5 concentrations whereas the southeast and northeast of the urban districts were more heavily polluted by PM2.5, consistent with previous research (25).
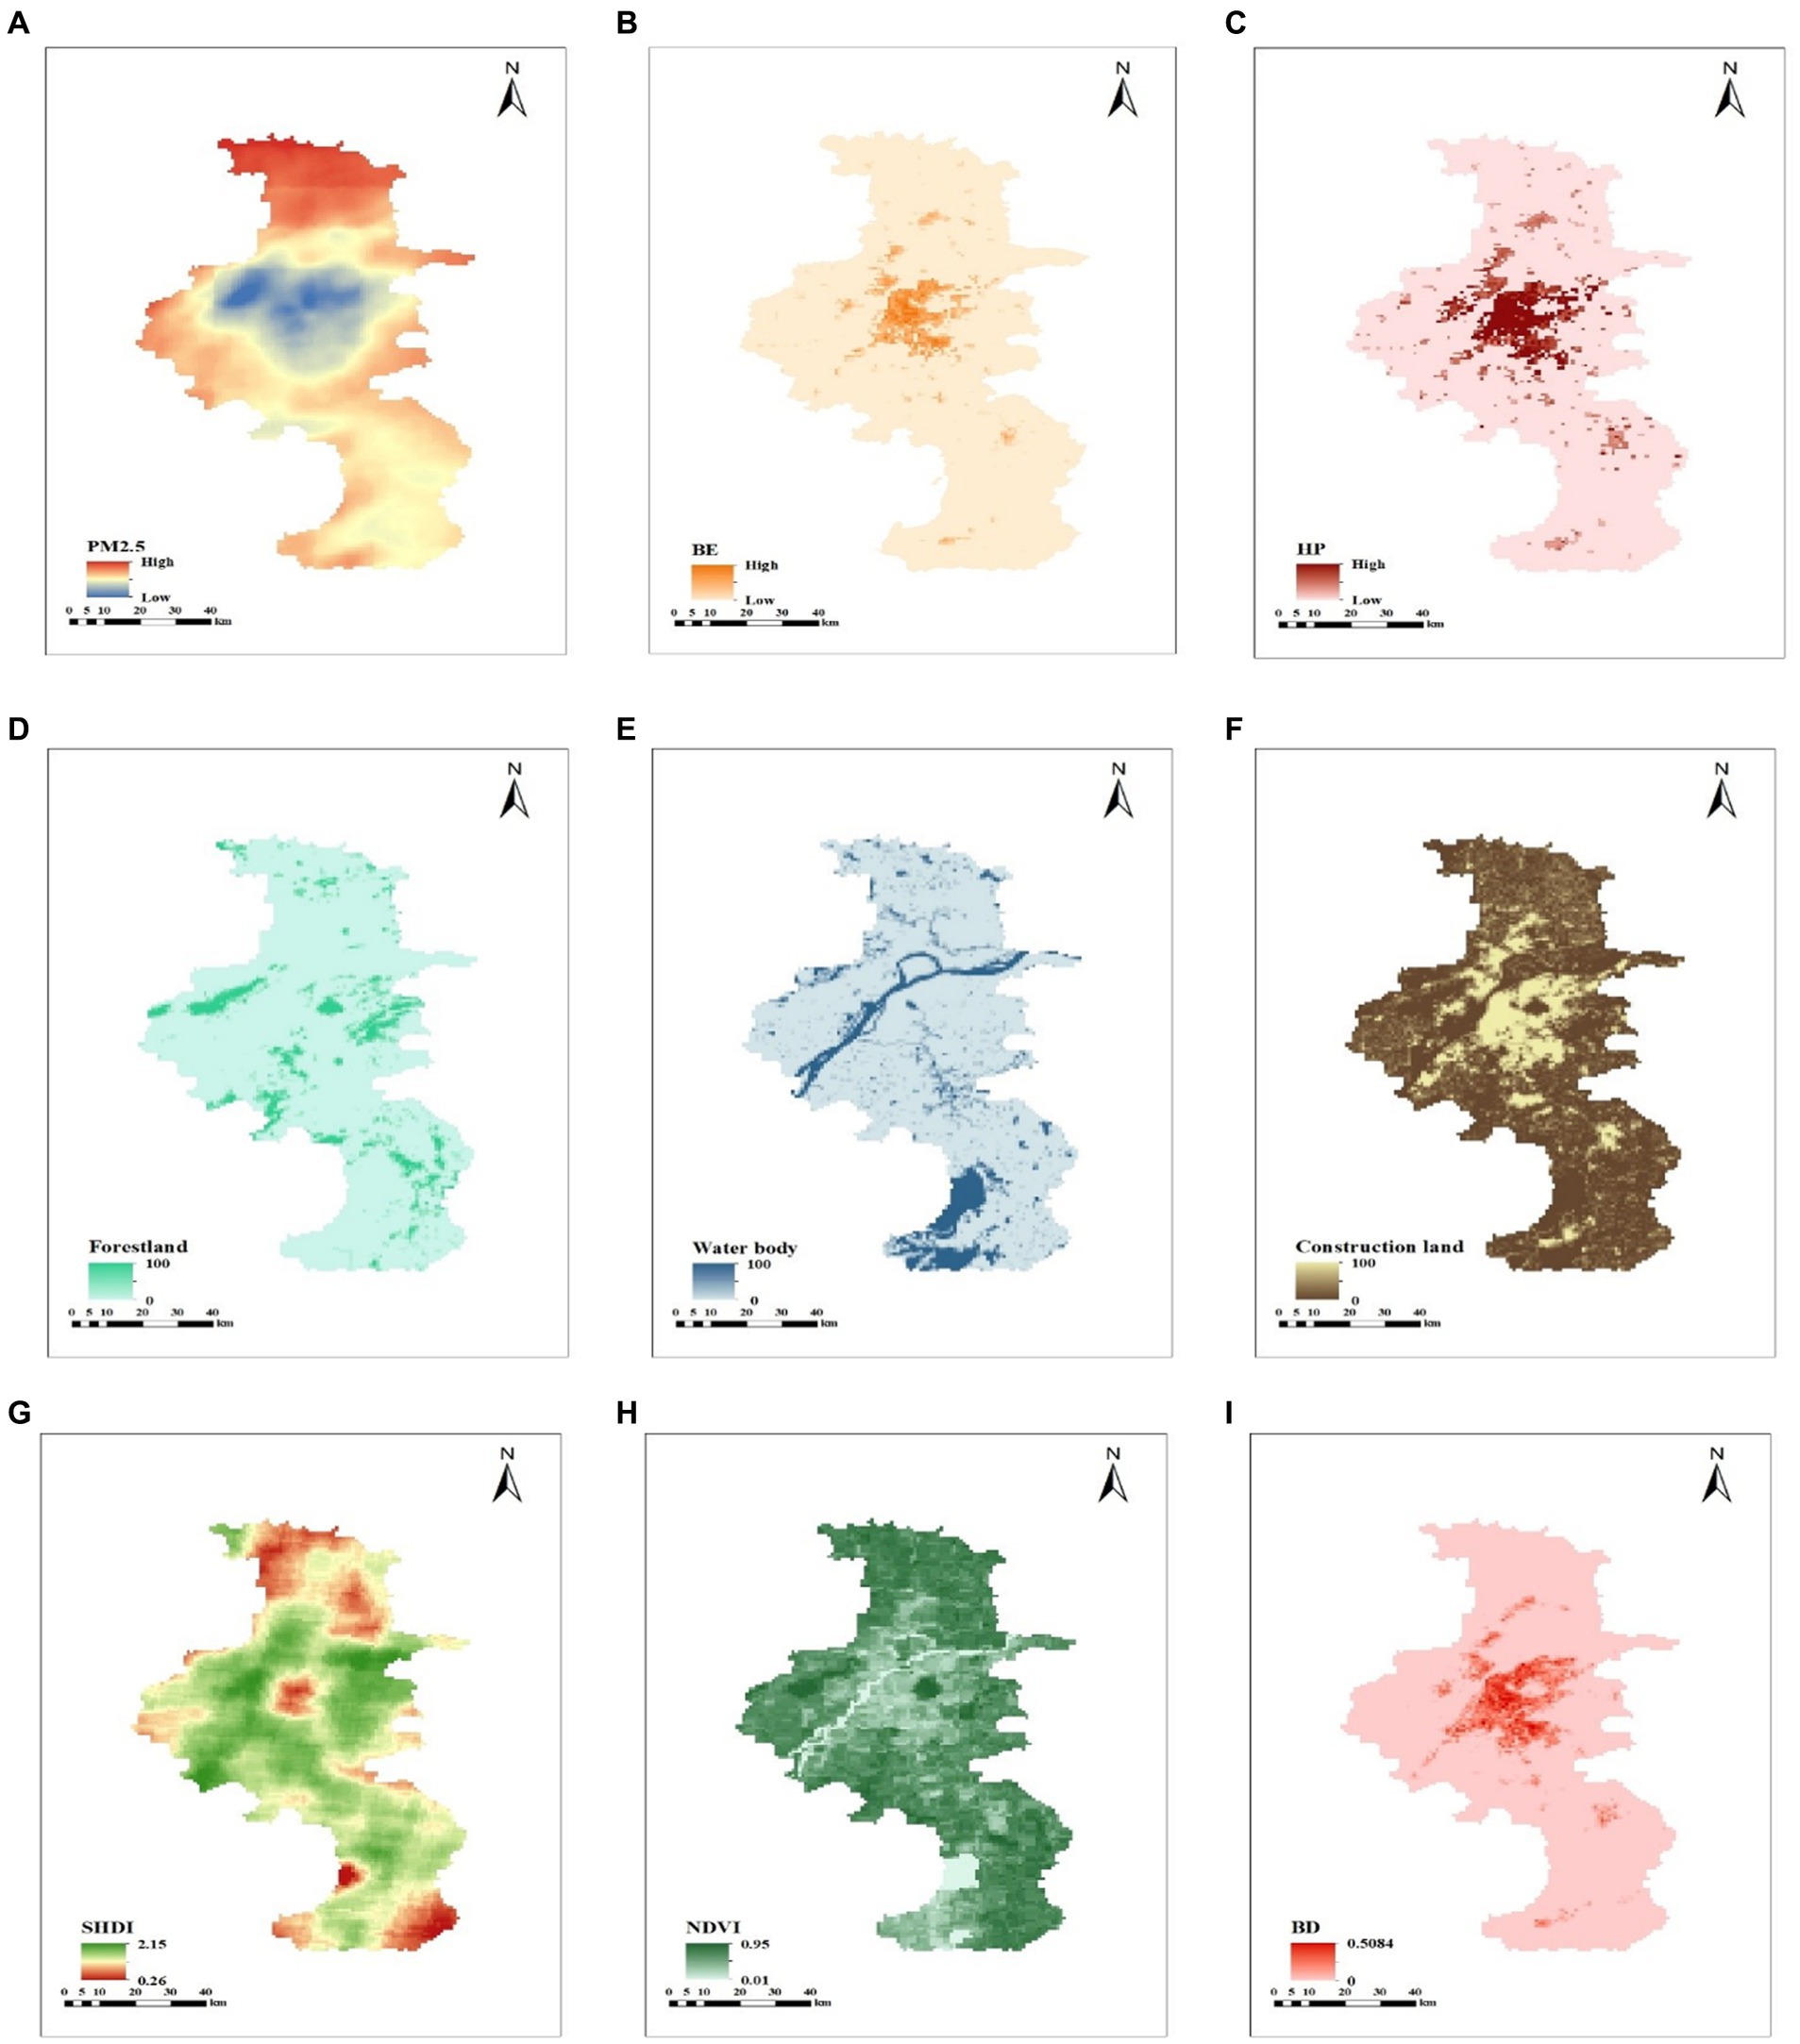
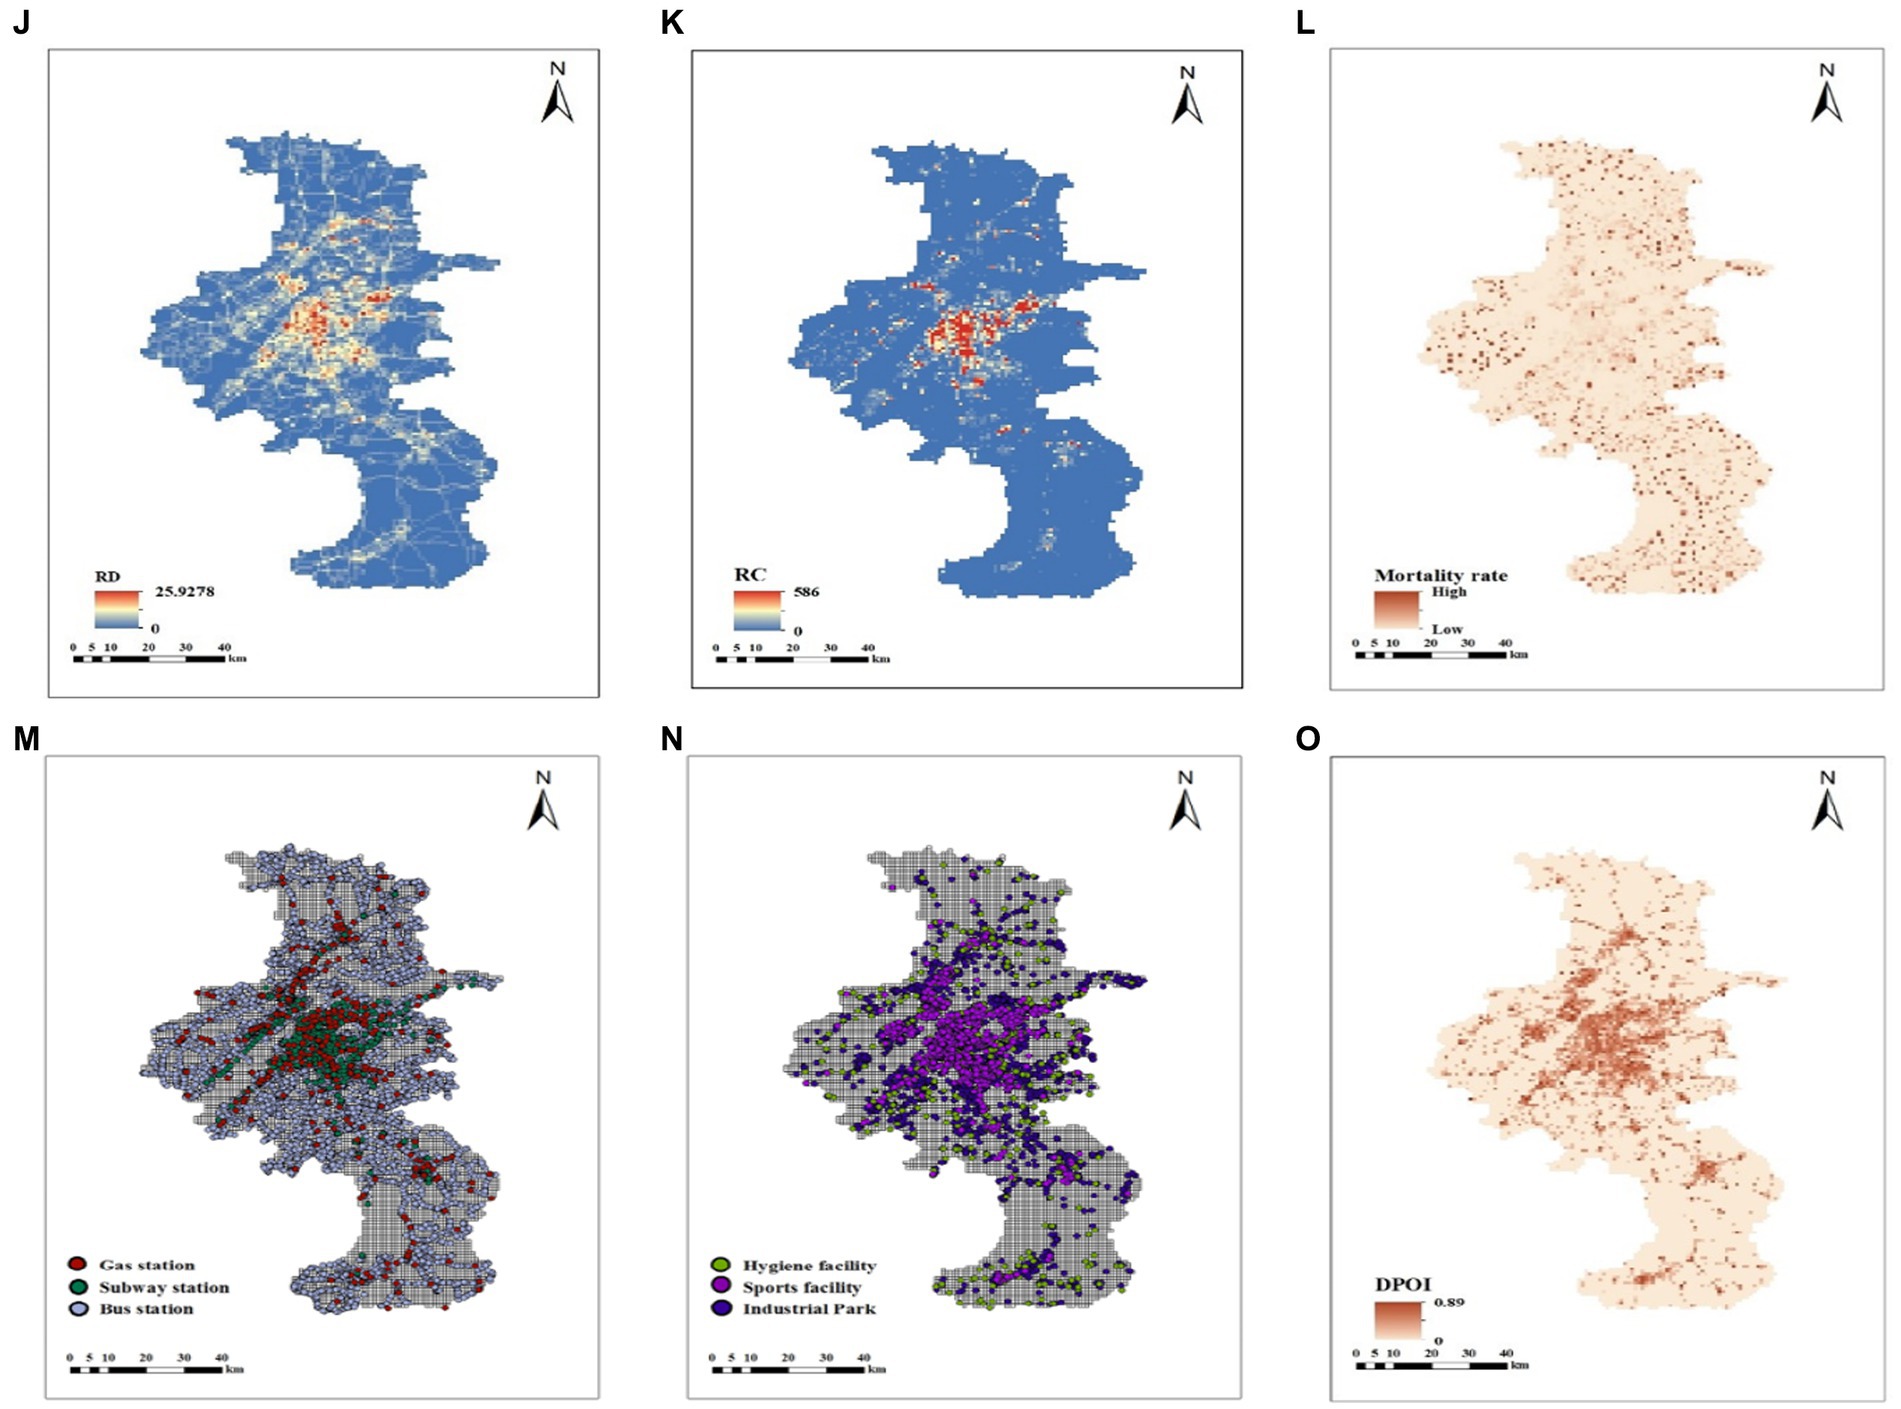
Figure 6. Spatial patterns of the built environment. (A) Concentration of PM2.5. (B) Value of built environment. (C) Housing price. (D) Proportion of forestland. (E) Proportion of water body. (F) Proportion of construction land. (G) SHDI. (H) NDVI. (I) Building density. (J) Road density. (K) Road count. (L) Mortality rate. (M) POI of infrastructures. (N) POI of infrastructures. (O) Diversity of POI.
This study first quantified the value of built environment of each grid. Then, with the aid of the ArcGIS visualization function, it is determined that majority of grids with a high built environment value are concentrated in the center of Nanjing. In contrast, grids with a low built environment value are located on the outskirts of Nanjing. On basis of this result and the spatial distribution of PM2.5 concentration, housing price, and mortality rate, it is also demonstrated that the urban core has a high PM2.5 concentration, a high housing price and a low mortality rate. In contrast, the urban suburb has a low PM2.5 concentration, a low housing price and a high mortality rate. The grids in the urban center and urban suburbs have revealed glaring disparities in built environment and health. Consequently, the city center and city suburb arrangements that satisfy the before mentioned conditions are chosen. Ultimately, city center grids and city suburb grids were identified as two categories that require comparison and discussion in order to explore whether built environment inequalities exacerbate health inequalities.
Model 1 (Figure 3A) was used to test the moderating effect of built environment on the primary relationship between PM2.5 and mortality rate. As an indicator of the moderating effect between PM2.5 and mortality rate, the coefficient of the interaction item “built environment × air pollution” was employed. The interaction term between built environment and PM2.5(BE*PM2.5) had a negative and statistically significant effect on mortality rate implementation in the city center (b = −0.2824, p = 0.0001). Similarly, the impact of the interaction term (BE*PM2.5) was significantly negative in urban suburbs (b = −0.9464, p = 0.0000). In suburban areas, both the adjustment coefficient and significance level were greater than in urban areas.
Table 3 demonstrates the results. It shows that built environment can negatively moderate the relationship between PM2.5 and mortality in both city center and the suburbs, indicating that a high level of built environment can help mitigate the negative health effects of PM2.5. Compared to the city center, the suburban built environment has a greater moderating effect.
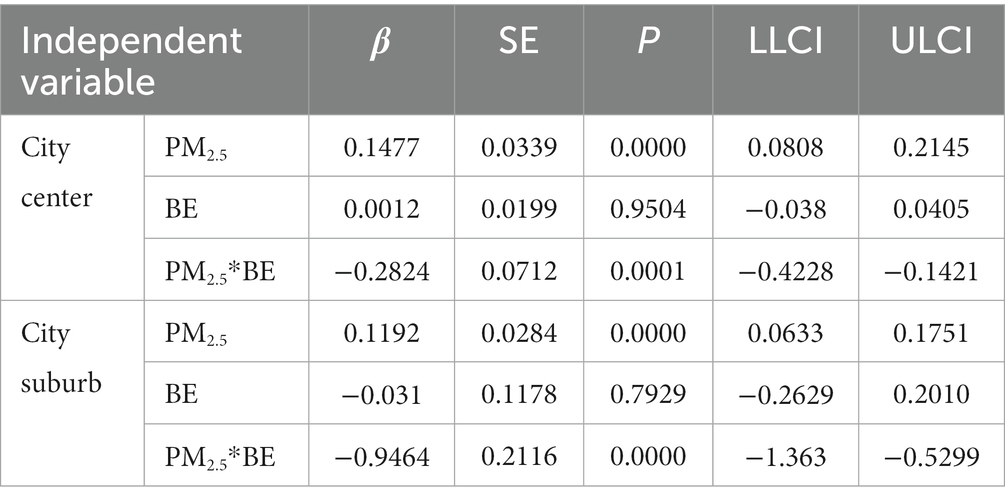
Table 3. Results of moderating effects of built environment.
Model 2 (Figure 3B) examines the mediation effect of PM2.5 on the previously discussed associations between built environment and mortality rate discussed above. Table 4 shows the results of the mediation analyses of city center. Path a revealed a negative relationship between built environment and PM2.5 in city center, (p = 0.0274, b = −0.2143). PM2.5 was positively associated with mortality rate in relation to path b (p = 0.0029, b = 0.0144). Path c revealed a negative relationship between built environment and mortality rate (p = 0.0000, b = −0.0732). The coefficient of mediation effect is-0.0031 according to the Bootstrap test of deviation correction (95%CI: −0.0086, −0.0001).
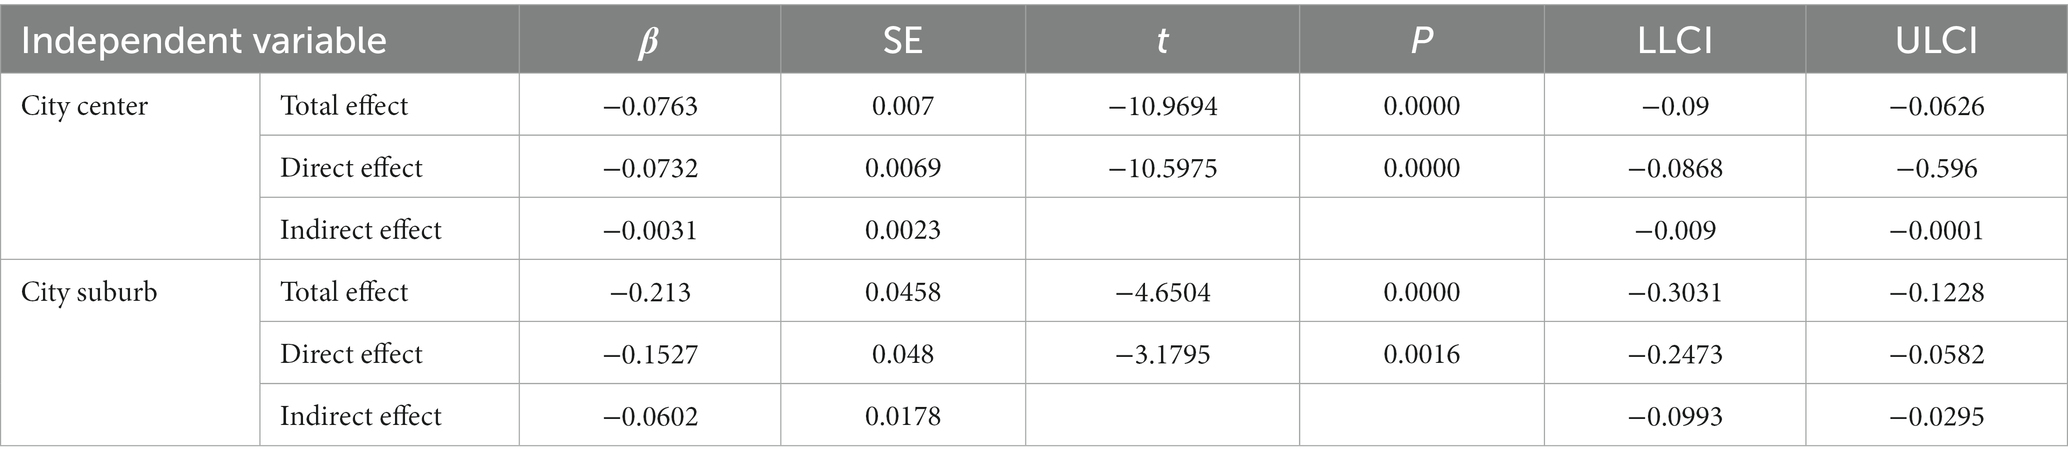
Table 4. Results of mediating effects of PM2.5.
Path a revealed a negative relationship between built environment and PM2.5 in urban suburbs (p = 0.0000, b = −0.14863). PM2.5 was positively associated with mortality rate along path b (p = 0.0005, b = 0.0405). Path c revealed a negative relationship between built environment and mortality rate (p = 0.0016, b = −0.1527). The coefficient of mediation effect is −0.0602 according to the Bootstrap test of deviation correction (95%CI: −0.098, −0.0308). Table 4 shows the results of the mediation analyses of city center and suburb.
Overall, the results indicate that PM2.5 mediated the relationship between built environment and mortality rate in both city center and city suburb. In addition to having direct effects on health, the built environment indirectly affects pollutant concentrations and, by extension, thus health.
Model 3 was used (Figure 3C) and the results are shown in Table 5. In the city center, there was a significant interaction between built environment and housing price (b = 1.1474, Δ0.0197, p = 0.0232) and a negative relationship between built environment and PM2.5 meaning that as built environment scores increased,PM2.5 scores decreased. This linear relationship was observed when housing price were one standard deviation (SD) below the average; b = −0.2171, 95%CI [−0.4323, −0.0019], p = 0.048 < 0.05,when housing price were average; b = −0.0912, 95%CI [−0.2708, 0.0884], p = 0.3179 > 0.1, and when housing price one SD above the average; b = 0.1471, 95%CI [−0.1178, 0.4121], p = 0.2749 > 0.1. This suggested that, compared to high housing price in the city center, low housing price amplified the effect of built environment on PM2.5.
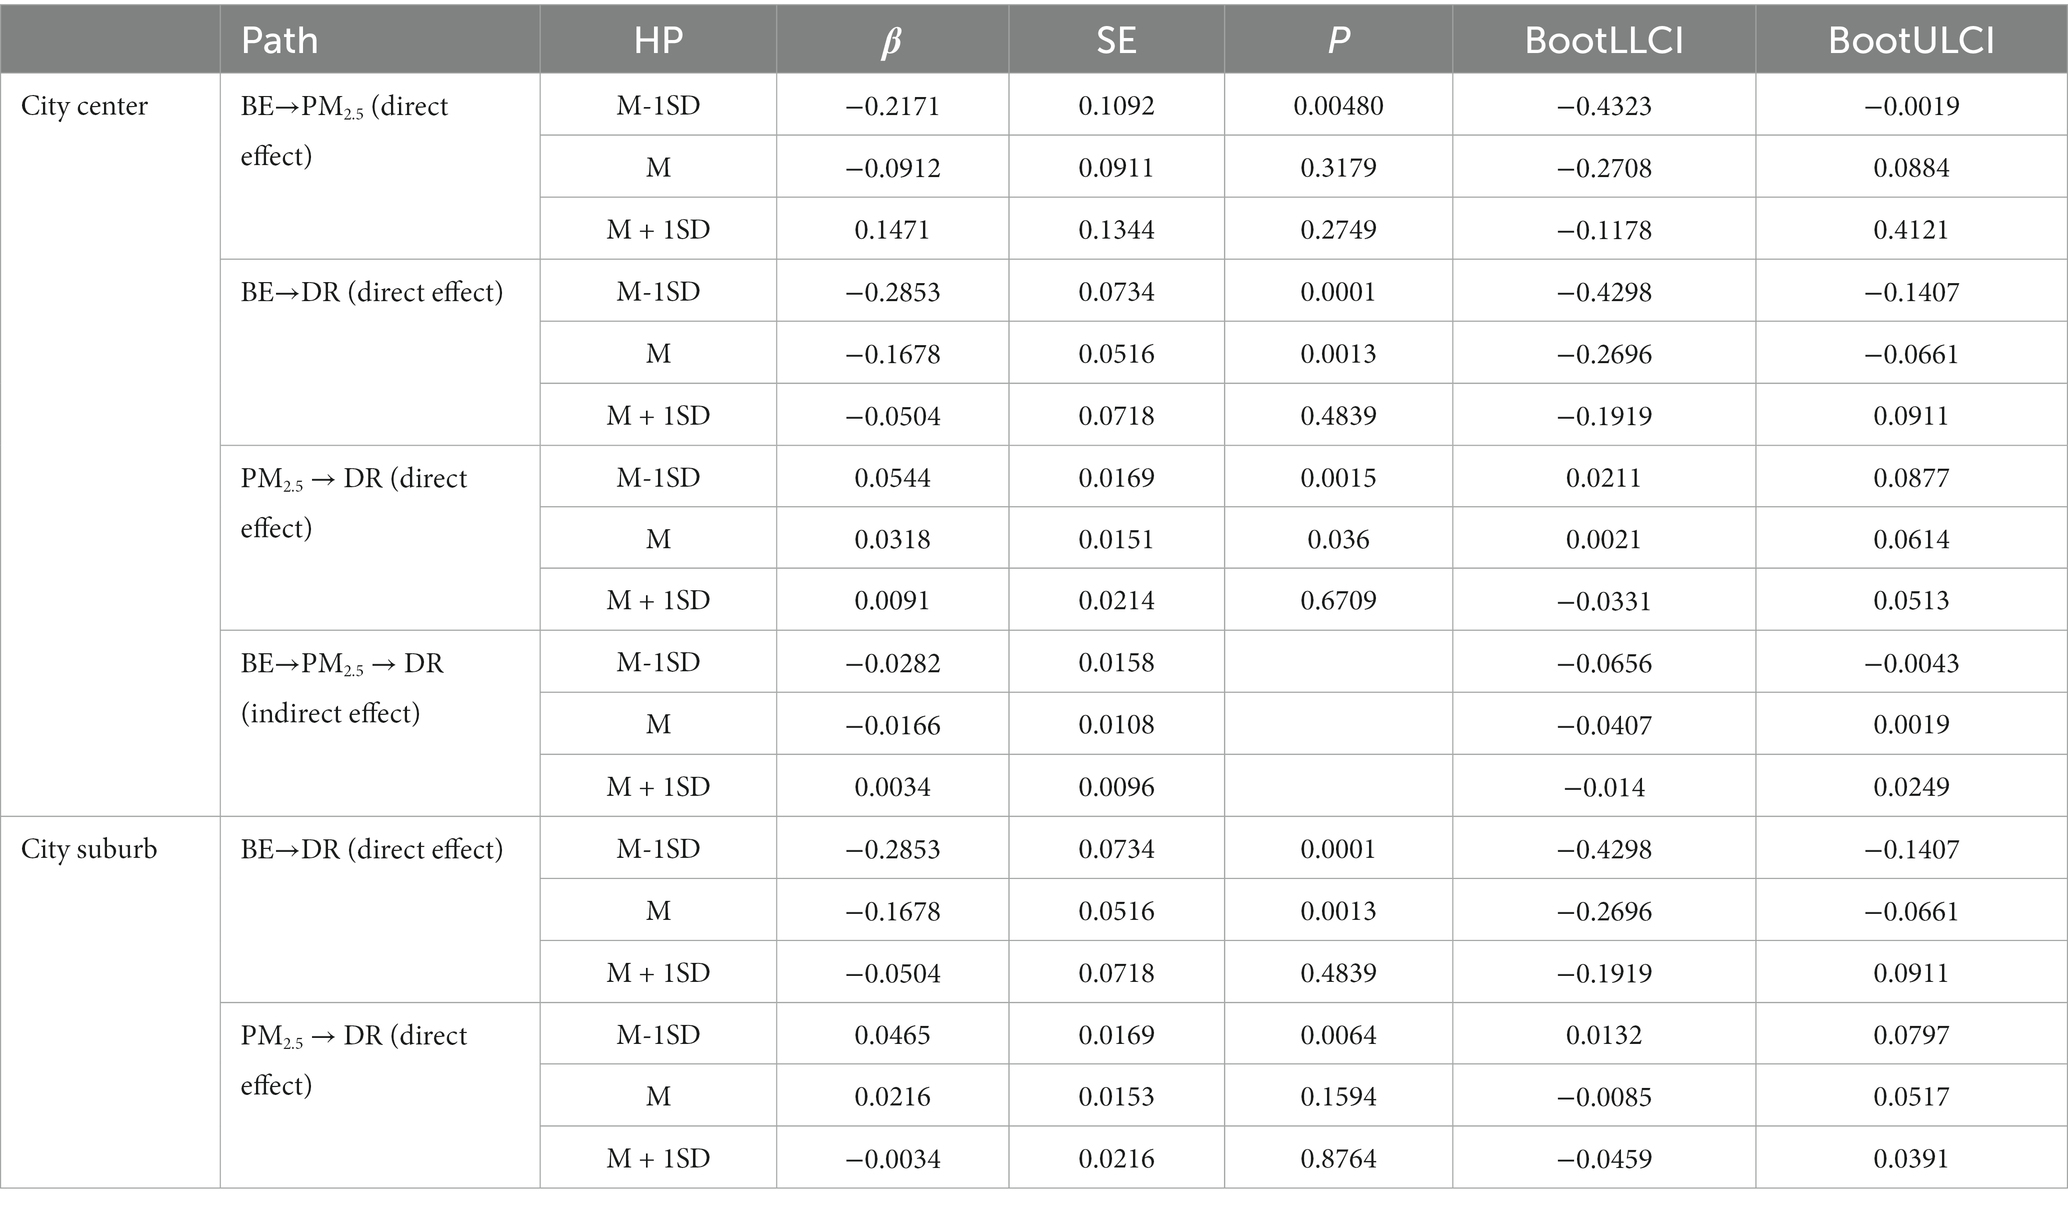
Table 5. Results of mediated moderating effects of housing price.
In addition, the interaction term between PM2.5 and housing price has a negative and significant impact (b = −0.0608, p = 0.0648 < 0.1, 0.0092). The correlation between PM2.5 and mortality rate indicated that as PM2.5 levels increased, so did mortality rates. This linear relationship was observed when housing price were one SD below the average; b = 0.0544, 95%CI [0.0211, 0.0877], p = 0.0015 < 0.01, when housing price were average; b = 0.0318, 95%CI [0.0021, 0.0614], p = 0.036 < 0.1, and when housing price one SD above the average; b = 0.0091, 95%, CI [−0.0331, 0.0513], p = 0.6709 > 0.1. It appeared that, in comparison to high housing price in the city center, low housing price mitigated the effect of PM2.5 on mortality rate.
Housing price can also moderate the relationship between built environment and mortality (b = 0.1425, p = 0.0002 < 0.001, Δ0.0374). Built environment has a negative correlation with the mortality rate, so as built environment increased, mortality rate decreased. This linear relationship was observed when housing price were one SD below the average; b = −0.2853, 95%CI [−0.4298, −0.1407], p = 0.0001, when housing price was average; b = −0.1678, 95%CI [−0.2696, −0.0661], p = 0.0013, and when housing price one SD above the average; b = −0.0504, 95%, CI [−0.1919,0.0911], p = 0.4839 > 0.1. In comparison to high housing price in city center, low housing price amplified the effect of built environment on mortality.
The interaction between built environment and housing price is insignificant in city suburbs (p = 0.7832 < 0.1),while interaction between PM2.5 and mortality rate is significant (b = −0.1856, p = 0.0375 < 0.1, 0.0155). Moreover, housing price can moderate the relationship between built environment and mortality rate (b = 0.8749, p = 0.0222, 0.0189). The negative association between built environment and mortality rate was stronger in areas with low housing price (1 SD below mean value), than that among places with high housing prices (1 SD above mean value). Housing price mitigates the negative health effects of t PM2.5 and amplify the positive health effects of built environment. Overall, the effect of housing price moderation in city center is more considerable than in city suburbs.
First, a spatial distribution analysis reveals that the city center has a high level of built environment. Conversely, the built environment of the urban suburb is deficient. It is important to note that urban center and urban suburb are two typical areas of the residential segregation phenomenon in Nanjing. Some international literatures have focused on the poverty-inequality-environment relationship (26). The findings of built environment in Nanjing are consistent with those of previous international studies conducted in Latin American (27), which demonstrated that segregation within cities is accompanied by an unequal distribution of environmental characteristics and significant environmental differences between social classes. Specifically, there is a direct positive correlation between “urban green space” and “urban spatial isolation” factors. In addition, both the PM2.5 concentration and mortality rate in Nanjing were found to be significantly polarized by this study. In particular, the PM2.5 concentration and mortality rate are relatively low in city center, while the PM2.5 concentration and mortality rate are relatively elevated in city suburb. The is the same result of studies in south-central Chile (28), where socioeconomic heterogeneity in ambient particulate matter concentrations was found. A study in Oslo, Norway (29), also proved that impoverished citizens are surrounded by less blue-green space and are more vulnerable to air pollution. The unequal spatial distribution of built environment, air pollution and health is a global problem.
The relationship between built environment, mortality rate and PM2.5 are further investigated based on this phenomenon. It is important to note that a high level of built environment can help mitigate the negative impact of PM2.5 on human health, confirming the effect of built environment on health disparities. Surprisingly, it is discovered that built environment has a greater moderating effect in city suburbs than in the city centers. This may be due to the fact that vulnerable groups, such as migrants at lower income, reside primarily in China’s urban peripheries that have weak social and built environments (30). Poor and remote communities are typically exposed to higher levels of air pollution and face greater health risks as a result (31). Another possible explanation is the uneven distribution of public hospitals and other medical resources in China. In city suburbs, communities with an abundance of medical resources have fewer health risks than other communities.
This study considered the comprehensive PM2.5 concentration in Nanjing, including stationary sources and mobile sources. Results showed that PM2.5 mediates the relationship between built environment and mortality rate in both city center and city suburb. According to the spatial distribution of built environment elements in Nanjing, it may be due to the correlation between transportation-related elements of the built environment and PM2.5 concentrations. Traffic volume on roads (32, 33), road width, bus route length, and the number of bus stops (34, 35) have been examined as determinants of PM2.5 in previous studies. As is shown in Figure 5, there are numerous intersections and subway stations in the center of Nanjing, and many bus stations are concentrated in the suburbs. Traffic can be an important source of pollution in Nanjing. Contrarily, greenness, lakes and wetlands are mainly located in suburb of Nanjing, where air pollutants are deposited and absorbed (36). Greener built environment located in the suburbs has the advantage of mitigating PM2.5.
In China, housing price is a motivator for residential segregation. Rapidly rising housing prices and increasing housing inequality reshape the Chinese urban landscape and have a negative impact on the well-being of city dwellers (37, 38). Thus, housing prices in relation to the built environment is considered in order to determine if housing prices can moderate the effect of built environment on health, which may exacerbate health inequalities within cities. It is discovered that housing price in Nanjing decreases from the city center to the outskirts. The results also indicate that housing price can effectively moderate the relationship between built environment and mortality rate, which is mediated by air pollution in city center. Specifically, housing price amplified the positive effect of built environment on PM2.5 and mortality rate, while attenuating the negative effect of PM2.5 on mortality rate, which is especially pronounced in relatively low-price areas of city center. In suburban areas, the effect of PM2.5 on health is mitigated by housing price, while the effect of built environment on health is enhanced.
It may be because residents with higher income prefer to invest in private greening (39). The magnitude of the moderating effect of built environment is determined by people’s income and capacity to pay. Increasing numbers of people today have a heightened awareness of green ecology and pay greater attention to the air quality near their homes. For example, a study discovered that residences within two meters of a green zone could have higher housing prices, with a prospective increase of nearly 25 billion yuan in Beijing (40). Therefore, housing prices and built environment interact and ultimately influence health. Moreover, housing prices reflect the importance placed on air pollution (38). For the sake of quality of life and physical health, it is evident that residents are willing to pay higher housing prices to reside in areas with excellent air quality as opposed to areas with high air pollution (41). This explains the moderating effect of housing prices on the relationship between PM2.5 and mortality rate.
This study examined the associations between built environment, PM2.5, housing price and mortality rate in Nanjing, China, to cast light on health disparities under residential segregation. Beginning with a moderating analysis, the effect of built environment on PM2.5 and mortality rate were examined. Built environment is then incorporated into the mediation effect model to determine if the built environment can affect health by influencing PM2.5. Finally, a moderated mediating effect model was used to examine whether housing prices moderate the relationship between built environment, air pollution, and health.
The empirical findings presented here indicate: first, the built environment can reduce the negative response of the mortality rate to PM2.5. However, the moderating effect of built environment differs between urban center and urban suburb. The positive effect of built environment on health is greater in city suburb than in city center. Second, no matter in urban centers or urban suburbs, the built environment can also indirectly influence PM2.5 concentrations and thus health. Third, housing price will mitigate the negative health effects of PM2.5 and strengthen the positive health effect of built environment. Overall, the moderation effect of housing price is greater in city center than in city suburbs, which may exacerbate health inequalities.
Based on the moderating analysis, the mediating analysis and the moderated mediating analysis, a close relationship between health, built environment, air pollution and housing price is discovered in Nanjing city, which ultimately results in unequal spatial aggregation. The following mortality risk mitigation measures are recommended from the perspective of built environment: to avoid the “environment-health-poverty” trap (42) to the greatest extent possible, more public resources should be invested in the construction of urban suburbs, and the balanced development of infrastructure, especially medical facilities, transportation facilities, and athletic facilities should receive special attention. To mitigate the mortality risk from air pollution, the development of the city center should not disregard the degree of land use blending (43) and should focus on enhancing the diversity of land cover, particularly water area and greenness (44). In addition, increasing the number of urban parks in center areas can directly affect urban temperature (45), thereby enhancing the thermal comfort of residents and promoting physical activity.
The study concludes that residential segregation is accompanied by unequal distribution of built environment, with the effect of PM2.5 and housing price exacerbating health disparities. It contributes to research fields about segregation and welfare. Furthermore, this study quantifies the built environment, mortality rate, housing price, and air pollution at the grid scale. The 1 km × 1 km grid scale is more conducive to characterizing and disclosing the influence mechanism of the four factors than previous regional-perspective studies.
However, this study has a few limitations. Firstly, it revealed the correlations between four factors only in the case of Nanjing. More regions will be considered to examine further the importance of building environment and housing price to air pollution and human health in future research. In addition, this study has confirmed the moderating effects of built environment and housing prices on air pollution and health, but some other factors, such as climate change (19, 46), that can also impact health were neglected. Numerous non-communicable diseases would be promoted and exacerbated by climate change’s increased environmental exposures (47). Consequently, climate change can be the focus of future research.
The original contributions presented in the study are included in the article/supplementary material, further inquiries can be directed to the corresponding author.
PW and YD: conceptualization. YD: methodology, formal analysis, and data curation. CW: software. YD and CW: validation. JW and YD: investigation. LH: resources. YD, CW, and JW: writing—original draft preparation. CW and JW: writing—review and editing. JW: visualization. PW: supervision, project administration, and funding acquisition. All authors have read and agreed to the published version of the manuscript.
This work was supported by the National Natural Science Foundation of China [Grant No. 51908249], the Natural Science Foundation of Jiangsu Province [Grant No. SBK2023022191], the Natural Science Foundation of the Jiangsu Higher Education Institutions of China [Grant No. 19KIB560012], the High-level Scientific Research Foundation for the introduction of talent for Jiangsu University [Grant No. 18JDG038], the Innovative Approaches Special Project of the Ministry of Science and Technology of China [Grant No. 2020IM020300], and the Science and Technology Planning Project of Suzhou [Grant No. ST202218].
The authors declare that the research was conducted in the absence of any commercial or financial relationships that could be construed as a potential conflict of interest.
All claims expressed in this article are solely those of the authors and do not necessarily represent those of their affiliated organizations, or those of the publisher, the editors and the reviewers. Any product that may be evaluated in this article, or claim that may be made by its manufacturer, is not guaranteed or endorsed by the publisher.
1. Yuan, M, Song, Y, Huang, Y, Shen, H, and Li, T. Exploring the association between the built environment and remotely sensed PM2.5 concentrations in urban areas. J Clean Prod. (2019) 220:1014–23. doi: 10.1016/j.jclepro.2019.02.236
2. Frank, LD, Iroz-Elardo, N, Mac Leod, KE, and Hong, A. Pathways from built environment to health: a conceptual framework linking behavior and exposure-based impacts. J Transp Health. (2019) 12:319–35. doi: 10.1016/j.jth.2018.11.008
3. Ping, L, Wang, Y, Lu, Y, Lee, LC, and Liang, C. Tracing the sources of PM2.5-related health burden in China. Environ Pollut. (2023) 327:121544. doi: 10.1016/j.envpol.2023.121544
4. Sun, S, Sarkar, C, Kumari, S, James, P, Cao, W, Yin, LRS, et al. Air pollution associated respiratory mortality risk alleviated by residential greenness in the Chinese elderly health service cohort. Environ Res. (2020) 183:109139. doi: 10.1016/j.envres.2020.109139
5. Khaddar, S, Rahman Fatmi, M, and Winters, M. How daily activities and built environment affect health? A latent segmentation-based random parameter logit modeling approach. Travel Behav Soc. (2023) 33:100624. doi: 10.1016/j.tbs.2023.100624
6. Wang, C, Sheng, Y, Wang, J, Wang, Y, Wang, P, and Huang, L. Air pollution and human health: investigating the moderating effect of the built environment. Remote Sens. (2022) 14:3703. doi: 10.3390/rs14153703
7. ApSimon, H, Oxley, T, Woodward, H, Mehlig, D, Dore, A, and Holland, M. The UK integrated assessment model for source apportionment and air pollution policy applications to PM2.5. Environ Int. (2021) 153:106515. doi: 10.1016/j.envint.2021.106515
8. Bi, S, Dai, F, Chen, M, and Xu, S. A new framework for analysis of the morphological spatial patterns of urban green space to reduce PM2.5 pollution: a case study in Wuhan, China. Sustain Cities Soc. (2022) 82:103900. doi: 10.1016/j.scs.2022.103900
9. Hang, J, Sandberg, M, Li, Y, and Claesson, L. Pollutant dispersion in idealized city models with different urban morphologies. Atmos Environ. (2009) 43:6011–25. doi: 10.1016/j.atmosenv.2009.08.029
10. Stone, B. Urban sprawl and air quality in large US cities. J Environ Manag. (2008) 86:688–98. doi: 10.1016/j.jenvman.2006.12.034
11. Wang, Y, Ying, Q, Hu, J, and Zhang, H. Spatial and temporal variations of six criteria air pollutants in 31 provincial capital cities in China during 2013-2014. Environ Int. (2014) 73:413–22. doi: 10.1016/j.envint.2014.08.016
12. Song, W, and Wu, Q. Gentrification and residential differentiation in Nanjing, China. Chin Geogr Sci. (2010) 20:568–76. doi: 10.1007/s11769-010-0432-2
13. Xu, Y, Song, W, and Liu, C. Social-spatial accessibility to urban educational resources under the school district system: a case study of public primary schools in Nanjing, China. Sustainability. (2018) 10:2305. doi: 10.3390/su10072305
14. Huang, C, Hu, J, Xue, T, Xu, H, and Wang, M. High-resolution spatiotemporal modeling for ambient PM2.5 exposure assessment in China from 2013 to 2019. Environ Sci Technol. (2021) 55:2152–62. doi: 10.1021/acs.est.0c05815
15. Wang, P, Yang, Y, Ji, C, and Huang, L. Influence of built environment on building energy consumption: a case study in Nanjing, China. Environ Dev Sustain. (2023):1–24. doi: 10.1007/s10668-023-02930-w
16. Cazzolla Gatti, R, Amoroso, N, and Monaco, A. Estimating and comparing biodiversity with a single universal metric. Ecol Modell. (2020) 424. doi: 10.1016/j.ecolmodel.2020.109020
17. Wang, Y, Huang, C, Hu, J, and Wang, M. Development of high-resolution spatio-temporal models for ambient air pollution in a metropolitan area of China from 2013 to 2019. Chemosphere. (2022) 291:132918. doi: 10.1016/j.chemosphere.2021.132918
18. Ma, Y, Zhou, L, and Chen, K. Burden of cause-specific mortality attributable to heat and cold: a multicity time-series study in Jiangsu Province, China. Environ Int. (2020) 144:105994. doi: 10.1016/j.envint.2020.105994
19. Chen, K, Bi, J, Chen, J, Chen, X, Huang, L, and Zhou, L. Influence of heat wave definitions to the added effect of heat waves on daily mortality in Nanjing, China. Sci. Total Environ. (2015) 506-507:18–25. doi: 10.1016/j.scitotenv.2014.10.092
20. Gao, Y, Gu, J, Shi, Y, Wang, H, Chen, T, and Di, Q. Association of short-term exposure to ambient fine particle matter with hospital admission risks and costs in China, a case-crossover study. Glob Transit. (2023) 5:40–9. doi: 10.1016/j.glt.2023.04.003
21. Yan, M, Ge, H, Zhang, L, Chen, X, Yang, X, Liu, F, et al. Long-term PM2.5 exposure in association with chronic respiratory diseases morbidity: a cohort study in northern China. Ecotoxicol Environ Saf. (2022) 244:114025. doi: 10.1016/j.ecoenv.2022.114025
22. Li, X, Wang, P, Wang, W, Zhang, H, Shi, S, Xue, T, et al. Mortality burden due to ambient nitrogen dioxide pollution in China: application of high-resolution models. Environ Int. (2023) 176:107967. doi: 10.1016/j.envint.2023.107967
23. Song, J, Wang, Y, Zhang, Q, Qin, W, Pan, R, Yi, W, et al. Premature mortality attributable to NO2 exposure in cities and the role of built environment: a global analysis. Sci Total Environ. (2023) 866:161395. doi: 10.1016/j.scitotenv.2023.161395
24. Wang, P, Li, Y, and Zhang, Y. An urban system perspective on urban flood resilience using SEM: evidence from Nanjing city, China. Nat. Hazards. (2021) 109:2575–99. doi: 10.1007/s11069-021-04933-0
25. Huang, L, Zhang, C, and Bi, J. Development of land use regression models for PM2.5, SO2, NO2 and O3 in Nanjing, China. Environ Res. (2017) 158:542–52. doi: 10.1016/j.envres.2017.07.010
26. Ehigiamusoe, KU, Majeed, MT, and Dogan, E. The nexus between poverty, inequality and environmental pollution: evidence across different income groups of countries. J Clean Prod. (2022) 341:130863. doi: 10.1016/j.jclepro.2022.130863
27. Bonilla-Bedoya, S, Estrella, A, Santos, F, and Herrera, MÁ. Forests and urban green areas as tools to address the challenges of sustainability in Latin American urban socio-ecological systems. Appl Geogr. (2020) 125:102343. doi: 10.1016/j.apgeog.2020.102343
28. Romero, H, Vásquez, A, Fuentes, C, Salgado, M, Schmidt, A, and Banzhaf, E. Assessing urban environmental segregation (UES). The case of Santiago de Chile. Ecol Indic. (2012) 23:76–87. doi: 10.1016/j.ecolind.2012.03.012
29. Venter, ZS, Figari, H, Krange, O, and Gundersen, V. Environmental justice in a very green city: spatial inequality in exposure to urban nature, air pollution and heat in Oslo, Norway. Sci Total Environ. (2023) 858:160193. doi: 10.1016/j.scitotenv.2022.160193
30. Ma, L, Huang, Y, and Liu, T. Unequal impact of the COVID-19 pandemic on mental health: role of the neighborhood environment. Sustain Cities Soc. (2022) 87:104162. doi: 10.1016/j.scs.2022.104162
31. Ding, J, Hu, X, Zhang, X, Shang, L, Yu, M, and Chen, H. Equity and efficiency of medical service systems at the provincial level of China’s mainland: a comparative study from 2009 to 2014. BMC Public Health. (2018) 18:214. doi: 10.1186/s12889-018-5084-7
32. Hoek, G, Beelen, R, Kos, G, Dijkema, M, Der, ZSCV, Fischer, PH, et al. Land use regression model for ultrafine particles in Amsterdam. Environ Sci Technol. (2011) 45:622–8. doi: 10.1021/es1023042
33. Park, SH, and Ko, DW. Investigating the effects of the built environment on PM2.5 and PM10: a case study of Seoul metropolitan city, South Korea. Sustainability. (2018) 10:4552. doi: 10.3390/su10124552
34. Weichenthal, S, van Ryswyk, K, Goldstein, A, Shekarrizfard, M, and Hatzopoulou, M. Characterizing the spatial distribution of ambient ultrafine particles in Toronto, Canada: a land use regression model. Environ Pollut. (2016) 208:241–8. doi: 10.1016/j.envpol.2015.04.011
35. Xu, Z, Niu, L, Zhang, Z, Hu, Q, Zhang, D, Huang, J, et al. The impacts of land supply on PM2.5 concentration: evidence from 292 cities in China from 2009 to 2017. J Clean Prod. (2022) 347:131251. doi: 10.1016/j.jclepro.2022.131251
36. Xiao, Y, Lu, Y, Guo, Y, and Yuan, Y. Estimating the willingness to pay for green space services in Shanghai: implications for social equity in urban China. Urban For Urban Green. (2017) 26:95–103. doi: 10.1016/j.ufug.2017.06.007
37. Wang, P, and Kang, M. An empirical analysis on the housing prices in the Pearl River Delta economic region of China. Int J Urban Sci. (2014) 18:103–14. doi: 10.1080/12265934.2014.891557
38. Cheng, Z, King, SP, Smyth, R, and Wang, H. Housing property rights and subjective wellbeing in urban China. Eur J Polit Econ. (2016) 45:160–74. doi: 10.1016/j.ejpoleco.2016.08.002
39. Chan, EHW, So, HM, Tang, BS, and Wong, WS. Private space, shared space and private housing prices in Hong Kong: an exploratory study. Habitat Int. (2008) 32:336–48. doi: 10.1016/j.habitatint.2007.11.004
40. Dell’Anna, F, Bravi, M, and Bottero, M. Urban green infrastructures: how much did they affect property prices in Singapore? Urban For Urban Green. (2022) 68:127475. doi: 10.1016/j.ufug.2022.127475
41. Chen, J, Hardin, W, and Hu, M. Housing, wealth, income and consumption: China and homeownership heterogeneity. Real Estate Econ. (2020) 48:373–405. doi: 10.1111/1540-6229.12245
42. Chen, S, and He, LY. Taxation and the environment–health–poverty trap: a policy experiment perspective. China World Econ. (2019) 27:72–92. doi: 10.1111/cwe.12268
43. Yu, P, Zhang, S, Wang, P, Li, Y, and Huang, L. Evaluation and prediction of land use change impacts on ecosystem service values in Nanjing City from 1995 to 2030. Environ Sci Pollut Res. (2022) 30:18040–63. doi: 10.1007/s11356-022-23346-5
44. Wu, L, and Kim, SK. Health outcomes of urban green space in China: evidence from Beijing. Sustain Cities Soc. (2021) 65:102604. doi: 10.1016/j.scs.2020.102604
45. Wang, P, Yang, Y, Ji, C, and Huang, L. Positivity and difference of influence of built environment around urban park on building energy consumption. Sustain Cities Soc. (2023) 89:104321. doi: 10.1016/j.scs.2022.104321
46. Long, Y, Wu, Y, Xie, Y, Huang, L, Wang, W, Liu, X, et al. PM2.5 and ozone pollution-related health challenges in Japan with regards to climate change. Glob Environ Chang. (2023) 79:102640. doi: 10.1016/j.gloenvcha.2023.102640
Keywords: built environment, health inequalities, air pollution, residential segregation, housing price
Citation: Ding Y, Wang C, Wang J, Wang P and Huang L (2023) Revealing the impact of built environment, air pollution and housing price on health inequality: an empirical analysis of Nanjing, China. Front. Public Health. 11:1153021. doi: 10.3389/fpubh.2023.1153021
Edited by:
Mei-Po Kwan, The Chinese University of Hong Kong, ChinaReviewed by:
Jing Han, Jinan Municipal Center for Disease Control and Prevention, ChinaCopyright © 2023 Ding, Wang, Wang, Wang and Huang. This is an open-access article distributed under the terms of the Creative Commons Attribution License (CC BY). The use, distribution or reproduction in other forums is permitted, provided the original author(s) and the copyright owner(s) are credited and that the original publication in this journal is cited, in accordance with accepted academic practice. No use, distribution or reproduction is permitted which does not comply with these terms.
*Correspondence: Peng Wang, dXBlc3dwQHVqcy5lZHUuY24=
Disclaimer: All claims expressed in this article are solely those of the authors and do not necessarily represent those of their affiliated organizations, or those of the publisher, the editors and the reviewers. Any product that may be evaluated in this article or claim that may be made by its manufacturer is not guaranteed or endorsed by the publisher.
Research integrity at Frontiers
Learn more about the work of our research integrity team to safeguard the quality of each article we publish.