 Laijun Zhao
 Mengmeng Min
 Xiaoyan Huang2
 Ying Qian
- 1Business School, University of Shanghai for Science and Technology, Shanghai, China
- 2Emergency Management Office, Shanghai Municipal Center for Disease Control and Prevention, Shanghai, China
Background: The COVID-19 pandemic is sweeping the world, and countries along the Belt and Road (B&R) route have also been hit hard. However, the impact varied greatly from country to country, some severely and others mildly. What factors have led to such a wide variation?
Method: In this paper, we considered institutional, infrastructural, economic, social, and technological resilience as components of overall anti-pandemic resilience, and constructed a set of indicators to evaluate this resilience for B&R countries in 2020. We evaluated the anti-pandemic resilience using the combined empowerment–VIKOR method, and classified the countries into different resilience levels by means of hierarchical clustering. The validity of the evaluation indicator system was verified by analyzing the consistency between the actual performance and the assessed resilience.
Results: The ranking results showed that Israel and Bahrain were representative of countries that had the highest resilience, Hungary and Estonia represented countries with moderate resilience, and Laos and Cambodia represented countries with the lowest resilience. We also found that countries with high resilience had much better institutional and economic resilience than countries with moderate resilience, whereas countries with low resilience lagged behind in both infrastructural and social resilience. Based on these findings, policy recommendations were offered to help B&R countries respond to future pandemics.
1. Introduction
The Belt and Road Initiative, launched by China in 2013, is a vast development project that has substantially impacted the economies and societies of the countries situated along its routes. In addition to prioritizing economic collaboration and infrastructure construction, the Belt and Road Cooperation Initiative also directed attention to public health, implementing several cooperative endeavors. These initiatives aimed to narrow the healthcare infrastructure disparities in low-and middle-income nations and involved the establishment of global health research institutes in partnership with universities, with the objective of enhancing medical and healthcare standards (1).
However, the sudden global spread of COVID-19 in 2020 has impeded the progress of the initiative, which has served as a vital test of the effectiveness of the Belt and Road development and cooperation initiatives. Countries located along the Belt and Road have been particularly hard hit, with many of them being developing countries where controlling the pandemic and driving recovery may be more challenging (2). Nevertheless, certain countries have exhibited exceptional resilience and have successfully mitigated the pandemic’s impact, returning to normalcy. What factors have led to such a wide variation? The underlying reasons for such discrepancies require further examination. In this paper, we construct a set of indicators to evaluate the anti-pandemic resilience of B&R countries in 2020. This assessment can identify successful and underperforming countries, pinpoint areas for improvement and address weak links. The policy advice formulated based on these findings can be instrumental in better preparing for future pandemics.
The concept of resilience has evolved from its origins in engineering resilience to include ecological resilience, evolutionary resilience, and now, pandemic resilience, thereby enriching research on resilience (3). With the study of evolutionary resilience, resilience is no longer only understood as tolerance of external pressures and recovery to the original state; increasing emphasis is being put on stable development of a resilient system, which can achieve self-adaptation and transformation according to its own laws regardless of changes in its external environment (4). At the beginning of the 21st century, as urbanization continues to accelerate, human society is increasingly facing disaster threats that are characterized by high uncertainty and complexity. The traditional disaster governance framework is inadequate to respond to this new context, so resilience theory has been introduced to support disaster responses and management planning for cities and communities (5). Quantifying urban and community resilience by constructing a system of evaluation indicators is an increasingly common approach (6, 7). In response to the need for disaster mitigation under compound hazards, most evaluation indicator systems integrate environmental, infrastructural, economic, social, and institutional resilience into a unified resilience evaluation framework (8–10).
Since the COVID-19 outbreak, the concept of resilience has been increasingly applied to study the pandemic response. Several papers considered the pandemic’s impacts on individuals by examining the psychological resilience of healthcare professionals and the public (11, 12), and some scholars have assessed the organizational resilience of enterprises that survived the pandemic (13, 14). Other scholars have explored anti-pandemic resilience at the national level by examining a country’s performance against COVID-19 from different perspectives such as governance capacity (15, 16), infrastructure development (17–19), economic relief and market volatility (20, 21), community engagement (22, 23), and technology adoption (using technology to improve the response) (24, 25). A few studies have considered COVID-19 as a systematic risk (26) and have integrated the abovementioned dimensions. For example, Haldane et al. (27) constructed a systemic health system resilience framework based on governance and finance, the health workforce, health provision, and community participation to depict the resilience of 28 countries. Chua et al. (28) characterized Singapore’s resilience to the COVID-19 pandemic based on eight core dimensions, including clear leadership and governance, risk communication, health service delivery, and crisis financing. However, these studies were confined to the development of frameworks without implementing quantitative measurements.
Based on our literature review, the existing literature has mainly viewed cities and communities as objects of resilience evaluation, and few resilience studies were conducted at a national or regional level (29). However, COVID-19 has triggered an unprecedented global crisis, and has shifted the resilience perspective from national to regional and global levels. Although some of the literature (15–23) discussed the performance of countries against COVID-19 from a resilience perspective, most focused on only a single dimension, which is inadequate because COVID-19 is a multidimensional test that demands a comprehensive examination of resilience. Although a few studies (26–28) combined multiple resilience dimensions to explore anti-pandemic performance, they still emphasized framework design and were not evaluated in a practical context.
In terms of evaluation methods, resilience assessment has mostly used multi-criteria decision making models, and the empowerment method was used to provide the weights of indicators, with the VIKOR method implemented for the final ranking (30, 31). For example, Abdali et al. (32) constructed an evaluation index system for urban community resilience, then integrated the indices through hierarchical analysis and the VIKOR technique. Sharifi et al. (33) combined Shannon’s entropy with the VIKOR method to rank the resilience of nine neighborhoods in Iran. In summary, the combined empowerment–VIKOR technique is a mainstream method for ranking of evaluation objects, including in the context of disaster resilience evaluation.
Based on this review, we designed the present study to examine anti-pandemic resilience. First, the B&R countries were chosen as research subject, and an evaluation indicator system was constructed to measure their resilience. Next, the weights of the indicators were determined by using the combined empowerment method, and the anti-pandemic resilience of the B&R countries in 2020 was evaluated by using the VIKOR method. We then performed hierarchical clustering to group the countries based on their resilience levels. A consistency test was conducted to compare the actual performance of the countries with the assessed resilience based on our model to verify the validity of the evaluation indicator system. Finally, based on the results of this analysis, policy recommendations were provided to help countries respond better to future pandemics.
The paper is organized as follows: In Section 2, a set of evaluation indicators is constructed and evaluation methods are developed for anti-pandemic resilience assessment. In Section 3, the resilience ranking and clustering results, as well as the validity of the evaluation indicator system, are presented. This validity is confirmed through testing the consistency of actual performance with the assessed resilience. Section 4 analyzes the anti-pandemic resilience of the Belt and Road countries and puts forth policy recommendations to enhance their resilience for future pandemics. Finally, the main conclusions of this study are summarized in Section 5.
2. Materials and methods
2.1. Data sources and study areas
We focused on the anti-pandemic resilience of the B&R countries in 2020, using data in terms of factors such as the governance capacity, public health preparedness, infrastructure development, national health status, educational attainment, and the state of research and development (R&D) to construct a system of evaluation indicators. The data obtained for each indicator was from the latest datasets available in the Oxford Coronavirus Government Response Tracker (OxCGRT1), the COVID-19 Regional Security Assessment database,2 the United Nations database,3 the World Bank database,4 the WHO Global Health Observatory database,5 the United Nations Conference on Trade and Development database,6 the Human Development Index database,7 and the World Intellectual Property Organization statistical database.8
A total of 66 countries lie along the B&R route (34), and we evaluated the anti-pandemic resilience for 53 of the countries for which a complete dataset was available. Of the 13 excluded countries, the real-time outbreak data for Bhutan and Turkmenistan was not included in the World Coronavirus Outbreak Database.9 Data on the performance of pandemic prevention policies for Armenia, Montenegro, North Macedonia, Tajikistan, and Maldives was not included in OxCGRT. In addition, six war-torn countries (Yemen, Palestine, Syria, Lebanon, Iraq, and Afghanistan) lacked the most basic medical services, and their volatile situation during the pandemic nearly eliminated their anti-pandemic measures; they were therefore also excluded from this study. Figure 1 shows the study area and the countries along the B&R route. The definitions of all country abbreviations used in Figure 1 are shown in Supplementary Table S1.
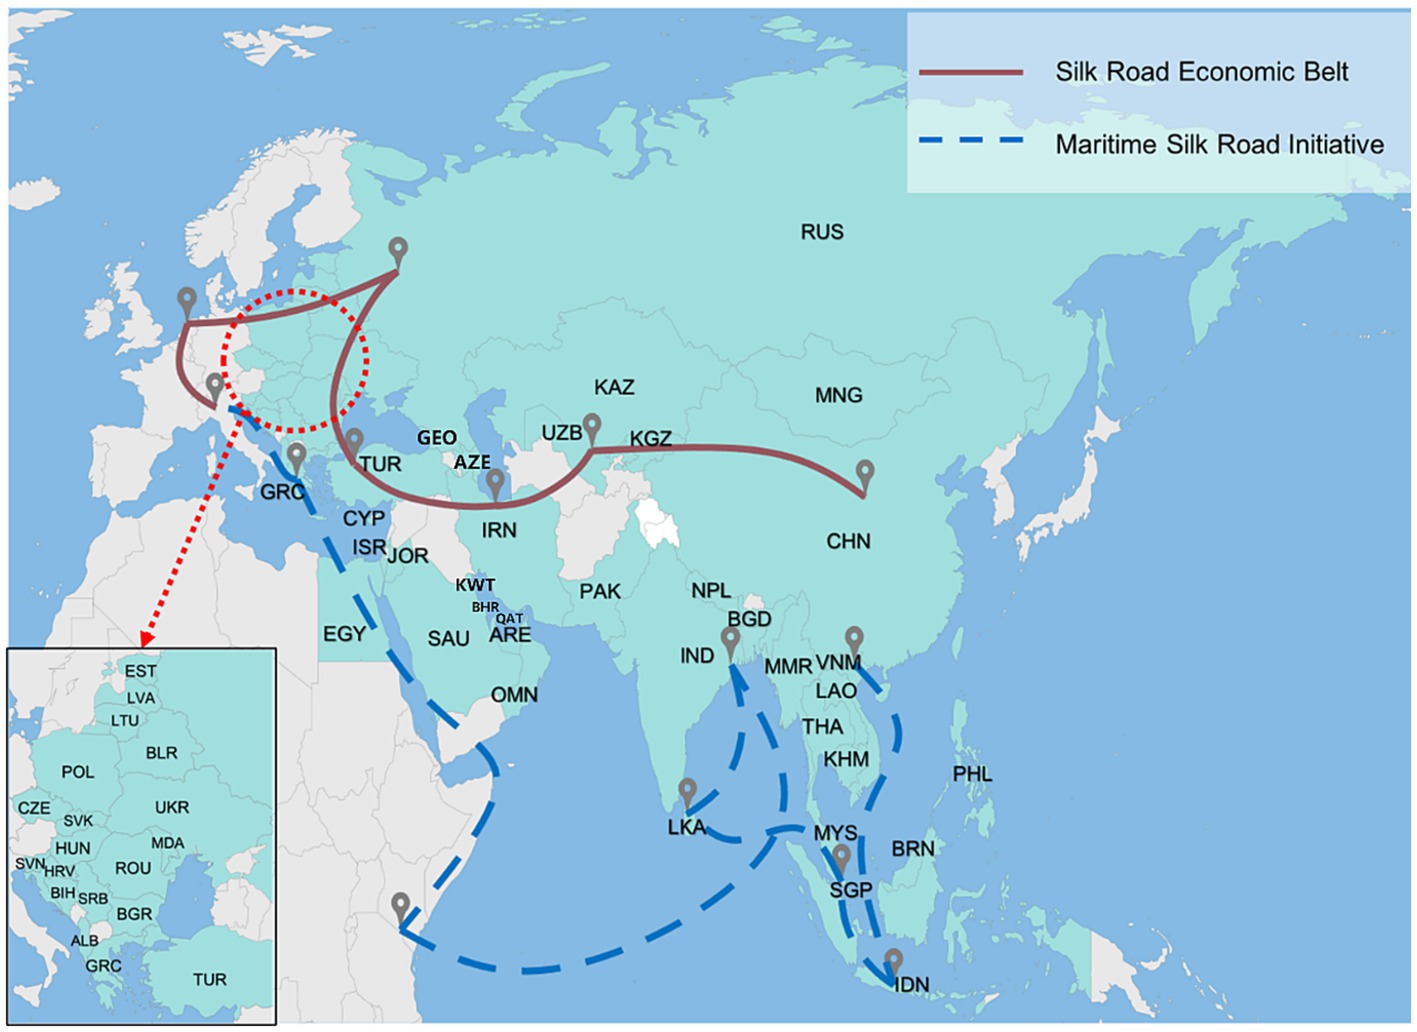
Figure 1. The 53 countries along the Belt and Road route (which comprises the Silk Road Economic Belt and Maritime Silk Road Initiative).
2.2. Development of an evaluation indicator system for quantifying anti-pandemic resilience
Based on the abovementioned resilience dimensions and the factors that influence resilience, we defined five first-level indicators of resilience: institutional, infrastructural, economic, social, and technological resilience. These first-level indicators were subdivided into 12 s-level indicators and 26 third-level indicators. Table 1 summarizes the evaluation indicator system, and Supplementary Table S2 presents a detailed description of each indicator.
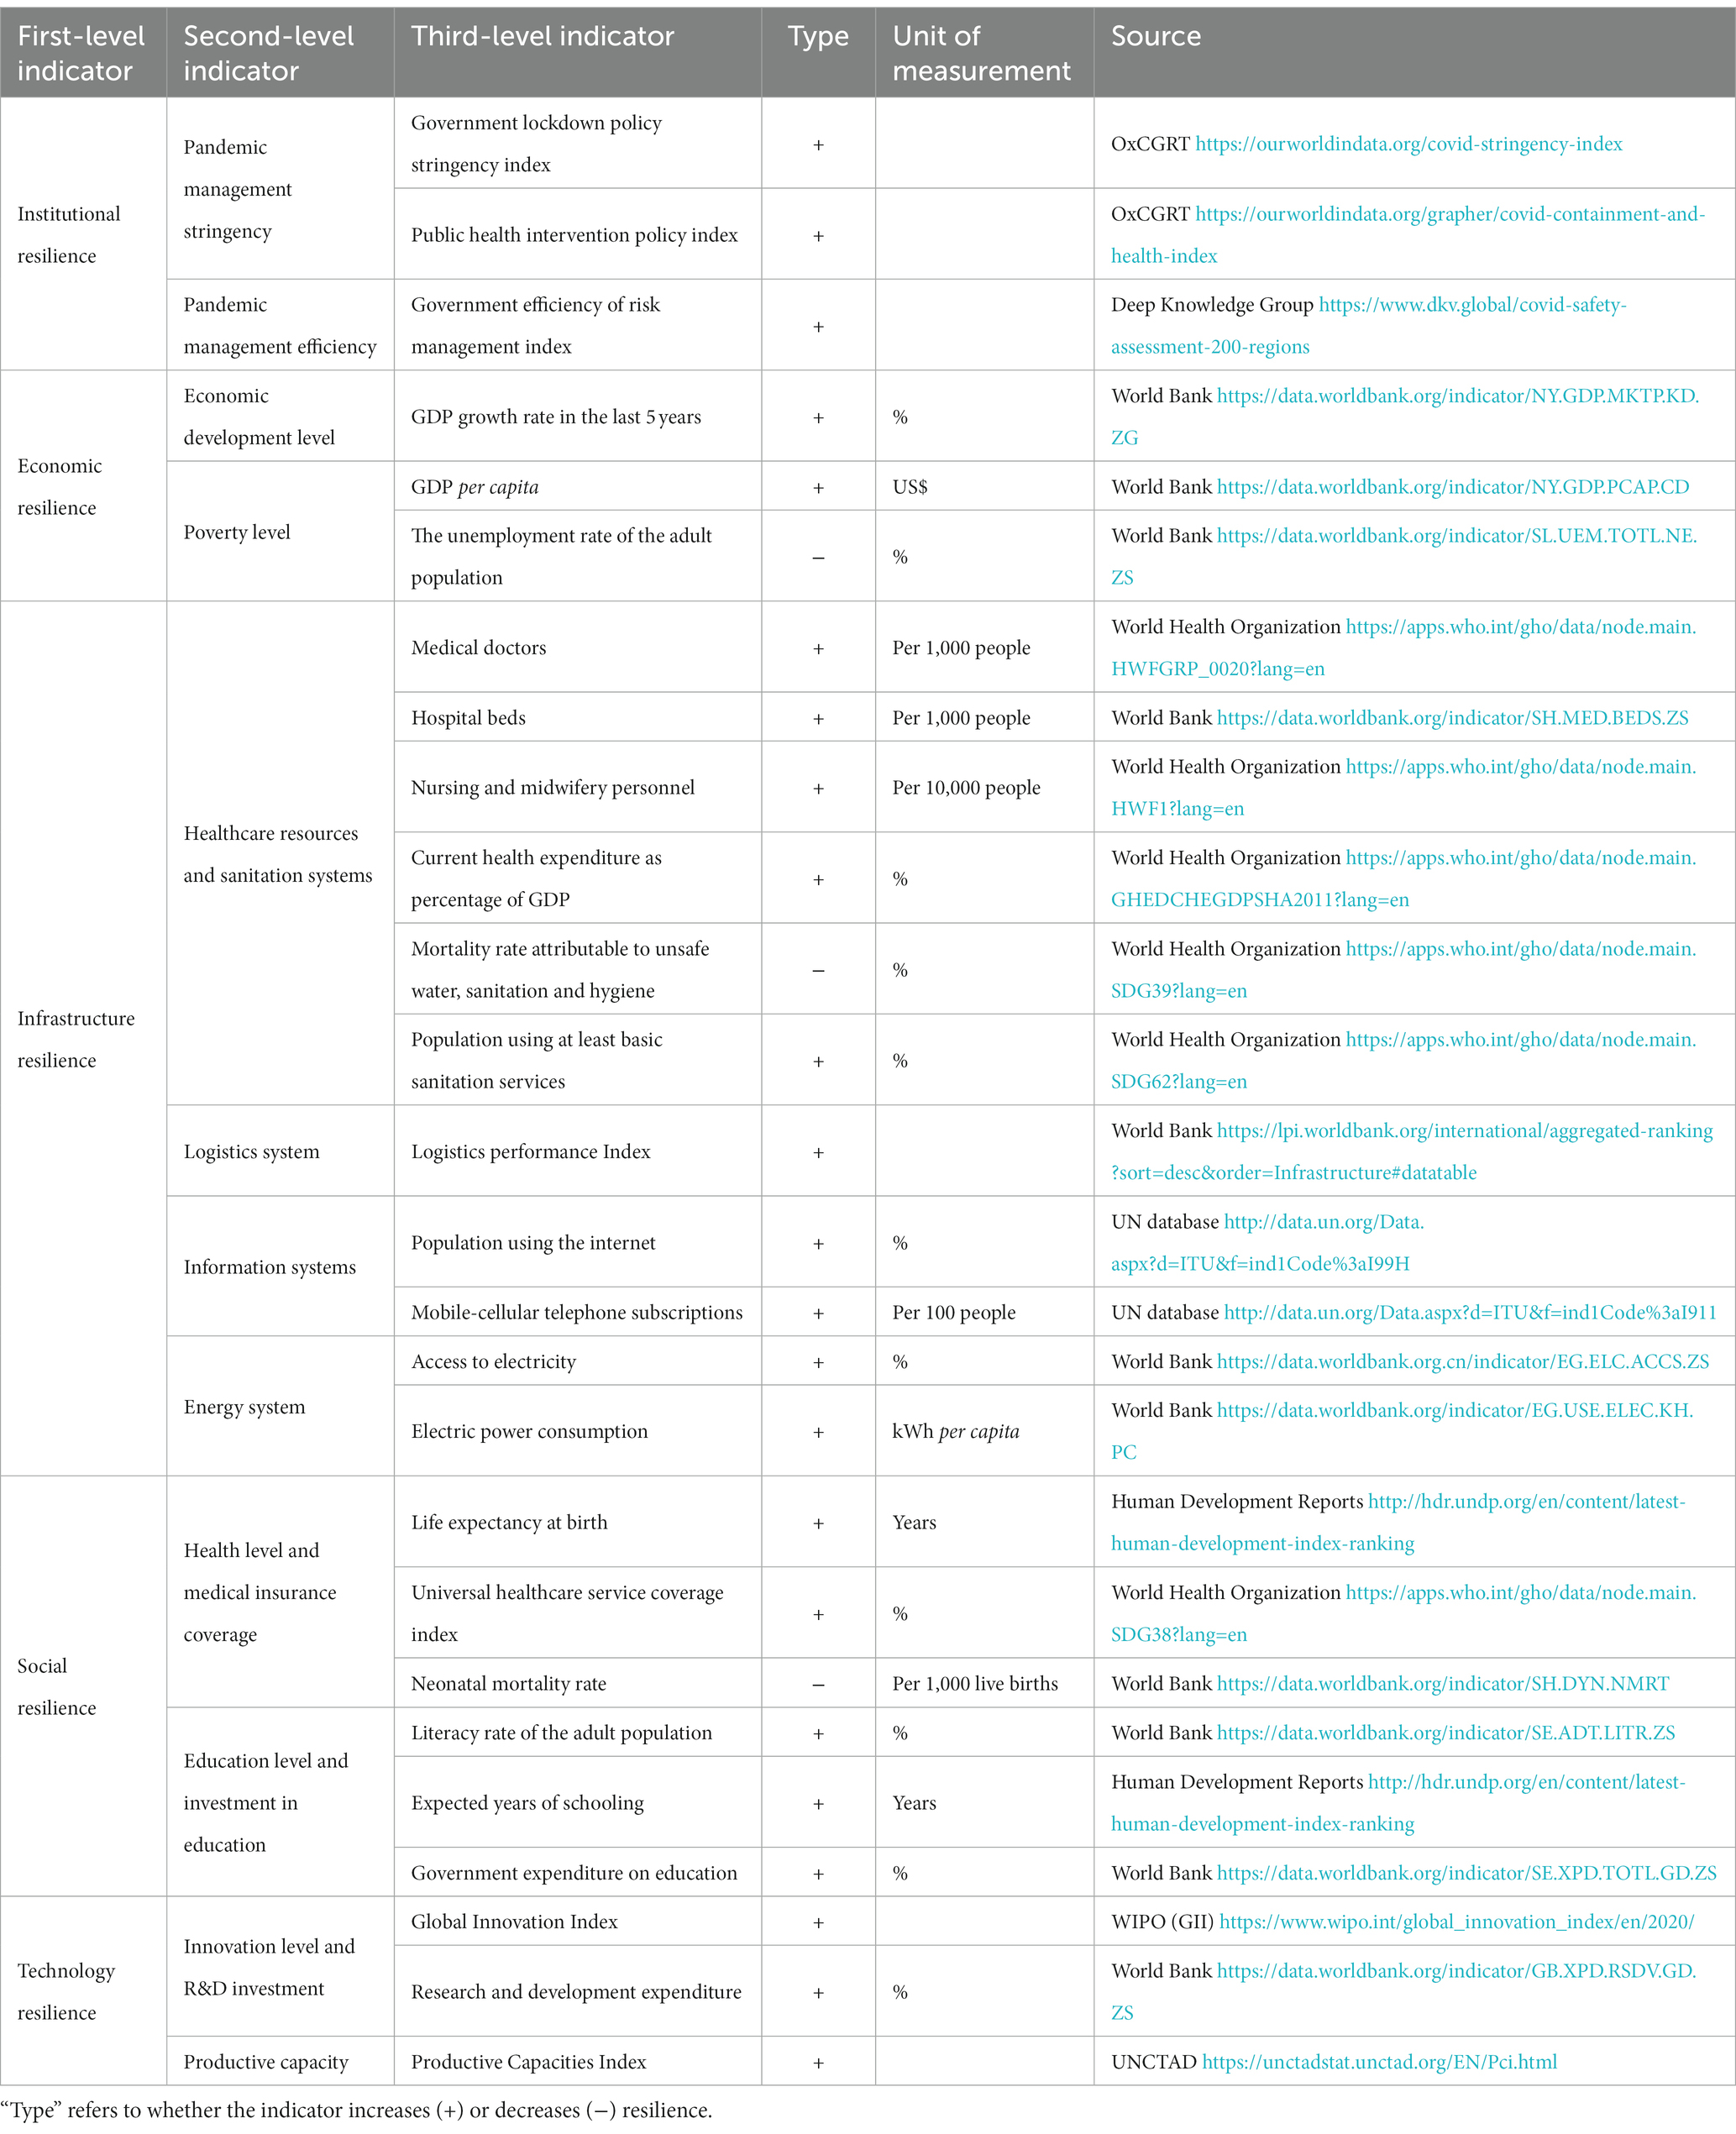
Table 1. Evaluation indicator system for the anti-pandemic resilience of countries along the B&R route.
2.2.1. Institutional resilience
The institutional resilience of government is reflected in its ability to organize, manage, and act in the event of a disaster. Numerous studies have demonstrated the effectiveness of non-pharmaceutical interventions undertaken by the government in containing outbreaks (15, 16, 35). In this study, we assess the institutional resilience in terms of pandemic management stringency and efficiency using data from OxCGRT and the COVID-19 Regional Security Assessment Database.
Pandemic management stringency: The lockdown policy stringency index indicates the strictness of government on pandemic prevention and control. The public health intervention policy index represents the government’s policy performance in using health instruments to enable pandemic control. Pandemic management efficiency: The government’s risk management efficiency index reflects the efficiency of government in the face of emergencies.
2.2.2. Infrastructural resilience
COVID-19 has created compounding shocks to national infrastructures (17) in terms of health, logistics, energy, and information systems. The capacity of infrastructure systems to withstand extreme stresses is an important aspect of a country’s resilience to pandemic.
Health system: Adequate health resources and basic sanitation facilities are needed to meet emergency needs during a pandemic (18, 27, 36). The health system indicators we selected are: the numbers of doctors, beds, and nurses (including midwives) per capita, which reflect the medical relief capacity during a pandemic. The share of GDP accounted for by health care expenditures, which reflects the priority given to health care by the national government. The mortality rate due to unsafe water, sanitation and hygiene, and the number of people covered by basic sanitation services reflect the adequacy of the national hygiene facilities.
Logistics system: Logistics represents the role of marshaling and distributing goods, and is critical for the continued functioning of the supply chain (37). The logistics performance index measures the national logistics development and reflects the ability to deploy human and material resources during the pandemic.
Energy system: The energy system is critical to maintaining the order of daily life and the functioning of critical sectors (especially for hospitals and factories) (19, 38). The coverage of a country by the electrical grid and electric power consumption can reflect the resilience of a country’s energy system.
Information systems: Information technology facilitates the distribution of information and plays important roles in tracking and detection, telemedicine, and home office work (25, 39). We measure the ability to use the information technology to mitigate the impact of the pandemic through two indicators: the proportion of the population using the Internet and the percentage of the population that uses a cell phone.
2.2.3. Economic resilience
The level of economic development reflects the national economic basis to withstand the shock, whilst poverty may cause a country to be more vulnerable to pandemic shocks (20, 21). In this paper, we chose two second-level indicators: the level of economic development and the level of poverty. For the level of economic development, we used the economic growth rate in the past 5 years to reflect the growth rate of the country’s total economy and overall economic strength For the level of poverty, we used the GDP per capita and unemployment rate to measure the average living standard of the population and the scale of economically vulnerable groups.
2.2.4. Social resilience
In the face of an epidemic, it is crucial for a citizens to be in a good shape and equip with sufficient knowledge to know what is happening and how they can respond (22, 40). We chose two second-level indicators under social resilience: the health level and medical insurance coverage, and the education level and investment in education.
Health level and medical insurance coverage: Life expectancy per capita and the neonatal mortality rate reflect the overall health status of citizens. Universal healthcare reflects the state’s coverage of basic health services required by citizens (41). Education level and investment in education: The expected years of schooling and literacy rate reflect the development of education. The education expenditure reflects the importance the national government attaches to education.
2.2.5. Technological resilience
Technological resilience reflects a country’s ability to adapt to disasters as quickly as possible. The most powerful weapons in the human battle against disease are science and technology, since the ability to develop (science) and produce (technology) vaccines to overcome viruses is essential for the early response and subsequent recovery (42). We chose two second-level indicators, namely the level of R&D and the production capacity, to measure the technological resilience.
For the level of R&D, we used the R&D expenditure and the global innovation index to reflect the country’s scientific and technological strengths and innovation performance. For the production capacity, we used the productive capacity index from the UNCTAD database to reflect a country’s ability to produce goods and services.
2.3. Evaluation methods for anti-pandemic resilience assessment
The previous section described the inputs for developing the evaluation indicator system. In this section, we determine the weight of each indicator. To do so, we integrate a weighting method with a three-scale method and the improved entropy method, making full use of objective information but also accounts for subjective choices by decision-makers.
2.3.1. Determination of weights
(1) Determining the weight of the first-level indicators using the three-scale method
The three-scale method is used to perform pairwise comparisons between indicators. Here, using the 1–3 scales method instead of 1–9 scales can make it easier to accurately determine the judgment matrix and to meet the consistency requirements for integrating multiple indicators (43). We used the following method to integrate the weights of the five first-level indicators that we chose:
We used the three-scale method (with values of 0, 1, or 2) to perform pairwise comparisons of the five indicators, and established a comparison matrix to calculate the rank of each indicator. We used D = (dij) = {0,1,2} to represent the judgment scale set, where dij = 0 means that eigenfactor i is less important than eigenfactor j, dij = 1 means that eigenfactor i is as important as eigenfactor j, and dij = 2 means that eigenfactor i is more important than eigenfactor j.
With 2020 being the first year of the fight against COVID-19 in most countries, breaking the chain of virus transmission was particularly critical in the absence of an effective vaccine. Non-pharmaceutical interventions such as lockdowns, quarantine, wearing masks, and tracking have proven to be the most effective means of pandemic control (44, 45), so we considered institutional resilience (IR) to be the most important indicator. Technological resilience (TR) refers to the level of R&D and productive capacity, which is a proxy for the development and production of vaccines. However, since we focused on national anti-pandemic performance in 2020, when vaccines were not yet widely available (46), we considered TR to be the least important indicator. We propose that infrastructure resilience (FR), economic resilience (ER), and social resilience (SR) were also important dimensions for mitigating the pandemic, with intermediate values between IR and TR, and were equally important. Table 2 shows the resulting pairwise comparisons.
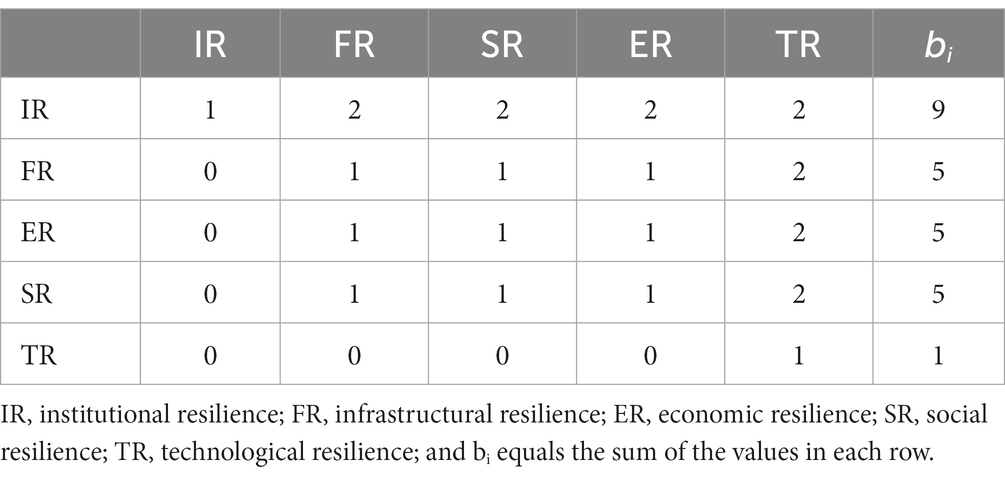
Table 2. Comparison matrix for the eigenfactors of the five first-level indicators.
We constructed the judgment matrix using the range method. In this method, yij denotes the ratio of the importance of eigenfactor i to eigenfactor j. The ratio of the importance of eigenvector j to that of eigenfactor i is then 1/yij. According to the range method, f(bi, bj) = yij = , and Y = (yij) is the consistency judgment matrix. yb is the relative importance of the range element pairs, and is predetermined, and is generally assigned a constant value of yb = 9 based on a certain standard (47). B = max (b1, b2, b3, b4, b5) – min (b1, b2, b3, b4, b5), and equals the range, so B = 8 in this paper based on the values in Table 2. Accordingly, the eigenfactor judgment matrix is then obtained as follows:
Where
The weights of the five first-level indicators are included in the transform matrix for IR, FR, ER, SR, and TR, respectively.
If C is a partial matrix of Y that contains the first five columns of Y, then L = (li)5 × 1 = C·WT = (2.164, 0.721, 0.721, 0.721, 0.240)T. The maximum eigenvalue is , and satisfies the consistency test. Therefore, the weights of the five first-level indicators obtained by the three-scale method are for IR, FR, ER, SR, and TR, respectively.
(2) Determining the weight of the second-level indicators using the arithmetic mean method
Next, we assigned weights to the second-level indicators based on the weights of the first-level indicators. Let the set C i denote all the second-level indicators corresponding to the i-th first-level indicator, and let wij denote the weight of the j-th second-level indicator. The formula for calculating the weights of the second-level indicators is then:
Where denotes the weight of the i-th first-level indicator, and |Ci| denotes the number of all of all second-level indicators in set Ci. It is difficult for us to objectively judge the differences in the importance of secondary indicators, so we assigned the weights of the second-level indicators (wij) by equally dividing among the second-level indicators.
(3) Determining the weight of the third-level indicators using the improved entropy-weight method
We used the improved entropy-weight method to measure the weights of the third-level indicators, using the following method:
Establish an anti-pandemic resilience assessment matrix for countries along the B&R route. We collected data for the indicator system and constructed the original matrix A, which contains data from the 53 B&R countries for the 26 resilience evaluation indicators. The set of resilience evaluation indicators is denoted as {A1, A2, …, A26}, and aq denotes the q-th indicator for q = 1 to 26 and p represents countries 1 to 53:
Where apq represents the value of the q-th indicator for the p-th country, and the indicators are transformed differently according to the characteristics of the indicator apq:
Where denotes the maximum value in the q-th column of the matrix: denotes the minimum value in the q-th column: .
Thus, the decision matrix X is created:
Transform the decision matrix into dimensionless data, resulting in the standardized decision matrix X’.
Calculate the entropy value (Eq) and the weights of the third-level indicators:
The set of indicators corresponding to the data matrix is {A1, A2, …, Aq, … A26}, and Cij is the set of third-level indicators corresponding to the j-th second-level indicator. If the indicators in column Aq of the data matrix (i.e., the third-level indicators) belong to the set, then:
Where wq,ij denotes the weights of the third-level indicators corresponding to the j-th second-level indicator, and the indicators in column Aq (the third-level indicators) belong to the set Cij. represents the sum of the weights of all third-level indicators under the j-th second-level indicator.
Calculate the final weights of the third-level indicators in the column Aq:
The final weight wq of each third-level indicator in the column Aq is the entropy weight of the third-level indicator calculated in the previous step multiplied by the weight of its corresponding second-level indicator.
Where wij represents the weight of the j-th second-level indicator under the i-th first-level indicator, which is obtained as described in Section 3.1.2. wq,ij represents the weight of the third-level indicator under the j-th second-level indicator, and Aq ∈ Cij, which is obtained by the improved entropy-weight method (Section 3.1.3). In summary, the final weights wq of the 26 third-level indicators can be obtained using Equation (15).
2.3.2. Evaluate a country’s anti-pandemic resilience using the VIKOR method
The TOPSIS and VIKOR methods have both been introduced as applicable techniques for implementation in multi-criteria decision-making. However, TOPSIS cannot account for the utility of a given solution to the group or for the individual regrets. VIKOR overcomes that shortcoming to arrive at a more rational decision (48). Therefore, to assess the anti-pandemic resilience for countries along the B&R route, we used the VIKOR method to rank each country’s resilience by building an evaluation indicator system and setting indicator weights. The calculation process is as follows.
First, we standardize the original matrix A so that the values of all indicators are within [0, 1]:
Where apq is the value for the p-th country and q-th indicator (p = 1 to 53 and q = 1 to 26), and max and min represent the maximum and minimum values for the q-th indicator.
Next, we use the dimensionless to obtain fpq as follows:
We then determine the positive and negative ideal solutions for each attribute as and :
Where J1 is the set of benefit-based indicators and J2 is the set of cost-based indicators.
Next, we calculate the distance to the ideal solution for each scheme:
First, we calculate the population utility Sp and the individual regret Rp for each scheme, where Sp represents the weighted distance of the p-th scheme from the ideal solution and Rp represents the maximum distance of the p-th scheme from the positive ideal solution:
where wq denotes the final weight of the third-level indicator Aq that we obtained in the previous section.
Afterwards, we calculate the holistic value Qp for each country based on group (population) utility and individual regret:
where both the group utility Sp and the individual regret Rp are cost attributes, and their positive and negative ideal solutions are S+ = min(Sp), S− = max(Sp), R+ = min(Rp), and R− = max(Rp) for p = 1 to 53. V represents the degree of preference for maximizing group utility and minimizing individual regret. A value of V greater than 0.5 indicates a preference for maximizing group utility, whereas a value less than 0.5 indicates a preference for minimizing individual regret. Here, we set V = 0.5 to indicate no preference.
Finally, we defined the anti-pandemic resilience (Up) using Equation 23. The value of resilience ranges from 0 to 1, and the higher the value, the higher the resilience.
2.3.3. Classify levels of anti-pandemic resilience using the hierarchical clustering method
We performed hierarchical clustering of the 53 B&R countries based on the evaluated resilience value up obtained by the VIKOR method described in the previous section. We classified the countries into different levels according to the clustering results to analyze the resilience performance with different levels.
In the first step, we applied hierarchical clustering to cluster the resilience performance of the 53 countries along the B&R route. We used version 22.0 of the SPSS software10 to calculate the distance between data points based on the sum of squares of the deviations (Ward’s method), using the Up value obtained above as the analysis variable. In this approach, data points that are close to each other are grouped into one category as much as possible, so that the distance within a given category is smaller and the distance between different categories is larger. The calculation is performed iteratively, adding one data point at a time, until all data points are completely grouped into one category. The corresponding clustering spectrum can then be graphed.
In the second step, we calculated the silhouette coefficients to determine the optimal clustering number for the 53 countries (49). The silhouette coefficient S(i) combines two factors: cohesion a(i) and dispersion b(i). a(i) represents the average distance between object i and the other objects in the same cluster, and b(i) represents the average distance between object i and all objects in other clusters. The silhouette coefficient takes values in [−1, 1], and the closer the value is to 1, the more compact the objects in the cluster are to each other, the larger the distance between clusters, and the better the clustering effect. We therefore chose the number of categories when the silhouette coefficient was closest to 1 as the final clustering number:
3. Results
3.1. Resilience ranking and clustering for countries along the B&R route
Based on the VIKOR results, we ranked the resilience of the B&R countries in 2020 using U p (Table 3). The five most resilient countries were Israel, Bahrain, China, Singapore, and the UAE; the five least resilient were Kyrgyzstan, Iran, Myanmar, the Lao PDR, and Cambodia.

Table 3. Ranking of the Belt and Road countries based on anti-pandemic resilience (Up); low ranks and Up values represent high resilience.
The effectiveness of the different clusters was assessed by analyzing the clustering silhouette coefficients S(i). Figure 2 shows that the silhouette coefficient reached its maximum value of 0.659 with K = 3 clusters, so this represents the optimal clustering. Therefore, we divided the 53 B&R countries into three categories and analyzed the anti-pandemic resilience in these categories.

Figure 2. Silhouette coefficient (S) diagram for K clusters.
Figure 3 shows the clustering diagram with three clusters. The 53 countries along the B&R route can be classified into groups with high resilience (Up > 0.7), moderate resilience (0.3 < Up < 0.7), and low resilience (Up < 0.3) levels based on Up (Table 3). Table 4 summarizes the countries within each group in order of resilience.
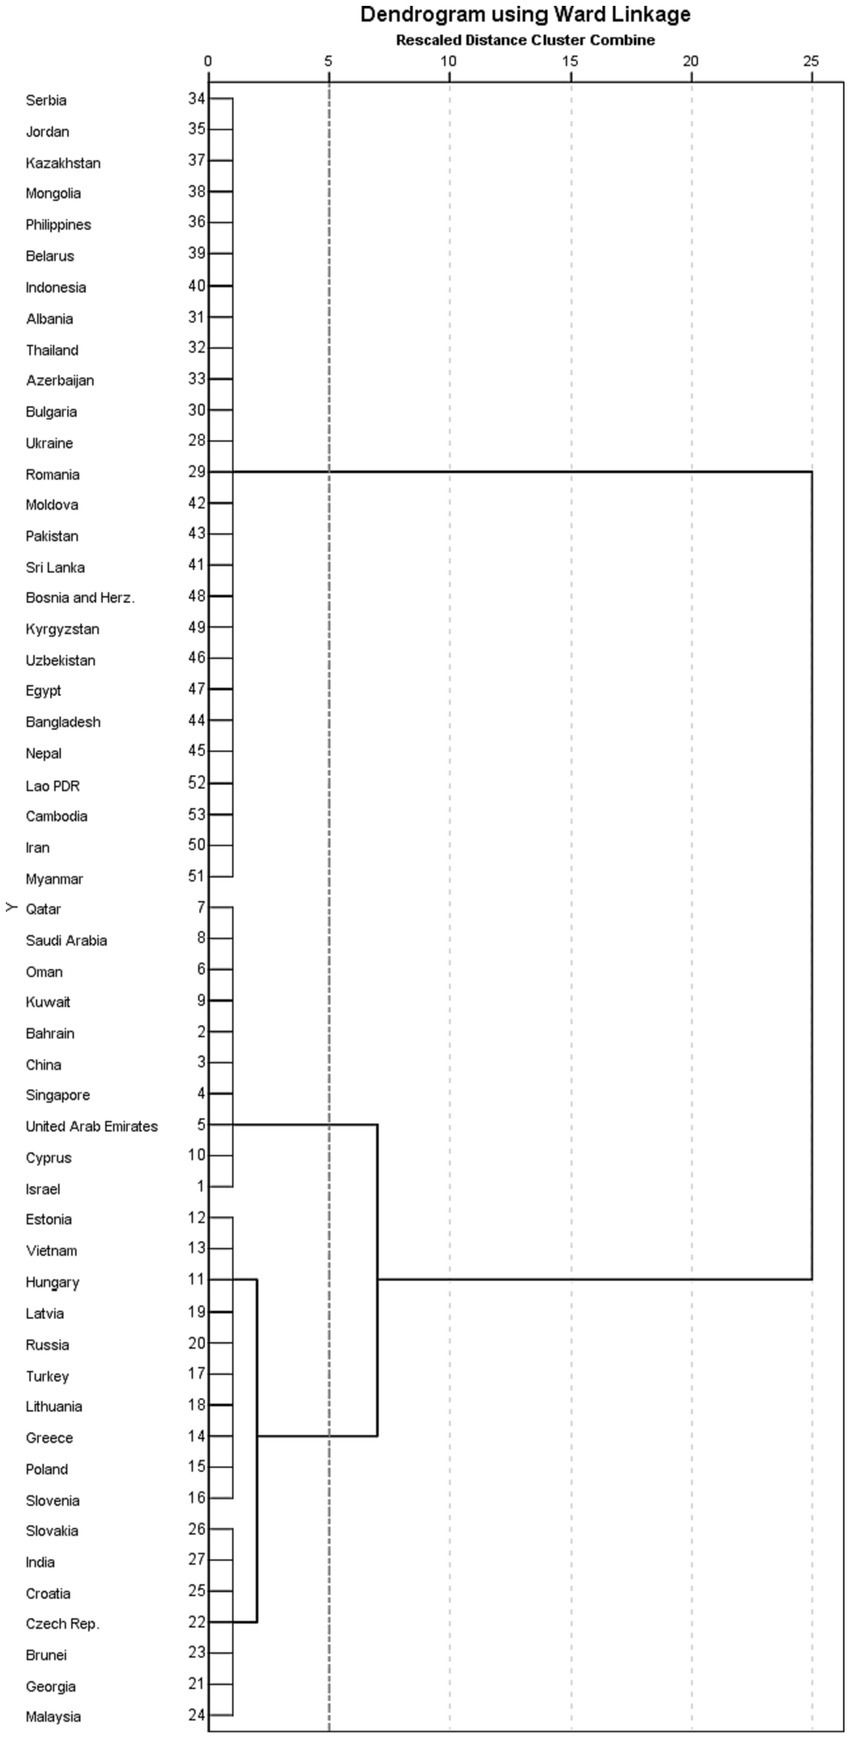
Figure 3. Cluster analysis spectrum chart. Numbers on the y-axis represent the resilience ranking shown in Table 3.
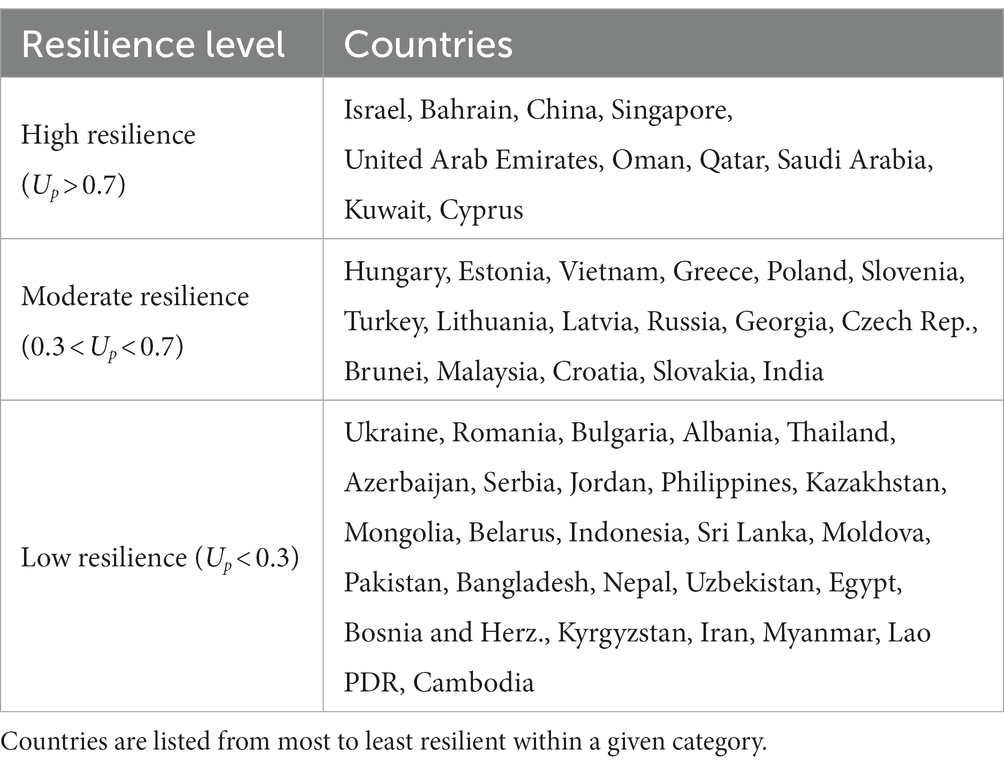
Table 4. Anti-pandemic resilience levels of the 53 countries along the B&R route.
We clarified the spatial pattern of the resilience of the countries along the B&R route in a map of the region (Figure 4). The former Soviet Bloc countries in eastern Europe were most likely to have low resilience, but many countries in southeast Asia also had low resilience.
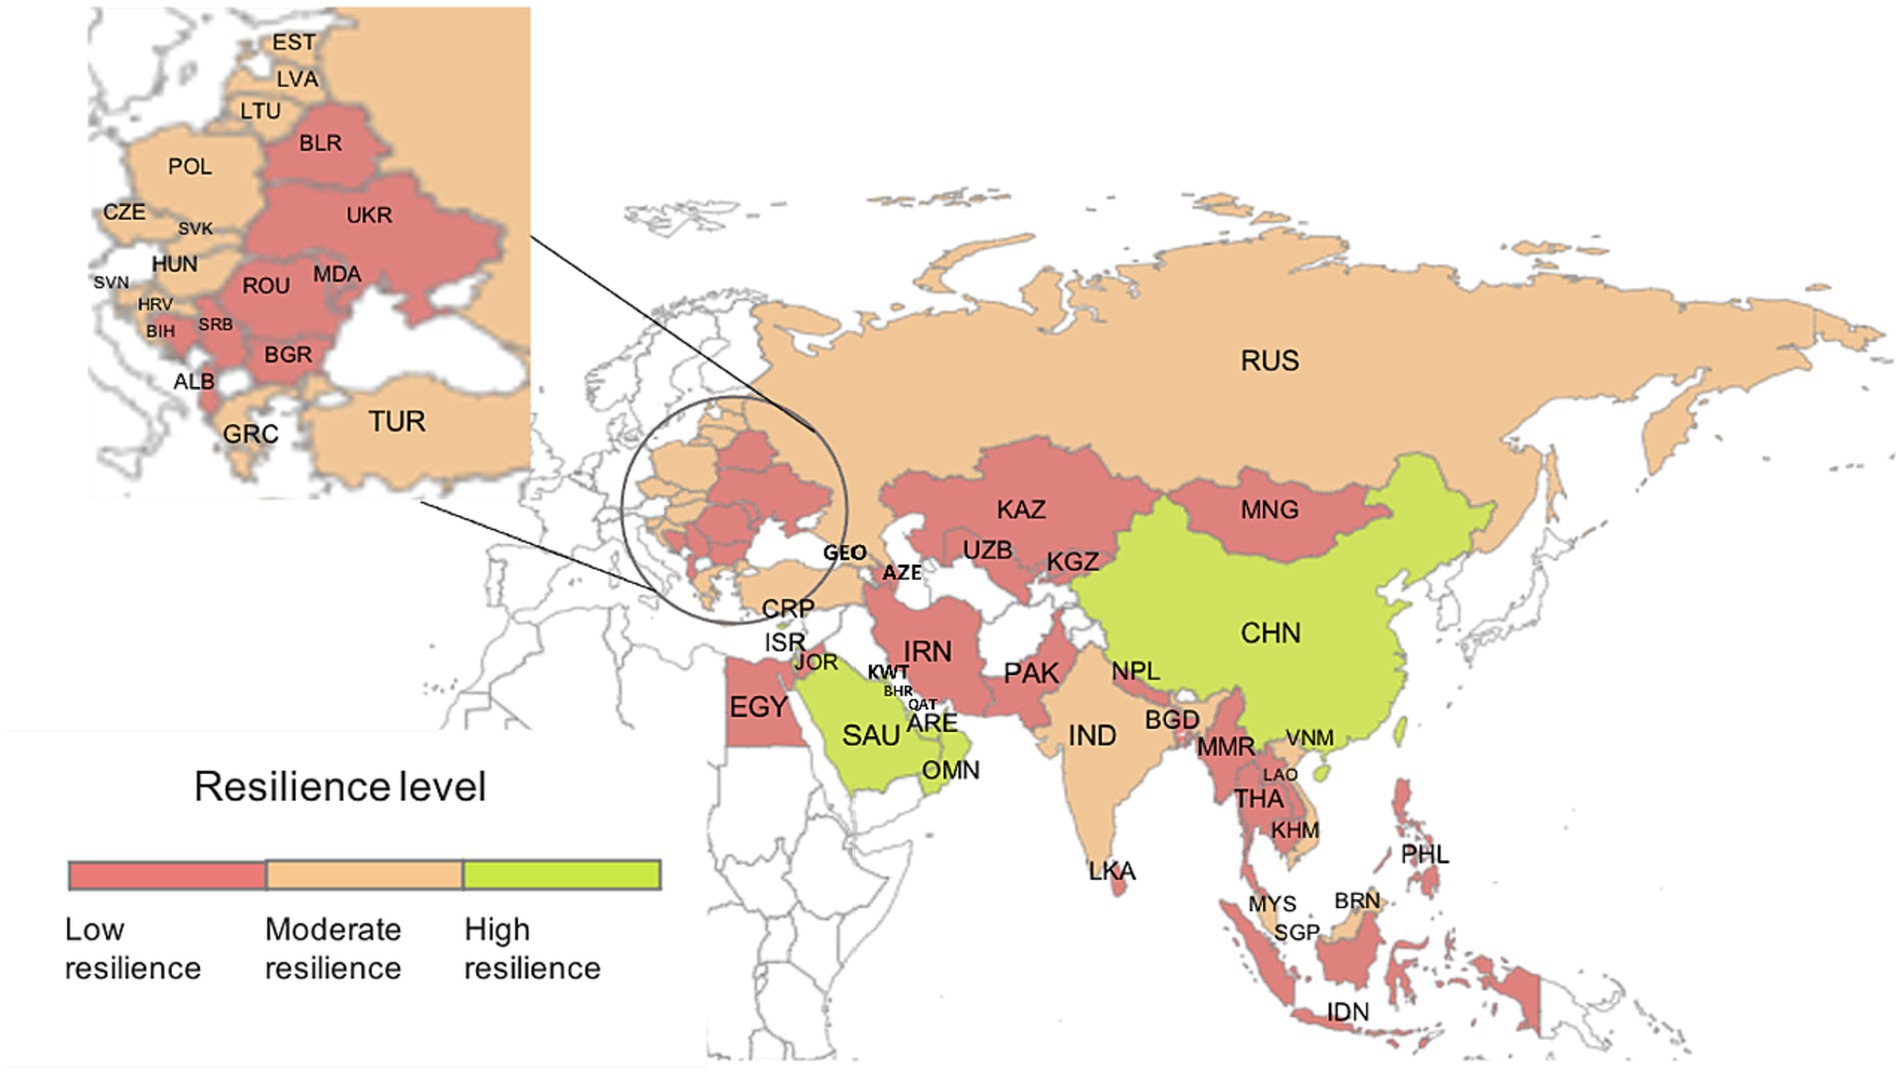
Figure 4. Spatial distribution of anti-pandemic resilience of the 53 Belt and Road countries. Resilience levels are based on the data in Table 4.
3.2. Consistency between the assessed and actual anti-pandemic resilience
In the previous section, we derived the anti-pandemic resilience of the B&R countries using the evaluation indicator system developed in this study. To test the validity of the system, we collected actual data from the B&R countries in 2020 to test the consistency between the actual and the assessed resilience.
We combined three indicators to reflect a country’s actual resilience: the cumulative number of confirmed COVID-19 diagnoses per million population, the number of deaths per million population, and the monitoring and detection scores for the year 2020 (50). We obtained this data from the World Coronavirus Outbreak Real-Time Data website (see text footnote 9) and the COVID-19 Regional Security Assessment database11 (Supplementary Table S3). We assigned equal weights to the three indicators and calculated the actual anti-pandemic resilience assessment value of the B&R countries using the VIKOR method. Supplementary Table S4 presents the actual resilience performance of each country.
We used a Bland–Altman plot to verify the consistency between the assessed resilience value Up and the actual resilience value . This plot quantifies the consistency between two datasets by examining the mean difference and constructing boundaries for the 95% confidence interval. If most data points fall within the confidence interval, then this indicates a good level of consistency between the two datasets (51). Figure 5 shows the results of this analysis. The mean value of the difference between the assessed and actual resilience was −0.03, and the 95% confidence interval for this difference was (−0.538, 0.477). Most data points fell within the 95% confidence interval, with only three outliers. Thus, our assessment method provides values that show good consistency with the actual results.
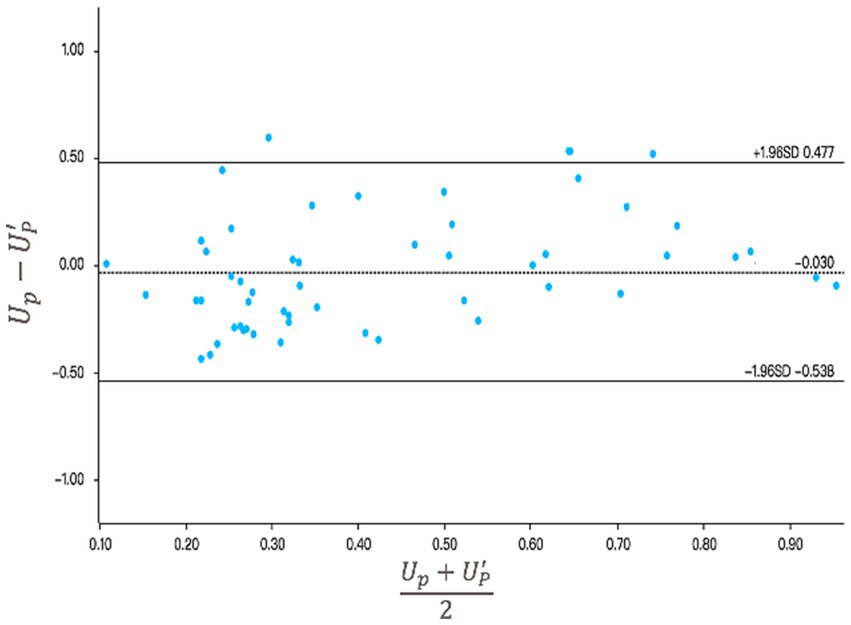
Figure 5. Analysis of the consistency between the assessed anti-pandemic resilience (Up) and the actual anti-epidemic resilience () using the Bland–Altman method. The center line represents the mean difference; the upper and lower lines represent the 95% confidence interval.
4. Discussion
4.1. Analysis of the anti-pandemic resilience in the B&R countries
In this section, a comparative analysis of national resilience is conducted based on the five first-level indicators, namely institutional, infrastructure, economic, social, and technological resilience. We quantified the resilience by calculating the scores of each country for each indicator after standardizing the indicator values using Equations 8, 9, then multiplied the standardized values by the indicator weights (wq) obtained from Equation 15 to obtain the resilience score for each indicator. Figure 6 shows the results, and Supplementary Table S5 provides the numerical contributions of each of the five indicators for each country.
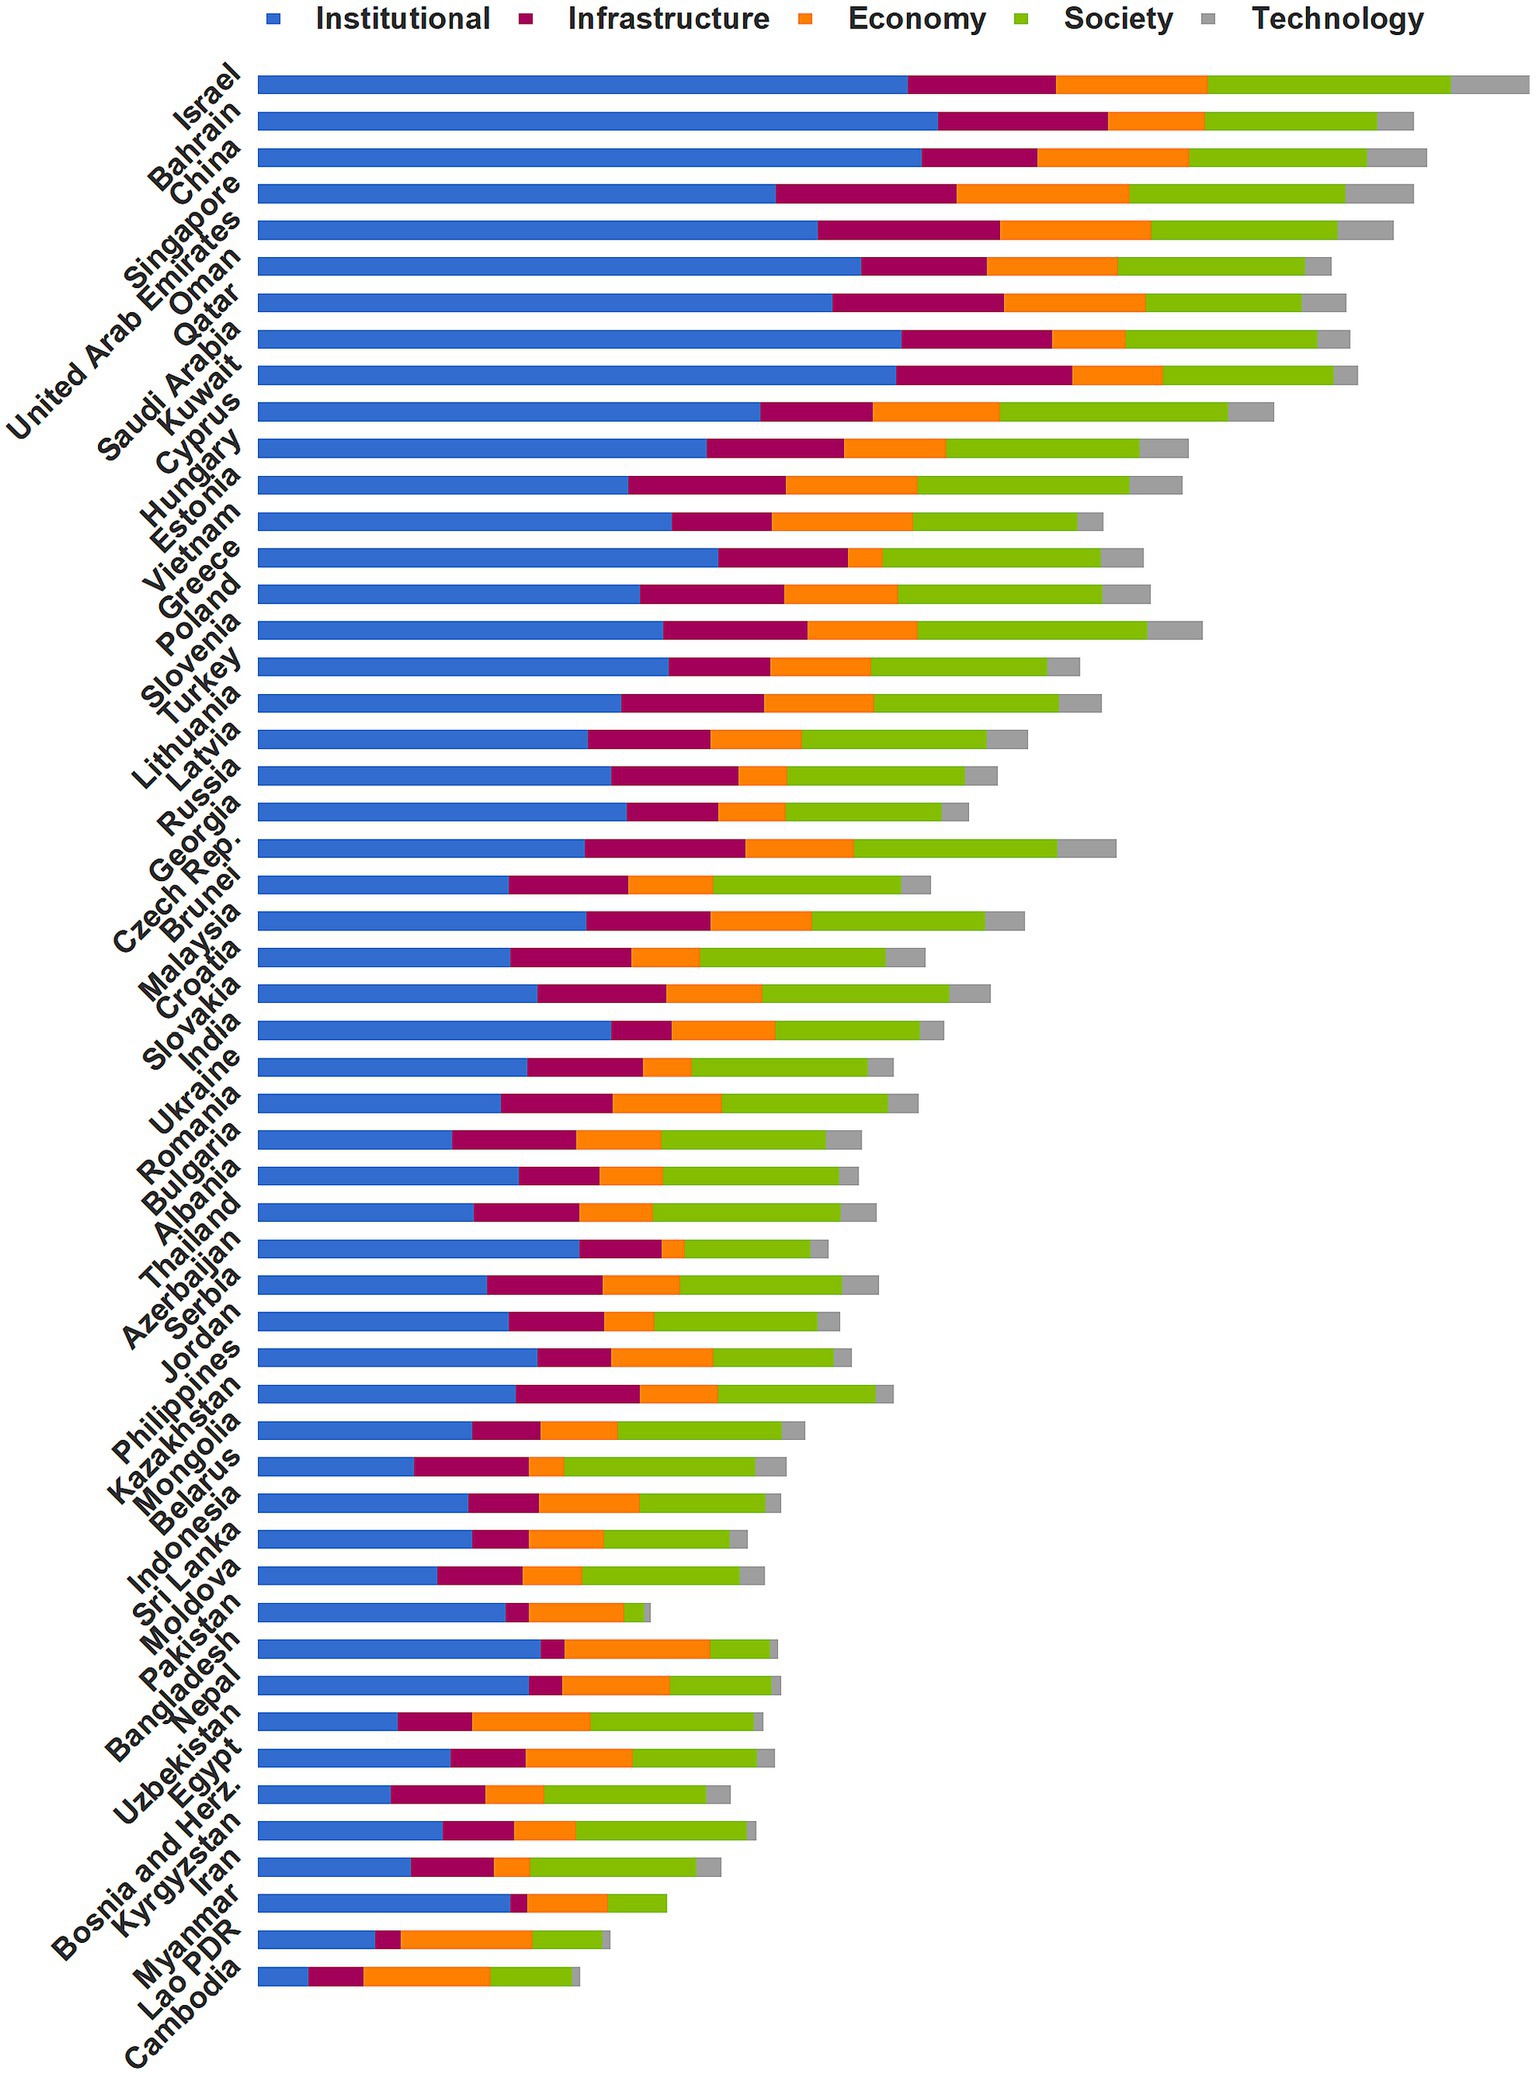
Figure 6. Resilience performance for the 53 Belt and Road countries based on the five first-level dimensions.
We classified the B&R countries as having high, moderate, or low resilience. Figure 7 shows the scores of these three levels for each of the five first-level resilience indicators. The countries with high resilience benefited from a combination of institutional, infrastructural, economic, social, and technological resilience to contain the pandemic. Most with moderate resilience did not differ greatly from those with high resilience in terms of social, technological, and infrastructural resilience, but had lower institutional and economic resilience. Countries with low resilience performed poorly in all five dimensions of resilience due to their weak health systems, poor economy, and inefficient response.
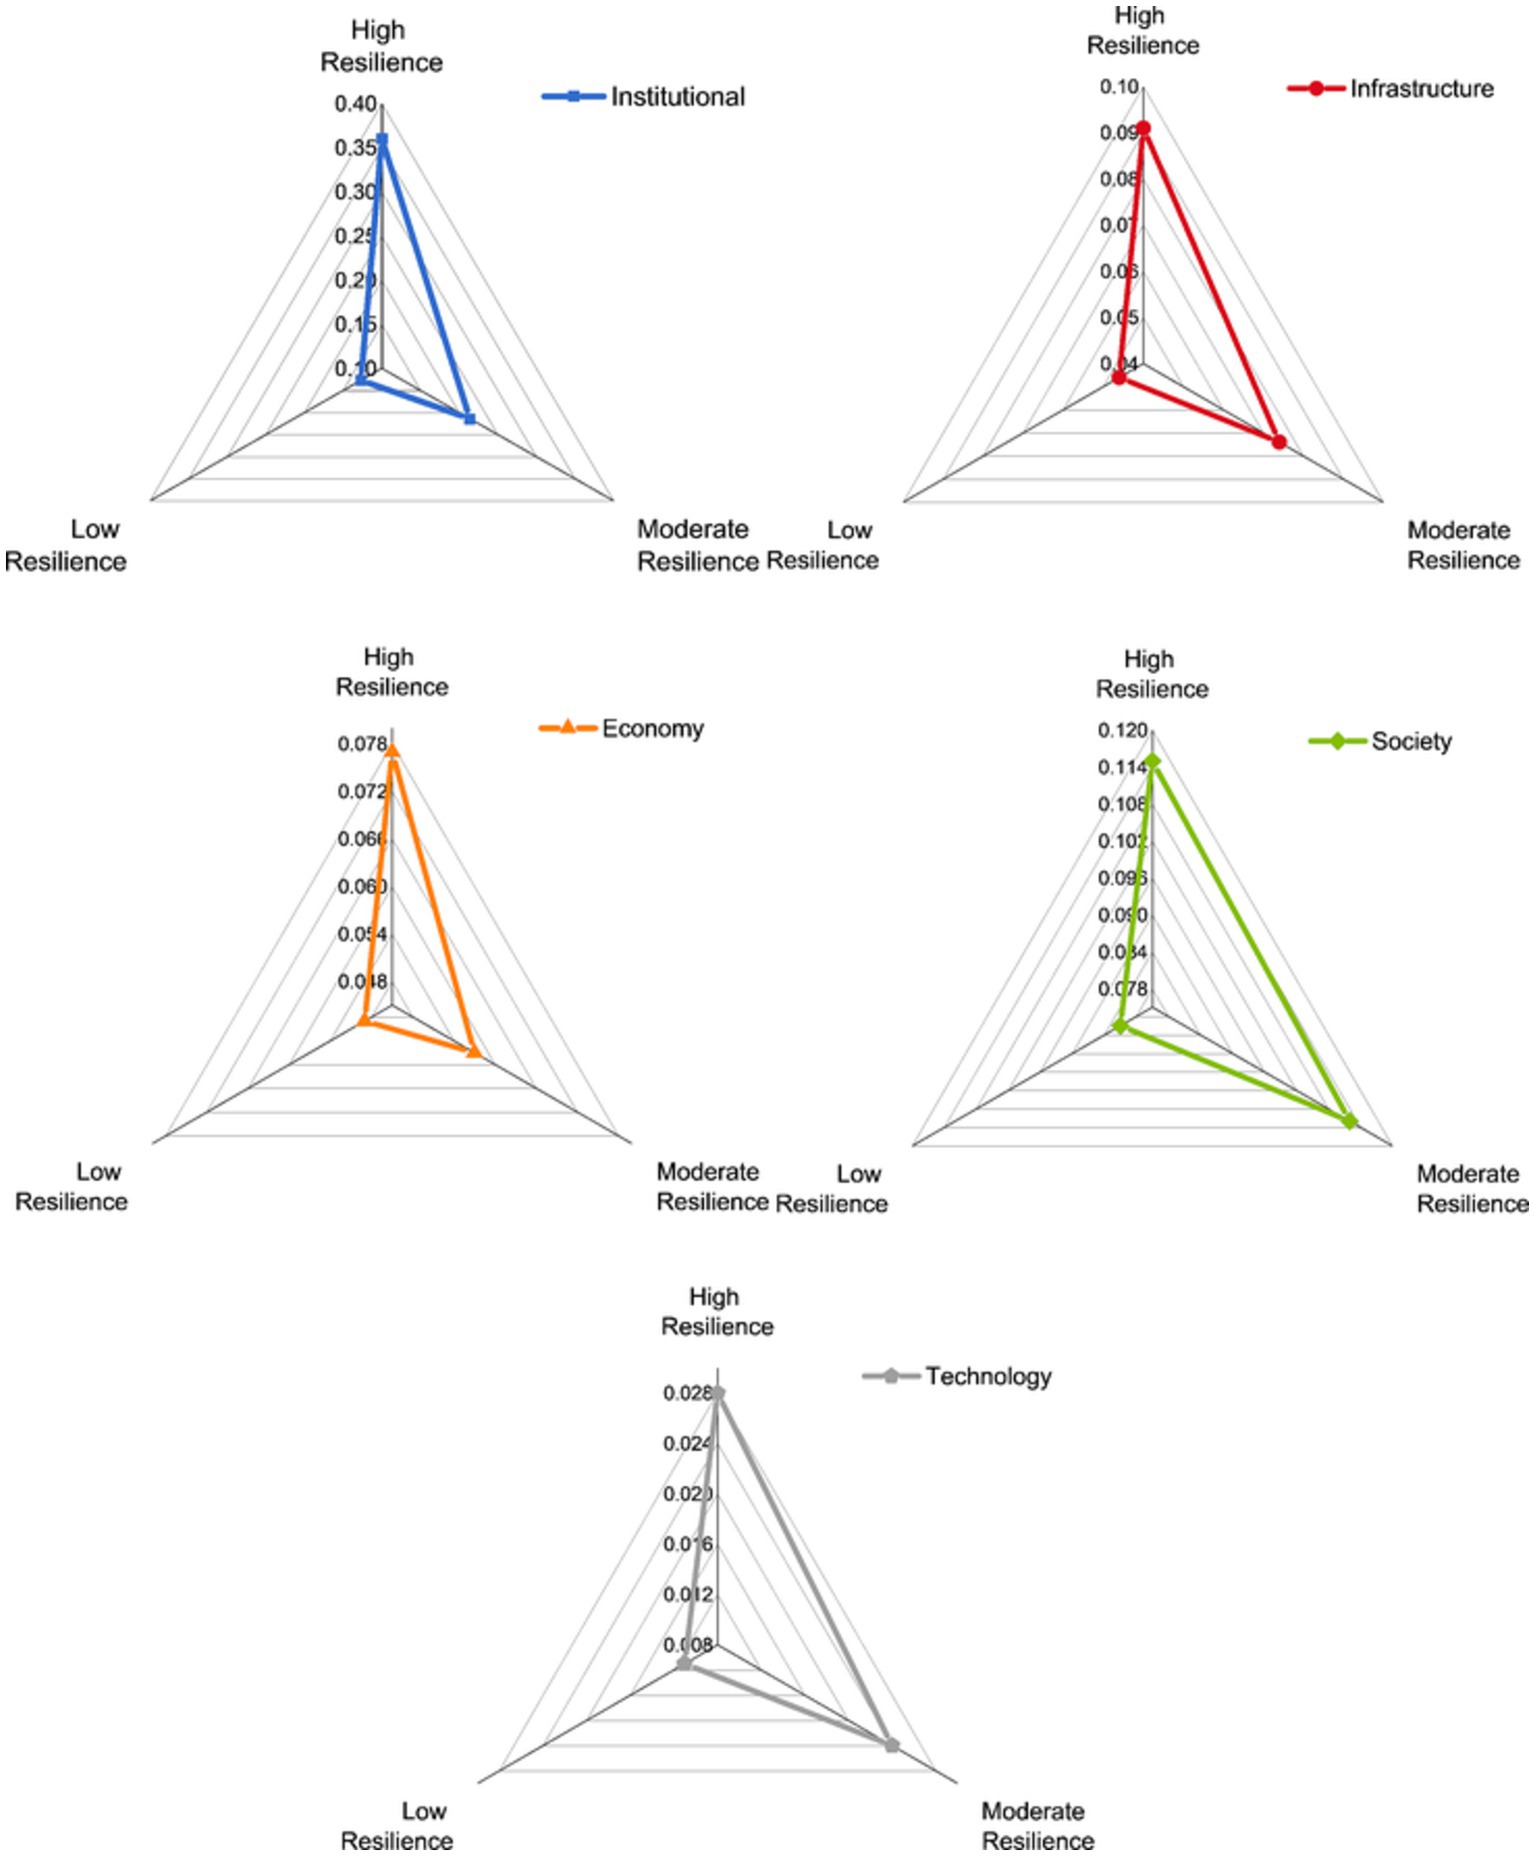
Figure 7. Scores of the five first-level indicators for the country groups with high, moderate, and low anti-pandemic resilience.
We gained several insights from considering the factors that fostered strong resilience in 2020. Countries with strong resilience had high institutional resilience scores (an average of 0.360), and those with moderate resilience were less rigorous or consistent in their efforts to control the pandemic, with an average institutional resilience score of 0.214. The low-resilience countries responded ineffectively, with an average institutional resilience score of 0.127. Bahrain (0.406) ranked first in pandemic prevention intensity by continuously upgrading the pandemic level and extending quarantines and lockdowns, whereas China (0.396) ranked first in pandemic prevention efficiency by limiting spread of the virus most promptly. Among countries with moderate resilience, Greece (0.275) responded early in the pandemic, mitigating the subsequent impact on the health system to some extent. Vietnam (0.247) had among the highest preparednesses for its accumulated experience with previous infectious respiratory diseases. Russia (0.211), on the other hand, responded to the pandemic with weak and incoherent prevention measures (52). Innovative public health surveillance systems provide stakeholders with actionable information to limit disease risk earlier (53). We found that the detection capacity in most of the low-resilience countries could not keep pace with spread of the virus, and the limited surveillance prevented the government from finding the source of an infection timely. This led to low scores for countries such as Cambodia (0.030) and Laos (0.070). The government of Belarus (0.093) even officially denied the existence of a pandemic initially and did not intervene to prevent mass gatherings that spread the infection (52). In contrast, the Philippines (0.167), Kazakhstan (0.154), and Pakistan (0.148) confronted the weakness of their health systems and took rigorous measures to avoid mass outbreaks before the virus arrived (54).
In terms of infrastructure resilience, the mean resilience scores for countries with high and moderate resilience were 0.091 and 0.074, respectively. In contrast, countries with low resilience lagged far behind, with a mean score of 0.046. The UAE (0.109) and Singapore (0.108) outperformed. Singapore implemented a medical stockpile that could last 6 months after learning from the 2002 SARS outbreak (55), while strong logistic, information, and energy systems in the UAE provided a solid foundation to control the virus’ spread. In contrast, Oman (0.075), China (0.069), and Cyprus (0.067) lagged behind for their relatively limited medical and energy resources available per capita. As a representative of countries with moderate resilience, the Czech Republic (0.096) and Estonia (0.094) invested strongly in their healthcare systems. Additionally, the Czech Republic had a well-developed logistics system that could support the distribution of emergency supplies, and Estonia’s information systems were widespread, thereby meeting the needs of working from home and remote socialization. In contrast, India’s infrastructure resilience score (0.036) was far below average. Relative to large population, its healthcare workers and beds were in short. What is worse, a severe lack of sanitation facilities exacerbated the situation and facilitated the spread of viruses. In addition, Georgia (0.055) performed poorly due to its underdeveloped logistics system and low energy resources. The low-resilience countries are unable to respond to the high volume and diversity of demand in normal times and were even less able to cope with a pandemic. For example, the public healthcare system in Myanmar (0.010) was completely unable to withstand the pandemic (56). In Pakistan (0.014) and Bangladesh (0.014), health care has not achieved universal coverage, and many poor families could not seek medical care because of the high cost, exacerbating spread of the virus (57).
In terms of economic resilience, countries with high, moderate, and low resilience obtained mean scores of 0.077, 0.057, and 0.049, respectively. Among countries with high resilience, Cyprus (0.076), Bahrain (0.058), Kuwait (0.054), and Saudi Arabia (0.044) scored below average. These countries heavily relied on energy exports, and experienced a sharp economic decline due to the pandemic. Saudi Arabia, in particular, endured the lowest economic growth rate in nearly 35 years (58). The economic resilience of Greece ranked at the bottom among moderate resilience. The sudden onset of the pandemic caused Greece (0.021) to suffer a severe economic impact on its keystone national industries such as tourism and agricultural exports, and the unemployment rate rose to 19.9%. Russia (0.029) and Georgia (0.04) suffered from economic depression due to labor shortages caused by decreasing immigration. Most of the countries with low resilience are economically weak, such as Cambodia (0.07), Indonesia (0.06), and Myanmar (0.01), which have densely populated slums where the poor faced survival crisis during the quarantine. Other countries had week economic structures, such as Ukraine (0.029), Belarus (0.021), and Azerbaijan (0.014), which relied heavily on energy exports, with Azerbaijan’s oil and gas sector accounting for 45% of the economy, leading to severe economic setbacks during the pandemic (59).
The social resilience performance of countries with high and moderate resilience was relatively similar, with mean scores of 0.115 and 0.112, versus only 0.081 for the low-resilience countries. Israel (0.145), Cyprus (0.136), and Singapore (0.129) had the strongest social resilience among the high-resilience countries, with governments investing heavily in the health and education sectors to ensure adequate healthcare and high-quality literacy of their citizens. On the other hand, Qatar (0.093) performed poorly, with insufficient national education and still some way from achieving its goal of educational sustainability (60). In terms of social resilience, Slovenia (0.137) ranked first among the moderate-resilience countries, because of its general outstanding physical health and scientific literacy. Whereas India (0.086) has a low literacy rate, and the citizens generally lack scientific knowledge of pandemic prevention, making it difficult for the government to prevent pandemics. Pakistan had the worst performance (0.012) among the low-resilience countries, with a limited budget for higher education and a low expected years of education for its citizens, who have limited awareness of infectious risks and low compliance with social isolation policies (61).
The average technological resilience score of the high-resilience countries was 0.028, versus 0.024 for the moderate-resilience countries and 0.11 for the low-resilience countries. Israel (0.046), Singapore (0.040), China (0.035), and the UAE (0.033) had the strongest technological resilience. They had high rankings in the global innovation index and invested heavily in research and development, therefore enabled them to take the lead in developing vaccines (62). The Czech Republic had relatively strong technological resilience (0.035) and produces world-class medical equipment for export, whereas Vietnam (0.015) and India (0.014) had limited technological means to deal with a pandemic and need to learn from the experience of other countries. Countries with low resilience had a weak ground for scientific research and a low production capacity, which were far behind the countries with moderate and high resilience. As a result, they had to ask for vaccine assistance from other countries.
4.2. Policy recommendations for enhancing anti-pandemic resilience in B&R countries
Our study findings provide valuable policy recommendations to assist B&R countries in effectively responding to future pandemics. A rapid and proactive response from governments is crucial, particularly in the early stages of an outbreak when vaccines are unavailable and transmission mechanisms are unclear. To achieve this, it is essential to ensure the readiness of outbreak emergency preparedness structures and the establishment of an adaptive health system. This includes implementing non-pharmaceutical interventions like lockdowns and quarantine measures during the initial stages of an outbreak, buying crucial time for governments to enhance infection control measures, allocate medical resources, provide economic assistance, mobilize society, and accelerate the development of drugs and vaccines. Overall, a comprehensive multi-sector approach is required to ensure a holistic response to future health crises.
Second, the economic constraints created by policies designed to rigorously reduce the spread of the pandemic, such as lockdowns, are a key cause of inadequate resilience. Fearing that quarantine would cut off national income sources and lead to a severe economic crisis, many countries chose to avoid lockdowns and instead implemented a herd immunity strategy, which exacerbated spread of the virus (63). Some countries with high resilience combined strict defensive measures with economic relief programs during the early stages of the pandemic, and once vaccines became available, they began to balance disease prevention with economic development, with the goal of minimizing the cost of the fight.
Third, the pandemic was a stress test for each country’s infrastructure system. In some countries, limited infrastructure and uneven distribution created constraints on medical resources and energy, exacerbating the pandemic. Future infrastructure development should fully account for such extreme conditions to maximize the ability of infrastructure to combat a future pandemic. Furthermore, governments should not only focus on improving the healthcare system but should also develop the supply system by improving logistics and energy systems.
The COVID-19 pandemic has significantly impacted the physical and mental health of people globally, with vulnerable communities facing greater risk due to unequal access to economic, health, and education resources. In the long run, access to healthcare and education should be improved to enhance social resilience. Countries must prioritize improved pandemic preparedness that addresses the needs of vulnerable groups, including building trust and enhancing solidarity in COVID-19 responses, and creating a more equitable and resilient society (64).
Finally, we were reminded that “viruses have no border.” Governments must consider pandemics as major crises that create a common challenge for all humans. The B&R countries should make full use of this initiative to form a multilateral cooperation mechanism and build a community of human support for everyone. In addition, the B&R countries should share their experience in pandemic management and provide anti-pandemic assistance to countries that face greater challenges. Furthermore, scientific cooperation should be strengthened to develop effective drugs and vaccines as fast and as safely as possible. All countries should work together to provide global public goods that protect the health of their citizens and maximize the welfare of all human beings.
5. Conclusion
Based on a resilience perspective, we developed an indicator system to evaluate the anti-pandemic resilience of the B&R countries based on five dimensions: institutional, infrastructural, economic, social, and technological resilience. We used a three-scale method and an improved entropy method to assign weights to these dimensions, and found that the greatest weight was given to institutional resilience, followed by infrastructure, economic, and social resilience, with the least weight given to technological resilience. This resulted from our assumption that vaccines were not yet universally available in 2020, so it was most critical for governments to intervene to stop the spread of the virus. Infrastructure, economic, and social resilience were also important dimensions to contain the pandemic because they helped to mitigate the situation. In contrast, technological resilience reflected the development and production of vaccines, which played a limited role in the fight against the pandemic in 2020 and therefore carried less weight. This form of resilience became much more important in 2021, when vaccines became widely available, but that was outside our study period.
We used the VIKOR method to evaluate resilience, and used hierarchical clustering to classify countries into groups with low, moderate, and high resilience. We found 10 countries with high resilience. Of these, Israel, Bahrain, and China had the highest resilience due to a combination of institutional, social, economic, and technological advantages; 17 other countries, including Hungary, Vietnam, and Greece, had moderate resilience, with weak institutional and economic resilience; these countries faced the dilemma of how to balance economic development with control of the virus. Finally, we found 26 countries, including Myanmar, Laos, and Cambodia, with low resilience. These countries had inadequate infrastructure and other dimensions of resilience before the pandemic, so COVID-19 revealed and exacerbated long-term problems.
This study provides a comprehensive analysis of the anti-epidemic performance of Belt and Road countries and offers policy recommendations for dealing with future public health emergencies. Specifically, our study suggests that countries should enhance their epidemic prevention and control capacity, promote joint contribution and shared benefits in building resilient infrastructure, optimize the diversified economic pattern, strengthen the foundation of social resilience, and collaborate in the development of drugs and vaccines to provide public goods for the global community.
Our study has some limitations. We did not attempt to characterize all potentially relevant factors that lead to resilience. For example, rapid, accurate, and trustworthy communication with the public is essential for an effective pandemic response. Future research should examine ways to improve trust in governments through improved communication. In addition, We assigned equal weights to all second-level indicators of a given first-level indicator because we had no objective way to determine their relative importance, and did not account for the possibility that some of these indicators may be more important than others in certain countries. Furthermore, further research is needed to examine the impact of Belt the and Road Initiative on the epidemic resilience of countries along its routes. This will deepen our understanding of how the initiative strengthens countries’ ability to tackle future challenges. Additionally, our study did not include war-torn countries due to data limitations on their anti-pandemic systems. However, recognizing the unique challenges faced by these countries, we recommend conducting separate research to develop strategies for managing pandemics in such contexts. Despite these limitations, our study provides a strong framework for identifying factors that weaken resilience and mitigating these problems through government policies. With suitable modifications, our approach should be applicable elsewhere in the world.
Data availability statement
The original contributions presented in the study are included in the article/Supplementary material, further inquiries can be directed to the corresponding author.
Author contributions
LJZ, MMM, LXZ, and PLY were involved in literature search, study design, data collection, model building, result analysis, and writing. XYH and YQ were involved in review and editing. All authors contributed to the article and approved the submitted version.
Funding
This work was supported by grants from the National Natural Science Foundation of China (Project No. 71874108), the National Social Science Foundation of China (Projects Nos. 21BGL217, 22BGL240, and 22CGL050), and the Shanghai Soft Science Foundation of China (22692107800).
Acknowledgments
The authors thank all the research team members and participants for their contribution to this research.
Conflict of interest
The authors declare that the research was conducted in the absence of any commercial or financial relationships that could be construed as a potential conflict of interest.
Publisher’s note
All claims expressed in this article are solely those of the authors and do not necessarily represent those of their affiliated organizations, or those of the publisher, the editors and the reviewers. Any product that may be evaluated in this article, or claim that may be made by its manufacturer, is not guaranteed or endorsed by the publisher.
Supplementary material
The Supplementary material for this article can be found online at: https://www.frontiersin.org/articles/10.3389/fpubh.2023.1152029/full#supplementary-material
Footnotes
1. ^https://www.bsg.ox.ac.uk/research/research-projects/covid-19-government-response-tracker
2. ^https://www.dkv.global/covid-safety-assessment-200-regions
3. ^http://data.un.org/Default.aspx
4. ^https://data.worldbank.org/
5. ^https://www.who.int/data/gho
6. ^https://unctadstat.unctad.org/EN/
7. ^https://ourworldindata.org/human-development-index
8. ^https://www.wipo.int/ipstats/en/
9. ^https://www.worldometers.info/coronavirus/
References
1. Jia, P, and Wang, Y. Global health efforts and opportunities related to the belt and road initiative. Lancet Glob Health. (2019) 7:e703–5. doi: 10.1016/S2214-109X(19)30062-2
2. Wu, A, Hong, K, and Chung, K. The impact of COVID-19 on belt and road initiative infrastructure and construction projects. Int Arbitrat Rep. (2020) 14:27–8.
3. Walker, B, Holling, CS, Carpenter, SR, and Kinzig, AP. Resilience, adaptability and transformability in social–ecological systems. Ecol Soc. (2004) 9:5. doi: 10.5751/ES-00650-090205
4. Wardekker, JA, de Jong, A, Knoop, JM, and van der Sluijs, JP. Operationalising a resilience approach to adapting an urban delta to uncertain climate changes. Technol Forecast Soc Chang. (2010) 77:987–98. doi: 10.1016/j.techfore.2009.11.005
5. Resilience Alliance. Assessing and managing resilience in social–ecological systems: a practitioner’s workbook. (2010) Available at: https://www.resalliance.org/resilience-assessment (Accessed March 13, 2022).
6. Cutter, SL, Barnes, L, Berry, M, Burton, C, Evans, E, Tate, E, et al. A place-based model for understanding community resilience to natural disasters. Glob Environ Chang. (2008) 18:598–606. doi: 10.1016/j.gloenvcha.2008.07.013
7. Béné, C, Mehta, L, McGranahan, G, Cannon, T, Gupte, J, and Tanner, T. Resilience as a policy narrative: potentials and limits in the context of urban planning. Clim Dev. (2018) 10:116–33. doi: 10.1080/17565529.2017.1301868
8. Jabareen, Y. Planning the resilient city: concepts and strategies for coping with climate change and environmental risk. Cities. (2013) 31:220–9. doi: 10.1016/j.cities.2012.05.004
9. Pfefferbaum, RL, Pfefferbaum, B, Nitiéma, P, Houston, JB, and van Horn, RL. Assessing community resilience: an application of the expanded cart survey instrument with affiliated volunteer responders. Am Behav Sci. (2015) 59:181–99. doi: 10.1177/0002764214550295
10. Sharifi, A. A critical review of selected tools for assessing community resilience. Ecol Indic. (2016) 69:629–47. doi: 10.1016/j.ecolind.2016.05.023
11. Bozdağ, F, and Ergün, N. Psychological resilience of healthcare professionals during covid-19 pandemic. Psychol Rep. (2020) 124:2567–86. doi: 10.1177/0033294120965477
12. Killgore, WD, Taylor, EC, Cloonan, SA, and Dailey, NS. Psychological resilience during the covid-19 lockdown. Psychiatry Res. (2020) 291:113216–6. doi: 10.1016/j.psychres.2020.113216
13. Bryce, C, Ring, P, Ashby, S, and Wardman, JK. Resilience in the face of uncertainty: early lessons from the COVID-19 pandemic. Journal of Risk Research. (2020) 23:880–7. doi: 10.1080/13669877.2020.1756379
14. Cheema-Fox, A, LaPerla, BR, Wang, HS, and Serafeim, G. Corporate resilience and response to COVID-19. J Appl Corp Financ. (2021) 33:24–40. doi: 10.1111/jacf.12457
15. Chen, J, Guo, X, Pan, H, and Zhong, S. What determines city’s resilience against epidemic outbreak: evidence from China’s covid-19 experience. Sustain Cities Soc. (2021) 70:102892. doi: 10.1016/j.scs.2021.102892
16. Țiclău, T, Hințea, C, and Andrianu, B. Adaptive and turbulent governance. Ways of governing that foster resilience. The case of the covid-19 pandemic. Transylvanian Rev Admin Sci. (2020) 16:167–82. doi: 10.24193/tras.SI2020.10
17. Belhadi, A, Kamble, S, Jabbour, CJC, Gunasekaran, A, Ndubisi, NO, and Venkatesh, M. Manufacturing and service supply chain resilience to the COVID-19 outbreak: lessons learned from the automobile and airline industries. Technol Forecast Soc Chang. (2021) 163:120447. doi: 10.1016/j.techfore.2020.120447
18. Gwenzi, W. Leaving no stone unturned in light of the covid-19 faecal-oral hypothesis? A water, sanitation and hygiene (wash) perspective targeting low-income countries. Sci Total Environ. (2021) 753:141751. doi: 10.1016/j.scitotenv.2020.141751
19. Heffron, RJ, Körner, MF, Schöpf, M, Wagner, J, and Weibelzahl, M. The role of flexibility in the light of the covid-19 pandemic and beyond: contributing to a sustainable and resilient energy future in europe. Renew Sust Energ Rev. (2021) 140:110743. doi: 10.1016/j.rser.2021.110743
20. Diop, S, Asongu, SA, and Nnanna, J. COVID-19 economic vulnerability and resilience indexes: global evidence. Int Soc Sci J. (2021) 71:37–50. doi: 10.1111/issj.12276
21. Uddin, M, Chowdhury, A, Anderson, K, and Chaudhuri, K. The effect of covid–19 pandemic on global stock market volatility: can economic strength help to manage the uncertainty? J Bus Res. (2021) 128:31–44. doi: 10.1016/j.jbusres.2021.01.061
22. Kaim, A, Jaffe, E, Siman-Tov, M, Khairish, E, and Adini, B. Impact of a brief educational intervention on knowledge, perceived knowledge, perceived safety, and resilience of the public during COVID-19 crisis. Int J Environ Res Public Health. (2020) 17:5971. doi: 10.3390/ijerph17165971
23. Patel, P, Nielsen, FBH, Badiani, AA, Assi, S, Unadkat, VA, Patel, B, et al. Poverty, inequality and COVID-19: the forgotten vulnerable. Public Health. (2020) 183:110–1. doi: 10.1016/j.puhe.2020.05.006
24. Bhaskar, S, Bradley, S, Chattu, VK, Adisesh, A, Nurtazina, A, Kyrykbayeva, S, et al. Telemedicine as the new outpatient clinic gone digital: position paper from the pandemic health system resilience program (reprogram) international consortium (Part 2). Front Public Health. (2020) 8:410. doi: 10.3389/fpubh.2020.00410
25. Zhang, XA, and Sung, YH. Communities going virtual: examining the roles of online and offline social capital in pandemic perceived community resilience-building. Mass Commun Soc. (2023) 26:539–65. doi: 10.1080/15205436.2021.1974046
26. Fenxia, Z. The community resilience measurement throughout the COVID-19 pandemic and beyond-an empirical study based on data from Shanghai, Wuhan and Chengdu. Int J Disaster Risk Reduct. (2022) 67:102664. doi: 10.1016/j.ijdrr.2021.102664
27. Haldane, V, de Foo, C, Abdalla, SM, Jung, AS, Tan, M, Wu, S, et al. Health systems resilience in managing the COVID-19 pandemic: lessons from 28 countries. Nat Med. (2021) 27:964–80. doi: 10.1038/s41591-021-01381-y
28. Chua, AQ, Tan, MMJ, Verma, M, Han, EKL, Hsu, LY, Cook, AR, et al. Health system resilience in managing the COVID-19 pandemic: lessons from Singapore. BMJ Glob Health. (2020) 5:e3317. doi: 10.1136/bmjgh-2020-003317
29. Kimhi, S, and Eshel, Y. Measuring national resilience: a new short version of the scale (NR-13). J Community Psychol. (2019) 47:517–28. doi: 10.1002/jcop.22135
30. Dev, S, Aherwar, A, and Patnaik, A. Material selection for automotive piston component using entropy-vikor method. Silicon. (2020) 12:155–69. doi: 10.1007/s12633-019-00110-y
31. Shekhovtsov, A, Abun, W, and Sa, L. A comparative case study of the Vikor and Topsis rankings similarity. Proc Comput Sci. (2020) 176:3730–40. doi: 10.1016/j.procs.2020.09.014
32. Abdali, Y, Pourahmad, A, Amini, M, and Khandan, I. Investigating and comparing the resilience of pre-created and planned communities to reduce the impacts of natural disasters (earthquake) (case study: nourabad county and maskan-e mehr of nourabad city). Sci Res Quart Geogr Data. (2019) 28:147–61. doi: 10.22131/sepehr.2019.36620
33. Sharifi, A, Roosta, M, and Javadpoor, M. Urban form resilience: a comparative analysis of traditional, semi-planned, and planned neighborhoods in Shiraze, Iran. Urban Sci. (2021) 5:18. doi: 10.3390/urbansci5010018
34. Li, KX, Jin, M, Qi, G, Shi, W, and Ng, AK. Logistics as a driving force for development under the belt and road initiative–the Chinese model for developing countries. Transp Rev. (2018) 38:457–78. doi: 10.1080/01441647.2017.1365276
35. Ferguson, NM, Laydon, D, Nedjati-Gilani, G, Imai, N, Ainslie, K, Baguelin, M, et al. Impact of non-pharmaceutical interventions (NPIs) to reduce COVID-19 mortality and healthcare demand. London: Imperial College London (2020).
36. Legido-Quigley, H, Asgari, N, Teo, YY, Leung, GM, Oshitani, H, Fukuda, K, et al. Are high-performing health systems resilient against the COVID-19 epidemic? Lancet. (2020) 395:848–50. doi: 10.1016/S0140-6736(20)30551-1
37. Ivanov, D. Viable supply chain model: integrating agility, resilience and sustainability perspectives—lessons from and thinking beyond the COVID-19 pandemic. Ann Oper Res. (2020). doi: 10.1007/s10479-021-04181-2, [Online ahead of print]
38. Birol, F., The coronavirus crisis reminds us that electricity is more indispensable than ever. (2020). Available at: https://www.iea.org/commentaries/the-coronavirus-crisis-reminds-us-that-electricity-is-more-indispensable-than-ever (Accessed March 25, 2022).
39. Ting, DSW, Carin, L, Dzau, V, and Wong, TY. Digital technology and COVID-19. Nat Med. (2020) 26:459–61. doi: 10.1038/s41591-020-0824-5
40. Fauci, AS, Lane, HC, and Redfield, RR. COVID-19—navigating the uncharted. N Engl J Med. (2020) 382:1268–9. doi: 10.1056/NEJMe2002387
41. Tediosi, F, Lönnroth, K, Pablos-Méndez, A, and Raviglione, M. Build back stronger universal health coverage systems after the COVID-19 pandemic: the need for better governance and linkage with universal social protection. BMJ Glob Health. (2020) 5:e4020. doi: 10.1136/bmjgh-2020-004020
42. Chakraborty, I, and Maity, P. COVID-19 outbreak: migration, effects on society, global environment and prevention. Sci Total Environ. (2020) 728:138882. doi: 10.1016/j.scitotenv.2020.138882
43. Zhao, L, Zhao, Y, Hu, Q, Li, H, and Stoeter, J. Evaluation of consolidation center cargo capacity and loctions for China railway express. Trans Res Part E Logist Trans Rev. (2018) 117:58–81. doi: 10.1016/j.tre.2017.09.007
44. Güner, R, Hasanoğlu, I, and Aktaş, F. COVID-19: prevention and control measures in community. Turkish J Med Sci. (2020) 50:571–7. doi: 10.3906/sag-2004-146
45. Lai, S, Ruktanonchai, NW, Zhou, L, Prosper, O, Luo, W, Floyd, JR, et al. Effect of non-pharmaceutical interventions to contain COVID-19 in China. Nature. (2020) 585:410–3. doi: 10.1038/s41586-020-2293-x
46. Le, TT, Andreadakis, Z, Kumar, A, Román, RG, Tollefsen, S, Saville, M, et al. The COVID-19 vaccine development landscape. Nat Rev Drug Discov. (2020) 19:305–6. doi: 10.1038/d41573-020-00073-5
47. Liu, Z, Jiang, C, Wang, J, and Yu, H. The node importance in actual complex networks based on a multi-attribute ranking method. Knowl Based Syst. (2015) 84:56–66. doi: 10.1016/j.knosys.2015.03.026
48. Opricovic, S, and Tzeng, G. Compromise solution by MCDM methods: a comparative analysis of VIKOR and TOPSIS. Eur J Oper Res. (2004) 156:445–55. doi: 10.1016/S0377-2217(03)00020-1
49. Chen, G, Jaradat, SA, Banerjee, N, Tanaka, TS, Ko, MSH, Zhang, MQ, et al. Evaluation and comparison of clustering algorithms in analyzing ES cell gene expression data. Stat Sin. (2002) 12:241–62. doi: 10.4236/health.2009.11004
50. Delgado, CA, Shimabuku, RL, and Chiroque-Solano, PM. COVID-19 waves: importance of accumulative mortality per million inhabitants. Tohoku J Exp Med. (2020) 251:47–9. doi: 10.1620/tjem.251.47
51. Giavarina, D. Understanding bland altman analysis. Biochem Med. (2015) 25:141–51. doi: 10.11613/BM.2015.015
52. Åslund, A. Responses to the COVID-19 crisis in Russia, Ukraine, and Belarus. Eurasian Geogr Econ. (2020) 61:532–45. doi: 10.1080/15387216.2020.1778499
53. Jia, P, Liu, S, and Yang, S. Innovations in public health surveillance for emerging infections. Annu Rev Public Health. (2022) 44:55–74. doi: 10.1146/annurev-publhealth-051920-093141
54. Waris, A, Atta, UK, Ali, M, Asmat, A, and Baset, A. COVID-19 outbreak: current scenario of Pakistan. New Microbes New Infections. (2020) 35:100681. doi: 10.1016/j.nmni.2020.100681
55. Lee, VJ, Chiew, CJ, and Khong, WX. Interrupting transmission of COVID-19: lessons from containment efforts in Singapore. J Travel Med. (2020) 27:a39. doi: 10.1093/jtm/taaa039
56. Djalante, R., Nurhidayah, L., Lassa, J., Van Minh, Hoang, Mahendradhata, Yodi, Phuong, Nguyen Thi Ngoc, et al. The ASEAN’s responses to COVID-19: a policy sciences analysis. (2020). Available at: https://ssrn.com/abstract=3595012 (Accessed March 13, 2022).
57. Cousins, S. Bangladesh’s COVID-19 testing criticised. Lancet. (2020) 396:591. doi: 10.1016/S0140-6736(20)31819-5
58. Australian Energy Market Operator. Quarterly energy dynamics Q1 2020, market insights, and WA market operations. (2022). Available at: https://aemo.com.au/-/media/files/major-publications/qed/2020/qed-q1-2020.pdf?la=en&hash=490D1E0CA7A21DB537741C5C18F2FF0A (Accessed March 25, 2022).
59. Doghonadze, N, Aliyev, A, Halawachy, H, Knodel, L, and Adedoyin, AS. The degree of readiness to total distance learning in the face of covid-19-teachers’ view (case of Azerbaijan, Georgia, Iraq, Nigeria, UK and Ukraine). J Educ Black Sea Region. (2020) 5:2–41. doi: 10.31578/jebs.v5i2.197
60. Zguir, MF, Dubis, S, and Koc, M. Embedding education for sustainable development (ESD) and SDGs values in curriculum: a comparative review on Qatar, Singapore and New Zealand. J Clean Prod. (2021) 319:128534. doi: 10.1016/j.jclepro.2021.128534
61. Mya, KS, Aye, SM, Hlaing, WA, Hlaing, SS, Aung, T, Lwin, SMM, et al. Awareness, perceived risk and protective behaviours of Myanmar adults on COVID-19. Int J Commun Med Public Health. (2020) 7:1627–36. doi: 10.18203/2394-6040.ijcmph20201530
62. Alsuwaidi, AR, Al Hosani, FI, ElGhazali, G, and Al-Ramadi, BK. The COVID-19 response in the United Arab Emirates: challenges and opportunities. Nat Immunol. (2021) 22:1066–7. doi: 10.1038/s41590-021-01000-5
63. Santos, J. Reflections on the impact of “flatten the curve” on interdependent workforce sectors. Environ Syst Decis. (2020) 40:185–8. doi: 10.1007/s10669-020-09774-z
Keywords: Belt and Road countries, COVID-19, pandemic response, anti-epidemic, combined methods, empowerment method, VIKOR method
Citation: Zhao L, Min M, Huang X, Qian Y, Zhou L and Yang P (2023) Anti-pandemic resilience assessment for countries along the Belt and Road route. Front. Public Health. 11:1152029. doi: 10.3389/fpubh.2023.1152029
Edited by:
Peiling Yap, International Digital Health and AI Research Collaborative (I-DAIR), SwitzerlandReviewed by:
Edmond Puca, Service of Infection Diseases University Hospital Center, AlbaniaKei Shing Ng, The University of Hong Kong, Hong Kong SAR, China
Prosper Tumusiime, Camillus Medical Centre, Uganda
Copyright © 2023 Zhao, Min, Huang, Qian, Zhou and Yang. This is an open-access article distributed under the terms of the Creative Commons Attribution License (CC BY). The use, distribution or reproduction in other forums is permitted, provided the original author(s) and the copyright owner(s) are credited and that the original publication in this journal is cited, in accordance with accepted academic practice. No use, distribution or reproduction is permitted which does not comply with these terms.
*Correspondence: Mengmeng Min, MjAyNzIxMTc0QHN0LnVzc3QuZWR1LmNu