 Deo Mujwara
 George B. Busby
 Giordano Bottà
- Allelica, Inc., New York, NY, United States
Background: Polygenic risk score for coronary artery disease (CAD-PRS) improves precision in assessing the risk of cardiovascular diseases and is cost-effective in preventing cardiovascular diseases in a health system and may be cost-effective in other settings and prevention programs such as workplace cardiovascular prevention programs. Workplaces provide a conducitve environment for cardiovascular prevention interventions, but the cost-effectiveness of CAD-PRS in a workplace setting remains unknown. This study examined the cost-effectiveness of integrating CAD-PRS in a workplace cardiovascular disease prevention program compared to the standard cardiovascular workplace program without CAD-PRS and no-workplace prevention program.
Methods: We developed a cohort simulation model to project health benefits (quality-adjusted life years gained) and costs over a period of 5 years in a cohort of employees with a mean age of 50 years. The model health states reflected the risk of disease (coronary artery disease and ischemic stroke) and statin prevention therapy side effects (diabetes, hemorrhagic stroke, and myopathy). We considered medical and lost productivity costs. Data were obtained from the literature, and the analysis was performed from a self-insured employer perspective with future costs and quality-adjusted life years discounted at 3% annually. Uncertainty in model parameter inputs was assessed using deterministic and probabilistic sensitivity analyses. Three programs were compared: (1) a workplace cardiovascular program that integrated CAD-PRS with the pooled cohort equation—a standard of care for assessing the risk of cardiovascular diseases (CardioriskSCORE); (2) a workplace cardiovascular prevention program without CAD-PRS (Standard-WHP); and (3) no-workplace health program (No-WHP). The main outcomes were total costs (US $2019), incremental costs, incremental quality-adjusted life years, and incremental cost-effectiveness ratio.
Results: CardioriskSCORE lowered employer costs ($53 and $575) and improved employee quality-adjusted life years (0.001 and 0.005) per employee screened compared to Standard-WHP and No-WHP, respectively. The effectiveness of statin prevention therapy, employees' baseline cardiovascular risk, the proportion of employees that enrolled in the program, and statin adherence had the largest effect size on the incremental net monetary benefit. However, despite the variation in parameter input values, base case results remained robust.
Conclusion: Polygenic testing in a workplace cardiovascular prevention program improves employees' quality of life and simultaneously lowers health costs and productivity monetary loss for employers.
Introduction
Workplaces provide a convenient environment for cardiovascular disease prevention interventions. However, standard workplace healthcare programs (WHPs) only screen for traditional risk factors (e.g., age, blood pressure, cholesterol) for cardiovascular diseases (1) without accounting for genetic risk. There is strong evidence that a substantial proportion of coronary artery disease (CAD) is attributable to genetic factors (2) and that genetics modify the risk conferred by traditional risk factors (3). As such, employees at high risk of CAD due to genetics remain invisible to current risk assessments, thereby missing opportunities for preventative disease interventions to be initiated that can improve employees' health and wellbeing and lower future healthcare costs.
A polygenic risk score (PRS) is a number that indicates an individual's risk of disease, estimated using large clinical biobanks by integrating multiple risk variant alleles for an individual weighted by their effect on disease risk. Adding PRS for coronary artery disease (CAD-PRS) in current risk assessment models improves precision in determining the risk of CAD, identifying an additional 4% of the primary prevention population at risk of CAD who would otherwise remain unidentified using only traditional risk factors (2). CAD-PRS is also an independent predictor of CAD (2, 4) and has been recommended (2) and shown to be cost-effective and cost-saving in a health system when integrated into the current risk assessment models as an additional risk-enhancing factor (5).
There is a growing interest in offering genetic testing to employees, but its cost-effectiveness has not been fully examined (6, 7). Furthermore, WHPs that include genetic testing offer only monogenic testing (6), which identifies fewer individuals at high risk compared to polygenic testing (8). The objective of this study was to examine the cost-effectiveness of CAD-PRS in a workplace cardiovascular disease prevention program compared to a standard workplace cardiovascular prevention program and a workplace without any prevention program.
Materials and methods
Study population
The study population consisted of a cohort of individuals with a mean age of 50 years, representing the average age of employees between 40 and 75 years in the United States (85), which is also the recommended age for cardiovascular disease prevention interventions (9). The cohort excluded individuals with pre-existing conditions, such as diabetes (10) and CAD/stroke (11), as those are not classified among the primary prevention population for cardiovascular diseases (9).
Strategies
We compared three strategies: (i) standard workplace program using a pooled cohort equation (PCE) for assessing the 10-year risk of CAD based on traditional risk factors (Standard-WHP). The risk is stratified into four categories: low (< 5%), borderline (5% to < 7.5%), intermediate (≥7.5% to < 20%), and high (≥20%). (ii) CAD-PRS integrated with the PCE (CardioriskSCORE). (iii) No-workplace health program (No-WHP). In CardioriskSCORE, employees first assess their PCE 10-year risk and then self-administer a non-invasive oral DNA test, which is analyzed in a Clinical Laboratory Improvement Amendments (CLIA) certified and College of American Pathologists (CAP) accredited laboratory to calculate individual CAD-PRS. Within 3 weeks, employees receive confidential and personalized results for their disease risk based on the combination of CAD-PRS and PCE risk. Those at high risk are recommended to initiate statin preventive therapy through their primary care physician or cardiologist. Employees have access to a Health Assistant Mobile App to track their health status and modifiable risk factors over time and are supplied with personalized recommendations to maintain a healthy diet and lifestyle.
Model structure
We developed a cohort simulation model (Figure 1) in TreeAge Pro Software 2021 to project costs and quality-adjusted life years (QALYs) among employees in a workplace setting. We used a simulation model as no patient-level data (real-world data) were available to examine the economic impact and health benefits of implementing CAD-PRS in a workplace setting. The model had an annual cycle with a total of 22 health states reflecting the risk of CAD stratified by PCE and CAD-PRS, side effects of statin prevention therapy (diabetes, hemorrhagic stroke, and myopathy), health outcomes (CAD and ischemic stroke), and mortality.
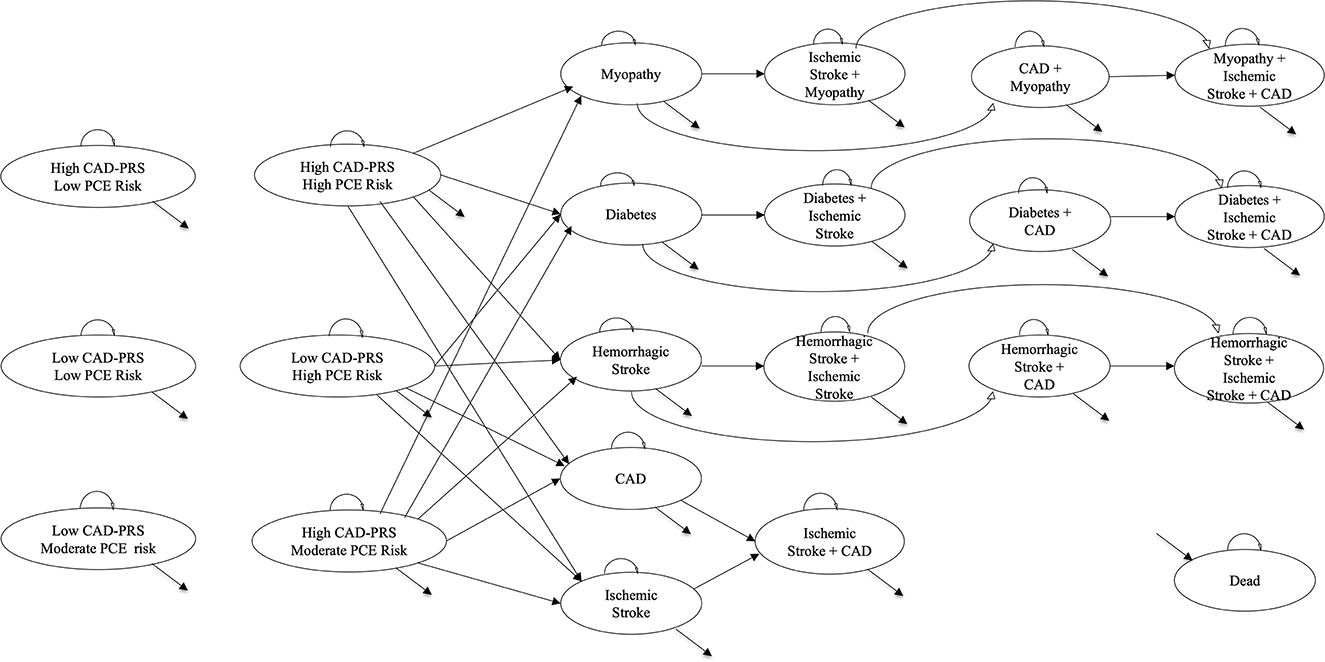
Figure 1. Markov model schematic. This figure shows the Markov model schematic with 22 health states representing the risk of CAD, health outcomes, statin side effects, and death: 6 of 22 health states represented the risk of CAD based on PCE (low PCE risk, moderate PCE risk, and high PCE risk) and CAD-PRS (low CAD-PRS = bottom 80% of the PRS distribution and high CAD-PRS = top 20% of the PRS distribution); 3 of 22 health states represented statin side effects (myopathy, diabetes, and hemorrhagic stroke); 2 of 22 health states represented the primary health outcomes (CAD and ischemic stroke); 10 of 22 health states represented comorbidities of statin side effects and/or primary health outcomes; finally, 1/22 health states represented death. Outcomes were examined for the proportion of the cohort that was eligible for prevention intervention (i.e., high CAD-PRS with high/moderate PCE risk; low CAD-PRS and high PCE risk). In the CardioriskSCORE strategy, all the cohorts eligible for prevention intervention initiated statin preventive therapy to reduce the risk of CAD and ischemic stroke, while for the Standard-WHP strategy, only a proportion with high PCE risk initiated prevention therapy, and none in the No-WHP. CAD, coronary artery disease; CAD-PRS, polygenic risk score for coronary artery disease; PCE, pooled cohort equation.
We assumed the cohort to be disease-free at the start of the model and individuals classified as eligible for the prevention intervention could develop CAD and ischemic stroke over the set time horizon. Fractions of the cohort that was eligible and adherent to statin prevention therapy had a reduced risk of developing CAD and ischemic stroke but were also at risk of developing statin side effects. We accounted for both disease-specific and age-adjusted natural mortality, and utility values and costs were applied to respective health states to project QALYs and costs. The model was validated by comparing the lifetime expectancy in the disease-free cohort to that of the general US population and the number of adverse event outcomes in prior published work (5). This manuscript followed the 2022 CHEERS checklist (Supplementary Table S1).
Parameter inputs
Parameter inputs (Table 1) used in the model were derived from the literature. The initial distribution of the cohort came from a large (N = 47,108 persons) multi-centric multi-ancestry study conducted in the United States with the cohort classified by PCE 10-year risk [low (41%), moderate (36%), and high risk (23%)] and further broken down by CAD-PRS distribution (top quintile and bottom 80%) (2). A minimum risk of 20% for developing CAD in 10 years was applied to employees classified as high risk by the PCE and 12.5% (average of moderate risk, 5 to < 20%) for those with moderate risk (9), respectively; a 1.9-fold increase in the risk was applied to employees in the top quintile of the CAD-PRS distribution (2). The risk of CAD increased among employees with ischemic stroke (0.017 [95% CI 0.014 – 0.019]) (12) and with statin-induced diabetes (HR: 2.270 [95% CI 1.950–2.650]) (13) but not for myopathy (14) or post-hemorrhagic stroke (HR, 1.600 [95% CI 0.300–2.900] (15).
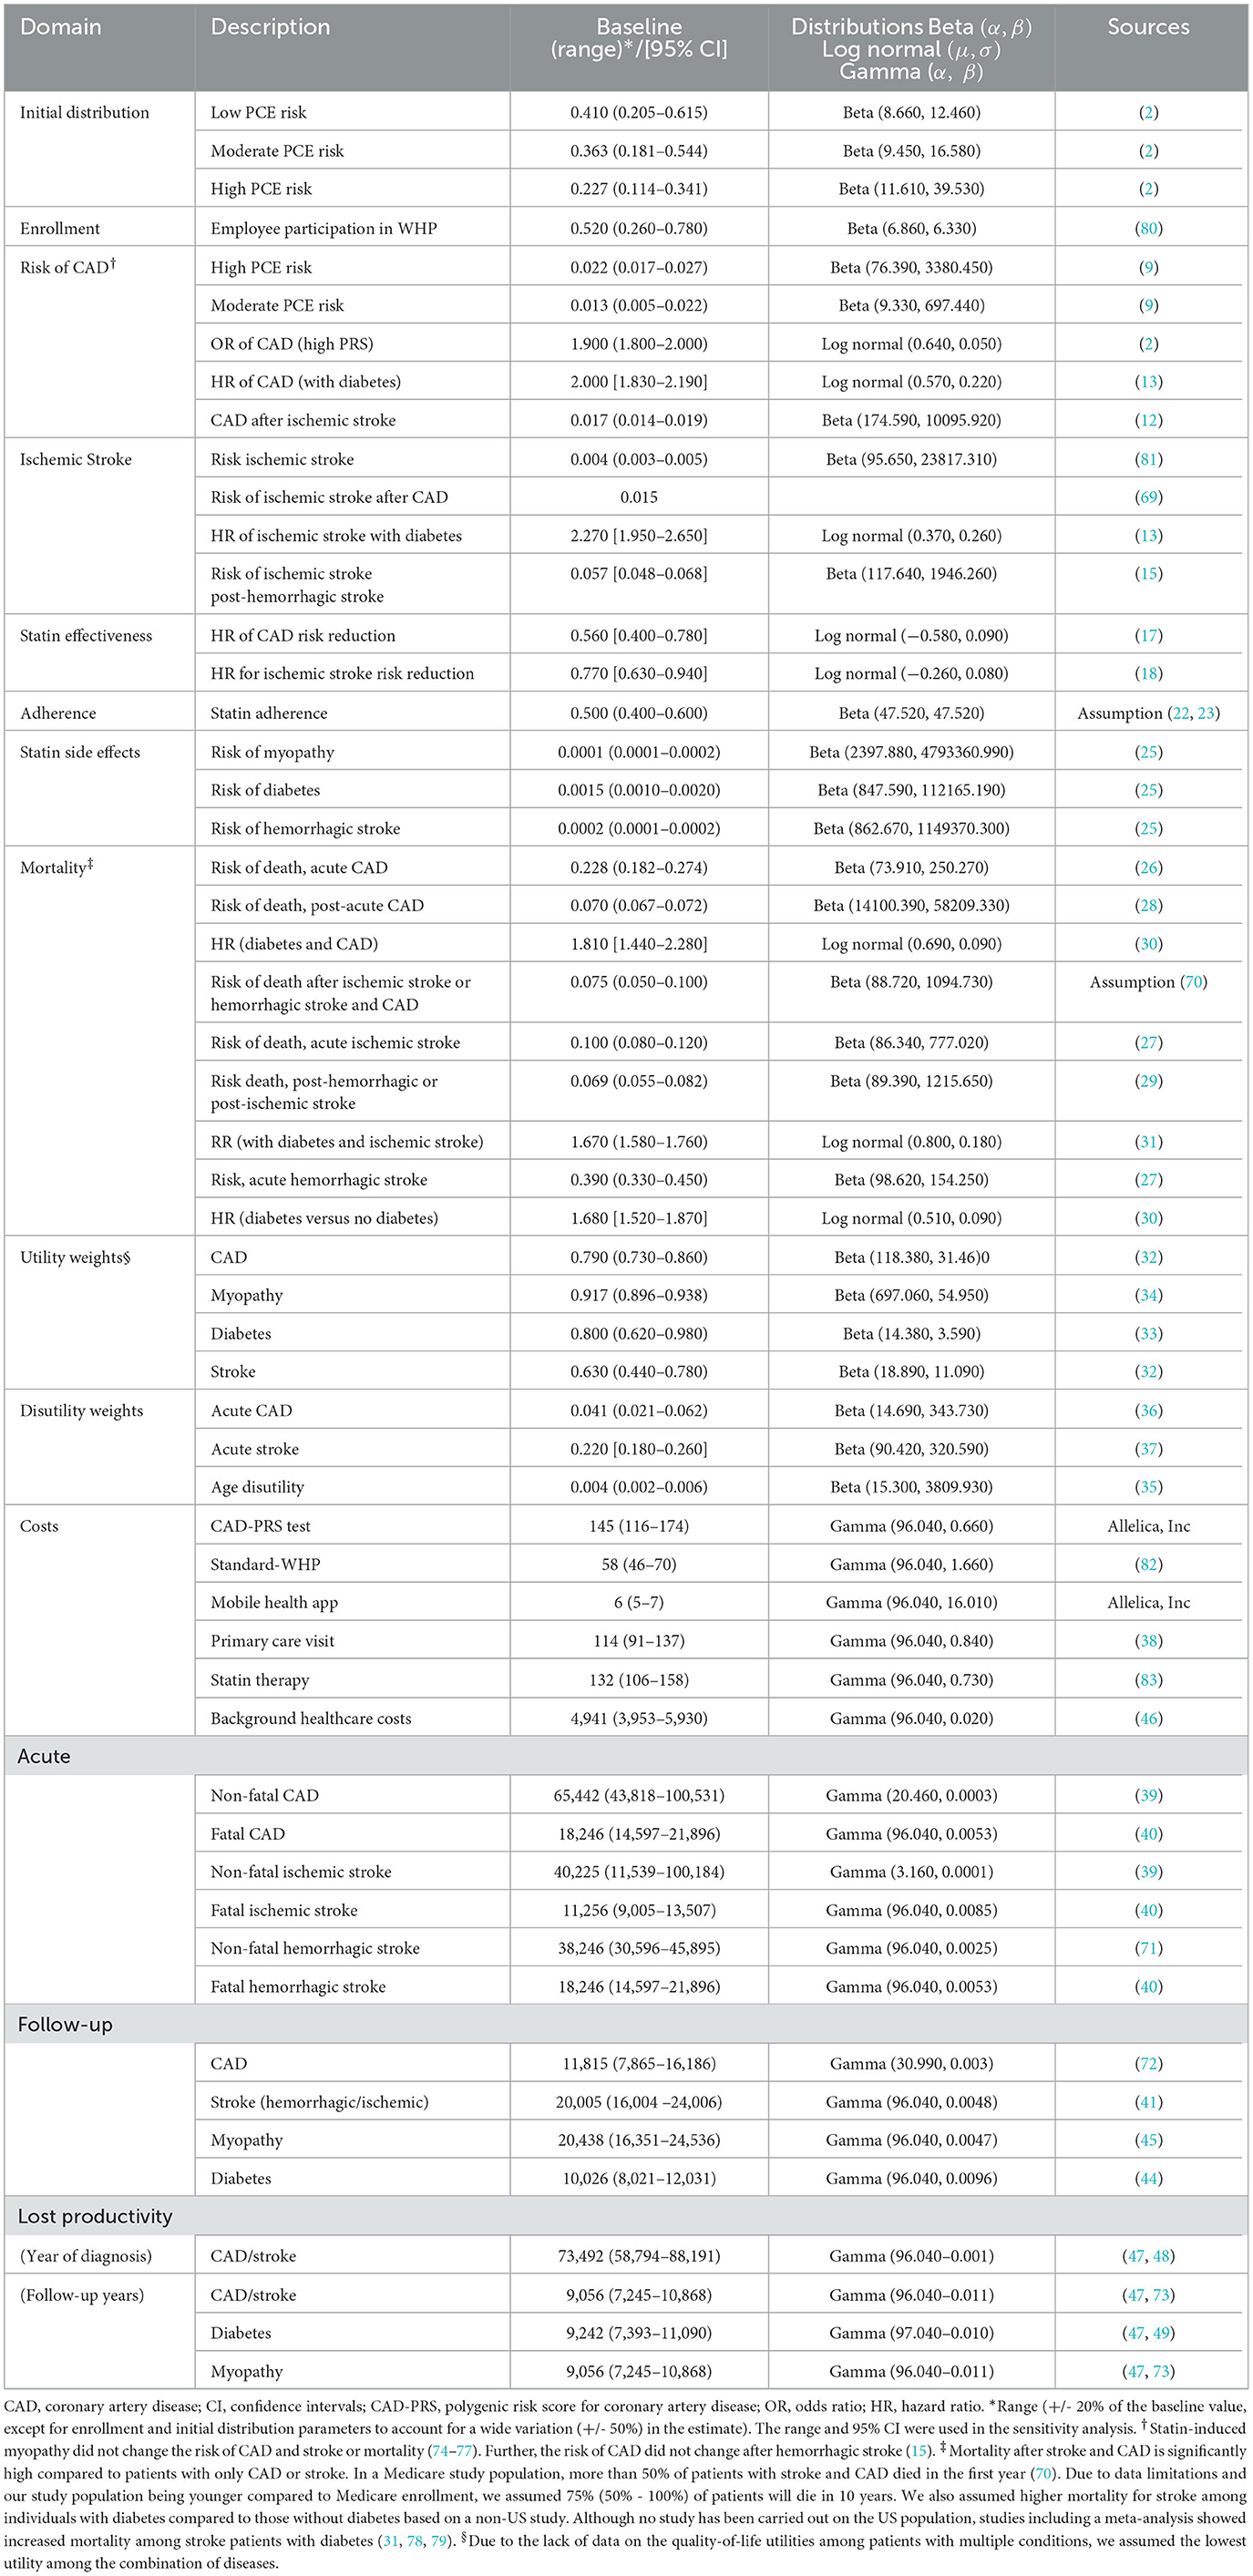
Table 1. Annual parameter inputs.
Although employees at risk of developing CAD are also likely to develop ischemic stroke (9), in this study, we assumed the risk of ischemic stroke to be equal to that of the general population. Around 800,000 cases of stroke occur among adults (around 200 million) in the United States per year and a significant majority (90%) are ischemic stroke cases (81). Based on these estimates, we derived a 0.004 annual risk of developing ischemic stroke, which we assumed to be constant over the time horizon of 5 years.
Statins are recommended as preventive therapy among individuals at high risk of CAD and have been shown to be effective (16) in reducing the risk of CAD (HR: 0.560 [95% CI 0.400–0.780]) (17) and stroke events (HR: 0.770 [95% CI 0.630–0.940]) (18). This risk reduction was only applied to employees that were adherent to the therapy. Simvastatin 20–80 mg is the most commonly used type of statin in the United States accounting for more than 42% of all prescriptions (19). We assumed the effectiveness of statins to be uniform across all eligible employees in the cohort although the efficacy of simvastatin among high- or moderate-risk individuals with high CAD-PRS has not been examined. Therefore, we used the efficacy of pravastatin, which has been examined among high-risk individuals with high CAD-PRS (17). Further, pravastatin and simvastatin have shown comparable effectiveness in reducing LDL cholesterol (20, 21).
Half of the employees identified as eligible for preventive therapy were assumed to be adherent to statin over the analytical time horizon. Although low (< 50%) adherence to prevention therapy has been reported in the literature (22, 23), no study has examined adherence to statins among individuals with high CAD-PRS. Despite this gap in the literature, there is evidence of higher adherence to preventive therapy among women with high breast cancer PRS (24). Those adherent to statin preventive therapy have an additional annual risk of developing adverse effects: myopathy (0.010%), diabetes (0.150%), and hemorrhagic stroke (0.020%) (25). Those with diabetes have an increased risk of CAD (HR: 2.000 [1.830–2.190]) (13) and ischemic stroke (HR: 2.270 [1.950–2.650]) (13), and those with hemorrhagic stroke have a higher risk of ischemic stroke (0.057 [0.048–0.068]) (15).
The risk of death among event-free employees was based on the social security life tables (Supplementary Table S2). Acute coronary syndrome (0.228 [0.182–0.274]) (26), ischemic stroke (0.100 [0.080–0.120) (27), and hemorrhagic stroke (0.390 [0.330–0.450]) (27) had a higher risk of death compared to chronic CAD (0.070 [0.067–0.072]) (28) and ischemic and hemorrhagic stroke (0.069 [0.055–0.082]) (29), respectively. Diabetes significantly increased the risk of death by nearly 2-fold among employees with CAD (HR: 1.810 [1.440–2.280]) (30) and ischemic stroke (HR: 1.670 [1.580–1.760]) (31) and compared disease-free employees (HR: 1.680 [1.520–1.870]) (30).
Utility values
Utility weights were assigned to health states in the model to reflect their health status (severity of disease) with death assigned a utility weight of 0 and event-free health states assigned a utility weight of 1 (perfect health). Utility weights for CAD (0.790, 0.730–0.860) (32), ischemic and hemorrhagic stroke (0.640, 0.440–0.780) (32), diabetes (0.800, 0.620–0.980) (33), and myopathy (0.917, 0.896–0.938) (34) were derived from the literature. An annual decrement was applied to reflect disutility due to aging (35) and disutility for acute events [CAD (36) and ischemic and hemorrhagic stroke (37)].
Costs
Costs came from the literature and were inflation adjusted to US$ 2019 using the gross domestic product deflator. We considered both medical costs (PCE screening test, CAD-PRS testing, statin preventive therapy, primary care visit, and disease treatment costs) and lost productivity (absenteeism and presenteeism). The cost of CAD-PRS testing ($145) was based on current prices of genotyping arrays and bioinformatic analysis needed to develop CAD-PRS (Source: Allelica, Inc) while the cost of Standard-WHP ($58) came from gray literature and reflected the average cost per employee to perform workplace biometric screening (82). CAD-PRS is a one-time cost and was only applied in the first year and PCE is performed annually. Therefore, starting from the second year, both the CardioriskSCORE and Standard-WHP strategies assessed the risk of CAD using PCE and had the same annual cost. For the CardioriskSCORE strategy, an additional $6 for the Health Assistant Mobile App was applied after the first year, and a one-time primary care visit cost ($114) for genetic consultation, based on a nationally presentative medical expenditure panel survey on patient medical expenses (38), was applied to the cohort with high CAD-PRS. The cost of statin preventive therapy ($132) was derived from online pharmacy prices and applied only to employees that were adherent to the therapy (83).
The cost of treating acute and chronic CAD ($65,442; $11,815) and ischemic stroke ($40,225; $20,005) was based on costs for patients with cardiovascular diseases in the United States (39–41), respectively. The cost of recurrent CAD (42) and ischemic stroke (43) was calculated as the product of the risk of recurrence of the event and the cost of treatment. Costs of treating diabetes ($10,026) (44), myopathy ($20,438) (45), and hemorrhagic stroke ($20,005) (41) were included for employees that experienced statin preventive therapy side effects. Background healthcare costs were applied to all individuals that are alive to account for healthcare resource utilization, which was estimated based on per capita healthcare expenditure for privately insured individuals in the United States (46).
The illness of employees has a substantial impact on productivity and employer expenses. Therefore, we considered health-related absenteeism (time taken off work due to illness) and presenteeism (reduction in productivity at work due to illness) as lost productivity from an employer's perspective. Employees that survived CAD, ischemic, and hemorrhagic stroke had a total loss in productivity of $73,492 during their first year of diagnosis (47, 48) and $9,056 in subsequent years (47, 73). We estimated the cost of absenteeism based on patients who survived acute coronary artery syndromes and had an average absenteeism cost of $14,698 in their first year (48). To our knowledge, no study has examined absenteeism for CAD and stroke after the first year of diagnosis, and for myopathy. Therefore, we assumed an absenteeism cost of $1,811 for myopathy, CAD, and stroke in subsequent years, which is equivalent to the national average cost of absenteeism for people living with chronic conditions (73). The cost of presenteeism was assumed to be four times the cost of absenteeism, derived from the national estimates on lost productivity costs incurred by the employer due to coronary heart disease and stroke (47). Annual lost productivity cost for employees living with diabetes was $9,242, which includes both absenteeism and presenteeism costs (47, 49). For consistency, we also assumed presenteeism costs for myopathy and diabetes to be four times the cost of absenteeism.
Analysis
The analysis was performed to reflect a self-insured employer perspective. In the United States, employers who are self-insured bear the cost burden of medical claims resulting from adverse outcomes among insured employees. This perspective was chosen to examine the cost implications to the employer and the health benefits of preventing cardiovascular adverse events among employees. The time horizon for the analysis was 5 years, which represented the average number of years an employee consistently works with a particular employer in the United States (84).
The main outcomes were total costs, incremental costs, incremental quality-adjusted life years (QALYS), and incremental cost-effectiveness ratio (ICER). We assessed the relative Performance of the three strategies using the ICER. A strategy was considered cost-effective compared to the second best alternative if the ICER < willingness-to-pay (WTP) threshold of $50,000. We discounted future costs and QALYs at the same rate of 3% per year as recommended for cost-effectiveness analysis of interventions in healthcare in the United States (50).
One-way and probabilistic sensitivity analyses were used to assess uncertainty in model parameters and their impact on the incremental net monetary benefit. In one-way sensitivity analysis, we varied one parameter at a time while holding other parameters at baseline value and results are presented using a tornado diagram. In probabilistic sensitivity analysis, we assigned beta (probability parameters), log-normal (relative risk and hazard ratio parameters), and gamma (costs) distributions and performed 10,000 Monte Carlo simulations. Results are reported using a joint distribution of incremental costs and QALYs gained for the CardioriskSCORE vs. Standard-WHP and CardioriskSCORE vs. No-WHP.
Scenario analysis
In the scenario analysis, we accounted for annual changes in the risk of CAD with the movement of fractions of the cohort across risk categories (low, moderate, and high) by strategy: with a WHP (CardioriskSCORE and Standard-WHP) and without a WHP (No-WHP) (51). Per model cycle, fractions of the cohort can move from low to moderate, low to high, moderate to low, moderate to high, high to low, and high to moderate. We assumed that the cohort in the No-WHP strategy experience a natural change in the risk CAD (25, 5, 35, 20, 6, and 31%) based on the study that reported annual changes in cardiovascular risk (51).
In the CardioriskSCORE and Standard-WHP, the change in risk was weighted to account for the percentage of the cohort that enrolled in a WHP. The fraction of the cohort that did not enroll in a WHP (48%) experienced the natural change in risk while those that enrolled (52%) had changes in CAD risk that is comparable to that of individuals in a WHP (12.050, 0.620, 46.350, 7.660, 15.650, and 48.700%). Based on the percentage enrollment, the change in CAD risk weighed was 18.780, 2.900, 40.450, 14.080, 10.630, and 39.500%. We applied for annual PCE screening and assumed that enrollment remained constant.
As polygenic screening is only performed once in the first year of the time horizon, follow-up costs per patient screened are similar for CardioriskSCORE and Standard-WHP. Changes in CAD risk occurred after the first year.
Results
Base case analysis results are reported in Table 2. CardioriskSCORE was a dominant strategy with lower incremental cost ($53 and $575) and higher QALYs (0.001 and 0.005) per employee compared to Standard-WHP and No-WHP, respectively. Findings remained robust in the one-way sensitivity analysis (Figures 2, 3). CardioriskSCORE had an incremental net monetary benefit of $102 and $839 compared to Standard-WHP and No-WHP, respectively. All parameter variations had a positive incremental net monetary benefit, indicating that CardioriskSCORE was dominant despite changes in parameter values. Statin effectiveness, baseline PCE risk among employees, the proportion of employees enrolled in the program, and statin adherence were the main parameter inputs impacting the findings.
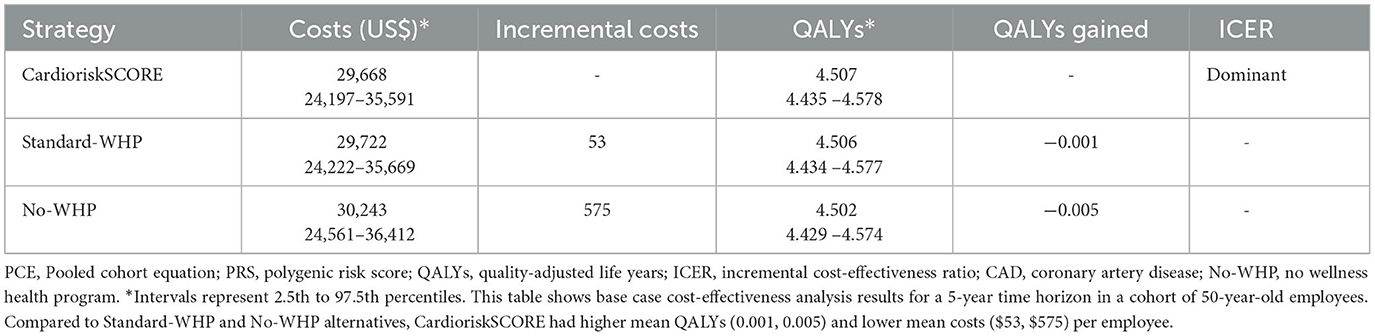
Table 2. Results for the base case analysis in 5 years.
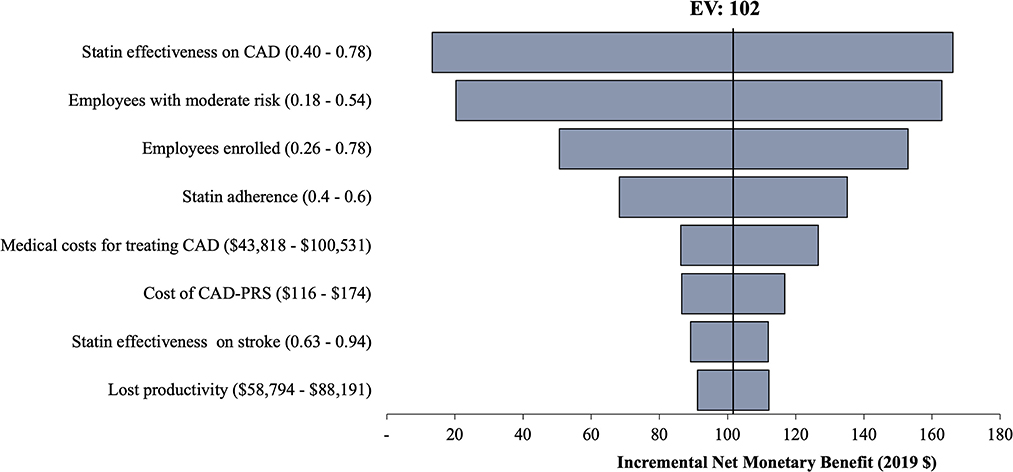
Figure 2. One-way sensitivity analysis of CardioriskSCORE compared to Standard-WHP. This figure shows results from the one-way sensitivity analysis for CardioriskSCORE compared to the Standard-WHP. Variation in parameter values did not change conclusions in the base case findings as indicated with positive incremental net monetary benefit across all parameters. Stain effectiveness on CAD had the highest impact on the findings. CAD, coronary artery disease; CAD-PRS, polygenic risk score for coronary artery disease; EV, expected value.
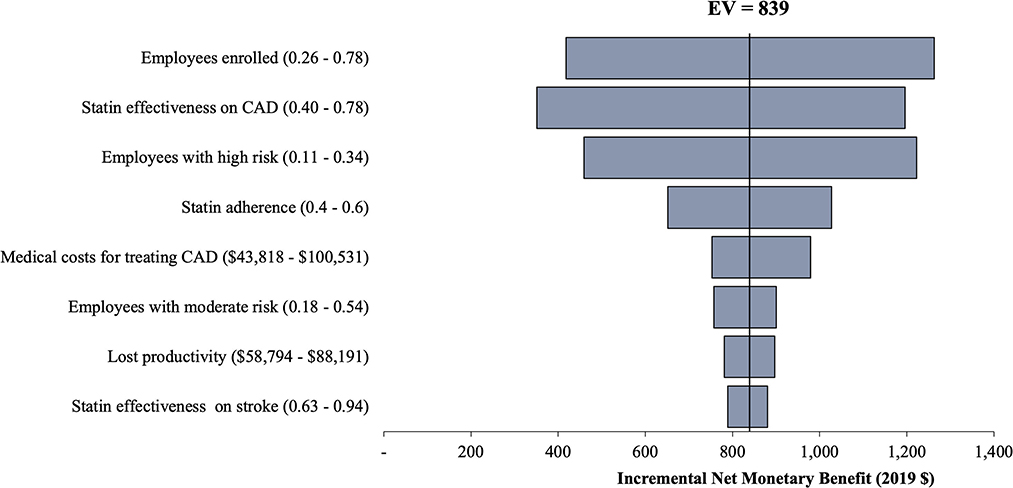
Figure 3. One-way sensitivity analysis of CardioriskSCORE compared to No-WHP. This figure shows results from the one-way sensitivity analysis for CardioriskSCORE compared to No-WHP. Base case results remain robust to variations in parameter values as indicated with positive incremental net monetary benefit across all parameters. Similar to the Standard-WHP strategy, stain effectiveness on CAD had the highest impact on the findings. CAD, coronary artery disease; No-WHP, no-workplace health program; EV, expected value.
Probabilistic sensitivity analysis results in Supplementary Figures S1, S2 underscore the robustness of the findings in the base case analysis. The joint distribution of incremental costs and incremental effectiveness (QALYs gained) of CardioriskSCORE compared to Standard-WHP and No-WHP indicate a higher likelihood of cost-saving and improved quality of life among employees. At a $50,000 willingness-to-pay threshold, CardioriskSCORE had a 95 and 99% probability of being cost-effective compared to Standard-WHP and No-WHP, respectively.
Results from the scenario analysis (Table 3) were consistent with base case results. After adjusting for changes in the annual risk of CAD CardioriskSCORE remained cost-saving and effective with higher mean QALYs (0.001, 0.009) and lower mean costs ($28, $1,306) per employee in the primary prevention population. In the scenario analysis, a larger fraction of the cohort moved to the low-risk category in the CardioriskSCORE due to the impact of the program and compared to No-WHP, which resulted in more cost-savings and QALYs gained ($1,306; 0.009) than in the base case analysis ($575; 0.005).
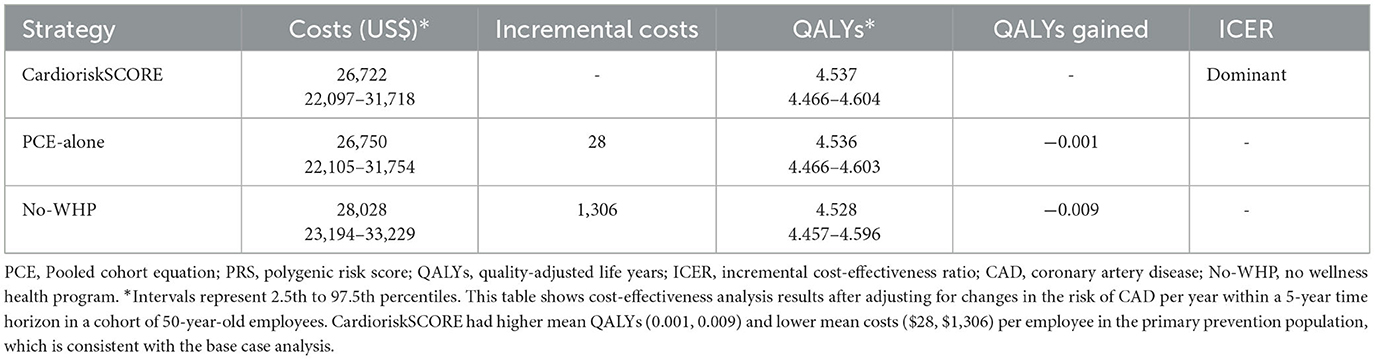
Table 3. Cost-effectiveness results after accounting for changes in CAD risk.
Discussion
This study found that integrating a CAD-PRS in a workplace cardiovascular disease prevention program is cost-effective and cost-saving with more than $53 and $575 per employee screened, compared to Standard-WHP and No-WHP, respectively. These findings were robust to variations in parameter values and annual changes in the risk of CAD.
The findings in the current study are broadly consistent with the literature. WHPs focused on healthy lifestyles, physical activity, and nutrition were found to be cost-effective with an increase in QALYs (0.003) (52), which is comparable to QALYs gained by the CardioriskSCORE. Furthermore, WHPs were found to be cost-saving with a reduction in medical expenses and absenteeism of $3.270 and $2.730 per dollar spent, respectively (53). In a cost-effectiveness microsimulation model on the ban of sugar-sweetened beverages at a workplace, the intervention was found to be effective at reducing the incidence of chronic conditions, medical costs, and lost productivity, by saving $300,000 per 10,000 employees over a period of 10 years (54).
Prior studies focused on cardiovascular disease prevention in workplace settings have shown positive results, but few examined the costs and cost-effectiveness of programs, and none accounted for genetic risk. Cardiovascular disease prevention programs were found to improve the awareness of risk factors among firefighters (55) early detection of isolated risk factors (56), healthy lifestyle (57) and reduced obesity, high blood pressure, and hyperlipidemia (58). A lifestyle education program focused on cardiovascular disease risk reduction within a period of 12 months was found cost-effective with a $454 per percentage point reduction in the Framingham Risk Score for coronary heart disease risk (59). Among firefighters, a cardiovascular prevention program was cost-effective compared to doing nothing by preventing 10% of cardiovascular events at $1,440 over 10 years (60).
Our findings are novel and address a key gap in the workplace health literature by demonstrating added economic value and improved quality of life of polygenic testing. Multiple vendors currently offer employer-based genetic testing in the United States with over 70% reporting employer cost reduction and improved employee health outcomes but there is no evidence of cost-effectiveness for their products (6). Overall, there is limited literature on precision medicine in workplaces, but prior work has explored the use of genetic testing and personalized interventions to improve employee health outcomes, protect workers at high risk, and reduce costs for workers' compensation (61). Furthermore, a review of the literature from the National Institute of Occupational Safety and Health (NIOSH) found that evidence on genetic testing in workplaces is limited and genetic tests for monitoring or screening need to be validated to provide reliable exposure or risk assessments (62). This shows that more research is needed to better understand the utility of precision medicine in workplaces, practical approaches to implementation, and employee data privacy.
In 2011, NIOSH launched the “Total Worker Health” program which defines company policies, programs, and practices that integrate protection from work-related safety and health hazards with the promotion of injury and illness-prevention efforts to advance worker wellbeing (63). Workplace health promotion programs that incorporate the Total Worker Health approach are especially necessary for addressing challenges faced by employees with long-term effects of COVID-19 (64) and have also been found to have a high return on investment (65). An indication that with the integration of PRS in programs that use the Total Worker Health approach, employers may gain an even higher return on investment from the added value in productivity and cost-savings from early disease detection and prevention.
Over 95% of employers in the United States offer some form of WHPs to identify health risks and manage chronic conditions (1). However, less than half focus on cardiovascular disease prevention (1), despite high disease prevalence in the workforce and costing employers more than $363 billion in medical expenses and causing productivity loss annually (66). Even more concerning is that cardiovascular deaths increased during the COVID-19 pandemic (67). Adding genetic testing in workplaces would provide value for employees by knowing their genetic risk and potentially changing their lifestyles to mitigate the risk of disease and associated healthcare costs and for employers by saving costs on employee medical claims and improving employee productivity (7).
This study has several limitations. First, in the base case analysis, the risk of CAD was assumed to be constant although it may change over time due to changes in behaviors and lifestyle. However, in this scenario, we accounted for the change in CAD risk and the results remained robust. Second, the model assumes that employees' risk can only be determined through workplace programs, which may not always be the case. Third, there could be a correlation across parameters that may impact the findings, which we did not account for in the model. Fourth, although CAD-PRS was estimated using a large multi-centric multi-ancestry population, the model in this study did not account for racial composition in workplace settings, which is a key predictor of cardiovascular outcomes. Finally, the model assumed that employees who agree to participate in the PCE risk assessment would also agree to PRS testing although there are privacy concerns regarding genetic testing in workplaces. However, the majority of employees have shown a willingness to perform genetic testing if the test is easy and accessible and the data are only available to employees and their doctors (7).
Adding polygenic screening in cardiovascular disease prevention saves costs for the employer and improves the quality of life of employees. The current COVID-19 pandemic has transformed the traditional workplace environment with more Americans working remotely and for longer hours with less access to gyms and other amenities for physical activity leading to an increased risk of cardiovascular diseases (68). There is an urgent need for innovative WHPs focusing on cardiovascular disease prevention and management to reduce future medical expenses and improve employees' health status and productivity.
Data availability statement
The original contributions presented in the study are included in the article/Supplementary material, further inquiries can be directed to the corresponding author.
Author contributions
DM developed the Markov model, performed the analysis, and drafted the manuscript. GB contributed to the conceptual development of the Markov model and writing the manuscript. JK, PD, and GBB contributed to the writing of the manuscript. All authors reviewed and approved the manuscript.
Conflict of interest
DM, JK, PD, GBB, and GB were employed by the Allelica, Inc.
Publisher's note
All claims expressed in this article are solely those of the authors and do not necessarily represent those of their affiliated organizations, or those of the publisher, the editors and the reviewers. Any product that may be evaluated in this article, or claim that may be made by its manufacturer, is not guaranteed or endorsed by the publisher.
Supplementary material
The Supplementary Material for this article can be found online at: https://www.frontiersin.org/articles/10.3389/fpubh.2023.1139496/full#supplementary-material
References
1. Claxton G, Young G, Mcdermott D, Cifuentes J, Strange L. Employer Health Benefits: 2020 Annual Survey. San Francisco, CA: Kaiser Family Foundation. (2020).
2. Aragam KG, Dobbyn A, Judy R, Chaffin M, Chaudhary K, Hindy G, et al. Limitations of contemporary guidelines for managing patients at high genetic risk of coronary artery disease. J Am Coll Cardiol. (2020) 75:2769–80. doi: 10.1016/j.jacc.2020.04.027
3. Bolli A, Di Domenico P, Pastorino R, Busby GB, Bottà G. Risk of coronary artery disease conferred by low-density lipoprotein cholesterol depends on polygenic background. Circulation. (2021) 143:1452–4. doi: 10.1161/CIRCULATIONAHA.120.051843
4. Khera A V, Chaffin M, Aragam KG, Haas ME, Roselli C, Choi SH, et al. Genome-wide polygenic scores for common diseases identify individuals with risk equivalent to monogenic mutations. Nat Genet. (2018) 50:1219–24. doi: 10.1038/s41588-018-0183-z
5. Mujwara D, Henno G, Vernon ST, Peng S, Domenico P Di, Schroeder B, et al. Integrating a polygenic risk score for coronary artery disease as a risk enhancing factor in the pooled cohort equation is cost-effective in a us health system. J Am Heart Assoc. (2022) 11:1–15. doi: 10.1161/JAHA.121.025236
6. McDonald WS, Wagner JK, Deverka PA, Woods LA, Peterson JF, Williams MS. Genetic testing and employer-sponsored wellness programs: an overview of current vendors, products, and practices. Mol Genet Genomic Med. (2020) 8:10. doi: 10.1002/mgg3.1414
7. Sanghavi K, Cohn B, Prince AER, Feero WG, Ryan KA, Spector-Bagdady K, et al. Voluntary workplace genomic testing: wellness benefit or Pandora's box? NPJ Genom Med. (2022) 7:1–8. doi: 10.1038/s41525-021-00276-8
8. Trinder M, Francis GA, Brunham LR. Association of monogenic vs polygenic hypercholesterolemia with risk of atherosclerotic cardiovascular disease. JAMA Cardiol. (2020) 5:390–9. doi: 10.1001/jamacardio.2019.5954
9. Arnett DK, Blumenthal RS, Albert MA, Buroker AB, Goldberger ZD, Hahn EJ, et al. 2019 ACC/AHA guideline on the primary prevention of cardiovascular disease: a report of the American college of cardiology/American heart association task force on clinical practice guidelines. Circulation. (2019) 40:596–646. doi: 10.1161/CIR.0000000000000725
10. Shockey TM, Tsai RJ, Cho P. Prevalence of diagnosed diabetes among employed us adults by demographic characteristics and occupation, 36 states, 2014 to 2018. J Occup Environ Med. (2021) 63:302–10. doi: 10.1097/JOM.0000000000002117
11. Luckhaupt SE, Calvert GM. Prevalence of coronary heart disease or stroke among workers aged < 55 years — United States, 2008–2012. MMWR Morb Mortal Wkly Rep. (2014) 63:650–4.
12. Boulanger M, Béjot Y, Rothwell PM, Touzé E. Long-term risk of myocardial infarction compared to recurrent stroke after transient ischemic attack and ischemic stroke: Systematic review and meta-analysis. J Am Heart Assoc. (2018) 7:267. doi: 10.1161/JAHA.117.007267
13. Sarwar N, Gao P, Kondapally Seshasai SR, Gobin R, Kaptoge S, Di Angelantonio E, et al. Diabetes mellitus, fasting blood glucose concentration, and risk of vascular disease: A collaborative meta-analysis of 102 prospective studies. Lancet. (2010) 375:2215–22. doi: 10.1016/S0140-6736(10)60484-9
14. Linos E, Fiorentino D, Lingala B, Krishnan E, Chung L. Atherosclerotic cardiovascular disease and dermatomyositis: an analysis of the nationwide inpatient sample survey. Arthritis Res Ther. (2013) 15:1–5. doi: 10.1186/ar4135
15. Murthy SB, Diaz I, Wu X, Merkler AE, Iadecola C, Safford MM, et al. Risk of arterial ischemic events after intracerebral hemorrhage. Stroke. (2020) 51:137–42. doi: 10.1161/STROKEAHA.119.026207
16. Li M, Wang X, Li X, Chen H, Hu Y, Zhang X, et al. Statins for the primary prevention of coronary heart disease. Biomed Res Int. (2019) 2019:350. doi: 10.1155/2019/4870350
17. Natarajan P, Young R, Stitziel NO, Padmanabhan S, Baber U, Mehran R, et al. Polygenic risk score identifies subgroup with higher burden of atherosclerosis and greater relative benefit from statin therapy in the primary prevention setting. Circulation. (2017) 135:2091–101. doi: 10.1161/CIRCULATIONAHA.116.024436
18. Byington RP, Davis BR, Plehn JF, White HD, Baker J, Cobbe SM, et al. Reduction of stroke events with pravastatin: the prospective pravastin pooling (PPP) project. Circulation. (2001) 103:387–92. doi: 10.1161/01.CIR.103.3.387
19. Gu Q, Paulose-Ram R, Burt VL, Kit BK. Prescription cholesterol-lowering medication use in adults aged 40 and over: United States, 2003-2012. NCHS Data Brief. (2014) 177:1–8.
20. Zhang X, Xing L, Jia X, Pang X, Xiang Q, Zhao X, et al. Comparative lipid-lowering/increasing efficacy of 7 statins in patients with dyslipidemia, cardiovascular diseases, or diabetes mellitus: systematic review and network meta-analyses of 50 randomized controlled trials. Cardiovasc Ther. (2020) 2020:65. doi: 10.1155/2020/3987065
21. Lambrecht LJ, Malini PL. Efficacy and tolerability of simvastatin 20 mg vs pravastatin 20 mg in patients with primary hypercholesterolemia. Eur Study Group Acta Cardiol. (1993) 48:541–54.
22. Maningat P, Gordon BR, Breslow JL. How do we improve patient compliance and adherence to long-term statin therapy? Curr Atheroscler Rep. (2013) 15:1–12. doi: 10.1007/s11883-012-0291-7
23. Colantonio LD, Rosenson RS, Deng L, Monda KL Dai Y, Farkouh ME, et al. Adherence to statin therapy among US adults between 2007 and 2014. J Am Heart Assoc. (2019) 8:1–20. doi: 10.1161/JAHA.118.010376
24. Kim JO, Schaid DJ, Vachon CM, Cooke A, Couch FJ, Kim CA, et al. Impact of personalized genetic breast cancer risk estimation with polygenic risk scores on preventive endocrine therapy intention and uptake. Cancer Prevention Res. (2021) 14:175–84. doi: 10.1158/1940-6207.CAPR-20-0154
25. Collins R, Reith C, Emberson J, Armitage J, Baigent C, Blackwell L, et al. Interpretation of the evidence for the efficacy and safety of statin therapy. Lancet. (2016) 388:2532–61. doi: 10.1016/S0140-6736(16)31357-5
26. Caughey MC, Arora S, Qamar A, Chunawala Z, Gupta MD, Gupta P, et al. Trends, management, and outcomes of acute myocardial infarction hospitalizations with in-hospital-onset versus out-of-hospital onset: the aric study. J Am Heart Assoc. (2021) 10:1–12. doi: 10.1161/JAHA.120.018414
27. Ovbiagele B, Nguyen-Huynh MN. Stroke epidemiology: advancing our understanding of disease mechanism and therapy. Neurotherapeutics. (2011) 8:319–29. doi: 10.1007/s13311-011-0053-1
28. Rapsomaniki E, Thuresson M, Yang E, Blin P, Hunt P, Chung S chia, et al. Using big data from health records from four countries to evaluate chronic disease outcomes : a study in 114,364 survivors of myocardial infarction. Eur Heart J. (2016) 25:172–83. doi: 10.1093/ehjqcco/qcw004
29. Koton S, Schneider ALC, Rosamond WD, Shahar E, Sang Y, Gottesman RF, et al. Stroke incidence and mortality trends in US communities, 1987 to 2011. JAMA. (2014) 312:259–68. doi: 10.1001/jama.2014.7692
30. Li S, Wang J, Zhang B, Li X, Liu Y. Diabetes mellitus and cause-specific mortality : a population-based study. Diab Metab J. (2019) 43:319–41. doi: 10.4093/dmj.2018.0060
31. Eriksson M, Carlberg B, Eliasson M. The disparity in long-term survival after a first stroke in patients with and without diabetes persists: the northern Sweden MONICA study. Cereb Dis. (2012) 34:153–60. doi: 10.1159/000339763
32. Betts MB, Rane P, Bergrath E, Chitnis M, Bhutani MK, Gulea C, et al. Utility value estimates in cardiovascular disease and the effect of changing elicitation methods: a systematic literature review. Health Qual Life Outcomes. (2020) 18:1–12. doi: 10.1186/s12955-020-01407-y
33. Zhang P, Brown MB, Bilik D, Ackermann RT Li R, Herman WH. Health utility scores for people with type 2 diabetes in U. S managed care health plans. Diabetes Care. (2012) 35:2250–6. doi: 10.2337/dc11-2478
34. Mitchell D, Guertin JR, Iliza AC. Fanton-aita F, Lelorier J. Economic evaluation of a pharmacogenomics test for statin- induced myopathy in cardiovascular high-risk patients initiating a statin. Mol Diagn Ther. (2017) 21:95–105. doi: 10.1007/s40291-016-0238-8
35. Ara R, Brazier JE. Populating an economic model with health state utility values: moving toward better practice. Value Health. (2010) 13:509–18. doi: 10.1111/j.1524-4733.2010.00700.x
36. Sullivan PW, Ghushchyan V. Preference-based EQ-5D index scores for chronic conditions in the United States. Medical Decision Making. (2006) 26:410–20. doi: 10.1177/0272989X06290495
37. Luengo-Fernandez R, Gray AM, Bull L, Welch S, Cuthbertson F, Rothwell PM. Quality of life after TIA and stroke: ten-year results of the oxford vascular study. Neurology. (2013) 81:1588–95. doi: 10.1212/WNL.0b013e3182a9f45f
38. Machlin SR, Mitchell EM. Expenses for Office-Based Physician Visits by Specialty Insurance Type. Medical Expenditure Panel Survey. (2016). Available online at: https://meps.ahrq.gov/data_files/publications/st517/stat517.shtml (accessed April 21, 2021).
39. Nicholson G, Gandra SR, Halbert RJ, Richhariya A, Nordyke RJ. Patient-level costs of major cardiovascular conditions : a review of the international literature. Clin. Econ. Outcomes Res. (2016) 6:495–506. doi: 10.2147/CEOR.S89331
40. O'Sullivan AK, Rubin J, Nyambose J, Kuznik A, Cohen DJ, Thompson D. Cost estimation of cardiovascular disease events in the US. Pharmacoeconomics. (2011) 29:693–704. doi: 10.2165/11584620-000000000-00000
41. Godwin KM, Wasserman J, Ostwald SK. Cost associated with stroke: outpatient rehabilitative services and medication. Top Stroke Rehabil. (2011) 18:676–84. doi: 10.1310/tsr18s01-676
42. Wang Y, Leifheit E, Normand SLT, Krumholz HM. Association between subsequent hospitalizations and recurrent acute myocardial infarction within 1 year after acute myocardial infarction. J Am Heart Assoc. (2020) 9:907. doi: 10.1161/JAHA.119.014907
43. Dhamoon MS, Sciacca RR, Rundek T, Sacco RL, Elkind MSV. Recurrent stroke and cardiac risks after first ischemic stroke. The Northern Manhattan Study. Neurology. (2006) 66:1–21. doi: 10.1212/01.wnl.0000201253.93811.f6
44. Yang W, Dall TM, Beronjia K, Lin J, Semilla AP, Chakrabarti R, et al. Economic costs of diabetes in the U.S. in 2017. Diabetes Care. (2018) 41:917–28. doi: 10.2337/dci18-0007
45. Larkindale J, Yang W, Hogan PF, Simon CJ, Zhang Y, Jain A, et al. Cost of illness for neuromuscular diseases in the United States. Muscle Nerve. (2014) 49:431–8. doi: 10.1002/mus.23942
46. Lassman D, Sisko AM, Catlin A, Barron MC, Benson J, Cuckler GA, et al. Health spending by state 1991-2014: Measuring per capita spending by payers and programs. Health Aff. (2017) 36:1318–27. doi: 10.1377/hlthaff.2017.0416
47. Gordois AL, Toth PP, Quek RG, Proudfoot EM, Paoli CJ, Gandra SR. Productivity losses associated with cardiovascular disease: a systematic review. Expert Rev Pharmacoecon Outcomes Res. (2016) 16:759–69. doi: 10.1080/14737167.2016.1259571
48. Zhao Z, Winget M. Economic burden of illness of acute coronary syndromes: medical and productivity costs. BMC Health Serv Res. (2011) 11:1–9. doi: 10.1186/1472-6963-11-35
49. Gallup-Sharecare. (2017). The Cost of Diabetes in the U.S.: Economic and Well-Being Impact. In Well-Being Index: State of American Well-being. Available online at: https://wellbeingindex.sharecare.com/reports/
50. Neumann PJ, Ganiats TG, Russell LB, Sanders GD, Siegel JE. Cost-Effectiveness in Health and Medicine. Oxford: Oxford University Press (2017), 496.
51. Loeppke R, Edington DW, Bég S. Impact of the prevention plan on employee health risk reduction. Popul Health Manag. (2010) 13:275–84. doi: 10.1089/pop.2010.0027
52. Vargas-Martínez AM, Romero-Saldaña M, De Diego-Cordero R. Economic evaluation of workplace health promotion interventions focused on Lifestyle: systematic review and meta-analysis. J Adv Nurs. (2021) 77:3657–91. doi: 10.1111/jan.14857
53. Baicker K, Cutler D, Song Z. Workplace wellness programs can generate savings. Health Aff. (2010) 29:1–8. doi: 10.1377/hlthaff.2009.0626
54. Basu S, Jacobs LM, Epel E, Schillinger D, Schmidt L. Cost-effectiveness of a workplace ban on sugar-sweetened beverage sales: a microsimulation model. Health Aff. (2020) 39:1140–8. doi: 10.1377/hlthaff.2019.01483
55. Palmer AS, Yoos JL. Health promotion in volunteer firefighters: assessing knowledge of risk for developing cardiovascular disease. Workplace Health Saf. (2019) 67:579–83. doi: 10.1177/2165079919853822
56. Gray BJ, Bracken RM, Thomas M, Williams SP, Williams M, Rice S, et al. “Prosiect Sir Gâr”: workplace-based cardiovascular disease and diabetes risk assessments. Occup Med. (2014) 64:549–56. doi: 10.1093/occmed/kqu103
57. Hwang WJ, Kim JA. Developing a health-promotion program based on the action research paradigm to reduce cardiovascular disease risk factors among blue collar workers. Int J Environ Res Public Health. (2019) 16:24. doi: 10.3390/ijerph16244958
58. Muto T, Yamauchi K. Evaluation of a multicomponent workplace health promotion program conducted in Japan for improving employees' cardiovascular disease risk factors. Prev Med. (2001) 33:571–7. doi: 10.1006/pmed.2001.0923
59. Allen JC, Lewis JB, Tagliaferro AR. Cost-effectiveness of health risk reduction after lifestyle education in the small workplace. Prev Chronic Dis. (2012) 9:3–10. doi: 10.5888/pcd9.110169
60. Patterson PD, Smith KJ, Hostler D. Cost-effectiveness of workplace wellness to prevent cardiovascular events among U. S firefighters. BMC Cardiovasc Disord. (2016) 16:1–7. doi: 10.1186/s12872-016-0414-0
61. R Lurati A. Occupational risk assessment and genetic testing in the workplace. Occup Med Health Aff. (2014) 2:2–4. doi: 10.4172/2329-6879.1000146
62. DeBord G, Schulte P, Butler M, McCanlies E, Reutman S, Ruder A. Genetics in the Workplace Implications for Occupational Safety Health. National Institute for Occupational Safety Health. (2010). Available online at: https://www.cdc.gov/niosh/docs/2010-101/pdfs/2010-101.pdf (accessed October 10, 2021).
63. Schill AL, Chosewood LC. The NIOSH total worker healthTM program: an overview. J Occup Environ Med. (2013) 55:10–3. doi: 10.1097/JOM.0000000000000037
64. Chirico F, Sacco A, Ferrari G. “Total Worker Health” strategy to tackle the COVID-19 pandemic and future challenges in the workplace. J Health Soc Sci. (2021) 6:452–7. doi: 10.19204/2021/ttlw1
65. Di Prinzio RR, Cicchetti A, Marazza M, Magnavita N, Rossi P, Chirico F, et al. Return-on-investment of workplace health promotion programs: new total worker health® strategies in the framework of the “one health” approach. J Health Soc Sci. (2022) 7:355–62. doi: 10.19204/2022/RTRN1
66. Virani SS, Alonso A, Aparicio HJ, Benjamin EJ, Bittencourt MS, Callaway CW, et al. Heart disease and stroke statistics-2021 update a report from the American heart association. Circulation. (2021), 254–743.
67. Wadhera RK, Shen C, Gondi S, Chen S, Kazi DS, Yeh RW. Cardiovascular deaths during the COVID-19 pandemic in the United States. J Am Coll Cardiol. (2021) 77:159–69. doi: 10.1016/j.jacc.2020.10.055
68. Pega F, Náfrádi B, Momen NC, Ujita Y, Streicher KN, Prüss-Üstün AM, et al. Global, regional, and national burdens of ischemic heart disease and stroke attributable to exposure to long working hours for 194 countries, 2000–2016: a systematic analysis from the who/ilo joint estimates of the work-related burden of disease and injur. Environ Int. (2021) 154:106595. doi: 10.1016/j.envint.2021.106595
69. Loh E, Sutton M. Ventricular dysfunction and the risk of stroke after myocardial infarction. N Engl J Med. (1997) 336:251–7. doi: 10.1056/NEJM199701233360403
70. Merkler AE, Diaz I, Wu X, Murthy SB, Gialdini G, Navi BB, et al. Duration of heightened ischemic stroke risk after acute myocardial infarction. J Am Heart Assoc. (2018) 7:1–6. doi: 10.1161/JAHA.118.010782
71. Wang G, Zhang Z, Ayala C, Dunet DO, George MG. Costs of hospitalization for stroke patients aged 18-64 years in the United States. J Stroke Cereb. (2015) 23:861–8. doi: 10.1016/j.jstrokecerebrovasdis.2013.07.017
72. Kern DM, Mellström C, Hunt PR, Tunceli O, Wu B, Westergaard M, et al. Long-term cardiovascular risk and costs for myocardial infarction survivors in a US commercially insured population. Curr Med Res Opin. (2016) 32:703–11. doi: 10.1185/03007995.2015.1136607
73. The CDC Foundation. Worker Illness and Injury Costs U.S. Employers $225.8 Billion Annually CDC Foundation. (2016). Available online at: https://www.cdcfoundation.org/pr/2015/worker-illness-and-injury-costs-us-employers-225-billion-annually (accessed April 30, 2016).
74. Hansen KE, Hildebrand JP, Ferguson EE, Stein JH. Outcomes in 45 patients with statin-associated myopathy. Arch Intern Med. (2005) 165:2671–6. doi: 10.1001/archinte.165.22.2671
75. Vinci P, Panizon E, Tosoni LM, Cerrato C, Pellicori F, Mearelli F, et al. Statin-associated myopathy : emphasis on mechanisms and targeted therapy. Int J Mol Sci. (2021) 22:11687. doi: 10.3390/ijms222111687
76. Abd TT, Jacobson TA. Statin-induced myopathy: a review and update. Expert Opin Drug Saf. (2011) 10:373–87. doi: 10.1517/14740338.2011.540568
77. Ballantyne CM, Corsini A, Davidson MH, Holdaas H, Jacobson TA, Leitersdorf E, et al. Risk for myopathy with statin therapy in high-risk patients. Arch Intern Med. (2003) 163:553–64. doi: 10.1001/archinte.163.5.553
78. Lau LH, Lew J, Borschmann K, Thijs V, Ekinci EI. Prevalence of diabetes and its effects on stroke outcomes: a meta-analysis and literature review. J Diabetes Investig. (2019) 10:780–92. doi: 10.1111/jdi.12932
79. Lei C, Wu B, Liu M, Chen Y. Association between hemoglobin A1C levels and clinical outcome in ischemic stroke patients with or without diabetes. J Clin Neurosci. (2015) 22:498–503. doi: 10.1016/j.jocn.2014.08.030
80. Mattke S, Kapinos K, Caloyeras JP, Taylor EA, Batorsky B, Liu H, et al. Workplace wellness programs: services offered, participation, and incentives. Rand Health Q. (2015) 5:7.
81. Stroke Facts,. cdc.gov. (2021). Available online at: https://www.cdc.gov/stroke/facts.htm (accessed August 27, 2021).
82. Aldana S. How to Do Biometric Screening in 2022: The Complete Guide. WellSteps. (2022). Available online at: https://www.wellsteps.com/blog/2020/01/02/how-to-do-biometric-screening (accessed May 8, 2022).
83. Simvastatin Prices Coupons Patient Assistance Programs—Drugs.com. (2021). Available online at: https://www.drugs.com/price-guide/simvastatin (accessed May 27, 2022).
84. Bureau of Labor Statistics U.S. Department of Labor. Employee Tenure in 2020. Vol. USDL-20-17. 2020. p. 2–4. Available online at: https://movie.douban.com/subject/27160705 (accessed January 10, 2020).
85. US Bureau of Labor Statistics. Employed persons by detailed industry and age in the Current Population Survey. (2021). Available online at: https://www.bls.gov/cps/cpsaat18b.htm (accessed January 25, 2023).
Keywords: cost-effectiveness, polygenic risk score (PRS), cardiovasccular risk factors, workplace setting, prevention
Citation: Mujwara D, Kintzle J, Di Domenico P, Busby GB and Bottà G (2023) Cost-effectiveness analysis of implementing polygenic risk score in a workplace cardiovascular disease prevention program. Front. Public Health 11:1139496. doi: 10.3389/fpubh.2023.1139496
Received: 07 January 2023; Accepted: 15 June 2023;
Published: 11 July 2023.
Edited by:
Maya S. Safarova, University of Kansas Medical Center, United StatesReviewed by:
Aleksandra Klisic, Primary Health Care Center Podgorica, MontenegroFrancesco Chirico, Catholic University of the Sacred Heart, Rome, Italy
Copyright © 2023 Mujwara, Kintzle, Di Domenico, Busby and Bottà. This is an open-access article distributed under the terms of the Creative Commons Attribution License (CC BY). The use, distribution or reproduction in other forums is permitted, provided the original author(s) and the copyright owner(s) are credited and that the original publication in this journal is cited, in accordance with accepted academic practice. No use, distribution or reproduction is permitted which does not comply with these terms.
*Correspondence: Giordano Bottà, Z2lvcmRhbm9AYWxsZWxpY2EuY29t